

Submitted:
08 September 2026
Posted:
09 September 2026
You are already at the latest version
Abstract
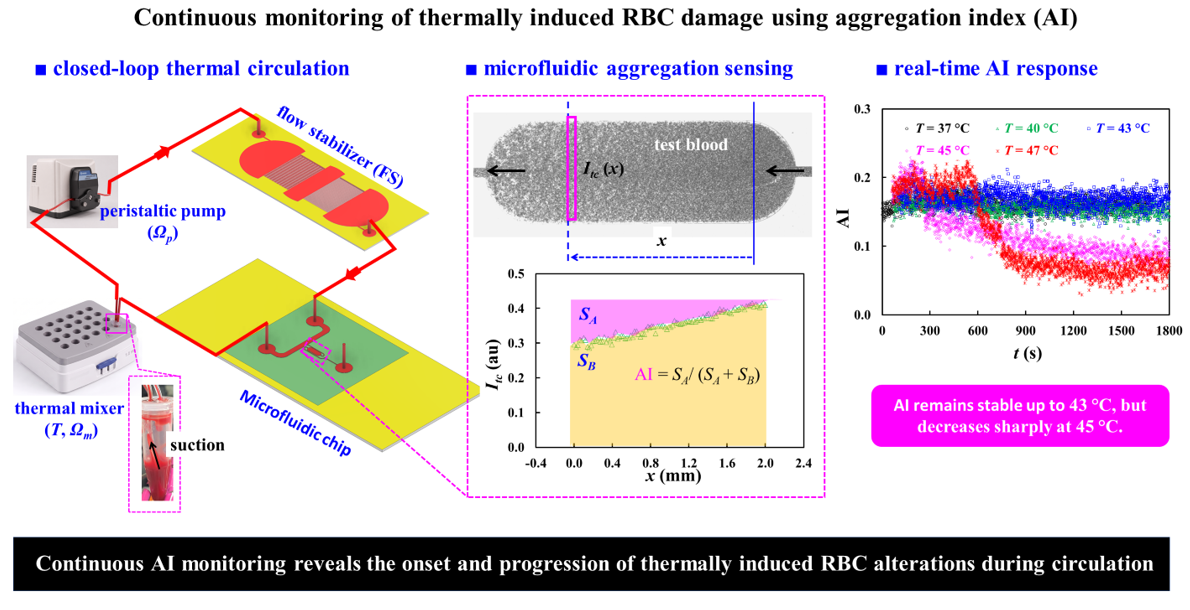
Red blood cell (RBC) aggregation is a sensitive indicator of hemorheological alterations, but conventional methods generally rely on intermittent or end-point measurements. Here, we present a flow-stabilized closed-loop microfluidic platform for continuous measurement of the RBC aggregation index (AI) during controlled circulation and thermal exposure. The system integrates a peristaltic pump, hydraulic flow stabilizer (FS), microfluidic aggregation sensor, and thermal mixer to suppress flow pulsation and RBC sedimentation. The FS increases the characteristic flow-response time by approximately 17.6-fold, markedly attenuating pump-induced fluctuations. Under stabilized conditions, flow rates in the main channel and test chamber remain highly linear with the imposed flow rate, while stable AI measurements are maintained for at least 30 min. The platform also resolves dextran-dependent changes in RBC aggregation during continuous circulation. During thermal exposure from 25 to 47 °C, main-channel image intensity (Imc) and AI remain nearly constant up to 43 °C, whereas exposure at ≥ 45 °C causes a progressive increase in Imc and a marked decrease in AI. These results demonstrate continuous detection of progressive RBC alterations without interrupting circulation and provide a versatile framework for investigating dynamic RBC damage over extended periods under controlled and reproducible in vitro conditions.
Keywords:
closed-loop fluidic circuit
; RBC aggregation
; flow stabilizer
; microfluidic chip
; thermally induced RBC alterations
; flow stabilization
; hemorheology
1. Introduction
Red blood cells (RBCs) are highly deformable cells that play essential roles in oxygen delivery to peripheral tissues and carbon dioxide transport from tissues to the lungs[1]. Efficient gas transport requires RBCs to circulate smoothly through the microvasculature, where they frequently encounter vessels comparable to or smaller than their resting diameter. Consequently, the hemorheological properties of RBCs are critical for maintaining normal microcirculatory blood flow. Blood rheology is mainly governed by hematocrit, plasma viscosity, RBC deformability, and RBC aggregation. At low shear rates, typically below approximately 100 s⁻¹, RBC aggregation becomes increasingly significant, thereby increasing apparent blood viscosity. As the shear rate increases, RBC aggregates progressively disperse, resulting in a decrease in blood viscosity and the characteristic shear-thinning behavior of blood[2,3,4]. RBC deformability is also essential for microcirculatory flow because individual RBCs must undergo substantial deformation to pass through narrow microvessels[2,5]. Therefore, alterations in RBC aggregation or deformability can modify flow resistance and impair microvascular perfusion[6]. These hemorheological properties are sensitive to various physical and biochemical stresses. Among these stressors, thermal exposure is particularly relevant because its effects on RBCs depend strongly on both temperature and exposure duration. As temperature or exposure time increases, thermal alterations in RBCs become progressively more pronounced and may eventually result in membrane disruption and hemolysis[7,8,9]. Importantly, heat-induced changes in RBC mechanical and rheological properties can develop before extensive hemolysis becomes evident[10,11,12]. Thus, hemolysis alone may not adequately reflect the early stage of thermal injury. Therefore, monitoring RBC hemorheological properties during thermal exposure may provide additional information on the onset and progression of thermal alterations before irreversible cell damage occurs.
Conventional assessment of thermally induced RBC alterations mainly relies on techniques that measure individual mechanical or hemorheological properties. For example, membrane elasticity is evaluated using parallel-plate flow systems[10], RBC deformability is measured by filtration-based methods[11], and aggregation is assessed using light reflectometry or viscometry[12,13]. More severe thermal injury is typically evaluated by measuring hemoglobin release or hemolysis[7,8]. These previous studies show that higher temperatures and longer exposure times progressively alter RBC membrane mechanics, deformability, aggregation behavior, and eventually membrane integrity. However, many conventional approaches assess RBC properties after predefined thermal treatment or at selected experimental conditions[8,12,14,15,16]. Consequently, they mainly provide discrete information and are less suitable for continuously tracking the progressive hemorheological changes that occur in the same RBC population during continuous heat exposure.
Recent microfluidic techniques offer improved control of the flow environment and enable sensitive assessment of RBC deformability, aggregation, and blood viscosity under dynamic conditions[17,18,19,20,21,22]. Indeed, microfluidic capillary networks have been shown to detect progressive changes in RBC deformability more sensitively than conventional ektacytometry, while recent microfluidic rheometry has successfully detected hemorheological alterations in thermally exposed RBCs[23,24]. Shin et al. developed a pressure-driven microfluidic system that simultaneously measured shear-dependent RBC aggregation and blood viscosity and demonstrated its ability to characterize heated blood[3]. Zheng et al. subsequently used a microfluidic constriction with electrical detection to distinguish heated RBCs from untreated cells based on changes in deformability[25]. The combined effects of temperature and fluid flow have also been investigated under dynamic conditions. Foo et al. showed that RBC deformability changed while cells were heated from 37 to 42 °C under fluid flow[26], while Rodríguez-Villarreal et al. demonstrated that increasing temperature from 23 to 50 °C markedly altered the cell-free area of RBC suspensions flowing through a microfluidic channel [27]. More recently, microfluidic rheometry has enabled simultaneous assessment of RBC aggregation and blood viscosity in thermally treated samples. These studies detected marked changes in aggregation, viscosity, and sedimentation following exposure to elevated temperatures, with the responses depending on both temperature and exposure duration[23,24]. Together, these findings demonstrate that microfluidic platforms provide sensitive functional measurements of thermally induced alterations in RBCs.
Overall, previous studies show that microfluidic measurements of RBC deformability, aggregation, and blood viscosity can sensitively detect thermal stress–induced changes. However, most studies employ a sequential exposure–analysis paradigm, in which RBCs are first subjected to a predefined thermal condition and subsequently evaluated in a separate measurement step. Such post-treatment measurements provide only static snapshots and cannot capture the onset, rate, or progression of thermal alterations. In addition, separate sampling introduces variability and prevents tracking of the same RBC population over time. As a result, the dynamic evolution from early functional change to severe thermal injury remains poorly resolved. Thus, there is a need for a platform that can continuously monitor hemorheological changes in the same RBCs under ongoing thermal stress in circulating conditions.
To overcome these limitations, the present study introduces a microfluidic platform that enables continuous and time-resolved monitoring of thermally induced changes in RBC aggregation during closed-loop circulation. The system integrates a peristaltic pump, thermal mixer, a fluidic stabilizer (FS), and a microfluidic device into a single closed circulation loop. The RBC suspension continuously circulates through the system while being exposed to a controlled temperature, allowing thermal exposure and hemorheological measurement to be performed simultaneously. The thermal mixer provides continuous thermal exposure and suppresses RBC sedimentation, whereas the microfluidic device creates suitable flow conditions for optical quantification of RBC aggregation. Because the same RBC population repeatedly travels through both the heating and sensing regions, temporal changes in the aggregation index (AI) can be tracked without repeated sampling or interruption of circulation. This integrated approach enables direct observation of when aggregation behavior begins to change, how rapidly the change develops, and how it progresses with increasing thermal exposure. Thus, the proposed system provides a dynamic assessment of temperature-dependent and time-dependent RBC alterations rather than a single post-treatment measurement.
The proposed platform provides several advantages over conventional thermal-damage assays and existing microfluidic methods. First, it enables continuous, time-resolved tracking of RBC aggregation during ongoing circulation, overcoming the limitation of conventional assays that typically provide only discrete measurements[28]. Second, the same RBC population is repeatedly monitored throughout the experiment, minimizing variability associated with repeated sampling, transfer, and handling. Third, aggregation is quantified without interrupting blood flow, thereby preserving the shear-dependent environment that directly governs RBC–RBC interactions[2,28]. Moreover, thermal exposure, flow stabilization, sedimentation suppression, closed-loop circulation, and microfluidic sensing are integrated within a single platform, allowing hemorheological responses to be evaluated under well-controlled dynamic conditions. Most importantly, this integrated approach enables direct observation of the onset and progression of functional RBC alterations during thermal exposure, providing information that cannot be readily obtained from conventional post-treatment measurements[29,30].
2. Materials and Methods
2.1. Microfluidic Chip Fabrication and Multiscale Fluidic System
As shown in Figure 1, a multiscale fluidic system was developed for continuous, real-time monitoring of thermally induced RBC damage based on changes in RBC aggregation during closed-loop circulation.
Figure 1A showed a schematic illustration of the multiscale fluidic system consisting of a microfluidic chip, a fluidic stabilizer (FS), a peristaltic pump, a thermal mixer, and microscopic imaging system. To assess RBC aggregation under continuous blood flow, our previously developed microfluidic chip[24,31] was modified and integrated into a closed-loop circulation system. As shown in Figure 1A-i, the microfluidic device consisted of three ports (a, b, and c), a main channel (mc; width = 1 mm, length = 14.48 mm), and a bifurcation channel (bc). The bc consisted of a front narrow channel (width = 0.1 mm, length = 4.93 mm), a test chamber (tc; width = 1 mm, length = 3 mm), and a rear narrow channel (width = 0.1 mm, length = 8.85 mm) connected in series. To regulate backflow generated in a peristaltic pump, as shown in Figure 1A-ii, the FS consisted of an inlet, two semicircular chambers (radius = 10 mm), upstream and downstream pillar channels (width = 0.05 mm, length = 10 mm, and N = 100), and a rectangular connector (width = 20 mm, length = 6 mm), and an outlet. Channel depth of microfluidic chip and FS was fixed at h = 0.05 mm.
The microfluidic device was prepared using a PDMS-based soft-lithography process. A silicon wafer containing the channel structures was first fabricated by photolithographic patterning followed by deep reactive ion etching. Sylgard 184 PDMS precursor and curing agent (Dow Corning, Midland, MI, USA) were combined at a mass ratio of 10:1 and thoroughly mixed. The mixture was placed under vacuum for 1 h to remove trapped air bubbles and then poured onto the patterned silicon mold. After thermal curing at 65 °C for 2 h, the cured PDMS layer was carefully separated from the mold and cut to the desired size. Three ports (2 mm diameter) were subsequently created using a biopsy punch. The patterned PDMS layer and glass substrate were treated with oxygen plasma and then immediately bonded together. The bonded device was then heated at 120 °C for 10 min to reinforce the PDMS–glass interface. The fluidic stabilizer (FS) was fabricated following the same procedure. Two 2 mm-diameter openings were formed at the inlet and outlet of the FS to allow connection with the circulation tubing.
As illustrated in Figure 1A-iii, the microfluidic device was positioned on the stage of an inverted microscope (IX81, Olympus, Tokyo, Japan) fitted with a 4× objective lens (NA = 0.1). Blood-flow images were recorded with a high-speed camera (FASTCAM MINI, Photron, Tokyo, Japan) at a frame rate of 5000 frames per second (fps). Image recording was initiated periodically at one second interval using an external trigger signal.
As shown in Figure 1A-iv, the peristaltic pump (JP-100, Jenie Well, Seoul, Republic of Korea) was operated at a constant rotational speed of Ωp = 0.3 rpm to continuously circulate the blood sample through the closed-loop system. The microfluidic chip, FS, peristaltic pump, and thermal mixer were connected in series using four tubing segments: tb1 (i.d. = 0.05 mm, L1 = 600 mm), tb2 (i.d. = 0.05 mm, L2 = 50 mm), tb3 (i.d. = 0.05 mm, L3 = 300 mm), and tb4 (i.d. = 0.025 mm, L4 = 200 mm). As shown in Figure 1A-v, a 1.5 mL microtube was placed in the heating block of a thermal mixer (ThermoMixer C, Eppendorf SE, Hamburg, Germany). The mixer was operated at a preset vibration speed (Ωm = 900 rpm) to minimize RBC sedimentation while maintaining a constant temperature (T) to apply a controlled thermal shock. The lower panel showed the effect of the mixer vibration on RBC sedimentation in the microtube. At the end of the experiment, clear RBC sedimentation was observed without vibration (Ωm = 0), whereas RBC sedimentation was effectively suppressed at Ωm = 900 rpm.
To reduce nonspecific protein adsorption, all blood-contacting surfaces, including the tubing, microfluidic chip, and FS, were treated with 0.2% bovine serum albumin (BSA) for 10 min[32]. The fluidic pathways were then rinsed with 1× PBS before blood infusion. All experiments were carried out at room temperature of 25 °C.
2.2. Quantification of Blood Velocity, Image Intensity, and RBC Aggregation Index
As illustrated in Figure 1B, local flow conditions and RBC aggregation within the microfluidic channels were evaluated using blood image-based analysis. Blood velocities in the main channel and test chamber were measured to calculate the corresponding local shear rates. In addition, temporal changes in image intensity were analyzed in both regions to monitor variations in blood flow and to determine the RBC aggregation index (AI) in the test chamber.
First, as illustrated in Figure 1B-i, blood flowed downstream through the main channel, while a portion of the blood flow branched into the bifurcation channel at the junction. The purple arrows indicated the direction of blood flow within the microfluidic networks. To determine the local shear-rate conditions in the main channel and test chamber, time-resolved micro-particle image velocimetry (PIV) was employed to obtain velocity fields in both channels[33]. Two regions-of-interest (ROIs), each with an area of 1.7 mm², were defined: one in the upstream straight section of the main channel and the other in a straight uniform section of the test chamber. Blood-flow images acquired at one second interval were analyzed using PIVlab software (Version 3.14, William Thielicke, Germany)[33]. Velocity fields were calculated using an interrogation window of 143 × 143 µm² with 50% overlap. Abnormal velocity vectors were corrected using local median and standard-deviation filtering. With the present optical imaging system[31], the recorded image intensity reflected the combined contribution of RBCs distributed throughout the channel depth. Thus, the resulting velocity vectors were then spatially averaged over each ROI to obtain the time-dependent mean velocities in the main channel and test chamber, denoted as Umc and Utc, respectively.
Second, to consider only RBCs in the blood flow, the initial background image was subtracted from each acquired image. The resulting background-corrected images were analyzed using MATLAB (version 2026b, MathWorks, Natick, MA, USA). To monitor variations in blood flow, as illustrated in Figure 1B-i, a specific ROI (1.7 mm²) was defined in the upstream section of the main channel. The mean image intensity within this ROI was calculated as Imc by spatially averaging all image intensities.
Third, RBC aggregation in the test chamber was induced by creating a substantial difference in hydraulic resistance between the bifurcation channel and the main channel. The hydraulic resistance of the bifurcation channel was approximately 18.76 times greater than that of the downstream section of the main channel (Rbc/Rmc = 18.76)[31], where Rbc and Rmc represented the hydraulic resistances of the bifurcation channel and the downstream main channel, respectively. At the prescribed inlet flow rate, RBCs remained fully disaggregated while traveling through the main channel because the local shear rate exceeded 1000 s⁻¹. Approximately 95% of the incoming flow continued downstream along the main channel, whereas the remaining 5% entered the bifurcation channel. Within the narrow sections of the bifurcation channel, the shear rate remained above 100 s⁻¹, thereby maintaining the RBCs in a disaggregated state. In contrast, the substantially reduced shear rate in the wider test chamber (<100 s⁻¹) provided a low shear-rate environment which promoted RBC aggregation, whereas RBC aggregates were progressively dispersed with increasing shear forces[2,34,35,36]. As shown in the upper panel of Figure 1B-ii, blood flowed from left to right through the test chamber, as indicated by the black arrow. RBC aggregation gradually increased along the chamber, causing the image intensity to decrease toward the downstream region. When the blood entered the rear narrow channel, the shear rate increased above 1000 s−1, causing the RBC aggregates to break apart. A small ROI (0.04 mm²) was selected within the straight portion of the test chamber and moved stepwise from right to left along the x axis. At each location, the pixel intensities within the ROI were spatially averaged to obtain Itc (x). The measured Itc (x) progressively decreased over a 2 mm distance, reflecting the gradual development of RBC aggregation within the test chamber. Following the conventional definition of the RBC aggregation index (AI)[37,38,39], two characteristic areas (SA, SB) were determined from the spatial variation in Itc. The RBC aggregation index was subsequently calculated as AI = SA/(SA + SB).
As a preliminary demonstration, blood conditions that favor RBC sedimentation were intentionally selected to evaluate whether the proposed closed-loop system could suppress sedimentation while maintaining consistent AI measurements. A relatively low hematocrit was used because RBC sedimentation generally increases as hematocrit decreases, whereas a high dextran concentration was selected to enhance RBC aggregation and thereby promote sedimentation[40,41,42,43]. Test blood with a hematocrit of 30% was prepared by suspending normal RBCs in a 4% dextran solution and then loaded into a microtube. During the experiment, the peristaltic pump and thermal mixer were operated at Ωp = 0.3 rpm and Ωm = 900 rpm, respectively, while the mixer temperature was kept constant at 25 °C. As shown in Figure 1C-i, microscopic images were acquired at six representative time points (t = 150, 300, 600, 900, 1200, and 1500 s). The black arrows indicated the direction of blood flow through the test chamber. From these images, the time-dependent mean velocities in the main channel (Umc) and test chamber (Utc) were determined over the 1800 s circulation period. As presented in Figure 1C-ii, Umc remained relatively stable, with only limited backflow owing to the damping effect of the fluidic stabilizer (FS). Figure 1C-iii presented the corresponding temporal variations in Imc and AI. The translational motion of the thermal mixer effectively prevented RBC sedimentation during circulation, enabling the AI to remain nearly constant over the 1800 s measurement period in the absence of thermal exposure. These preliminary results demonstrated that the proposed platform could provide stable and continuous monitoring of blood circulated in a closed-loop fluidic system.
2.3. Preparation of Test Blood Sample
This study was performed in accordance with the Declaration of Helsinki and was approved by the Ethics Committee of Chosun University (approval no. 2-1041055-AB-N-01-2026-23). Packed RBCs were supplied by the Gwangju–Chonnam Blood Bank (Gwangju, Republic of Korea) and stored under refrigerated conditions until use. Before each experiment, the RBCs were washed with 1× PBS according to the established preparation protocol[44]. After centrifugation, the buffy coat and supernatant were removed, and the remaining washed RBCs were collected for preparation of the test blood samples.
First, to examine the influence of hematocrit on AI measurements, test blood samples with hematocrit levels of 30% and 50% were prepared by suspending normal RBCs in a 4% dextran solution. The dextran solution was prepared by dissolving dextran powder (Leuconostoc spp., molecular weight 450–650 kDa; Sigma-Aldrich, St. Louis, MO, USA) in 1× PBS. Second, to investigate the effect of the suspending medium on AI measurements, test blood with a hematocrit of 30% was prepared using dextran solutions with concentrations ranging from 1% to 4% (Cdex = 1 ~ 4%). Finally, to examine the effect of temperature on AI measurements, test blood (Hct = 30%) was prepared in 4% dextran solution and exposed to 25, 37, 40, 43, 45, and 47 °C using the thermal mixer.
3. Results and Discussion
3.1. Quantitative Evaluation of Flow Regulation Using a Flow Stabilizer
In this study, a flow stabilizer (FS) was introduced to attenuate pulsatile flow fluctuations generated by the pulsatile pump and thereby provide a more stable flow condition in the microfluidic system. As shown in Figure 2A, to quantitatively characterize the flow-regulating performance of the FS, the pulsatile pump was replaced with a syringe pump (neMESYS, CETONI GmbH, Korbussen, Germany), which enabled precise control of flow rates. By generating prescribed steady and sinusoidally varying flow rates, the dynamic response of the fluidic system could be systematically examined with and without the FS. The effect of the FS was quantitatively evaluated based on the transient flow response, characterized by the time constant[45], and the attenuation of pulsatile flow fluctuations[46,47,48,49,50,51]. In addition, the flow rates and corresponding shear rates in the microfluidic channels were estimated from the velocity measurements obtained by the micro-PIV technique[52].
As shown in the left panel of Figure 2A, the experimental setup consisted of a syringe pump, a fluidic stabilizer (FS), and a microfluidic chip, which were interconnected using flexible tubing. To visualize the fluid motion for micro-PIV analysis[53], a tracer suspension was prepared by adding normal RBCs (30 μL) to 30% glycerin solution (1000 μL)[23,54]. The added RBCs served as tracer particles for determining the velocity fields in the microfluidic channels. The test fluid was supplied using a syringe pump to precisely control the imposed flow rate. To determine the time constant (λ) from transient flow response, the flow rate was first maintained at a constant value (Q0) and then abruptly reduced to zero. Additionally, to assess the attenuation of periodic flow fluctuations by the FS, a sinusoidally varying flow rate was imposed as Qsp = Q0 + Q1sin(2πt/Tp), where Q0, Q1, and Tp represented the mean flow rate, oscillation amplitude, and pulsation period, respectively. As shown in the right panel of Figure 2A, an equivalent fluidic circuit was developed to calculate the flow rates and shear rates in the microfluidic channels. The circuit included hydraulic resistances corresponding to the tubing (Rtb1 ~ Rtb4), flow stabilizer (RFS), main channel (Rmc), and bifurcation channel (Rbc), together with the compliances of the FS (CFS) and flexible tubing (Ct). The syringe-pump flow rate was represented by Qsp, while the symbol ‘▼’ indicated zero-pressure. Pa and Pb represented the pressures at the FS and at the bifurcation junction, respectively. Qmc and Qbc denoted the flow rates through the upstream main channel and the bifurcation channel, respectively. Applying mass conservation law at two nodes (a, b)[55,56,57], the governing equations could be written as,
Rearranging Eqn. (2) gave the relationship between Pa and Pb as , where the was defined as
Defining the left-hand side of Eqn (2) as Qmc, flow rat in the main channel could be written as,
Using Eqn (3) and Eqn (4), the pressure Pa could be expressed as
Substituting Eqn (4) and Eqn (5) into Eqn (1), flow rate in the main channel (Qmc) could be described by the following first-order linear differential equation,
The corresponding time constant (λ) was given by
According to Eqn (7), the time constant (λ) determined the dynamic response of Qmc and was governed by the hydraulic resistances and compliance elements in the fluidic network.
To evaluate the effects of the plateau flow rate (Q0) and the fluidic stabilizer (FS) on the transient flow response, the time-dependent Umc was measured at Q0 = 1 ~ 5 mL/h. As shown in Figure 2, the left and middle panels presented the temporal variations in Umc after the infusion flow rate was abruptly reduced from Q0 to zero, without and with the FS, respectively. Incorporation of the FS produced a markedly slower decay in Umc, indicating a substantial increase in the characteristic response time of the fluidic system. The transient decay in Umc was therefore fitted using a first-order exponential model to determine the time constant (λ). The right panel summarized λ as a function of Q0 under both conditions. Each measurement was repeated three times (n = 3). Without the FS, λ remained low and nearly constant, ranging from 1.09 s to 1.21 s over Q0 = 1 ~ 5 mL/h. In contrast, with the FS, λ increased substantially and ranged from 17.98 s to 21.90 s over Q0 = 1 ~ 5 mL/h. Without the FS, the λ changed slightly with respect to Q0. With the FS, the λ was varied with respect to Q0, showing the highest value at Q0 = 3 mL/h and the lowest value at Q0 = 5 mL/h. Overall, the FS increased the time constant by about 17.6 times, indicating that it strongly affected the transient flow response. This result was consistent with the fluidic resistance–compliance (RC) model, in which the characteristic time constant was determined by the hydraulic resistance and compliance of the fluidic system (λ ∼RC). Therefore, an increase in fluidic compliance could substantially prolong the transient response[31,58,59,60].
To evaluate the effect of the FS on pulsatile-flow attenuation, the time-dependent Umc was measured at different pulsation periods. The syringe-pump flow rate was prescribed as Qsp = 3 + 2 sin () mL/h, while the pulsation period (Tp) was varied from 10 s to 100 s. As shown in Figure 2C, the FS reduced the amplitude of the pulsatile flow, with a greater reduction observed at shorter Tp. This behavior was consistent with the low-pass characteristics of a fluidic resistance–compliance circuit, in which higher-frequency flow fluctuations were more strongly attenuated[61,62]. For comparison with the experimental results, Eqn (6) was solved under periodic steady-state conditions, yielding the analytical expression for Qmc was given as
According to Eq. (8), the amplitude of Qmc depended on Tp and increased with increasing Tp. This trend agreed with the frequency response of the first-order fluidic low-pass filter, where the output amplitude decreased as the input frequency increased[63,64].
Because the FS sufficiently attenuated the pulsatile flow, the test fluid was subsequently supplied at a constant flow rate (Q0). Since RBC aggregation was strongly dependent on shear rate, the flow rates and corresponding shear rates in the microfluidic channels were evaluated as a function of Q0. As shown in the left panel of Figure 2D, both Qmc and Qtc increased linearly with respect to Q0. Linear regression yielded Qmc = 1.0019 Q0 (R2 = 1.000) and Qtc = 0.0558 Q0 (R2 = 0.9986), confirming a nearly linear relationship between the imposed flow rate and the flow rates in each channel. The pressure Pb at junction b, where the downstream of main channel connected to the bifurcation channel, could be expressed as
From this relationship, the hydraulic resistance ratio between the downstream of main channel and the bifurcation channel was derived as
To experimentally evaluate this resistance ratio, (Qmc − Qtc)/Qtc was plotted against Q0, as shown in the middle panel of Figure 2D. This ratio decreased slightly with increasing Q0, with an average value of 17.75. The corresponding resistance ratio calculated from the analytical model was estimated as Rbc/Rmc = 18.76. The difference between the experimental and analytical values was approximately 5.7%, suggesting a relatively small contribution from the tubing connections and other additional flow resistances. Based on time-dependent Qmc and Qtc, shear rates in the main channel and bifurcation were estimated using the analytical expression as . The right panel of Figure 2D showed the resulting shear rates as a function of Q0, with the red dashed line indicating the threshold shear rate of 100 s−1. The shear rate remained above 100 s−1 in the main channel and the narrow sections of the bifurcation channel. In contrast, the shear rate in the test chamber remained below 100 s−1 at Q0 < 3 mL/h. These results indicated that RBC aggregates were expected to be dispersed in the main channel and narrow bifurcation sections, whereas low-shear conditions favorable for RBC aggregation were selectively established in the test chamber at Q0 < 3 mL/h.
From the experimental investigation, the FS effectively stabilized the flow by attenuating pulsatile fluctuations and increasing the transient response time of the fluidic circuit. Under steady-flow conditions, the regulated flow produced predictable flow-rate distributions and established a low-shear region in the test chamber, providing suitable conditions for reliable RBC aggregation measurement.
3.2. Validation of the Flow Stabilizer for Suppressing Backflow and Maintaining Stable Flow
After the performance of the flow stabilizer (FS) was characterized using a syringe pump, its effectiveness was further evaluated under a closed-loop circulation condition driven by a peristaltic pump, as illustrated in Figure 1A. Because peristaltic pumping inherently generated periodic flow fluctuations and transient backflow[47,49,65,66], the FS was tested at different pump speeds (Ωp) to assess backflow suppression and flow stability. Test fluids (i.e., 30% glycerin solution, control blood: RBCs suspended in 1× PBS [Hct = 50%]) were selected in this study. With regard to the control blood, RBCs were suspended in 1× PBS to minimize RBC aggregation and thereby evaluate the hydrodynamic behavior of circulating blood independently of aggregation[67].
As shown in Figure 3A-i, the time-dependent velocities in the main channel (Umc) and test chamber (Utc) were measured for a 30% glycerin solution at Ωp = 0.1, 0.3, and 0.5 rpm without the FS. Both Umc and Utc exhibited clear periodic fluctuations accompanied by repeated backflow, and the oscillation period became shorter as Ωp increased. In contrast, when the FS was incorporated into the fluidic circuit as shown in Figure 3A-ii, backflow was effectively suppressed over the tested pump-speed range. The magnitude of the pulsatile velocity fluctuations was also markedly reduced. These results demonstrated that the FS effectively suppressed pump-induced backflow and attenuated pulsatile flow, thereby providing more stable fluid circulation.
After replacing the 30% glycerin solution with control blood, the effects of the FS on blood-flow stability were further evaluated. As shown in Figure 3B-i, without the FS, both Umc and Utc exhibited pronounced periodic fluctuations and repeated backflow at Ωp = 0.1, 0.3, and 0.5 rpm. These pulsatile blood-flow patterns were similar to those observed with the 30% glycerin solution. Such periodic fluctuations and backflow were characteristic of fluid delivery driven by peristaltic pumps, which had been reported in microfluidic blood-circulation systems[47,65,68]. In contrast, as shown in Figure 3B-ii, incorporation of the FS markedly suppressed backflow and reduced the magnitude of velocity fluctuations over the entire range of pump speeds. These results confirm that the FS could stabilize peristaltic-pump-driven flow for glycerin solution and blood effectively[47]. These results confirm that the FS can effectively stabilize peristaltic-pump-driven flow for both Newtonian test fluids and RBC suspensions.
To quantitatively evaluate the effectiveness of the FS in attenuating pulsatile flow, the mean velocities and coefficients of variation (COVs) were calculated from the time-dependent Umc and Utc data. For the 30% glycerin solution, Figure 3C-i shows the mean velocities (<Umc> and <Utc>) and corresponding COVs at Ωp = 0.1, 0.3, 0.5, and 1.0 rpm. Both mean velocities increased approximately linearly with respect to Ωp, with similar values obtained with and without the FS. In contrast, incorporation of the FS markedly reduced the COVs of both Umc and Utc. These results demonstrated that the FS effectively attenuated pulsatile flow fluctuations without substantially altering the mean flow velocity. For control blood, Figure 3C-ii summarized the mean velocities (<Umc> and <Utc>) and their corresponding COVs as a function of pump speed. The mean velocity of Umc (<Umc>) remained nearly unchanged by the installation of the FS, whereas <Utc> increased in the
presence of the FS. More importantly, the FS substantially reduced the COV of Umc at Ωp = 0.5 and 1.0 rpm, indicating effective attenuation of pulsatile blood flow at higher pump speeds. A reduction in the COV of Utc was also observed at Ωp = 1.0 rpm. In contrast, at the lowest pump speed (Ωp = 0.1 rpm), the FS increased the flow fluctuations of Umc. The reduced stabilization observed at Ωp = 0.1 rpm may be attributed to the relatively long pulsation period of the peristaltic pump. Because a compliance-based flow stabilizer behaved as a low-pass fluidic filter, slowly varying flow disturbances were less effectively attenuated than higher-frequency pulsations[47,65,69]. As the pump speed increased, the pulsation period became shorter, resulting in more effective attenuation by the FS. Overall, the FS provided effective stabilization of circulating blood at Ωp ≥ 0.3 rpm, with its attenuation performance becoming more pronounced at higher pump speeds.
With the FS incorporated into the closed-loop fluidic circuit, the shear-rate conditions required for RBC aggregation were evaluated as a function of pump speed (Ωp). As shown in Figure 3C-iii, the shear rates in the main channel and test chamber were plotted against Ωp for 30% glycerin solution and control blood. The horizontal line at = 100 s−1 indicated the approximate upper shear-rate limit for RBC aggregation[70,71,72,73]. RBC aggregation was favored at low shear rates, whereas aggregates were gradually dispersed as the shear rate approached or exceeded 100 s⁻¹. In the main channel, the shear rate remained sufficiently high over the tested pump-speed range, thereby maintaining RBCs in a disaggregated state. In contrast, the shear rate in the test chamber decreased below 100 s⁻¹ at Ωp ≤ 0.3 rpm, providing favorable hydrodynamic conditions for RBC aggregation. These results identified Ωp ≤ 0.3 rpm as the appropriate operating range for inducing RBC aggregation selectively in the test chamber while maintaining RBC disaggregation in the main channel.
From the experimental investigation, the FS suppressed backflow effectively, and it reduced pulsatile flow fluctuations for 30% glycerin solution and control blood, while maintaining the mean flow rate. The stabilizing effect became evident at Ωp ≥ 0.3 rpm, demonstrating that the FS could provide stable circulation under peristaltic pumping. At Ωp = 0.3 rpm, the shear rate was high enough to prevent RBC aggregation in the main channel but low enough to promote RBC aggregation in the test chamber.
3.3. Effect of RBC Sedimentation on AI and Its Suppression for Stable AI Measurement
RBC sedimentation during blood circulation could cause a gradual change in the hematocrit of blood entering the microfluidic chip[2,23,74]. This variation may alter the measured aggregation index (AI) and reduce the reliability of continuous AI monitoring[75,76]. In this section, RBC sedimentation in the microtube and connecting tubing was evaluated using the time-dependent Imc and AI. In addition, the vibration speed of the thermal mixer (Ωm) was varied to determine whether mechanical mixing could suppress RBC sedimentation and improve the stability of AI measurement[77,78].
As shown in Figure 4A, the effects of pump speed (Ωp) on RBC sedimentation and AI were evaluated by continuously monitoring Imc and AI. Because AI was strongly influenced by hematocrit[2,42], test blood was prepared at Hct = 30% and 50% by suspending normal RBCs in 4% dextran solution. To isolate the effect of pump speed, the experiments were conducted without mixer vibration (Ωm = 0). For Hct = 30%, as shown in Figure 4A-i, the pump speed (Ωp) was varied from 0.1 rpm to 1.0 rpm. The left panel showed the time-dependent variation of Imc. At the lowest pump speed (Ωp = 0.1 rpm), pronounced RBC sedimentation occurred in the microtube, and a clear RBC-free layer was observed at the end of the experiment. At Ωp = 0.3 and 0.5 rpm, Imc gradually increased over time, indicating a progressive change in the RBC concentration of blood entering the microfluidic chip. In contrast, Imc remained nearly constant at Ωp = 1.0 rpm, suggesting more stable blood delivery with reduced influence of RBC sedimentation. The middle panel showed time-dependent changes in AI at different pump speeds. Overall, AI decreased as Ωp increased. At Ωp = 0.1 rpm, AI showed large fluctuations over time, mainly due to severe RBC sedimentation and unstable blood delivery. At Ωp = 0.3 and 0.5 rpm, AI gradually decreased during circulation. In contrast, at Ωp = 1.0 rpm, AI remained relatively stable with much smaller temporal variations. As represented in the right panel, the corresponding AI value at each pump speed was summarized as AI = 0.198 ± 0.019 at Ωp = 0.1 rpm (n = 1586), AI = 0.126 ± 0.016 at Ωp = 0.3 rpm (n = 1798), AI = 0.097 ± 0.013 at Ωp = 0.5 rpm (n = 1807), and AI = 0.061 ± 0.009 at Ωp =1.0 rpm (n = 1800). These results indicated that low pump speed promoted RBC sedimentation and increased AI fluctuations, whereas higher pump speeds improved the stability of blood delivery and reduced the temporal variation of AI. In contrast, for Hct = 50%, Figure 4A-ii showed the effect of pump speed on Imc and AI. As shown in the left panel, Imc remained nearly constant over time at all tested pump speeds, indicating that RBC sedimentation had little influence on blood delivery at the higher hematocrit. The middle panel showed the corresponding time-dependent AI. Although AI was higher at lower pump speeds, it remained relatively stable over time for each Ωp condition. As shown in the right panel, AI was plotted against Ωp. The corresponding AI value at each pump speed was summarized as AI = 0.104 ± 0.008 at Ωp = 0.1 rpm (n = 1553), AI = 0.078 ± 0.007 at Ωp = 0.3 rpm (n = 1608), AI = 0.066 ± 0.006 at Ωp = 0.5 rpm (n = 1801), and AI = 0.052 ± 0.005 at Ωp =1.0 rpm (n = 1845). Compared with Hct = 30%, the Hct = 50% blood showed markedly smaller temporal fluctuations in both Imc and AI, particularly at low pump speeds. These results indicated that the higher hematocrit reduced the influence of RBC sedimentation during circulation, leading to more stable but lower AI values.
The results showed that AI increased markedly at lower hematocrit and lower pump speeds. However, severe RBC sedimentation also produced large temporal fluctuations. To overcome this limitation, the thermal mixer was operated at different vibration speeds (Ωm) to suppress RBC sedimentation and improve the stability of AI measurement. Herein, test blood (Hct = 30%) was prepared by suspending normal RBCs in 4% dextran solution. As shown in Figure 4B-i, the effect of thermal-mixer vibration on RBC sedimentation was evaluated at the lowest pump speed (Ωp = 0.1 rpm) by varying Ωm from 0 to 900 rpm. The left panel showed that Imc exhibited large temporal fluctuations at all vibration speeds. Similarly, the corresponding AI values in the middle panel fluctuated markedly and showed no consistent dependence on Ωm. As summarized in the right panel, the AI remained nearly unchanged with increasing vibration speed, whereas the COV tended to increase at higher Ωm. From the results, at Ωp = 0.1 rpm, mixer vibration alone was insufficient to suppress sedimentation-induced instability and did not improve the stability of AI measurement. As shown in Figure 4B-ii, at Ωp = 0.3 rpm, the effect of thermal-mixer vibration was further evaluated as a function of Ωm = 0, 600, and 900 rpm. In the left panel, Imc gradually increased without mixer vibration (Ωm = 0), consistent with progressive RBC sedimentation. The corresponding snapshot at the end of the experiment clearly showed an RBC-depleted layer in the microtube. In contrast, at Ωm = 600 and 900 rpm, Imc remained nearly constant over time, and the snapshot at Ωm = 600 rpm confirmed that RBC sedimentation was effectively suppressed. The middle panel showed the corresponding time-dependent AI. Without mixer vibration, AI gradually decreased during circulation, whereas it remained relatively stable at Ωm = 600 and 900 rpm. As summarized in the right panel, the mean AI showed little dependence on Ωm, while the COV progressively decreased as the vibration speed increased. These results demonstrated that thermal-mixer vibration effectively suppressed RBC sedimentation at Ωp = 0.3 rpm and substantially improved the temporal stability and reproducibility of AI measurement.
From the experimental investigation, RBC sedimentation strongly affected AI stability, particularly at low hematocrit and low pump speed, where large temporal fluctuations were observed. At Ωp = 0.3 rpm, thermal-mixer vibration at Ωm = 600 ~ 900 rpm effectively suppressed RBC sedimentation and maintained stable Imc and AI. In the following experiments, pump speed and mixer vibration were set to Ωp = 0.3 rpm and Ωm = 900 rpm, respectively. These results demonstrated that mixer vibration effectively minimized sedimentation-induced instability, thereby enabling reliable and consistent AI measurement during continuous blood circulation[23,76,77,79,80].
3.4. Continuous Measurement of RBC Aggregation at Different Dextran Concentrations in a Closed-Loop Fluidic Circuit
Under the optimized operating conditions (Ωm = 900 rpm, Ωp = 0.3 rpm), the closed-loop system was further tested for continuous measurement of different levels of RBC aggregation. To generate a range of aggregation levels, test blood (Hct = 30%) was prepared using dextran solutions with Cdex = 1 ~ 4%. The resulting AI values were then evaluated to determine whether the system could provide stable and clearly distinguishable measurements across different dextran concentrations.
As shown in Figure 5A, flow stability was evaluated by monitoring the time-dependent Umc and Utc at different dextran concentrations (Cdex = 1 ~ 4%). The left panel showed that fluctuations in Umc became progressively smaller as Cdex increased. The middle and right panels summarized the mean velocities (<Umc> and <Utc>) and their corresponding COVs. Although the mean velocities remained nearly constant over the tested dextran concentrations, the temporal fluctuations in both Umc and Utc were markedly reduced at higher Cdex, resulting in a gradual decrease in COV. Higher dextran concentrations increased fluid viscosity and consequently increased hydraulic resistance. In combination with the compliance of the FS, the increased resistance likely enhanced the damping of pump-induced flow fluctuations, resulting in more stable flow[47,49,65,81]. Overall, the results consistently demonstrated that increasing dextran concentration enhanced flow stability without substantially changing the mean flow velocity. As shown in Figure 5B-i, the time-dependent Imc was monitored at Cdex = 1 ~ 4%. Representative microscopic images of the main channel acquired at t = 1800 s were shown in the right panel. Although the absolute level of Imc varied with respect to Cdex, the Imc remained nearly constant throughout the 30 min measurement, indicating stable blood delivery over time. Figure 5B-ii showed the spatial distribution of Itc within the test chamber. Representative images acquired at t = 1800 s were presented in the left panel, with blood flowing from right to left. As Cdex increased, the image intensity decreased and the spatial variation of Itc along the flow direction became more pronounced. The corresponding Itc profiles in the right panel clearly demonstrated that higher dextran concentrations produced stronger intensity changes within the test chamber, consistent with enhanced RBC aggregation. Finally,
Figure 5B-iii summarized the time-dependent AI and its variation with respect to Cdex. For all dextran concentrations, AI remained stable over the 30 min circulation period. More importantly, the mean AI increased consistently with increasing Cdex, whereas the corresponding COV gradually decreased. These results demonstrated that the proposed closed-loop system could continuously distinguish different levels of RBC aggregation while maintaining stable and reproducible AI measurements over time.
From the experimental results, under the optimized operating conditions, the closed-loop system provided stable AI measurements for 30 min across Cdex = 1 ~ 4%. The mean AI increased consistently with respect to dextran concentration, demonstrating that the proposed method could clearly distinguish different levels of RBC aggregation, consistent with previous microfluidic studies showing dextran-dependent increases in AI[23,54,82]. Furthermore, the temporal stability of AI supports the feasibility of continuous and reproducible monitoring of RBC aggregation during blood circulation [31,83].
3.5. Continuous Detection of Thermally Induced RBC Damage Using AI
Because the proposed system enabled stable and continuous measurement of the RBC aggregation index (AI) for at least 30 min, it was further applied to evaluate thermally induced alterations in RBCs under continuous circulation. For controlled thermal exposure, the test blood was loaded into a microtube inserted into a thermal mixer, while the blood was continuously circulated through the closed-loop fluidic circuit and monitored using the microfluidic device. This configuration allowed thermal exposure and AI measurement to be performed simultaneously without repeated blood sampling or interruption of circulation. Accordingly, temporal changes in AI were monitored at different exposure temperatures to determine whether progressive thermal damage of RBCs could be detected in real time.
To demonstrate the capability of the proposed system for detecting thermally induced RBC alterations, test blood (Hct = 30%) was prepared by suspending normal RBCs in a 4% dextran solution. During continuous circulation, to maintain stable blood flow and minimize RBC sedimentation, the peristaltic pump and thermal mixer were operated at Ωp = 0.3 rpm and Ωm = 900 rpm, respectively. The circulating blood was exposed to controlled temperatures ranging from T = 25 to 47 °C for 30 min. This temperature range was selected to cover physiological and hyperthermic conditions while remaining below temperatures that may cause rapid hemolysis[7,8,9,28]. Changes in RBC aggregation were continuously monitored throughout the thermal exposure to evaluate their time- and temperature-dependent responses.
As shown in the upper panel of Figure 6, the temporal responses of Imc and AI were monitored for 30 min at T = 25, 37, 40, 43, 45, and 47 °C. At temperatures up to 43 °C, both Imc and AI remained nearly unchanged throughout the experiment, indicating that RBC aggregation behavior was maintained under these thermal conditions. In contrast, a clear temperature-dependent transition emerged at T ≥ 45 °C. Imc increased progressively with exposure time, whereas AI decreased markedly. These opposing trends indicated substantial heat-induced alterations in RBC aggregation and demonstrated that the proposed system can sensitively capture the onset and progression of thermal effects during continuous blood circulation. To visualize this transition more clearly, at T = 45 °C, the lower panel of Figure 6 presented representative blood-flow images obtained at t = 180, 300, 1200, and 1800 s, showing the progressive changes in blood-flow appearance accompanying the reduction in AI.
The temperature-dependent changes observed at T ≥ 45 °C are consistent with previous studies showing that elevated temperatures could substantially alter RBC membrane properties and cellular morphology[7,10]. In particular, thermal exposure above approximately 45 °C has been associated with accelerated hemolysis and pronounced morphological changes[7], while an irreversible increase in RBC membrane stiffness has been reported at approximately 46–50 °C[10]. These heat-induced alterations may modify RBC–RBC interactions and the optical characteristics of flowing blood, thereby contributing to the progressive increase in Imc and the concurrent decrease in AI observed in the present study. In addition, RBC deformability and aggregation are important determinants of blood rheology and microcirculatory flow. Deterioration of RBC mechanical properties could increase flow resistance and disturb normal cell transport through the microcirculation[2].
Overall, the contrasting responses of Imc and AI at T ≥ 45 °C indicated the beginning of progressive heat-related impairment in RBC hemorheological properties. Notably, the substantial decrease in AI highlighted the potential of the proposed system as a sensitive, real-time tool for detecting thermally induced changes in circulating RBCs.
Several limitations should be considered when interpreting these findings. Most importantly, thermal RBC damage was evaluated based on changes in AI alone and was not independently confirmed using established indicators of RBC injury, such as hemolysis, deformability, membrane stability, or morphological changes[7,84,85] . Moreover, the use of RBC suspensions in dextran solution does not fully reproduce the hemorheological environment of whole blood, because RBC aggregation and thermal responses can be strongly influenced by the composition of the suspending medium, hematocrit, and plasma proteins[71,84,86]. Future studies combining whole-blood experiments with simultaneous biochemical, morphological, and mechanical measurements will therefore be important for establishing the mechanistic basis of AI changes and validating AI as a reliable marker of thermally induced RBC damage.
4. Conclusions
In this study, a closed-loop microfluidic platform was proposed for continuous monitoring of RBC aggregation during prolonged blood circulation and thermal exposure. The system integrated a peristaltic pump, a flow stabilizer (FS), a microfluidic chip, and a thermal mixer, which enabled stable circulation, suppression of RBC sedimentation, controlled thermal exposure, and real-time measurement of the aggregation index (AI). In particular, the FS markedly suppressed pump-induced flow fluctuations by increasing the characteristic flow-response time by approximately 17.6-fold, thereby substantially reducing pulsatile flow generated in a closed-loop fluidic circuit.
The optimized operating conditions of pump speed (Ωp = 0.3 rpm) and mixer-vibration (Ωm = 900 rpm) further enabled continuous AI measurement for at least 30 min, while minimizing RBC sedimentation and maintaining distinct shear environments for RBC disaggregation in the main channel and aggregation in the test chamber. The system successfully detected dextran-dependent variations in RBC aggregation under continuous circulation, demonstrating its capability to resolve changes in hemorheological behavior without repeated flow cessation or blood sampling. Most importantly, during controlled thermal exposure, Imc and AI remained nearly unchanged at temperatures up to 43 °C, whereas a clear transition occurred at ≥ 45 °C, where Imc progressively increased and AI markedly decreased with respect to exposure time. These opposing responses revealed the onset and progression of heat-induced deterioration in RBC hemorheological properties and demonstrated that AI could serve as a sensitive functional indicator of thermally induced RBC alterations.
Overall, the proposed platform provides a distinct advantage over conventional end-point measurements by enabling repeated assessment of the same circulating RBC population under continuously controlled flow and thermal conditions. With further validation against established biochemical, morphological, and mechanical markers of RBC damage, this approach could provide a versatile tool for studying thermal injury, blood-storage lesions, mechanical fatigue, and other progressive changes in RBC function under physiologically relevant circulation conditions.
Funding
This study was supported by the National Research Foundation of Korea (NRF) grant funded by the Korea government (MSIT) (RS-2026-25597675).
Institutional Review Board Statement
This study was performed in accordance with the Declaration of Helsinki and was approved by the Ethics Committee of Chosun University (reference code: 2-1041055-AB-N-01-2026-23).
Informed Consent Statement
Informed consent was waived by the Ethics Committee of Chosun University (reference code: 2-1041055-AB-N-01-2026-23).
Data Availability Statement
The original contributions presented in this study are included in the article. Further inquiries can be directed to the corresponding author.
Acknowledgments
During the preparation of this manuscript, the author used ChatGPT (Version 5.5) for the purposes of generating text. The author has reviewed and edited the output and takes full responsibility for the content of this publication.
Conflicts of Interest
The author declares no conflicts of interest.
References
- Cabrales, P. Effects of erythrocyte flexibility on microvascular perfusion and oxygenation during acute anemia. Am. J. Physiol. Heart Circ. Physiol. 2007, 293, H1206–H1215. [Google Scholar] [CrossRef] [PubMed]
- Baskurt, O.K.; Meiselman, H.J. Blood rheology and hemodynamics. Semin. Thromb. Hemost. 2003, 29, 435–450. [Google Scholar] [CrossRef] [PubMed]
- Shin, S.; Park, M.S.; Ku, Y.H.; Suh, J.S. Shear-dependent aggregation characteristics of red blood cells in a pressure-driven microfluidic channel. Clin. Hemorheol. Microcirc. 2006, 34, 353–361. [Google Scholar] [CrossRef]
- Brust, M.; Aouane, O.; Thiebaud, M.; Flormann, D.; Verdier, C.; Kaestner, L.; Laschke, M.W.; Selmi, H.; Benyoussef, A.; Podgorski, T.; Coupier, G.; Misbah, C.; Wagner, C. The plasma protein fibrinogen stabilizes clusters of red blood cells in microcapillary flows. Sci. Rep. 2014, 4, 4348. [Google Scholar] [CrossRef] [PubMed]
- Stuart, J.; Nash, G.B. Red cell deformability and haematological disorders. Blood Rev. 1990, 4, 141–147. [Google Scholar] [CrossRef] [PubMed]
- Baskurt, O.K.; Yalcin, O.; Meiselman, H.J. Hemorheology and vascular control mechanism. Clin. Hemorheol. Microcirc. 2004, 30, 169–178. [Google Scholar] [CrossRef]
- Gershfeld, N.L.; Murayama, M. Thermal instability of red blood cell membrane bilayers: temperature dependence of hemolysis. J. Membr. Biol. 1988, 101, 67–72. [Google Scholar] [CrossRef] [PubMed]
- Lepock, J.R.; Frey, H.E.; Bayne, H.; Markus, J. Relationship of hyperthermal_induced hemolysis. Biochim. Biophys. Acta 1989, 980, 191–201. [Google Scholar] [CrossRef] [PubMed]
- Poder, T.G.; Nonkani, W.G.; Tsakeu Leponkouo, E. Blood warming and hemolysis: a systematic review with meta-analysis. Transfus. Med. Rev. 2015, 29, 172–180. [Google Scholar] [CrossRef] [PubMed]
- Rakow, A.L.; Hochmuth, R.M. Effect of heat treatment on the elasticity of human erythrocyte membrane. Biophys. J. 1975, 15, 1095–1100. [Google Scholar] [CrossRef] [PubMed]
- Hanss, M.; Koutsouris, D. Thermal transitions of red blood cell deformability. Correlation with membrane rheological properties. Biochim. Biophys. Acta 1984, 769, 461–470. [Google Scholar] [CrossRef] [PubMed]
- SNABRE, P.; BAUMLER, H.; MILLS, P. Aggregation of human red blood cells after moderate heat treatment. Biorheology 1985, 22, 185–195. [Google Scholar] [CrossRef] [PubMed]
- Lerche, D.; Bäumler, H. Moderate heat treatment of only red blood cells (RBC) slows down the rate of RBC-RBC aggregation in plasma. Biorheology 1984, 21, 393–403. [Google Scholar] [CrossRef] [PubMed]
- Berga, L.; Dolz, J.; Vives-Corronsg, J.L.; Feliug, E.; Rozman, C. Viscometric methods for assessing red cell deformability and fragmentation. Biorheology 1984, 23, 297–301. [Google Scholar] [CrossRef] [PubMed]
- William, N.; Isiksacan, Z.; Mykhailova, O.; Olafson, C.; Yarmush, M.L.; Usta, O.B.; Acker, J.P. Comparing two extracellular additives to facilitate extended storage of red blood cells in a supercooled state. Front Physiol. 2023, 14, 1165330. [Google Scholar] [CrossRef] [PubMed]
- Yazdanbakhsh, M.; Phan, C.; Patel, P.; Simpson, E.; Wingnean, K.; Acker, J.P. RBC deformability and clinical relevance in transfusion recipients. Transfus. Apher. Sci. 2025, 64, 104278. [Google Scholar] [CrossRef] [PubMed]
- Nonomura, K.; Horade, M.; Shirasaka, Y.; Murakami, S.; Ito, H.; Yoshitomi, K. Red blood cell deformability in microfluidic constrictions under flow and wall contact. Micromachines 2026, 17, 670. [Google Scholar] [CrossRef] [PubMed]
- Du, Y.; Wu, W.; Chen, Y.; Zhu, L.; Ma, S.; Zhang, F.; Li, X. High-throughput biomimetic cycling of red blood cells: elucidating the morpho-mechanical determinants of fatigue and clearance. Lab Chip 2026, 26, 551–563. [Google Scholar] [CrossRef] [PubMed]
- Piety, N.Z.; Stutz, J.; Yilmaz, N.; Xia, H.; Yoshida, T.; Shevkoplyas, S.S. Microfluidic capillary networks are more sensitive than ektacytometry to the decline of red blood cell deformability induced by storage. Sci. Rep. 2021, 11, 604. [Google Scholar] [CrossRef] [PubMed]
- Kajitani, K.; Tsai, C.D.; Ohtani, T.; Wada, S.; Cimrak, I.; Chimura, M.; Taniguchi, T.; Ueda, Y.; Nishimura, J.I.; Sakata, Y. On-chip evaluation of red blood cell deformability through transit velocity index in hematological diseases. Small 2026, 22, e14520. [Google Scholar] [CrossRef] [PubMed]
- Liu, W.; Xie, L.; Yang, J.; Gong, X.; Sun, D.; Zhang, C. A microfluidic device for detecting the deformability of red blood cells. Biosensors 2025, 15, 758. [Google Scholar] [CrossRef] [PubMed]
- Nouaman, M.; Darras, A.; Wagner, C.; Recktenwald, S.M. Confinement effect on the microcapillary flow and shape of red blood cells. Biomicrofluidics 2024, 18, 024104. [Google Scholar] [CrossRef] [PubMed]
- Kang, Y.J. A microfluidic method for simultaneous assessment of blood viscosity and red blood cell aggregation during continuous syringe delivery. Sensors 2026, 26, 2845. [Google Scholar] [CrossRef] [PubMed]
- Kang, Y.J. Micro blood flow-resolved rheometry. Micromachines 2026, 17, 331. [Google Scholar] [CrossRef] [PubMed]
- Zheng, Y.; Nguyen, J.; Wang, C.; Sun, Y. Electrical measurement of red blood cell deformability on a microfluidic device. Lab Chip 2013, 13, 3275–3283. [Google Scholar] [CrossRef] [PubMed]
- Foo, J.J.; Chan, V.; Feng, Z.Q.; Liu, K.K. Human red blood cells deformed under thermal fluid flow. Biomed. Mater. 2006, 1, 1–7. [Google Scholar] [CrossRef] [PubMed]
- Rodriguez-Villarreal, A.I.; Carmona-Flores, M.; Colomer-Farrarons, J. Effect of temperature and flow rate on the cell-free area in the microfluidic channel. Membranes 2021, 11, 109. [Google Scholar] [CrossRef] [PubMed]
- Baskurt, O.K.; Boynard, M.; Cokelet, G.C.; Connes, P.; Cooke, B.M.; Forconi, S.; Liao, F.; Hardeman, M.R.; Jung, F.; Meiselman, H.J.; Nash, G.; Nemeth, N.; Neu, B.; Sandhagen, B.; Shin, S.; Thurston, G.; Wautier, J.L. International Expert Panel for Standardization of Hemorheological, M. New guidelines for hemorheological laboratory techniques. Clin. Hemorheol. Microcirc. 2009, 42, 75–97. [Google Scholar] [CrossRef] [PubMed]
- Hess, J.R.; Biomedical Excellence for Safer Transfusion, C. Scientific problems in the regulation of red blood cell products. Transfusion 2012, 52, 1827–1835. [Google Scholar] [CrossRef] [PubMed]
- Zimrin, A.B.; Hess, J.R. Current issues relating to the transfusion of stored red blood cells. Vox Sang. 2009, 96, 93–103. [Google Scholar] [CrossRef] [PubMed]
- Kang, Y.J. A pulsatile flow-modulation microfluidic sensor for simultaneous monitoring of red blood cell aggregation and viscosity-sensitive time constant. Sensors 2026, 26, 4541. [Google Scholar] [CrossRef] [PubMed]
- Fan, D.H.; Yuan, S.W.; Shen, Y.M. Surface modification with BSA blocking based on in situ synthesized gold nanoparticles in poly(dimethylsiloxane) microchip. Colloids Surf. B Biointerfaces 2010, 75, 608–611. [Google Scholar] [CrossRef] [PubMed]
- Thielicke, W.; Stamhuis, E.J. PIVlab – towards user-friendly, affordable and accurate digital particle image velocimetry in MATLAB. J. Open Res. Softw. 2014, 2, e30. [Google Scholar] [CrossRef]
- Nader, E.; Skinner, S.; Romana, M.; Fort, R.; Lemonne, N.; Guillot, N.; Gauthier, A.; Antoine-Jonville, S.; Renoux, C.; Hardy-Dessources, M.D.; Stauffer, E.; Joly, P.; Bertrand, Y.; Connes, P. Blood rheology: key parameters, impact on blood flow, role in sickle cell disease and effects of exercise. Front Physiol. 2019, 10, 1329. [Google Scholar] [CrossRef] [PubMed]
- Reinhart, W.H.; Piety, N.Z.; Shevkoplyas, S.S. Influence of red blood cell aggregation on perfusion of an artificial microvascular network. Microcirculation 2017, 24, e12317. [Google Scholar] [CrossRef] [PubMed]
- Bishop, J.J.; Popel, A.S.; Intaglietta, M.; Johnson, P.C. Rheological effects of red blood cell aggregation in the venous network: A review of recent studies. Biorheology 2001, 38, 263–274. [Google Scholar] [CrossRef]
- Hardeman, M.R.; Dobbe, J.G.G.; Ince, C. Rheological effects of red blood cell aggregation in the venous network: a review of recent studies. Clin. Hemorheol. Microcirc. 2001, 25, 1–11. [Google Scholar] [CrossRef]
- Baskurt, O.K.; Uyuklu, M.; Hardeman, M.R.; Meiselman, H.J. Photometric measurements of red blood cell aggregation: light transmission versus light reflectance. J. Biomed. Opt. 2009, 14, 054044. [Google Scholar] [CrossRef] [PubMed]
- Baskurt, O.K.; Uyuklu, M.; Ulker, P.; Cengiz, M.; Nemeth, N.; Alexy, T.; Shin, S.; Hardeman, M.R.; Meiselman, H.J. Comparison of three instruments for measuring red blood cell aggregation. Clin. Hemorheol. Microcirc. 2009, 43, 283–298. [Google Scholar] [CrossRef] [PubMed]
- Bosek, M.; Ziomkowska, B.; Pyskir, J.; Wybranowski, T.; Pyskir, M.; Cyrankiewicz, M.; Napiorkowska, M.; Durmowicz, M.; Kruszewski, S. Relationship between red blood cell aggregation and dextran molecular mass. Sci. Rep. 2022, 12, 19751. [Google Scholar] [CrossRef] [PubMed]
- Higuchi, M.; Watanabe, N. A rapid and accurate method for estimating the erythrocyte sedimentation rate using a hematocrit-corrected optical aggregation index. PLoS ONE 2022, 17, e0270977. [Google Scholar] [CrossRef] [PubMed]
- Kang, Y.J. Microfluidic-based measurement method of red blood cell aggregation under hematocrit variations. Sensors 2017, 17, 2037. [Google Scholar] [CrossRef] [PubMed]
- Neu, B.; Wenby, R.; Meiselman, H.J. Effects of dextran molecular weight on red blood cell aggregation. Biophys. J. 2008, 95, 3059–3065. [Google Scholar] [CrossRef] [PubMed]
- Kim, G.; Jeong, S.; Kang, Y.J. Ultrasound standing wave-based cell-to-liquid separation for measuring viscosity and aggregation of blood sample. Sensors 2020, 20, 2284. [Google Scholar] [CrossRef] [PubMed]
- Vu, H.H.; Vo, T.V.K.; Musharaf, H.M.; Cha, H.; Nguyen, N.T. Steady-state and dynamic behavior of geometry-tunable microfluidic passive flow regulators. Small 2026, e74354. [Google Scholar] [CrossRef] [PubMed]
- Zhang, X.; Zhu, Z.; Xiang, N.; Ni, Z. A microfluidic gas damper for stabilizing gas pressure in portable microfluidic systems. Biomicrofluidics 2016, 10, 054123. [Google Scholar] [CrossRef] [PubMed]
- Kang, Y.J.; Yeom, E.; Seo, E.; Lee, S.J. Bubble-free and pulse-free fluid delivery into microfluidic devices. Biomicrofluidics 2014, 8, 014102. [Google Scholar] [CrossRef] [PubMed]
- Büker, O.; Stolt, K.; Batista, E.; Sepulveda, J.; Giuliano, C.B.; Morin, A.; Nobre, D.; Navas, H. Investigations on the performance of a newly developed pressure-driven flow controller used in microfluidic applications. Meas. Sens. 2025, 38, 101645. [Google Scholar] [CrossRef]
- Sodergren, S.; Svensson, K.; Hjort, K. Microfluidic active pressure and flow stabiliser. Sci. Rep. 2021, 11, 22504. [Google Scholar] [CrossRef] [PubMed]
- Lesher-Perez, S.C.; Vasani, V.; So, J.; Takayama, S. Forced air oscillations - pneumatic capacitance in microfluidic oscillators produces non-linear responses and emergent behaviors. Lab Chip 2024, 24, 4798–4807. [Google Scholar] [CrossRef] [PubMed]
- Benavent-Claró, A. Damping dynamics of bubble-driven oscillatory flows. Phys. Fluids 2026, 38, 062014. [Google Scholar] [CrossRef]
- Pitts, K.L.; Fenech, M. Micro-particle image velocimetry for velocity profile measurements of micro blood flows. J. Vis. Exp. 2013, e50314. [Google Scholar] [CrossRef] [PubMed]
- Chartrand, C.; Le, A.V.; Fenech, M. Micro-particle image velocimetry for blood flow in thick round glass micro-channels: Channel fabrication and velocity profile characterization. MethodsX 2023, 10, 102110. [Google Scholar] [CrossRef] [PubMed]
- Gholivand, A.; Korculanin, O.; Dahlhoff, K.; Babaki, M.; Dickscheid, T.; Lettinga, M.P. Effect of in-plane and out-of-plane bifurcated microfluidic channels on the flow of aggregating red blood cells. Lab Chip 2024, 24, 2317–2326. [Google Scholar] [CrossRef] [PubMed]
- Oh, K.W.; Lee, K.; Ahn, B.; Furlani, E.P. Design of pressure-driven microfluidic networks using electric circuit analogy. Lab Chip 2012, 12, 515–45. [Google Scholar] [CrossRef] [PubMed]
- Rousset, N.; Lohasz, C.; Boos, J.A.; Misun, P.M.; Cardes, F.; Hierlemann, A. Circuit-based design of microfluidic drop networks. Micromachines 2022, 13, 1124. [Google Scholar] [CrossRef] [PubMed]
- Emmerich, M.; Costamoling, F.; Wille, R. Modular and extendable 1D-simulation for microfluidic devices. Sci. Rep. 2024, 14, 26311. [Google Scholar] [CrossRef] [PubMed]
- Gong, M.M.; Macdonald, B.D.; Vu Nguyen, T.; Sinton, D. Hand-powered microfluidics: A membrane pump with a patient-to-chip syringe interface. Biomicrofluidics 2012, 6, 44102. [Google Scholar] [CrossRef] [PubMed]
- Kim, Y.; Kuczenski, B.; LeDuc, P.R.; Messner, W.C. Modulation of fluidic resistance and capacitance for long-term, high-speed feedback control of a microfluidic interface. Lab Chip 2009, 9, 2603–2609. [Google Scholar] [CrossRef] [PubMed]
- Kang, Y.J. Blood viscometer using capillary blood flow under disposable compliance pump. Int. J. Mech. Sci. 2024, 277, 109456. [Google Scholar] [CrossRef]
- Kang, Y.J.; Yang, S. Fluidic low pass filter for hydrodynamic flow stabilization in microfluidic environments. Lab Chip 2012, 12, 1881–1889. [Google Scholar] [CrossRef] [PubMed]
- Kim, D.; Chesler, N.C.; Beebe, D.J. A method for dynamic system characterization using hydraulic series resistance. Lab Chip 2006, 6, 639–644. [Google Scholar] [CrossRef] [PubMed]
- Wunderlich, B.K.; Klessinger, U.A.; Bausch, A.R. Diffusive spreading of time-dependent pressures in elastic microfluidic devices. Lab Chip 2010, 10, 1025–1029. [Google Scholar] [CrossRef] [PubMed]
- Zhuge, W.; Li, W.; Wang, K.; Chen, Z.; Wu, C.; Jiang, K.; Ding, J.; Anthony, C.; Cheng, X. A lego-like reconfigurable microfluidic stabilizer system with tunable fluidic RC constants and stabilization ratios. Micromachines 2024, 15, 843. [Google Scholar] [CrossRef] [PubMed]
- Kang, Y.J.; Yeom, E.; Lee, S.J. A microfluidic device for simultaneous measurement of viscosity and flow rate of blood in a complex fluidic network. Biomicrofluidics 2013, 7, 54111. [Google Scholar] [CrossRef] [PubMed]
- Zhang, X.; Chen, Z.; Huang, Y. A valve-less microfluidic peristaltic pumping method. Biomicrofluidics 2015, 9, 014118. [Google Scholar] [CrossRef] [PubMed]
- Armstrong, J.K.; Wenby, R.B.; Meiselman, H.J.; Fisher, T.C. The hydrodynamic radii of macromolecules and their effect on red blood cell aggregation. Biophys. J. 2004, 87, 4259–4270. [Google Scholar] [CrossRef] [PubMed]
- Kang, Y.J.; Yeom, E.; Lee, S.J. Microfluidic biosensor for monitoring temporal variations of hemorheological and hemodynamic properties using an extracorporeal rat bypass loop. Anal. Chem. 2013, 85, 10503–11. [Google Scholar] [CrossRef] [PubMed]
- Voyvodic, P.L.; Min, D.; Baker, A.B. A multichannel dampened flow system for studies on shear stress-mediated mechanotransduction. Lab Chip 2012, 12, 3322–3330. [Google Scholar] [CrossRef] [PubMed]
- Schmid-Schonbein, H.; Gaehtgens, P.; Hirsch, H. On the shear rate dependence of red cell aggregation in vitro. J. Clin. Invest. 1968, 47, 1447–1454. [Google Scholar] [CrossRef] [PubMed]
- Baskurt, O.K.; Meiselman, H.J. Erythrocyte aggregation: basic aspects and clinical importance. Clin. Hemorheol. Microcirc. 2013, 53, 23–37. [Google Scholar] [CrossRef] [PubMed]
- Kaliviotis, E.; Yianneskis, M. Fast response characteristics of red blood cell aggregation. Biorheology 2008, 45, 639–649. [Google Scholar] [CrossRef]
- Chien, S.; Usami, S.; Dellenback, R.J.; Gregersen, M.I.; Nanninga, L.B.; Guest, M.M. Blood viscosity: influence of erythrocyte aggregation. Science 1967, 157, 829–831. [Google Scholar] [CrossRef] [PubMed]
- Passos, A.; Louka, M.; Vryonidis, C.; Inglezakis, A.; Loizou, C.; Nikiphorou, E.; Psarelis, S.; Kaliviotis, E. Red blood cell sedimentation rate measurements in a high aspect ratio microchannel. Clin. Hemorheol. Microcirc. 2022, 82, 313–322. [Google Scholar] [CrossRef] [PubMed]
- Wang, Y.; Nunna, B.B.; Talukder, N.; Lee, E.S. Microfluidic-based novel optical quantification of red blood cell concentration in blood flow. Bioengineering 2022, 9, 247. [Google Scholar] [CrossRef] [PubMed]
- Higuchi, M.; Watanabe, N. Determination of the erythrocyte sedimentation rate using the hematocrit-corrected aggregation index and mean corpuscular volume. J. Clin. Lab Anal. 2023, 37, e24877. [Google Scholar] [CrossRef] [PubMed]
- Cremaschini, S.; Torriero, N.; Maceri, C.; Poles, M.; Cleve, S.; Crestani, B.; Meggiolaro, A.; Pierno, M.; Mistura, G.; Brun, P.; Ferraro, D. Magnetic stirring device for limiting the sedimentation of cells inside microfluidic devices. Sensors 2024, 24, 5014. [Google Scholar] [CrossRef] [PubMed]
- Namgung, B.; Lee, T.; Tan, J.K.S.; Poh, D.K.H.; Park, S.; Chng, K.Z.; Agrawal, R.; Park, S.Y.; Leo, H.L.; Kim, S. Vibration motor-integrated low-cost, miniaturized system for rapid quantification of red blood cell aggregation. Lab Chip 2020, 20, 3930–3937. [Google Scholar] [CrossRef] [PubMed]
- Kang, Y.J. Red blood cell sedimentation index using shear stress of blood flow in microfluidic channel. Biosensors 2022, 12, 547. [Google Scholar] [CrossRef] [PubMed]
- Kang, Y.J. Microfluidic chip for quantitatively assessing hemorheological parameters. Micromachines 2025, 16, 567. [Google Scholar] [CrossRef] [PubMed]
- Tirtaatmadja, V.; Dunstan, D.E.; Boger, D.V. Rheology of dextran solutions. J.Non-Newtonain Fluid Mech. 2001, 97, 295–301. [Google Scholar] [CrossRef]
- Kang, Y.J. Assessment of continuous flow-dependent red cell aggregation using a microfluidic chip. Appl. Sci. 2025, 15, 11481. [Google Scholar] [CrossRef]
- Kang, Y.J. Periodic and simultaneous quantification of blood viscosity and red blood cell aggregation using a microfluidic platform under in-vitro closed-loop circulation. Biomicrofluidics 2018, 12, 024116. [Google Scholar] [CrossRef] [PubMed]
- Matrai, A.A.; Varga, G.; Tanczos, B.; Barath, B.; Varga, A.; Horvath, L.; Bereczky, Z.; Deak, A.; Nemeth, N. In vitro effects of temperature on red blood cell deformability and membrane stability in human and various vertebrate species. Clin. Hemorheol. Microcirc. 2021, 78, 291–300. [Google Scholar] [CrossRef] [PubMed]
- Utoh, J.; Zajkowski-Brown, J.E.; Harasaki, H. Effects of heat on fragility and morphology of human and calf erythrocytes. J. Invest. Surg. 1992, 5, 305–313. [Google Scholar] [CrossRef] [PubMed]
- Chien, K.; Liu, H.; Suriany, S.; Detterich, J.A. The impact of measurement techniques and common effectors on red blood cell aggregation. Biorheology 2025, 60, 19–22. [Google Scholar] [CrossRef] [PubMed]
Figure 1.
Proposed method for probing thermally induced red blood cell alteration using a multiscale fluidic system. (A) Schematic illustration of the experimental setup consisting of a microfluidic device, a fluidic stabilizer (FS), peristaltic pump, a thermal mixer, and microscopic imaging system. (i) The microfluidic device comprised three ports (a, b, and c), a main channel (mc), and a bifurcation channel (bc). The bc consisted of a front narrow channel, a test chamber (tc), and a rear narrow channel connected in series. (ii) The FS comprised an inlet, two semicircular chambers (radius = 10 mm), upstream and downstream pillar channels, a rectangular connector, and an outlet. (iii) The microscopic imaging system consisted of a microscope equipped with a 4× objective lens (NA = 0.1), a high-speed camera capable of recording at 5000 frames per second (fps), and an external trigger with a 1 s interval. (iv) The peristaltic pump was operated at a constant rotational speed (Ωp) to circulate the blood sample through the closed-loop system. (v) Herein, 1 mL of test blood was transferred into a 1.5 mL microtube, which was then fully inserted into the designated hole of the heating block to ensure stable positioning and efficient heat transfer during thermal treatment. The thermal mixer was then operated at a prescribed vibration speed (Ωm) to minimize RBC sedimentation within the tube, while constant temperature (T) was maintained to impose the specific thermal shock on RBCs. (B) Quantification of blood velocity and image intensity in the main channel and test chamber. (i) Blood velocity fields were measured within a selected ROI (1.7 mm²) in the main channel (Umc) and test chamber (Utc). Purple arrows indicated the flow direction in microfluidic channels. (ii) Spatial distribution of (Itc [x]) was measured within a small ROI (0.04 mm²) in the test chamber. The distance (x) was defined from the baseline of the downstream semicircle. Black arrows indicated blood flow from right to left. Two area values (SA, SB) obtained from the spatially varying Itc curve were used to calculate the RBC aggregation index as AI = SA/(SA + SB). (C) Preliminary evaluation of the proposed method. Test blood (Hct = 30%) was prepared by suspending normal RBCs in dextran solution (4%) and placed in a microtube. The peristaltic pump and mixer were operated at Ωp = 0.3 rpm and Ωm = 900 rpm, respectively, while the mixer temperature was maintained at 25 ◦C. (i) Representative microscopic images captured at specific times (t = 150, 300, 600, 900, 1200, and 1500 s). Black arrows indicated blood flow direction in the test chamber. (ii) Time-dependent Umc and Utc. (iii) Time-dependent changes in Imc and AI. Herein, the Imc was obtained from the ROI (1.7 mm2) selected in the main channel.
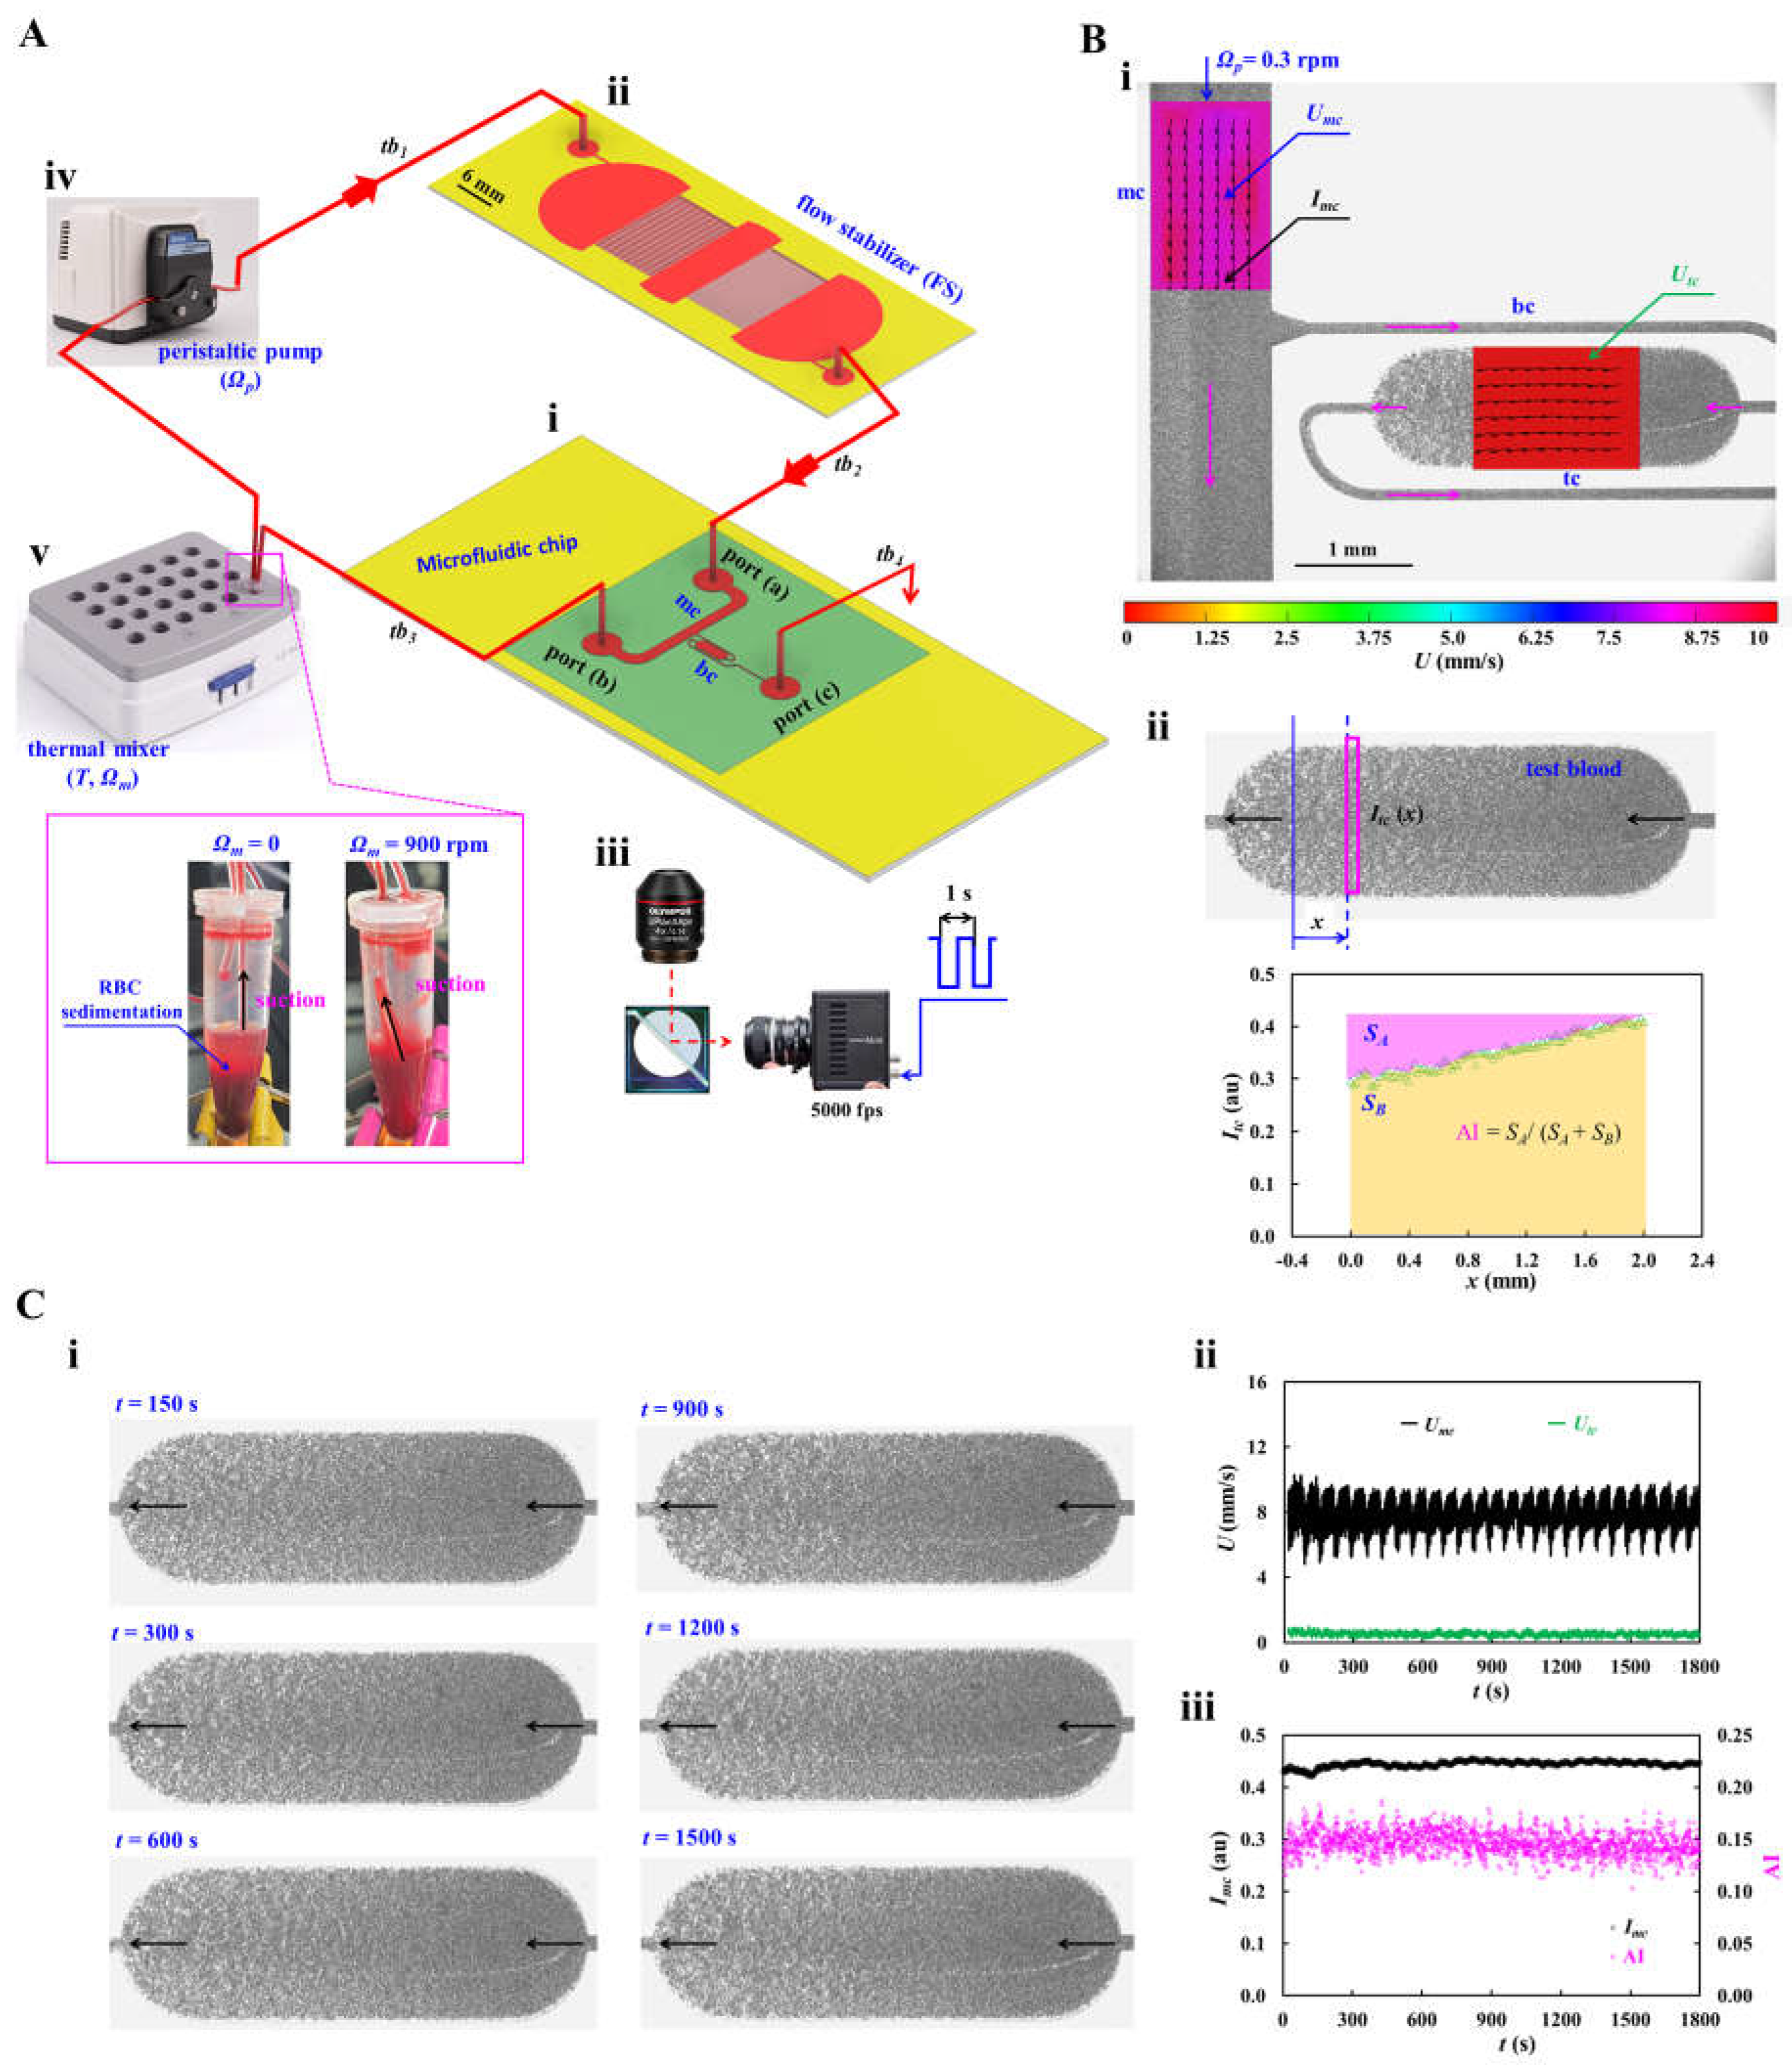
Figure 2.
Effect of the flow stabilizer (FS) on flow regulation and shear rate estimation under controlled flow conditions. To visualize fluid velocity fields in microfluidic channels, normal RBCs (30 μL) were added into 30% glycerin solution (1000 μL). Flow rate was controlled precisely using a syringe pump. (A) Fluidic circuit model for evaluating the effect of the FS on flow regulation. The left panel showed a schematic of the experimental setup, in which flow rate was prescribed as Qsp = Q0 + Q1 sin (2πt/Tp). The right panel showed corresponding circuit model of the experimental setup. The fluidic circuit was composed of fluidic resistances (tubing: Rtb1 ~ Rtb4, Fs: RFS, and channel: Rmc, Rbc), compliances (FS: CFS, tubing: Ct), and flow rate (Qsp). The ‘▼’ denoted zero pressure as boundary condition. (B) Effect of the plateau flow rate (Q0) on the time constant (λ). The Q0 was varied from 1 mL/h to 5 mL/h. The left and middle panels showed the transient main channel velocity (Umc) after the flow rate was changed from Q0 to zero, without and with the FS. To determine λ, the transient response of Umc was best fitted using a first-order exponential decay model. The right panel compared λ as a function of Q0, with and without the FS. (C) Effect of the pulsation period (Tp) on flow regulation, with and without the FS. The flow rate was prescribed as Qsp = 3 + 2 sin () mL/h, while Tp was varied from 10 s to 100 s. (D) Calculation of shear rates in the microfluidic channels as a function of Q0. The left panel showed the Qmc and Qtc with respect to Q0. The middle panel showed the variation of (Qmc - Qtc)/Qtc with respect to Q0. The right panel showed the corresponding shear rates in the main channel and bifurcation channel as a function of Q0.
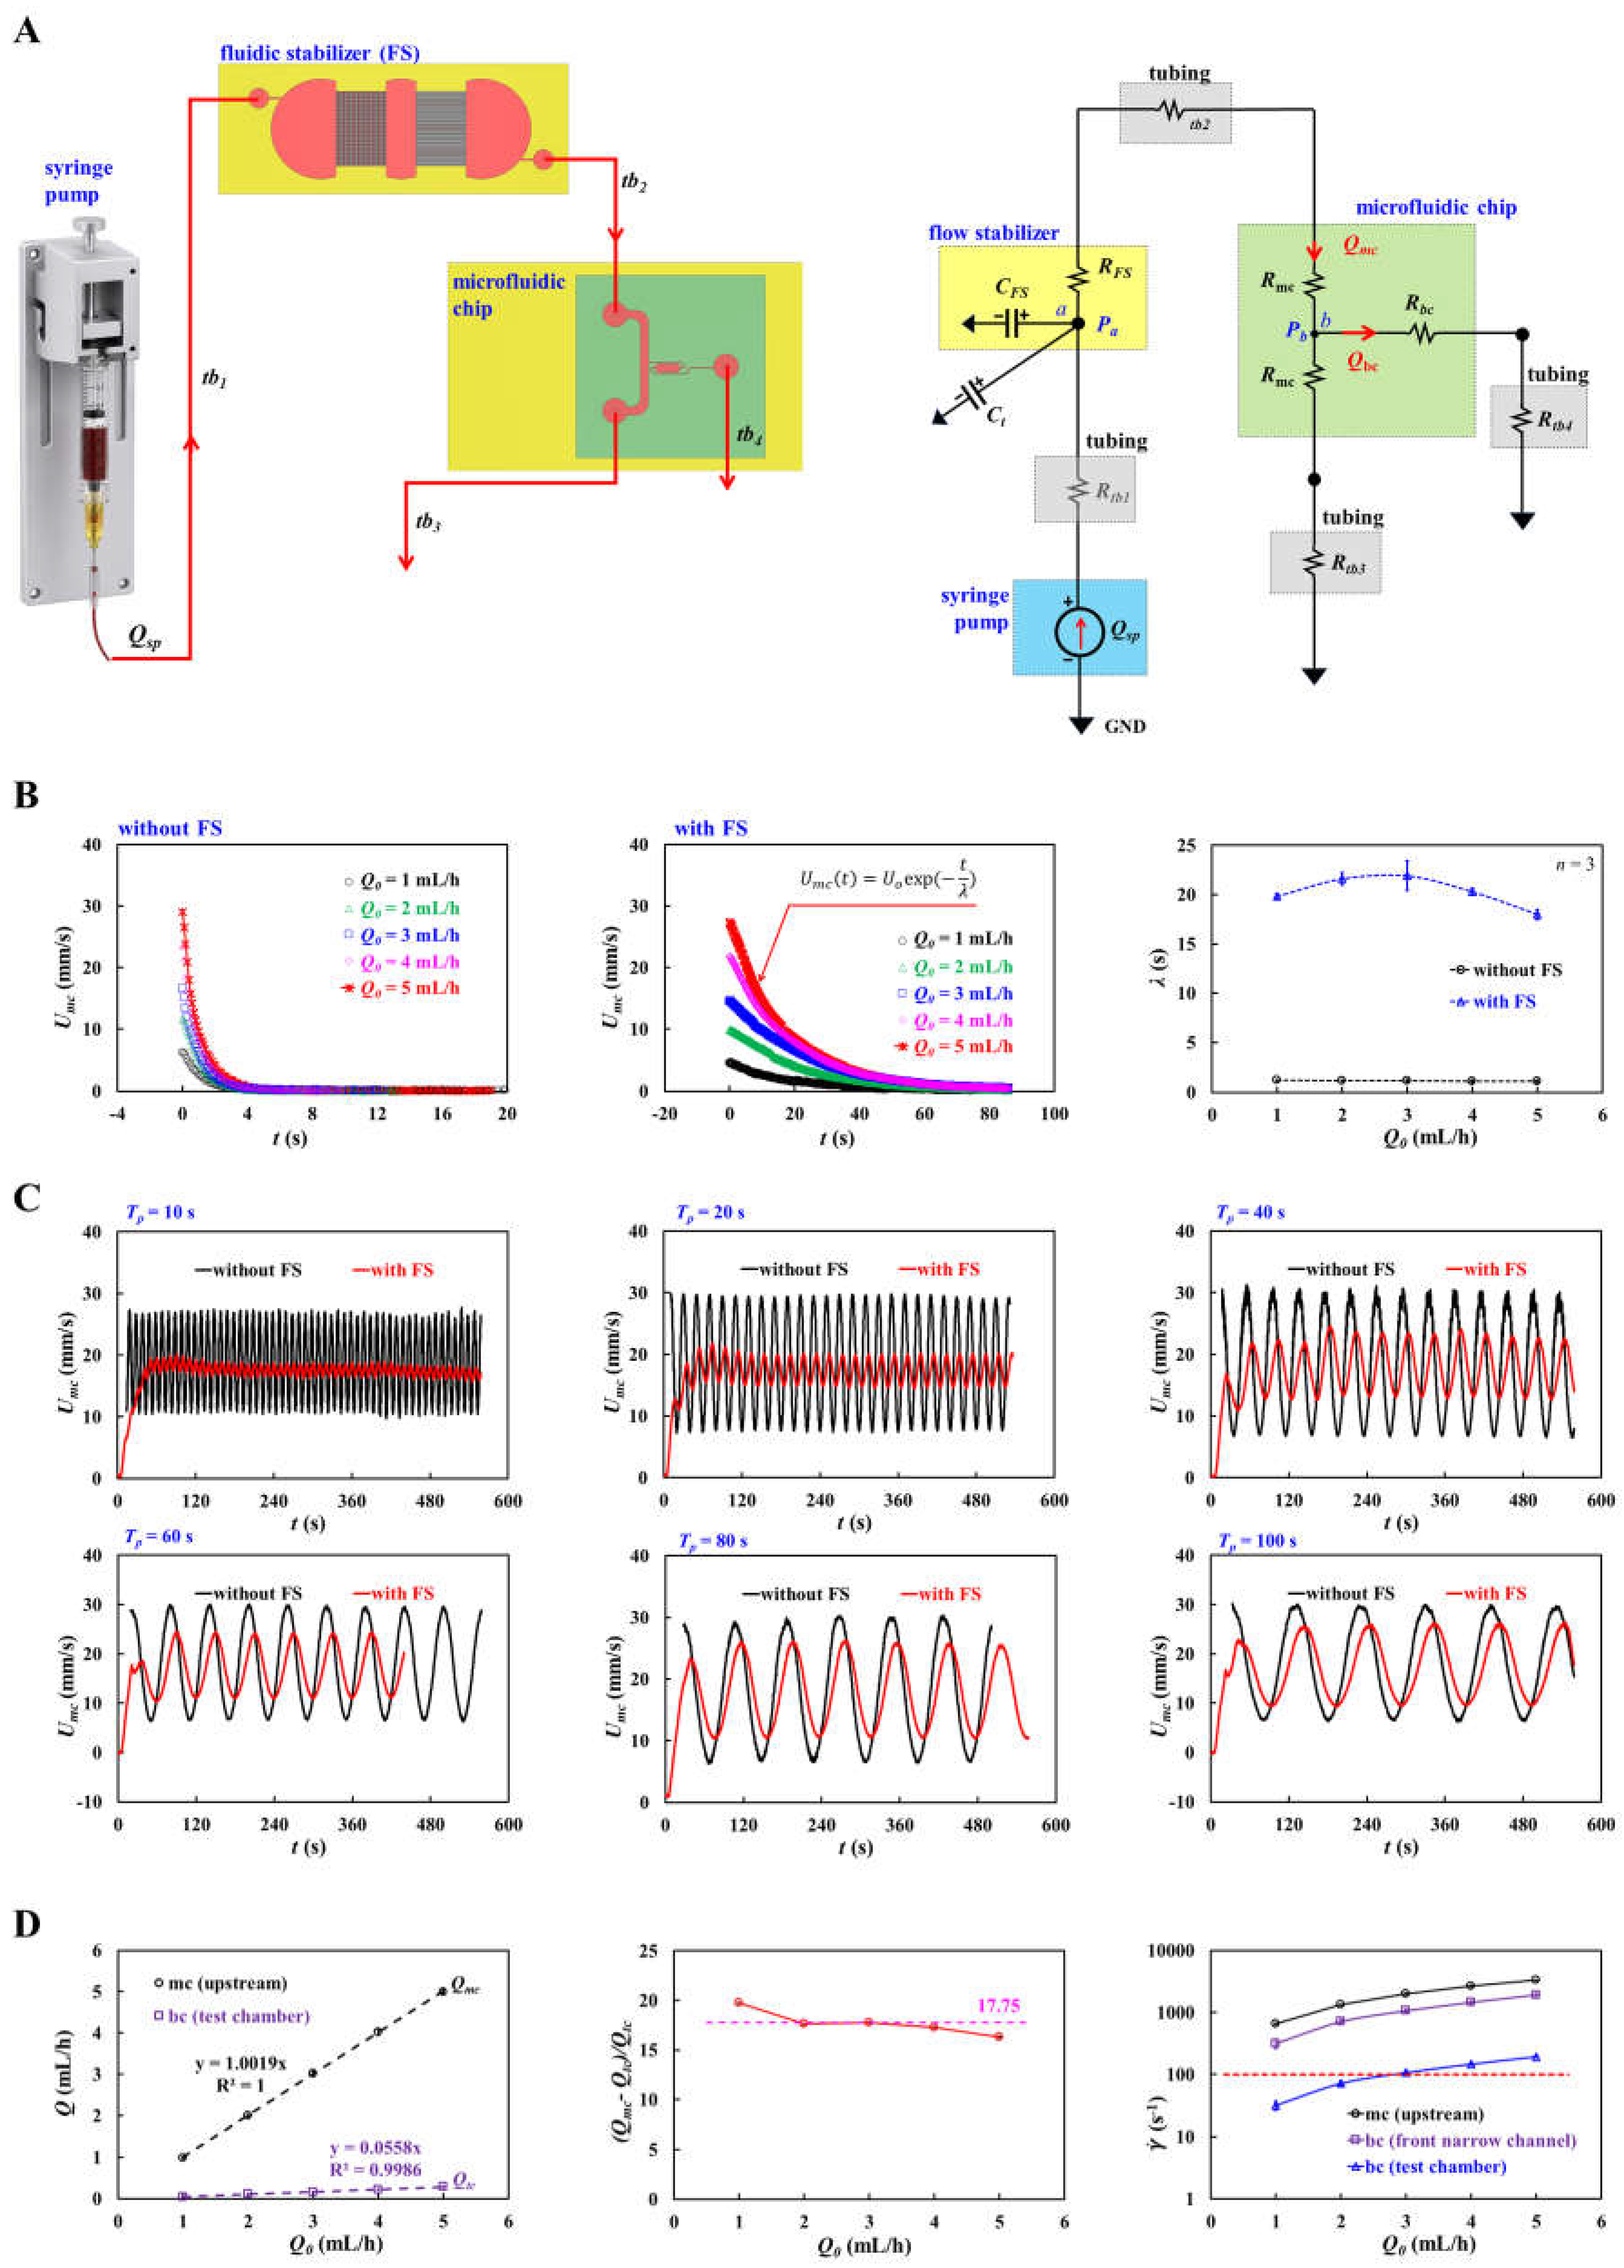
Figure 3.
Validation of the flow stabilizer (FS) for suppressing backflow and maintaining stable flow in microfluidic channels. (A) Effect of the FS on flow stabilization using glycerin solution (30%) as the test fluid. (i) Time-dependent Umc and Utc with respect to Ωp = 0.1 ~ 0.5 rpm, without the FS. (ii) Time-lapse Umc and Utc with respect to Ωp = 0.1 ~ 0.5 rpm, with the FS. (B) Effect of the FS on flow stabilization using control blood (normal RBCs suspended in 1× PBS, Hct = 50%). (i) Time-dependent Umc and Utc with respect to Ωp = 0.1 ~ 0.5 rpm, without the FS. (ii) Time-lapse Umc and Utc with respect to Ωp = 0.1 ~ 0.5 rpm, with the FS. (C) Effect of the FS on flow stability and shear rate estimation in the main channel and test chamber. (i) Mean velocities (<Umc>, <Utc>) and coefficients of variation (COVs) as a function of pump speed (Ωp = 0.1 ~ 1.0 rpm) for 30% glycerin solution. (ii) Variations of <Umc>, <Utc>, and their COVs as a function of pump speed for control blood. (iii) Estimation of shear rate () in the main channel and test chamber with respect to Ωp for both test fluids. Purple line indicated the upper shear rate threshold ( = 100 s-1) for promoting RBC aggregation in the test chamber.
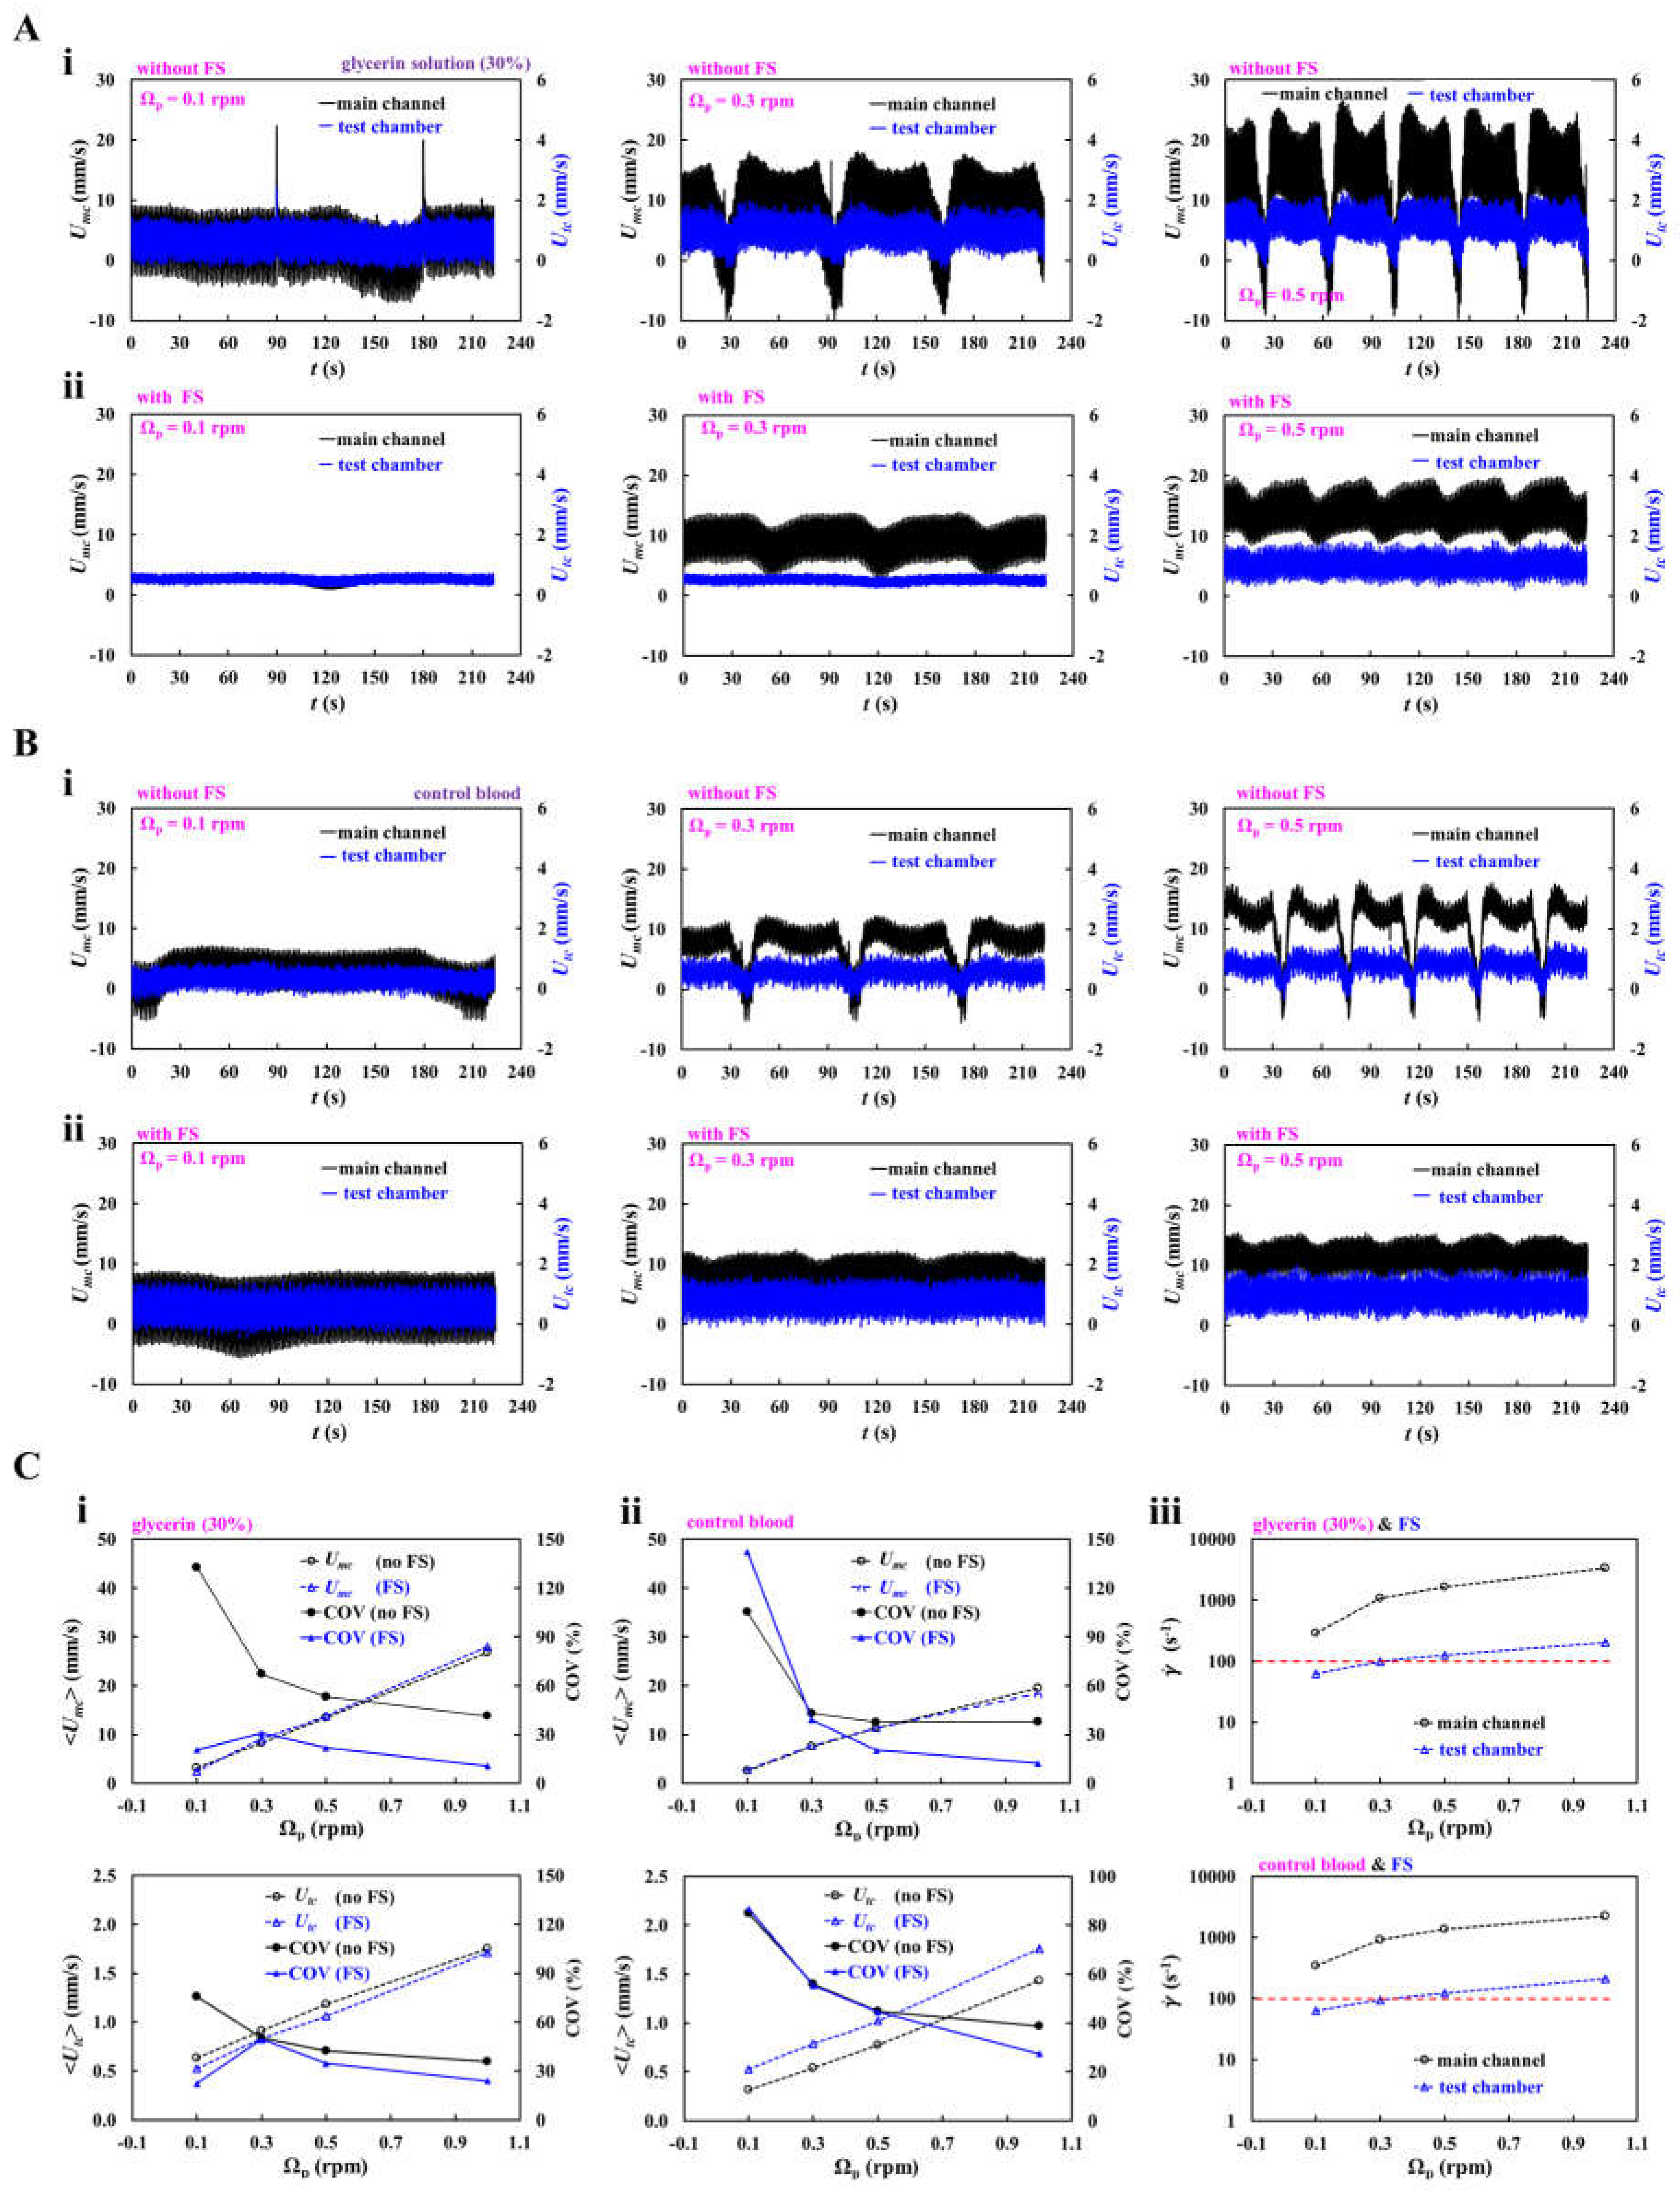
Figure 4.
Effect of RBC sedimentation on RBC aggregation index (AI) and suppression of its adverse influence on stable AI measurement. (A) Effect of pump speed (Ωp) on RBC sedimentation and AI. Test blood (Hct = 30% and 50%) was prepared by suspending normal RBCs in 4% dextran solution. Experiments were carried out without mixing. (i) Effect of pump speed on AI for test blood (Hct = 30%). Left panel showed time-dependent Imc at Ωp = 0.1 ~ 1.0 rpm. The snapshot showed RBC sedimentation in the microtube at the end of the experiment at Ωp = 0.1. The middle panel showed time-lapse AI at different pump speeds. The right panel summarized variations of AI with respect to Ωp. (ii) Effect of pump speed on AI for test blood (Hct = 50%). Left panel showed time-dependent Imc as a function of Ωp. The middle panel showed time-lapse AI at different pump speeds. The right panel exhibited variations of AI with respect to Ωp. (B) Effect of the mixer vibration on suppression of RBC sedimentation and stabilization of AI measurements. (i) At Ωp = 0.1 rpm, the left panel showed time-dependent Imc at Ωm = 0, 300, 600, and 900 rpm. The middle panel showed the corresponding time-lapse AI. The right panel summarized variations of AI and COV as a function of Ωm. (ii) At Ωp = 0.3 rpm, the left panel showed time-dependent Imc at Ωm = 0, 600, and 900 rpm. The snapshots showed clear RBC sedimentation without mixing (Ωm = 0) and suppression of RBC sedimentation with mixing (Ωm = 600 rpm) at the end of the experiment. The middle panel showed the corresponding time-lapse AI. The right panel summarized variations of AI and COV as a function of Ωm.
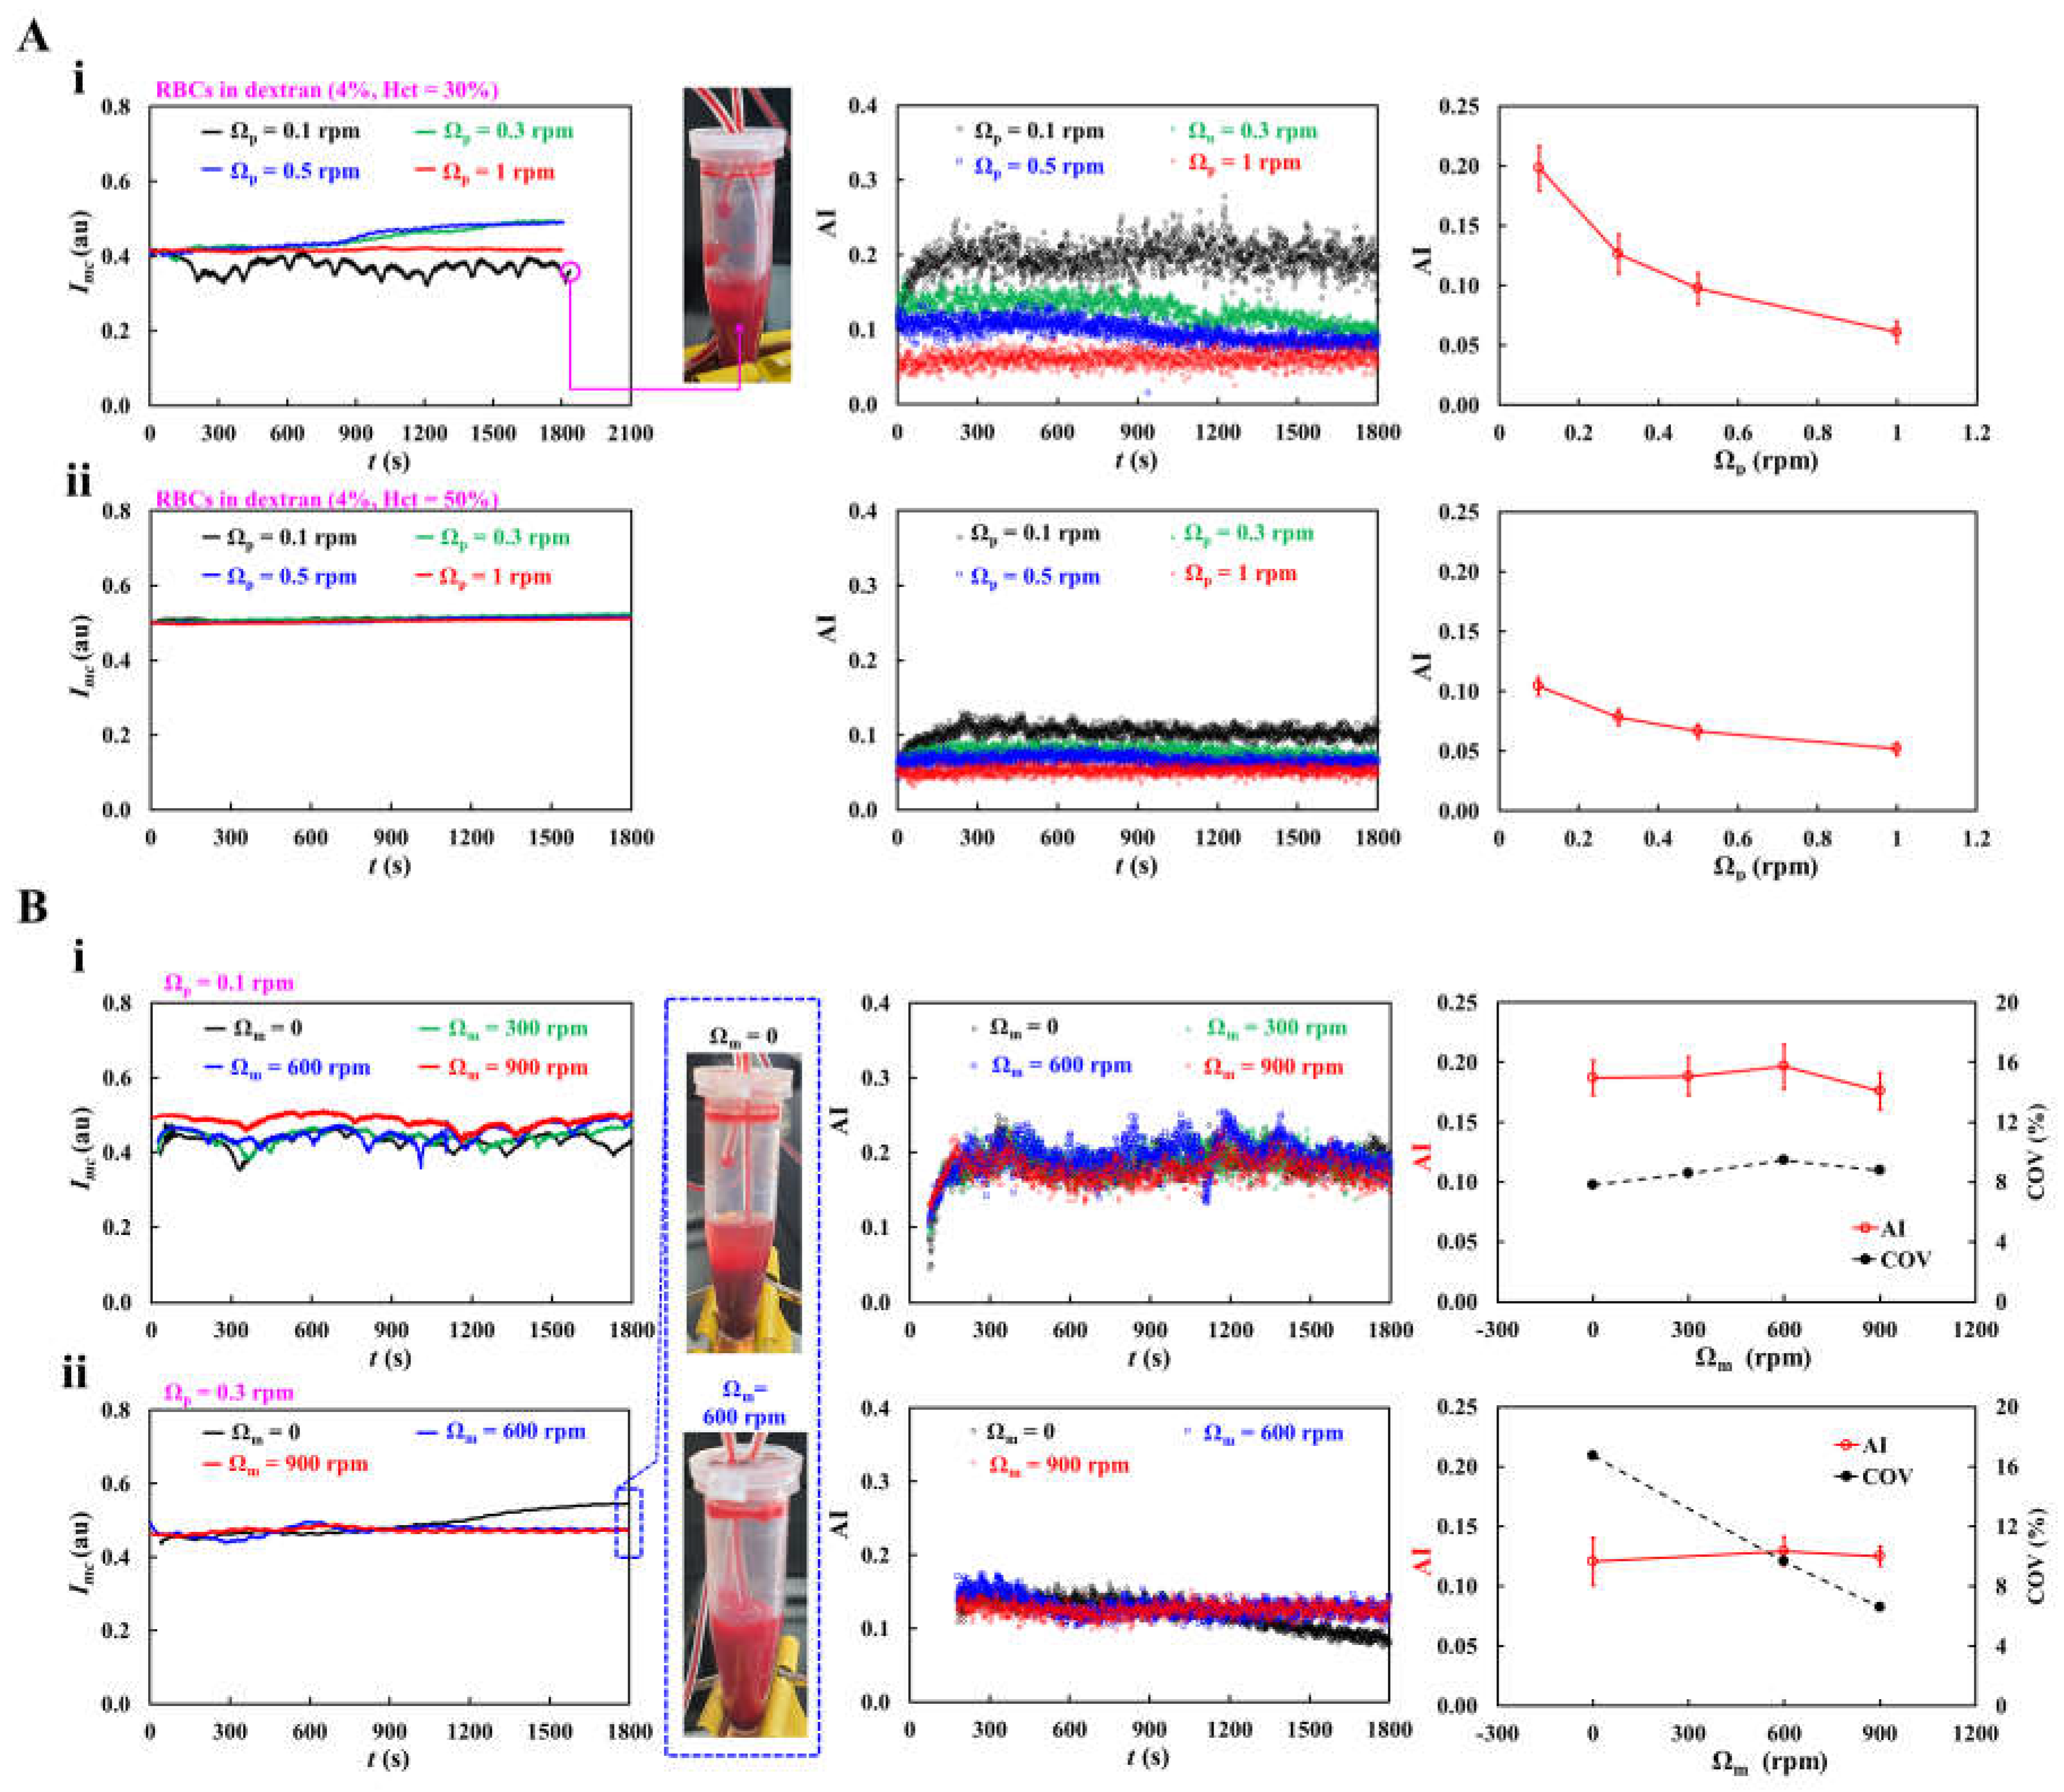
Figure 5.
Continuous measurement of RBC aggregation at different dextran concentrations in a closed-loop fluidic circuit. Test blood (Hct = 30%) was prepared by suspending normal RBCs in dextran solutions (Cdex = 1 ~ 4%). The pump and mixer were operated at Ωp = 0.3 rpm and Ωm = 900 rpm, respectively. (A) Effect of dextran concentration on flow stability. The left panel showed time-dependent Umc at Cdex = 1 ~ 4%. The middle and right panels summarized the mean velocities (<Umc>, <Utc>) and their COVs as a function of Cdex. (B) Effect of dextran concentration on AI. (i) The left panel showed time-dependent Imc as a function of Cdex. In the right panel, representative microscopic images of the main channel acquired at the end of the experiment (t = 1800 s) were shown for Cdex =1, 2, 3, and 4%. (ii) Spatial distributions of Itc in the test chamber. The left panel showed representative microscopic images acquired at t =1800 s. The right panel showed the corresponding Itc profiles against flow direction (x) with respect to Cdex. (iii) The upper panel showed time-dependent AI as a function of Cdex. The lower panel summarized variations of AI and COV as a function of Cdex.
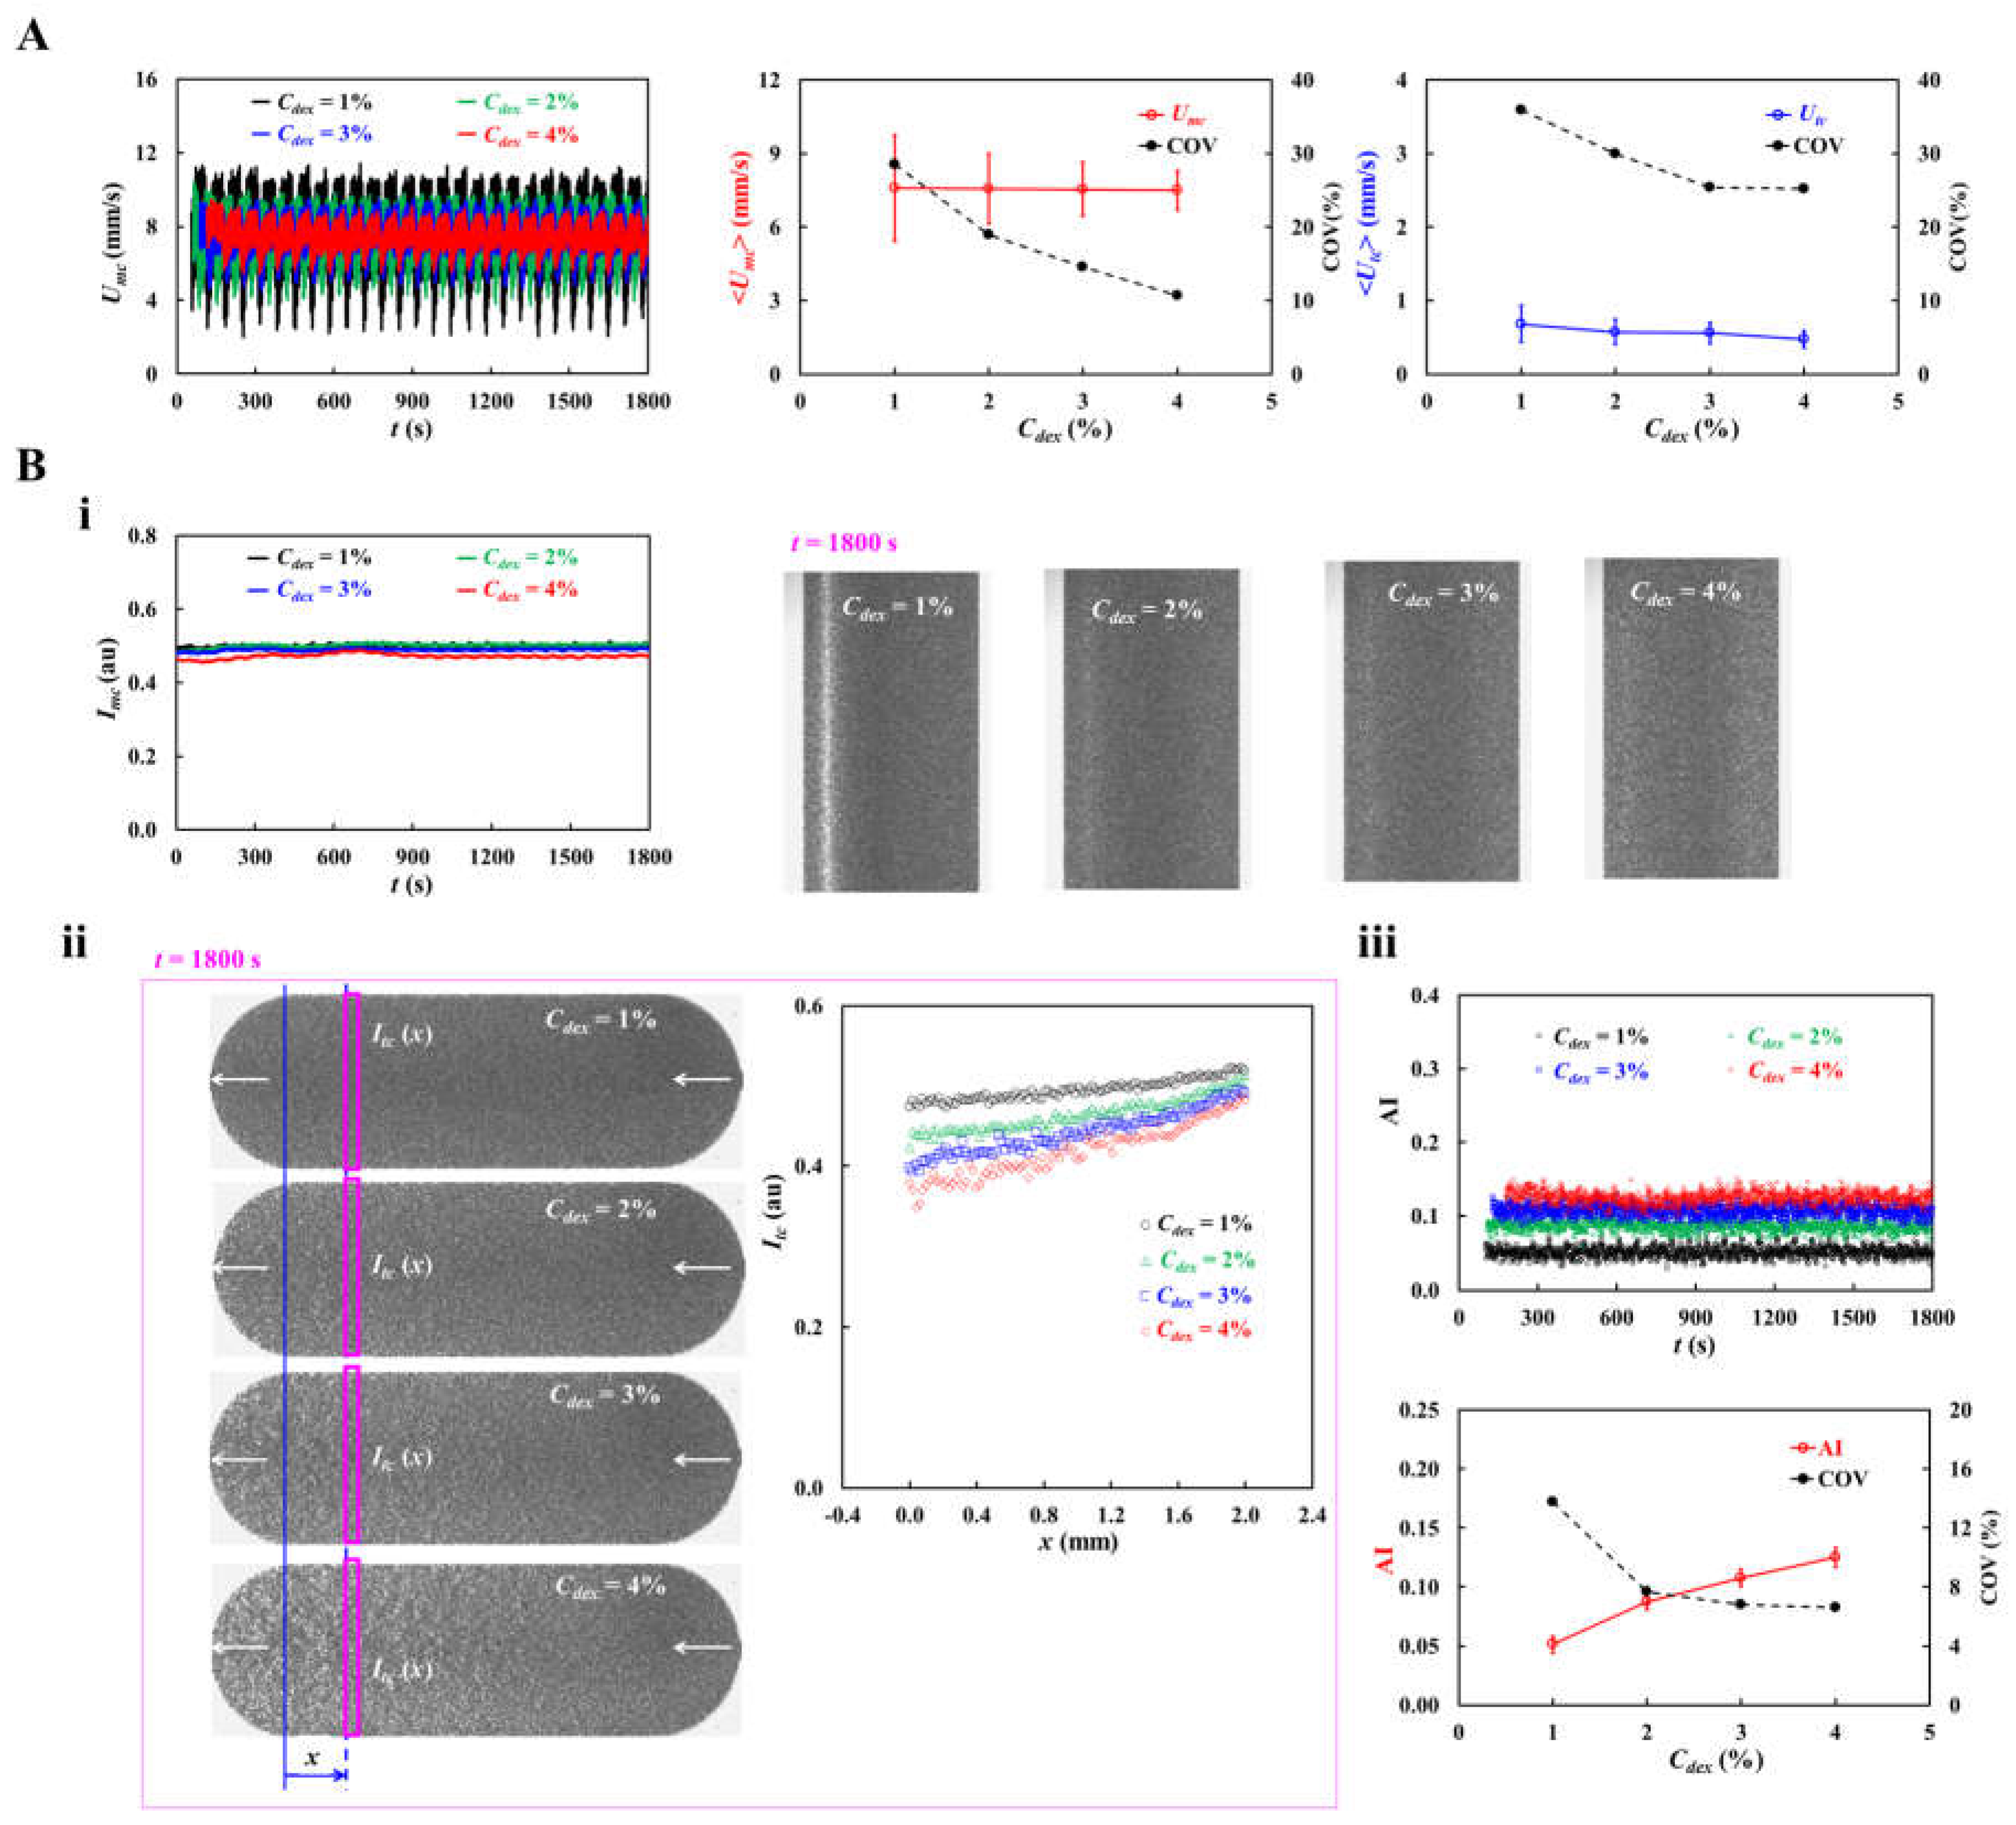
Figure 6.
Continuous monitoring of thermally induced RBC damage using the RBC aggregation index (AI). Test blood (Hct = 30%) was prepared by suspending normal RBCs in 4% dextran solution. The pump and mixer were operated at Ωp = 0.3 rpm and Ωm = 900 rpm, respectively. Using a thermal mixer, the test blood was exposed to temperatures ranging from T = 25 °C to T = 47 °C. The upper panel showed time-dependent Imc and AI at different exposure temperatures. In the lower panel, representative blood-flow images acquired at t = 180, 300, 1200, and 1800 s were shown for T = 45 °C. Imc and AI remained nearly constant over time at T ≤ 43 °C. However, at T ≥ 45 °C, the Imc increased substantially and AI decreased significantly, indicating substantial heat-induced changes in RBC aggregation behavior.
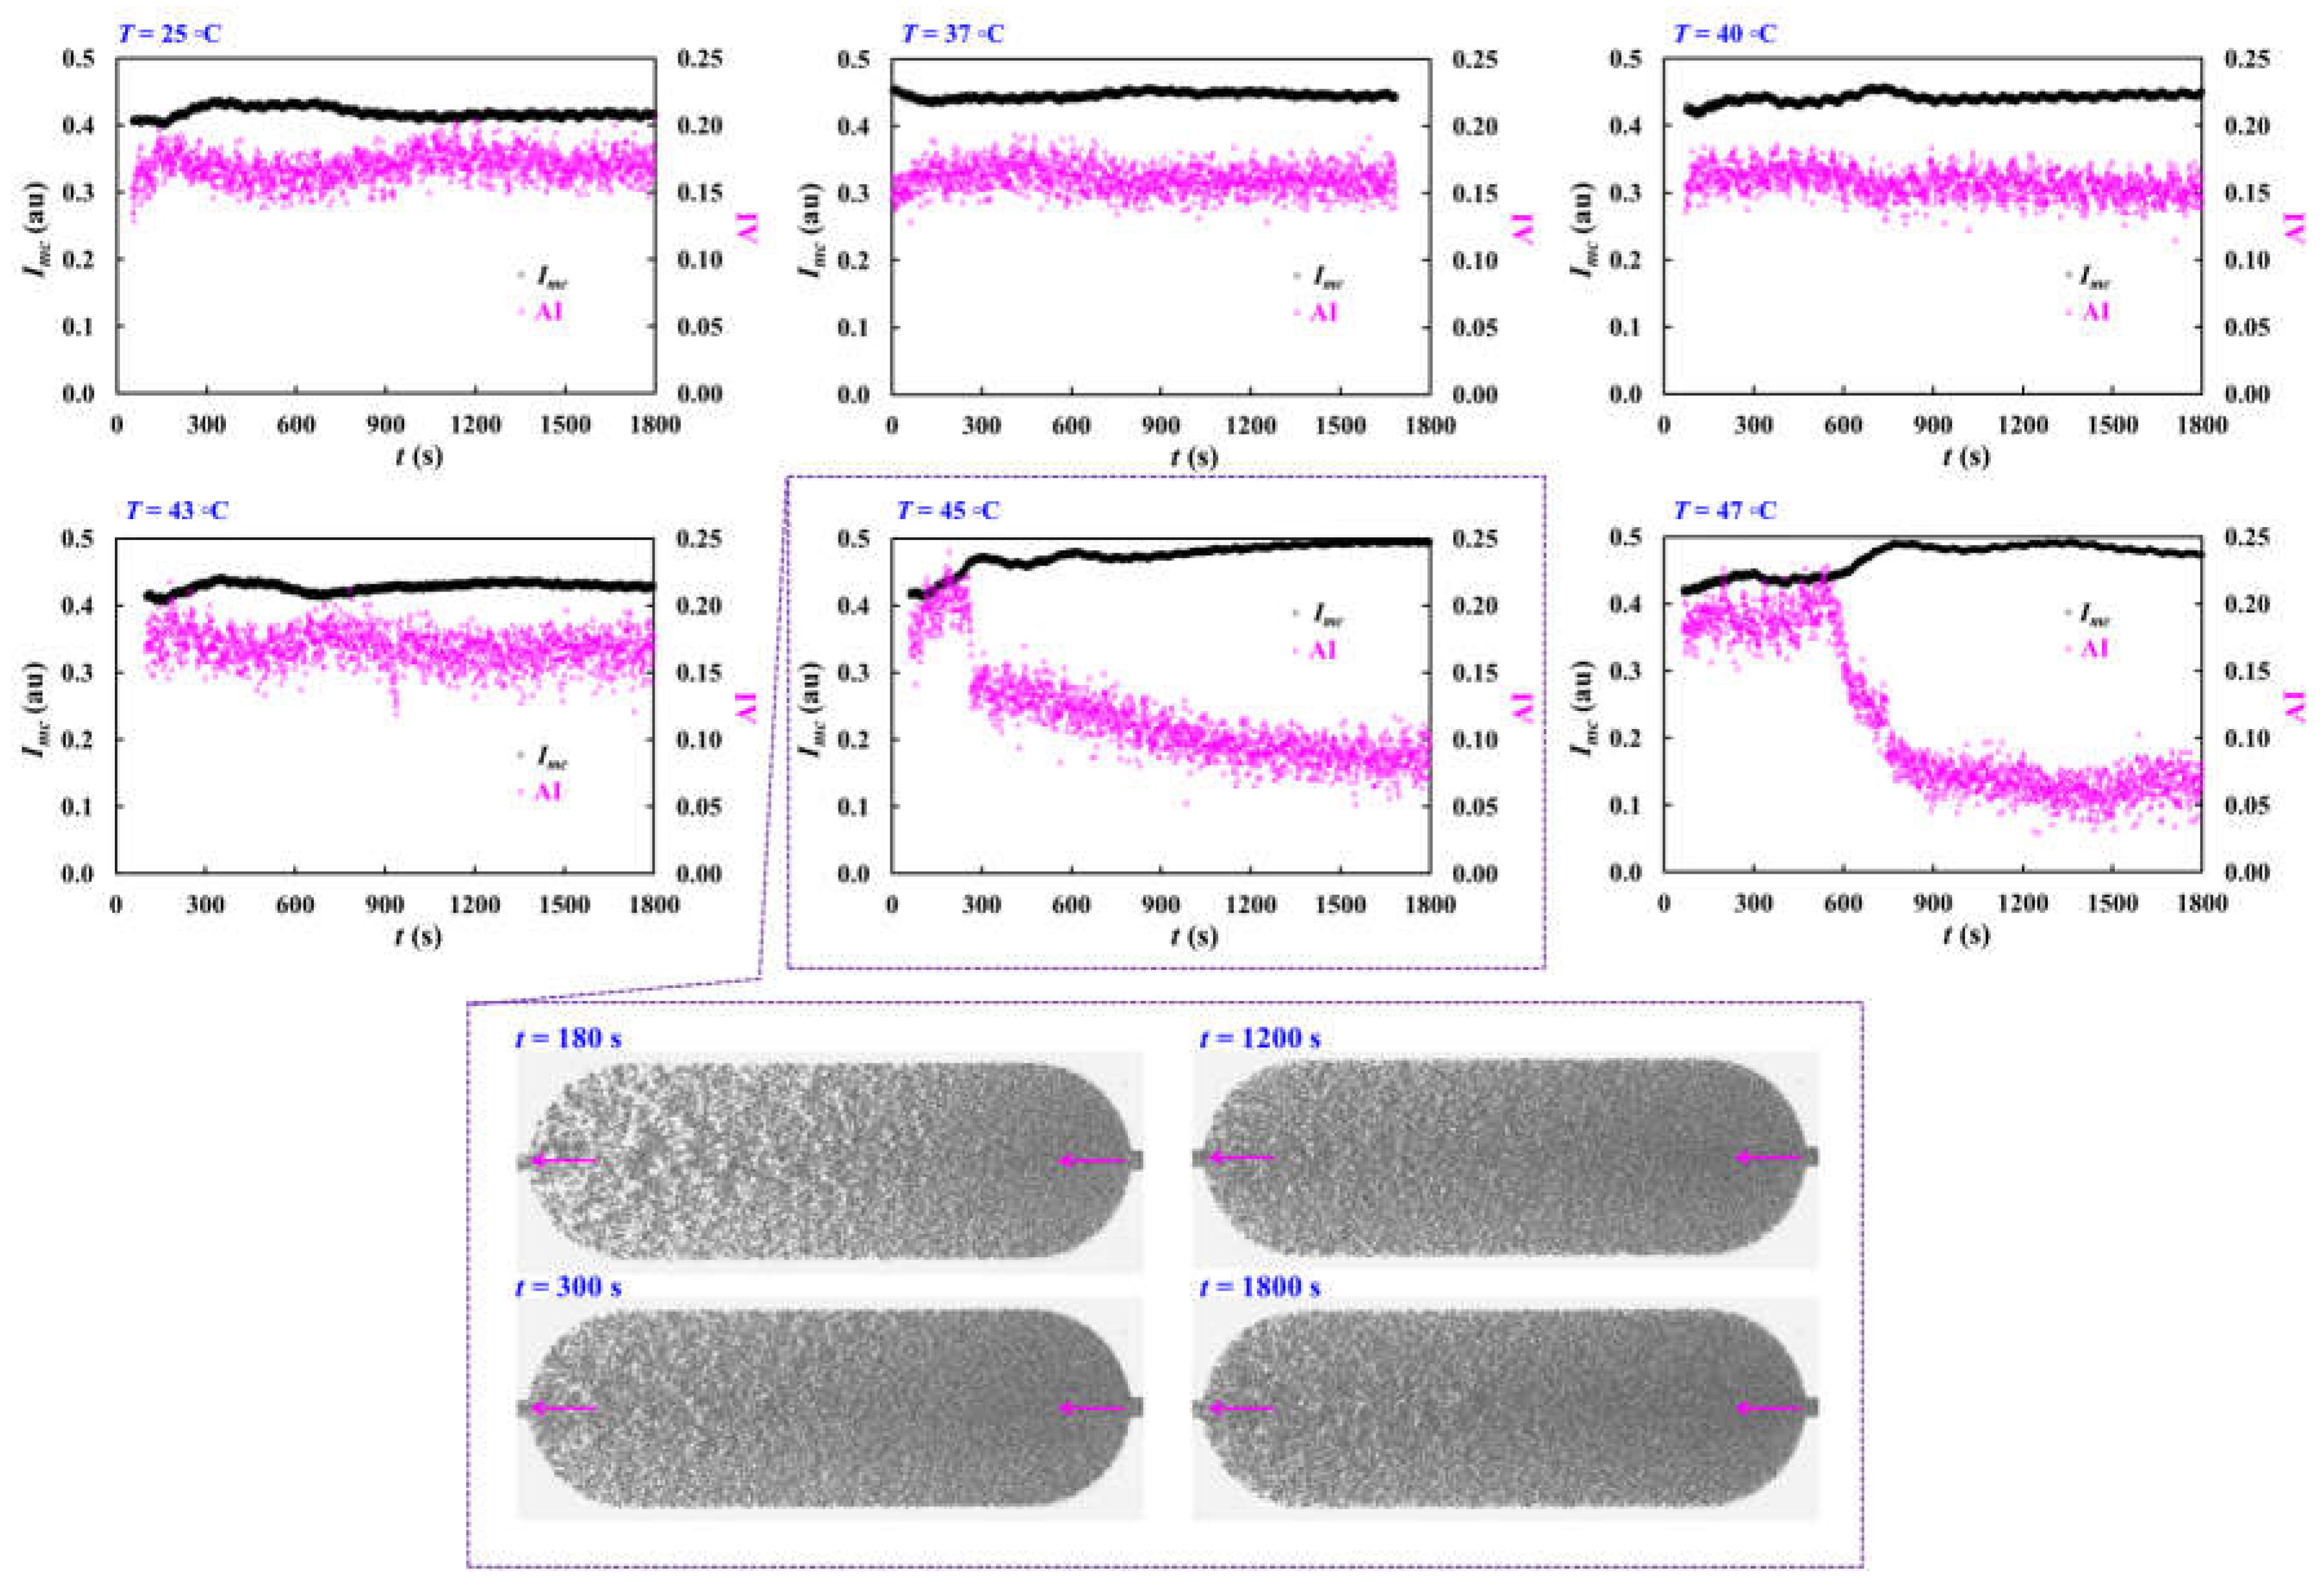
Disclaimer/Publisher’s Note: The statements, opinions and data contained in all publications are solely those of the individual author(s) and contributor(s) and not of MDPI and/or the editor(s). MDPI and/or the editor(s) disclaim responsibility for any injury to people or property resulting from any ideas, methods, instructions or products referred to in the content. |
© 2026 by the authors. Licensee MDPI, Basel, Switzerland. This article is an open access article distributed under the terms and conditions of the Creative Commons Attribution (CC BY) license (http://creativecommons.org/licenses/by/4.0/).
Copyright: This open access article is published under a Creative Commons CC BY 4.0 license, which permit the free download, distribution, and reuse, provided that the author and preprint are cited in any reuse.