
Submitted:
08 September 2026
Posted:
09 September 2026
You are already at the latest version
Abstract
Continuous thermal monitoring of aluminum electrolysis cells—which operate at ~950 °C under strong magnetic fields in a corrosive fluoride melt—remains an unsolved process monitoring challenge. This paper presents a fiber-optic Raman distributed temperature sensing (DTS) deployment for high-temperature cathode steel bar monitoring in a 380 kA industrial cell supplied by a grid with over 30% wind and solar penetration. A custom fiber ring packaging scheme, pressed against the underside of the cathode bar (temperature >300 °C), achieved >1 m thermal contact length within the confined space beneath the cell. Features encoding supply-side renewable power periodicity, thermal inertia, and local fluctuation intensity were engineered to anchor the learning task in the process physics of the electrolysis cell. CatBoost, LightGBM, and Random Forest were combined in a stacking ensemble with a linear regression meta-learner, attaining RMSE = 0.7451 °C and R2 = 0.9944 over two months of continuous industrial operation across seven cathode bars. Frequency-domain residual decomposition revealed why LightGBM—the aggregate-weakest base learner—received the dominant meta-learner weight (+2.15) while CatBoost—the aggregate-strongest—received a negative weight (−1.85): LightGBM uniquely minimized high-frequency error (1.06 vs. 1.29 °C for CatBoost). The ensemble advantage was spatially robust across all seven bars. The 0.75 °C RMSE establishes a noise floor for residual-based monitoring, demonstrating that process-informed feature engineering and frequency-resolved stacking ensemble learning deliver predictive accuracy suitable as a process monitoring baseline in high-temperature industrial environments under increasing renewable power penetration.
Keywords:
process monitoring
; domain-informed feature engineering
; stacking ensemble
; aluminum electrolysis
; predictive thermal modeling
; distributed temperature sensing
1. Introduction
Continuous thermal monitoring of high-temperature industrial processes remains a persistent engineering challenge. The difficulty is most acute when conventional sensors approach or exceed their physical limits. The Hall-Héroult process for primary aluminum production exemplifies this challenge at industrial scale. Aluminum electrolysis cells operate at approximately 950 °C under strong magnetic fields in a corrosive fluoride-based electrolyte—cryolite (Na3AlF6), with a NaF/AlF3 molecular ratio of 2.2–2.4. The cell’s cathode lining, a carbon-based refractory structure embedded with steel collector bars, undergoes gradual erosion over a typical service life of 4–7 years. As the lining degrades, molten electrolyte and liquid aluminum penetrate the carbon cathode blocks. This raises local electrical resistance and generates hot spots on the cathode steel bars. If undetected, this thermal runaway progresses to catastrophic molten metal leakage. Each unplanned shutdown costs hundreds of thousands of dollars in lost production and refractory repair [1,2,3,4,5].
Two fundamental limitations prevent existing temperature monitoring methods from providing reliable early warning in this environment. Thermocouples, the conventional contact sensor for industrial temperature measurement, degrade over time under sustained exposure to the corrosive fluoride atmosphere and extreme temperatures, requiring frequent replacement [6]. Handheld infrared thermometry, used during routine manual inspections, provides intermittent and irreproducible spot readings. These readings cannot capture the temporal dynamics of evolving thermal anomalies. Neither method delivers the spatial coverage, temporal continuity, or measurement reliability that process monitoring demands. A viable system must operate continuously over the cell’s entire multi-year production cycle.
The electrolysis cell’s physical environment imposes further constraints on any candidate sensor technology. The cell’s operating current—several hundred kiloamperes—generates magnetic fields strong enough to induce Faraday rotation of polarized light in optical fibers. This rules out phase-sensitive distributed sensing modalities outright. φ-OTDR (phase-sensitive Optical Time Domain Reflectometry), BOTDA (Brillouin Optical Time Domain Analysis), and FBG (Fiber Bragg Grating) arrays all depend on phase encoding. Under a strong DC magnetic field, polarization-state perturbations degrade their signals beyond reliable operation [7,8]. The fluoride-based cryolite melt is chemically aggressive, attacking metallic sensor components and most conventional packaging materials. The cathode steel bars are embedded at the bottom of the carbon cathode floor, directly above the refractory layer. The accessible surface of each bar faces downward. The available space for sensor installation is only a few centimeters. These combined constraints—extreme temperature, corrosive atmosphere, strong electromagnetic field, and restricted physical access— make the cathode bar one of the most sensor-hostile measurement locations in any continuous industrial process.
Raman scattering-based distributed temperature sensing (DTS) offers a monitoring approach that is physically compatible with all of these constraints [9,10,11,12]. The principle is well-established. A pulsed laser source injects light into a silica optical fiber. The intensity ratio of the anti-Stokes to Stokes Raman backscattered components is directly proportional to the local temperature along the fiber. Because Raman DTS measures a scalar intensity ratio rather than a coherent phase signal, it is intrinsically immune to Faraday rotation and magneto-optic Kerr effects—the very mechanisms that disable phase-sensitive fiber sensing in high-magnetic-field environments. The silica fiber serves simultaneously as the sensing element and the transmission medium. Its material composition provides inherent tolerance to high temperatures and chemical corrosion. Polyimide-armored fiber coatings extend the continuous operating range to 380 °C [13,14]. Raman DTS has been successfully deployed in nuclear waste repository monitoring, pipeline integrity management, and power cable temperature surveillance. These applications share a common requirement: long-term, distributed temperature measurement in environments where conventional electronic sensors cannot survive [15,16,17,18]. Wen et al. demonstrated the feasibility of deploying Raman DTS for bath temperature monitoring in an alumina electrolysis cell, confirming that the sensing hardware can survive the harsh operating conditions [19].
Extending Raman DTS to cathode steel bar temperature monitoring directly addresses the sensor-selection aspect of the monitoring problem. Converting the resulting measurements into actionable early-warning signals, however, requires understanding the physical composition of the temperature signal. The signal of a normally operating cell is a superposition of three physically distinct components. The first is a slowly varying baseline (peak-to-peak amplitude of 5–15 °C). This baseline is modulated by ambient temperature changes, anode replacement cycles, and alumina feeding schedules. The second consists of transient events—anode effects, metal tapping operations, and localized alumina concentration fluctuations—that produce rapid temperature excursions on sub-hour timescales. The third—and critical for this study—is the additional fluctuations introduced by renewable power intermittency. Such intermittency is increasingly relevant as aluminum smelters integrate high proportions of wind and solar generation into their energy mix. The cell studied in this work receives over 30% of its electricity from wind and solar generation. The physical mechanism is Ohm’s law: a drop in renewable power output reduces the DC operating current, which reduces I2R resistive heating at the cathode bar, producing sub-hourly thermal transients on the cathode bar temperature signal. Localized resistive heating from lining degradation produces rapid temperature deviations at sub-hour timescales. These deviations are easily masked by the much larger low-frequency baseline when only aggregate temperature metrics are considered [20,21]. Separating the temperature signal by frequency is therefore a prerequisite for any monitoring strategy that aims to distinguish normal thermal cycling from potential anomaly precursors.
Machine learning models—particularly gradient-boosted decision tree (GBDT) algorithms and ensemble methods—have demonstrated strong performance in industrial time-series prediction tasks. These tasks typically involve nonlinear relationships and complex interactions between input features and the target variable [22,23,24]. CatBoost uses symmetric (oblivious) tree structures and ordered boosting. This reduces overfitting from target leakage and makes CatBoost robust to the temporal dependencies present in industrial data. LightGBM uses leaf-wise tree growth with gradient-based one-side sampling (GOSS). GOSS prioritizes splits in regions of the feature space where the residual error is largest. This strategy may produce finer partitions specifically in the high-frequency regime. Random Forest builds an ensemble of decorrelated trees through bootstrap aggregation. Its variance-reduction mechanism complements the sequential error-correction approach of boosting. Stacking ensemble learning combines multiple base learners through a meta-learner trained on their cross-validated predictions. This architecture is a natural fit for exploiting these complementary algorithmic strengths [25]. Within the stacking framework, the meta-learner coefficients—the weights assigned to each base model—offer interpretable insight into how the ensemble arrives at its final prediction. When combined with frequency-domain decomposition of the prediction residuals, this architecture can reveal which base learners contribute at which timescales. The result is both predictive accuracy and process understanding.
Positioning relative to prior work. Deploying Raman DTS on cathode steel bars is not a new concept—distributed fiber optic temperature measurement on cathode bars has existing engineering practice in the aluminum electrolysis industry. However, these existing practices are concentrated in grid-supplied cells, where the temperature signal contains only the conventional low-frequency thermal baseline (diurnal cycling, anode replacement) and occasional anomalous transients. The high-penetration renewable power scenario fundamentally changes the monitoring conditions: sub-hour fluctuations in renewable power output introduce a high-frequency component into the cathode bar temperature signal that is absent in grid-supplied cells. In this complex frequency-domain environment, a complete DTS deployment with an accompanying frequency-domain analysis method has not been reported.
On the data analysis side, existing cell condition monitoring methods—including the spatial distribution clustering of Sun et al. and the knowledge-data-driven predictive model of Wang et al.—use conventional thermocouples or process variables as data sources and do not address the high-dimensional time-series data produced by distributed fiber optic sensing [3,4]. Wen et al. deployed Raman DTS in the upper gas space of an aluminum electrolysis cell for bath temperature monitoring, but reported only hardware feasibility verification without frequency-domain data analysis for thermal anomaly detection [19]. The present study differentiates itself from prior work along two dimensions: (a) deployment scenario—a cell under high-penetration (>30%) renewable power, where the temperature signal simultaneously contains renewable-driven short-cycle thermal transients and potential lining degradation signals, and their frequency-domain separation constitutes a process monitoring challenge distinct from grid-supplied cells; and (b) analysis method—frequency-domain residual decomposition-driven stacking ensemble learning that exploits the complementary capabilities of base learners in different frequency bands to achieve fine-grained temperature prediction, establishing a statistical baseline for distinguishing normal fluctuations from potential anomaly signals.
This paper presents an integrated process monitoring solution that combines Raman DTS hardware deployment, domain-informed feature engineering, and stacking ensemble learning for predictive thermal modeling in aluminum electrolysis cells under high-penetration wind and solar power. The specific contributions are: (i) A Raman DTS deployment for high-temperature cathode steel bar monitoring in an industrial 380 kA cell. The cell is supplied by a grid with over 30% wind and solar penetration. A custom packaging scheme achieves >1 m thermal contact length on the underside of the cathode bar. (ii) A process-informed feature engineering strategy that encodes supply-side periodicity, thermal inertia, and local fluctuation intensity as explicit features. This anchors the learning task in the physical dynamics of the electrolysis process. (iii) A stacking ensemble combining CatBoost, LightGBM, and Random Forest with a linear regression meta-learner. The ensemble achieved RMSE = 0.7451 °C and R2 = 0.9944 on two months of continuous industrial data across seven spatially distributed cathode bars. (iv) A meta-learner coefficient analysis revealing that the aggregate-weakest base learner receives the dominant stacking weight. This finding demonstrates the importance of frequency-domain complementarity in ensemble design for industrial process monitoring.
2. Materials and Methods
2.1. Data Collection
A commercial Raman optical time-domain reflectometer (DTS-BLY-5S(STD)) was used as the distributed temperature measurement system. The system launches a pulsed laser source into the sensing fiber and analyzes the backscattered Raman Stokes and anti-Stokes components. The intensity ratio of these two backscattered components is proportional to the local temperature at each fiber position. A continuous temperature profile is reconstructed at meter-scale spatial resolution. The key specifications of the measurement system are listed in Table 1.
The DTS system was installed on the cathode steel bars of a 380 kA prebaked anode Hall-Héroult aluminum electrolytic cell at the Huomei-Hongjun smelter in Inner Mongolia, China. The cell operated under normal production conditions throughout the two-month data collection period. The cell’s operating parameters are summarized in Table 2. The regional power grid supplying this smelter derives over 30% of its electricity from wind and solar generation. This subjects the cell to the short-cycle current fluctuations described in Section 1.
The sensing element was a polyimide-armored multimode optical fiber (MM62.5/125/155HTPI, rated for continuous service at 380 °C). This choice followed the comparative evaluation of fiber coatings for high-temperature Raman DTS reported by Laarossi et al. (2019) [13]. Polyimide was chosen over acrylic, silicone, and carbon-coated alternatives because of its demonstrated mechanical integrity and minimal attenuation increase after prolonged thermal exposure at temperatures up to 380 °C. The fiber was coiled into a ring-shaped assembly within a custom-designed ceramic packaging device. This assembly was pressed firmly against the underside of the cathode steel collector bar. The packaging scheme achieved a contact length exceeding 1 m with the bar surface, ensuring reliable thermal coupling for temperature measurement. The fiber exited the cell through a sealed side port and connected to the DTS interrogator located outside the cell enclosure.
The field trial was conducted at a smelter facility in continuous operation for over 20 years. The electrolysis cells at this facility are of an older, low-profile design. The vertical clearance between the cathode floor and the cell bottom steel structure measures less than 0.5 m. At the locations of the cathode steel bars the space is extremely confined, and at some bars installation is exceedingly difficult, with a hand barely able to reach in. The working space beneath the cell is further restricted by structural steel supports, busbar assemblies, and exhaust ducts. The environment combines elevated ambient temperature (50–65 °C), airborne fluoride compounds, and a DC magnetic field of several hundred gauss. Direct manual temperature measurements with handheld infrared instruments are limited to brief inspection sessions—typically a few minutes—due to the cumulative physical strain on the operator from the combined heat, restricted posture, and magnetic field exposure.
These practical constraints, rather than sensing performance alone, drove the packaging design. The scheme had to support a single rapid operation. It had to eliminate precision alignment, repeated adjustments, and extended human presence beneath the cell. The clamping device developed for this purpose can be positioned and secured within minutes by a technician working from the cell’s side access port, after which all subsequent data acquisition and system monitoring are conducted remotely from the control room. The cell cross-section and the integration of the monitoring system are illustrated in Figure 1.
The DTS system interrogated the fiber at regular intervals. Each measurement cycle produced a spatially resolved temperature profile along the fiber. The cathode bars of this cell are distributed along both longitudinal sides, with 30–60 bars on each side. Field-trial constraints—limited access windows, confined working space, and the manual installation required for each assembly—limited sensor installation to seven cathode bars, designated Bars 1 through 7. These bars cover a section of the cell’s longitudinal span, not the full array. Data were transmitted to the control-room industrial computer via the optical fiber connection. Sensor dropout events were identified and removed prior to analysis. These events—readings flagged as −100 °C in the raw data stream—accounted for approximately 2–3% of total readings. They were attributed to occasional fiber connector interruptions during the field trial. Valid sample counts varied across bars due to intermittent power interruptions inherent in the production environment. The resulting dataset comprised two months of spatiotemporal temperature measurements under continuous industrial operating conditions. This provided a field-validated foundation for the process monitoring framework described in the following sections.
2.2. Domain-Informed Feature Engineering
Feature construction was guided by process knowledge of the thermal dynamics of the aluminum electrolysis cell. Three categories of features were defined, each corresponding to a distinct physical mechanism that governs the temperature evolution of the cathode bar assembly. The rationale for each feature type, and its specific relevance to the high-penetration renewable power operating scenario, is described below.
Cyclical temporal features. The electrolysis cell’s thermal state is subject to periodic modulations from multiple sources: the diurnal ambient temperature cycle, the approximately 24-h periodicity of anode replacement schedules, metal tapping operations, and—most relevant to the present deployment—the supply-side power fluctuations introduced by high-penetration wind and solar generation. Wind and solar power output varies on diurnal and sub-diurnal timescales with solar irradiance, cloud cover, and wind speed; these variations propagate directly into the cell’s operating current and, consequently, into the cathode bar temperature. To encode these periodic dynamics, the temporal index of each measurement point was transformed using a sine-cosine encoding scheme:
where is the number of data points corresponding to one full diurnal cycle, determined from the data acquisition rate. The sine/cosine pair preserves the phase information of the periodic signal while avoiding the discontinuity at midnight that arises from discrete hour-of-day encoding. This representation allows the model to learn cyclic patterns—including those induced by renewable generation variability—as continuous, differentiable features.
Lag Features. The cathode bar temperature exhibits strong temporal autocorrelation due to the substantial thermal mass of the cell assembly. The carbon cathode blocks, steel collector bars, and refractory insulation layer collectively constitute a thermal reservoir with a characteristic thermal response time; a temperature perturbation at time t decays gradually over subsequent measurement intervals, rather than vanishing instantaneously. To capture this inertial dynamics, lagged temperature values were generated as features, allowing the model to learn the rate at which thermal energy dissipates through the cell structure. These 24 lag steps encode the recent thermal history of the cathode bar assembly.
Sliding-window statistics. Local fluctuation intensity—the variability of temperature over a rolling window—serves as a sensitive indicator of thermal instability. In the context of a cell supplied by high-penetration renewable power, short-cycle current fluctuations manifest as elevated variance in the temperature signal at sub-hourly timescales, a signature that would be absent in a grid-supplied cell. Two rolling statistics were computed over a window of 10 consecutive data points:
The sliding-window mean suppresses sensor noise and extracts the local thermal trend. The sliding-window standard deviation captures the instantaneous fluctuation amplitude; elevated values serve as early indicators of process disturbance, including the onset of abnormal resistive heating. The 10-point window length was selected as a compromise: too short a window amplifies sensor noise and produces erratic feature values, while too long a window smooths out the transient signals of interest—particularly the sub-hourly fluctuations driven by renewable intermittency.
After feature generation, rows containing NaN values resulting from the leading-edge lag and window operations were discarded. The final feature set comprised approximately 30 features per prediction point: the time index, the sine and cosine cyclical components, 24 lagged temperature values, and two sliding-window statistics (rolling mean and rolling standard deviation). The measured temperature value itself is not included as a direct feature; the sliding-window statistics incorporate the current measurement through the rolling computation, providing local contextual information without exposing the model to the raw target value.
2.3. Prediction Models and Stacking Ensemble
Base learners. Three gradient-boosted decision tree algorithms were selected as base learners for the stacking ensemble, each chosen for its distinct learning strategy:
CatBoost (CatBoostRegressor) employs symmetric (oblivious) tree structures in which the same split feature and threshold are applied at each node of a given tree depth. This structural regularity, combined with ordered target encoding and ordered boosting, reduces overfitting from target leakage and provides robustness to the temporal dependencies present in time-series data from industrial processes. Key hyperparameters were set as follows: iterations = 1000, learning_rate = 0.1, depth = 6.
LightGBM (LGBMRegressor) uses leaf-wise tree growth, expanding the most informative leaf at each iteration rather than growing trees level by level. Its gradient-based one-side sampling (GOSS) strategy prioritizes splits on training samples that contribute most to the current residual error, potentially producing finer partitions in regions of the feature space where the thermal dynamics are complex or nonlinear. Key hyperparameters: n_estimators = 1000, learning_rate = 0.1, depth = 6, num_leaves = 31.
Random Forest (RandomForestRegressor) builds an ensemble of decorrelated decision trees through bootstrap aggregation and random feature subset selection at each split. Its variance-reduction mechanism—averaging over many trees trained on different bootstrap samples—differs fundamentally from the sequential error-correction approach of boosting, providing a complementary source of diversity within the stacking ensemble. Key hyperparameters: n_estimators = 100, max_depth = 10, min_samples_split = 5.
All base learner hyperparameters, summarized in Table 3, were configured based on preliminary experiments and standard practice for industrial temperature prediction tasks. All models were trained with a fixed random seed (random_state = 42) to ensure full reproducibility of the results.
Stacking ensemble architecture. The stacking framework [25] combines the three base learners through a linear regression meta-learner, as illustrated in Figure 2. The training procedure followed the standard two-level protocol:
- Cross-validated meta-feature generation. The training set was divided into five folds. For each base learner, predictions on each fold were generated by a model trained on the remaining four folds. This 5-fold cross-validation procedure prevents information leakage from the training labels into the meta-features—a critical consideration for obtaining unbiased stacking weights. The resulting out-of-fold predictions for all training samples formed the meta-feature matrix.
- Meta-learner training. A linear regression model was fitted on the meta-feature matrix to predict the true temperature values. The learned coefficients represent the relative weight assigned to each base learner in the ensemble:
- 3.
- Final prediction. After the meta-learner weights were learned, all base learners were retrained on the full training set. For test samples, predictions from the retrained base learners were passed through the linear meta-learner to produce the stacking ensemble output.
The dataset was split chronologically into training (first 80%) and test (final 20%) sets, preserving the temporal ordering of the time series to avoid look-ahead bias. This chronological split is standard practice for time-series process monitoring applications and ensures that the evaluation reflects real-world deployment conditions where the model must predict future states from past observations.
3. Results
In this paper, “thermal anomaly detection” refers to a residual-based anomaly discovery method: the model learns the cathode bar temperature dynamics under normal operating conditions; when the actual temperature consistently and significantly deviates from the model prediction, that deviation is flagged as a potential anomaly. The two-month dataset encompasses normal production conditions and does not contain known lining failure events. This reflects industrial reality: the lining lifetime of a 380 kA cell is measured in years, and a complete failure event within a two-month observation window is statistically very low probability. This paper’s contribution is therefore positioned as the predictive capability infrastructure for predictive thermal modeling: establishing a high-precision temperature dynamics model (RMSE = 0.7451 °C) and a frequency-domain-decomposed Stacking ensemble framework that sets the statistical baseline for residual monitoring. When a real anomaly event occurs in the future, the 0.75 °C noise floor provided by this model enables 2–3 °C-level thermal deviations to be detected with high signal-to-noise ratio. The complete validation loop—from predictive modeling to residual anomaly detection to verified failure cases—requires multi-year longitudinal tracking, which we list as a priority for future work.
3.1. Predictive Performance
The persistence baseline () is the simplest possible forecasting strategy: predicting the next temperature as the current measurement. It quantifies the intrinsic autocorrelation strength of the cathode bar temperature, achieving R2 = 0.9543 and RMSE = 2.1353 °C. This confirms a strong autocorrelated background, but also shows that naively relying on sequence continuity is insufficient. The stacking ensemble attained the lowest values across all metrics , as summarized in Table 4: MSE of 0.5552, RMSE of 0.7451 °C, MAE of 0.5184 °C, and R2 of 0.9944. Among the three GBDT base learners, CatBoost delivered the strongest single-model result (R2 = 0.9857, RMSE = 1.1930 °C, MAE = 0.9490 °C). Random Forest followed with R2 = 0.9819 and RMSE = 1.3432 °C. LightGBM—despite its leaf-wise strategy that targets high-gradient regions—produced the lowest single-model R2 (0.9706) and the highest RMSE (1.7045 °C). The margin between the stacking ensemble and the best single base learner (CatBoost) was substantial: a 0.45 °C reduction in RMSE, or 37.5%. Compared with the persistence baseline, the stacking ensemble reduced RMSE by 65.1% (from 2.1353 °C to 0.7451 °C), confirming that the machine learning models capture predictive information beyond the autocorrelation structure.
From an industrial process monitoring perspective, this improvement carries practical significance. The RMSE of 0.75 °C establishes a precision floor for the monitoring system. Under normal conditions, the model’s temperature predictions deviate from measured values by less than 1 °C on average. This accuracy is sufficient to detect abnormal thermal excursions—deviations of 2–3 °C above the expected baseline—at a signal-to-noise ratio high enough to trigger an alarm before escalation. In practice, a process control system incorporating this model could issue an early warning when the prediction residual exceeds 2× RMSE (approximately 1.5 °C). This would give plant operators hours to days of advance notice before a hot spot develops into a through-lining penetration event. The operational value of the stacking ensemble relative to the persistence baseline is evident: the persistence baseline has an RMSE of 2.14 °C, and the stacking ensemble compresses this to 0.75 °C—a reduction of 1.39 °C. A lower noise floor allows a more sensitive detection threshold without sacrificing false-alarm control, bringing anomaly recognition forward to the early 2–3 °C stage when the response window is hours to days. Operationally, the complete monitoring loop proceeds as follows. At each measurement cycle, the stacking model outputs a temperature prediction . Upon receiving the measured value , the residual is computed. When exceeds (approximately 1.5 °C) for consecutive cycles, the system issues an alarm. The operator responds with an IR spot-check verification at the affected bar and, if the trend persists, schedules a preventive inspection during the next planned maintenance window. Under the assumption of approximately normal residuals, the probability of a single-point false alarm at the threshold is approximately 4.5%. Requiring three consecutive exceedances reduces the false-alarm probability to approximately 0.01%, providing a reliability metric alongside temperature sensitivity.
The performance gap between the stacking ensemble and its constituent base learners warrants closer examination. The 37.5% RMSE reduction over CatBoost—already a strong predictor—points to genuinely complementary predictive capabilities among the three base learners, not marginal gains from model averaging. Figure 3 visualizes this comparison through the distribution of prediction errors for each model. The stacking ensemble achieved the lowest mean error. RMSE imposes a quadratic penalty on large deviations. A lower RMSE thus implies fewer large-magnitude prediction errors—the very errors that drive false alarms in industrial monitoring.
3.2. Meta-Learner Coefficient Analysis
The linear regression meta-learner coefficients provide direct insight into how the stacking ensemble weights its constituent models. The learned stacking equation for the Bar 1 model was:
This coefficient distribution is notable for two reasons. First, LightGBM—the base learner with the lowest single-model R2 (0.9706)—received the largest positive weight (+2.15), nearly 2.5 times the weight assigned to Random Forest (+0.85). Second, CatBoost—the strongest single model (R2 = 0.9857)—received a negative coefficient (−1.85). Its predictions are subtracted from the ensemble rather than added. This counter-intuitive distribution cannot be dismissed as an artifact of data leakage. The 5-fold cross-validation procedure ensures that each base learner’s out-of-fold predictions are independent of the target labels.
To understand why the meta-learner assigns the strongest weight to the aggregate-weakest model and a negative weight to the aggregate-strongest, the prediction residuals were analyzed in the frequency domain. Each model’s residual time series on the test set was decomposed into low-frequency and high-frequency components using fourth-order Butterworth filters. The cutoff was set to a data-point count corresponding to approximately one hour of measurements, with the normalized cutoff frequency computed from this count and the measurement sequence’s Nyquist limit. The cutoff was chosen based on the physical timescales of the electrolysis process. Transient thermal events from localized resistive heating evolve over sub-hour timescales. In contrast, the diurnal cycle, ambient temperature drift, and grid-driven baseline fluctuations occur at periods longer than one hour. The low-frequency component captures slow thermal drift (periods longer than the cutoff data-point count, corresponding to more than one hour). The high-frequency component captures rapid transients (periods shorter than the cutoff data-point count, corresponding to less than one hour). Whether lining failure precursors preferentially occupy the high-frequency band remains an open hypothesis requiring labeled event data for independent verification.
The frequency-resolved RMSE values revealed a striking contrast. At low frequencies, all three base learners achieved RMSE values around 0.18 °C. At high frequencies—the regime of interest for anomaly detection—the models diverged sharply. LightGBM achieved a high-frequency RMSE of 1.06 °C, substantially lower than CatBoost (1.29 °C) and Random Forest (1.22 °C). LightGBM’s leaf-wise strategy prioritizes splits where the residual gradient is largest. This appears to produce finer partitioning specifically in the high-frequency regime—the same regime where the meta-learner assigns LightGBM its dominant weight. CatBoost’s symmetric tree structure, in contrast, excels at capturing the global thermal structure of the signal, which explains its superior aggregate R2. But this comes at the cost of reduced resolution on the rapid, small-magnitude transients that characterize the high-frequency band. Varying the cutoff data-point count within a reasonable range around the one-hour equivalent produced stable meta-learner coefficient signs and relative rankings, indicating that the frequency-domain complementarity finding is not sensitive to the particular filter parameter choice.
This frequency-domain analysis resolves the apparent paradox of the negative CatBoost coefficient. The large negative weight (−1.85) does not imply CatBoost predictions are harmful. Rather, it reflects the fact that all three base learners share substantial redundant low-frequency information. The meta-learner forms a pairwise contrast (+2.15 − 1.85 ) that cancels the common low-frequency baseline while amplifying LightGBM’s narrow advantage in the high-frequency band. The Random Forest coefficient (+0.85) provides supplementary variance reduction through its bagging mechanism. This interpretation is consistent with the high Pearson correlations among the base learner predictions (Figure 4): the meta-learner must introduce negative weights to decorrelate the shared signal components before recombining them. Figure 5 shows how these learned weights map each base learner's prediction onto the final stacking output.
This finding has a significant practical implication. When the physical quantity of interest resides in a specific frequency band, aggregate accuracy metrics may not adequately reflect model performance in that band. A model strongest in aggregate may be suboptimal for the specific detection task. A model weaker in aggregate may possess a narrow advantage in the frequency range that matters most. This principle is particularly relevant in these cells, where short-cycle current fluctuations introduce a distinct high-frequency component into the thermal signal. The stacking ensemble, through its interpretable linear meta-learner, provides a systematic mechanism for identifying and exploiting such frequency-domain complementarities. These results, however, are limited to a single 380 kA cell. Generalization to other cells and other smelters requires cross-cell validation and cross-site transfer learning studies.
Spatial robustness: To assess whether the observed ensemble advantage generalizes across measurement positions, the same stacking procedure was applied to temperature data from all seven cathode bars. The stacking ensemble achieved the lowest RMSE on every bar, confirming that the performance advantage reflects a general property of the ensemble design, not a Bar-1 artifact. The relative ranking of the base learners varied across bars. CatBoost was the strongest single model on bars 1–4. Random Forest outperformed CatBoost on bars 5 and 6. The ensemble consistently outperformed both, demonstrating that frequency-domain complementarity operates across spatially heterogeneous thermal conditions. The variation in absolute RMSE across bars reflects genuine spatial thermal heterogeneity within the cell. This is likely due to differences in local refractory conditions and cooling patterns. For example, LightGBM RMSE ranged from 1.70 °C on to 3.43 °C across the bars. The stacking ensemble’s advantage persists across this range of baseline error levels. This supports the robustness of the approach for practical deployment, where thermal conditions across the cathode bar array are inherently non-uniform. These results, however, are limited to a single 380 kA cell. Generalization to other cells and other smelters requires cross-cell validation and cross-site transfer learning studies.
Implications for process monitoring under renewable power integration. The smelter where these measurements were collected operates with over 30% wind and solar generation. Short-cycle current fluctuations superimpose additional thermal transients on the cathode bar temperature signal. These transients occupy the same frequency band as early-stage lining failure precursors. The frequency-domain stacking framework addresses this directly. By decomposing prediction residuals into frequency bands and examining which base learner contributes at each band, it provides a principled method for extracting the diagnostic signal from renewable-driven thermal fluctuations. Aluminum smelters worldwide are moving toward decarbonization and increased renewable energy integration, driven by regulatory pressure and cost optimization. Process monitoring approaches designed for renewable power variability will become increasingly essential. The framework presented here—frequency-resolved ensemble learning combined with process-informed feature engineering—offers a practical methodology for this emerging operational paradigm.
Practical deployment and cost considerations. Beyond predictive performance, practical viability depends on sensor cost, installation complexity, and maintainability over the cell’s production cycle. The initial deployment used polyimide-armored fiber rated for sustained operation at 380 °C. A parallel test using standard acrylic-coated multimode fiber—without high-temperature-rated coating—was also installed on an adjacent cathode bar for comparative observation. Polyimide-armored fiber is well within its rated range for the measured cathode bar surface temperatures (>300 °C). Standard coated fiber, however, has not yet been fully characterized under sustained thermal and chemical exposure in this environment. Systematic aging tests are ongoing. The commercial significance of this comparison is clear: standard multimode fiber (MM62.5/125) costs approximately one-tenth that of its polyimide-armored equivalent and is available from multiple vendors without lead time. If ongoing tests confirm adequate service life, the sensor material cost would drop below that of an equivalent thermocouple array. This would remove the primary economic barrier to wide-area DTS deployment in smelters. The packaging design was also iteratively simplified over the course of the field trial. The initial steel clamping assembly required threaded tensioning fixtures and repeated alignment checks during installation. The revised design adopted an underside-support principle: a bracket supports the ceramic-packaged fiber ring from below and presses it against the cathode bar underside. A wing nut replaces the earlier precision threaded fastener, allowing tool-free hand-tightening and release. This reduced the single-bar installation time from tens of minutes to several minutes. It should be noted that one side of an electrolysis cell contains 30–60 cathode bars; full-side installation still requires several hours of orderly work. However, the per-bar simplification compresses the total labor investment by an order of magnitude relative to the threaded tensioning scheme. In locations where busbar assemblies severely obstruct conventional tool access, the bracket installs from a single lateral approach angle without requiring the operator to reach across or beneath obstructed zones. These two developments—potential sensor cost reduction through standard fiber, and installation simplification through the revised bracket—address the most commonly cited barriers to adopting fiber-optic sensing in heavy industrial environments: initial capital expenditure and perceived maintenance burden.
4. Conclusions
This paper presents a predictive thermal modeling framework for aluminum electrolysis cells. The framework combines a fiber-optic Raman DTS deployment on cathode steel bars (temperature >300 °C), process-informed feature engineering, and a stacking ensemble of CatBoost, LightGBM, and Random Forest. It was validated on two months of industrial data from seven cathode bars in a 380 kA cell under >30% renewable power penetration. RMSE reached 0.7451 °C and R2 reached 0.9944.
The key finding is that LightGBM—the aggregate-weakest base learner—received the dominant stacking weight (+2.15) while CatBoost—the aggregate-strongest—received a negative weight (−1.85). Frequency-domain residual decomposition revealed the mechanism: the meta-learner’s pairwise contrast cancels the shared low-frequency baseline while amplifying LightGBM’s narrow advantage in the high-frequency band. The ensemble’s superiority was spatially robust across all seven bars.
The frequency-domain stacking framework provides a systematic methodology for identifying and exploiting complementarities among base learners. This capability is particularly relevant for process monitoring under renewable power intermittency. Future work should investigate multi-parameter process variable fusion, transfer learning across cells, online model adaptation, validation against labeled failure events, and long-term reliability assessment of standard-coated fiber for cost-effective DTS deployment.
Author Contributions
S.W.: Conceptualization, Methodology, Formal analysis, Investigation, Data curation, Visualization, Writing—original draft. Y.Z.: Conceptualization, Funding acquisition, Project administration, Resources, Supervision. Z.X.: Conceptualization, Supervision, Validation. T.W.: Project administration, Resources, Funding acquisition. W.Z. (Wei Zheng): Project administration, Resources. W.Z. (Wei Zhu): Resources, Investigation. L.L.: Validation. B.Q.: Investigation, Resources. K.P.: Investigation, Validation. All authors have read and agreed to the published version of the manuscript.
Funding
This paper was supported by Smart Aluminum Plant Technological Innovation Project of Inner Mongolia Huomei-Hongjun Aluminum Electric Co., Ltd. (K20231334). The sponsor provided the industrial site, safety management, and operational guidance.
Data Availability Statement
The raw data supporting the findings of this study are proprietary to the industrial partner and subject to commercial confidentiality. Data may be made available from the corresponding author upon reasonable request and with the explicit permission of the industrial partner.
Acknowledgments
The author wishes to acknowledge the valuable support and assistance provided by the staff of Zhejiang University Huzhou Institute and Huomei Hongjun Aluminum and Electricity Co., Ltd. Additionally, a preprint version of this manuscript has been deposited on the Research Square platform and is available online https://www.researchsquare.com/article/rs-7993883/v1, During the preparation of this manuscript, Gemini 3, WPS AI, and SCImaster were used for English language editing. The authors rigorously reviewed and verified all machine-edited content and take full responsibility for the final manuscript.
Conflicts of Interest
Authors Songsong Wang, Yueqiang Zhu, Tiejun Wang, Wei Zheng, Wei Zhu, Liangliang Lv, Bo Qiu and Kailiang Pan were employed by the company Inner Mongolia Huomei-Hongjun Aluminum Electric Co., Ltd. The remaining authors declare that the research was conducted in the absence of any commercial or financial relationships that could be construed as a potential conflict of interest. The authors declare that this study received funding from Inner Mongolia Huomei-Hongjun Aluminum Electric Co., Ltd. The funder was not involved in the study design, collection, analysis, interpretation of data, the writing of this article or the decision to submit it for publication.
References
- Fu, R. Optimization of Electrolytic Aluminum Production Process by Intelligent Control. In Proceedings of the 2023 International Seminar on Computer Science and Engineering Technology (SCSET), New York, NY, USA, 29–30 April 2023; pp. 695–698. [Google Scholar]
- Yao, L.; Long, W.; Li, T.; Tang, D.; Yi, J. An Improved UKFNN Based on Iterative Renewal for Intelligent Modeling of Aluminum Electrolysis. In Proceedings of the 2019 IEEE 4th Advanced Information Technology, Electronic and Automation Control Conference (IAEAC), Chengdu, China, 20–22 December 2019; pp. 271–275. [Google Scholar]
- Sun, Y.; Gui, W.; Chen, X.; Xie, Y.; Xie, S.; Zou, Z. A Dynamic Spatial Distributed Information Clustering Method for Aluminum Electrolysis Cell. Eng. Appl. Artif. Intell. 2023, 126, 106793. [Google Scholar] [CrossRef]
- Wang, J.; Xie, Y.; Xie, S.; Chen, X. Development of Data-Knowledge-Driven Predictive Model and Multi-Objective Optimization for Intelligent Optimal Control of Aluminum Electrolysis Process. Eng. Appl. Artif. Intell. 2024, 134, 108664. [Google Scholar] [CrossRef]
- Lian, Z.; Zhang, C.; Liu, C.; Zhao, H.; Liu, F.; He, A.; Bo, F.; Qi, X.; Jia, X.; Liu, P.; et al. Intelligent Energy Optimization for Electrolytic Aluminum Using Industrial Data-Driven and Knowledge-Guided Modeling. Metall. Mater. Trans. B 2025, 56, 5187–5199. [Google Scholar] [CrossRef]
- Qiu, Z.; Li, J.; Cui, X.; Grjotheim, K.; Kvande, H.; Øye, H.A. Continuous bath temperature measurements in Al electrolysis cells. JOM 1994, 46, 28–30. [Google Scholar] [CrossRef]
- Ma, S.; Xu, Y.; Pang, Y.; Zhao, X.; Li, Y.; Qin, Z.; Liu, Z.; Lu, P.; Bao, X. Optical Fiber Sensors for High-Temperature Monitoring: A Review. Sensors 2022, 22, 5722. [Google Scholar] [CrossRef] [PubMed]
- Deng, Y.; Jiang, J. Optical Fiber Sensors in Extreme Temperature and Radiation Environments: A Review. IEEE Sens. J. 2022, 22, 13811–13834. [Google Scholar] [CrossRef]
- Wijaya, H.; Rajeev, P.; Gad, E. Distributed Optical Fibre Sensor for Infrastructure Monitoring: Field Applications. Opt. Fiber Technol. 2021, 64, 102577. [Google Scholar] [CrossRef]
- Du, W.; Hu, Z.; Li, C.; Chen, Z.; Chen, W.; Qiu, S. Distributed Optical Fiber Sensing Technology in Operation Status Monitoring of GIL Equipment. Appl. Math. Nonlinear Sci. 2023, 9. [Google Scholar] [CrossRef]
- Okamoto, K. Fiber-Optic Distributed-Temperature Sensing. Rev. Laser Eng. 1994, 22, 276–283. [Google Scholar] [CrossRef]
- Silva, L.C.B.; Segatto, M.E.V.; Castellani, C.E.S. Raman scattering-based distributed temperature sensors: A comprehensive literature review over the past 37 years and towards new avenues. Opt. Fiber Technol. 2022, 74, 103091. [Google Scholar] [CrossRef]
- Laarossi, I.; Quintela-Incera, M.Á.; López-Higuera, J.M. Comparative Experimental Study of a High-Temperature Raman-Based Distributed Optical Fiber Sensor with Different Special Fibers. Sensors 2019, 19, 574. [Google Scholar] [CrossRef] [PubMed]
- Silva, M.S.P.E.; de Barros, T.H.C.; Alves, H.P.; Nascimento, J.F.D.; Filho, J.F.M. Evaluation of Fiber Optic Raman Scattering Distributed Temperature Sensor Between –196 and 400 °C. IEEE Sens. J. 2021, 21, 1527–1533. [Google Scholar] [CrossRef]
- Liu, Y.; Lei, T.; Sun, Z.; Wang, C.; Liu, T. Application of Distributed Optical Fiber Temperature System in Online Monitoring and Fault Diagnosis of Smart Grid. In Proceedings of the 2012 Asia-Pacific Power and Energy Engineering Conference, Shanghai, China, 27–29 March 2012; pp. 1–4. [Google Scholar]
- Cangialosi, C.; Ouerdane, Y.; Girard, S.; Boukenter, A.; Delepine-Lesoille, S.; Bertrand, J.; Marcandella, C.; Paillet, P.; Cannas, M. Development of a Temperature Distributed Monitoring System Based On Raman Scattering in Harsh Environment. IEEE Trans. Nucl. Sci. 2014, 61, 3315–3322. [Google Scholar] [CrossRef]
- Cangialosi, C.; Girard, S.; Boukenter, A.; Cannas, M.; Delepine-Lesoille, S.; Bertrand, J.; Paillet, P.; Marcandella, C.; Ouerdane, Y. Effects of Radiation and Hydrogen-Loading on the Performances of Raman-Distributed Temperature Fiber Sensors. J. Light. Technol. 2015, 33, 2432–2438. [Google Scholar] [CrossRef]
- Morana, A.; Girard, S.; Marin, E.; Vidalot, J.; Cebollada, A.; Robin, T.; Alessi, A.; Boukenter, A.; Ouerdane, Y.; Melin, G.; et al. Performances of Radiation-Hardened Single-Ended Raman Distributed Temperature Sensors Using Commercially Available Fibers. IEEE Trans. Nucl. Sci. 2020, 67, 305–311. [Google Scholar] [CrossRef]
- Wen, Z.; Zhang, Z.; Lu, Z.; Yan, L.; Ning, F.; Cheng, G.; Zhang, S.; Ning, Y.; Liu, T. Application of DTS in High-Temperature Monitoring of Alumina Electrolysis Bath. In Proceedings of the International Conference on Precision Instruments and Optical Engineering (PIOE 2022), Guangzhou, China, 23–25 September 2022. [Google Scholar]
- Yan, Z.; Du, B.; Li, Z.; Chen, C.; Xu, B.; Xu, X.; Chen, G.Y.; Wang, Y.; He, J. High-Resolution Raman-OTDR Distributed Temperature Sensors Based on Fast-Non Local Means Denoising Algorithm. J. Light. Technol. 2025, 43, 9465–9473. [Google Scholar] [CrossRef]
- Liu, B.; Buric, M.P.; Chorpening, B.T.; Yu, Z.; Homa, D.S.; Pickrell, G.R.; Wang, A. Design and Implementation of Distributed Ultra-High Temperature Sensing System With a Single Crystal Fiber. J. Light. Technol. 2018, 36, 5511–5520. [Google Scholar] [CrossRef]
- Ke, G.; Meng, Q.; Finley, T.; Wang, T.; Chen, W.; Ma, W.; Ye, Q.; Liu, T.-Y. LightGBM: A Highly Efficient Gradient Boosting Decision Tree. In Proceedings of the Advances in Neural Information Processing Systems 30 (NIPS 2017), Long Beach, CA, USA, 4–9 December 2017; pp. 3146–3154. [Google Scholar]
- Hancock, J.; Khoshgoftaar, T.M. CatBoost for Big Data: An Interdisciplinary Review. Res. Sq. 2020, 7, 94. [Google Scholar] [CrossRef] [PubMed]
- Rigatti, S.J. Random Forest. J. Insur. Med. 2017, 47, 31–39. [Google Scholar] [CrossRef] [PubMed]
- Wolpert, D.H. Stacked Generalization. Neural Netw. 1992, 5, 241–259. [Google Scholar] [CrossRef]
- Wang, S.; Zhu, Y.; Xu, Z.; Wang, T.; Zheng, W.; Zhu, W.; Lv, L.; Qiu, B.; Pan, K. Towards Smart Aluminum Smelting: An AI-Driven Approach for Real Time Thermal Anomaly Detection Using Distributed Optical Fiber Sensors. Res. Sq. 2025. [Google Scholar] [CrossRef] [PubMed]
Figure 1.
Schematic of the Hall-Héroult cell cross-section with Raman DTS monitoring integration. Prebaked carbon anodes are immersed in a cryolite-alumina electrolyte (approximately 960 °C) above a liquid aluminum pad. Rectangular steel cathode collector bars are embedded in the carbon cathode bottom. A polyimide-armored fiber is packaged within a custom ceramic protection device and pressed against the underside of each cathode bar—within the confined space (only a few centimeters) between the bar and the refractory insulation layer beneath the cell. The fiber exits through a sealed side port to the external Raman DTS interrogator. The anti-Stokes/Stokes intensity ratio provides a continuous temperature profile along the fiber at 1 m spatial resolution.
Figure 1.
Schematic of the Hall-Héroult cell cross-section with Raman DTS monitoring integration. Prebaked carbon anodes are immersed in a cryolite-alumina electrolyte (approximately 960 °C) above a liquid aluminum pad. Rectangular steel cathode collector bars are embedded in the carbon cathode bottom. A polyimide-armored fiber is packaged within a custom ceramic protection device and pressed against the underside of each cathode bar—within the confined space (only a few centimeters) between the bar and the refractory insulation layer beneath the cell. The fiber exits through a sealed side port to the external Raman DTS interrogator. The anti-Stokes/Stokes intensity ratio provides a continuous temperature profile along the fiber at 1 m spatial resolution.
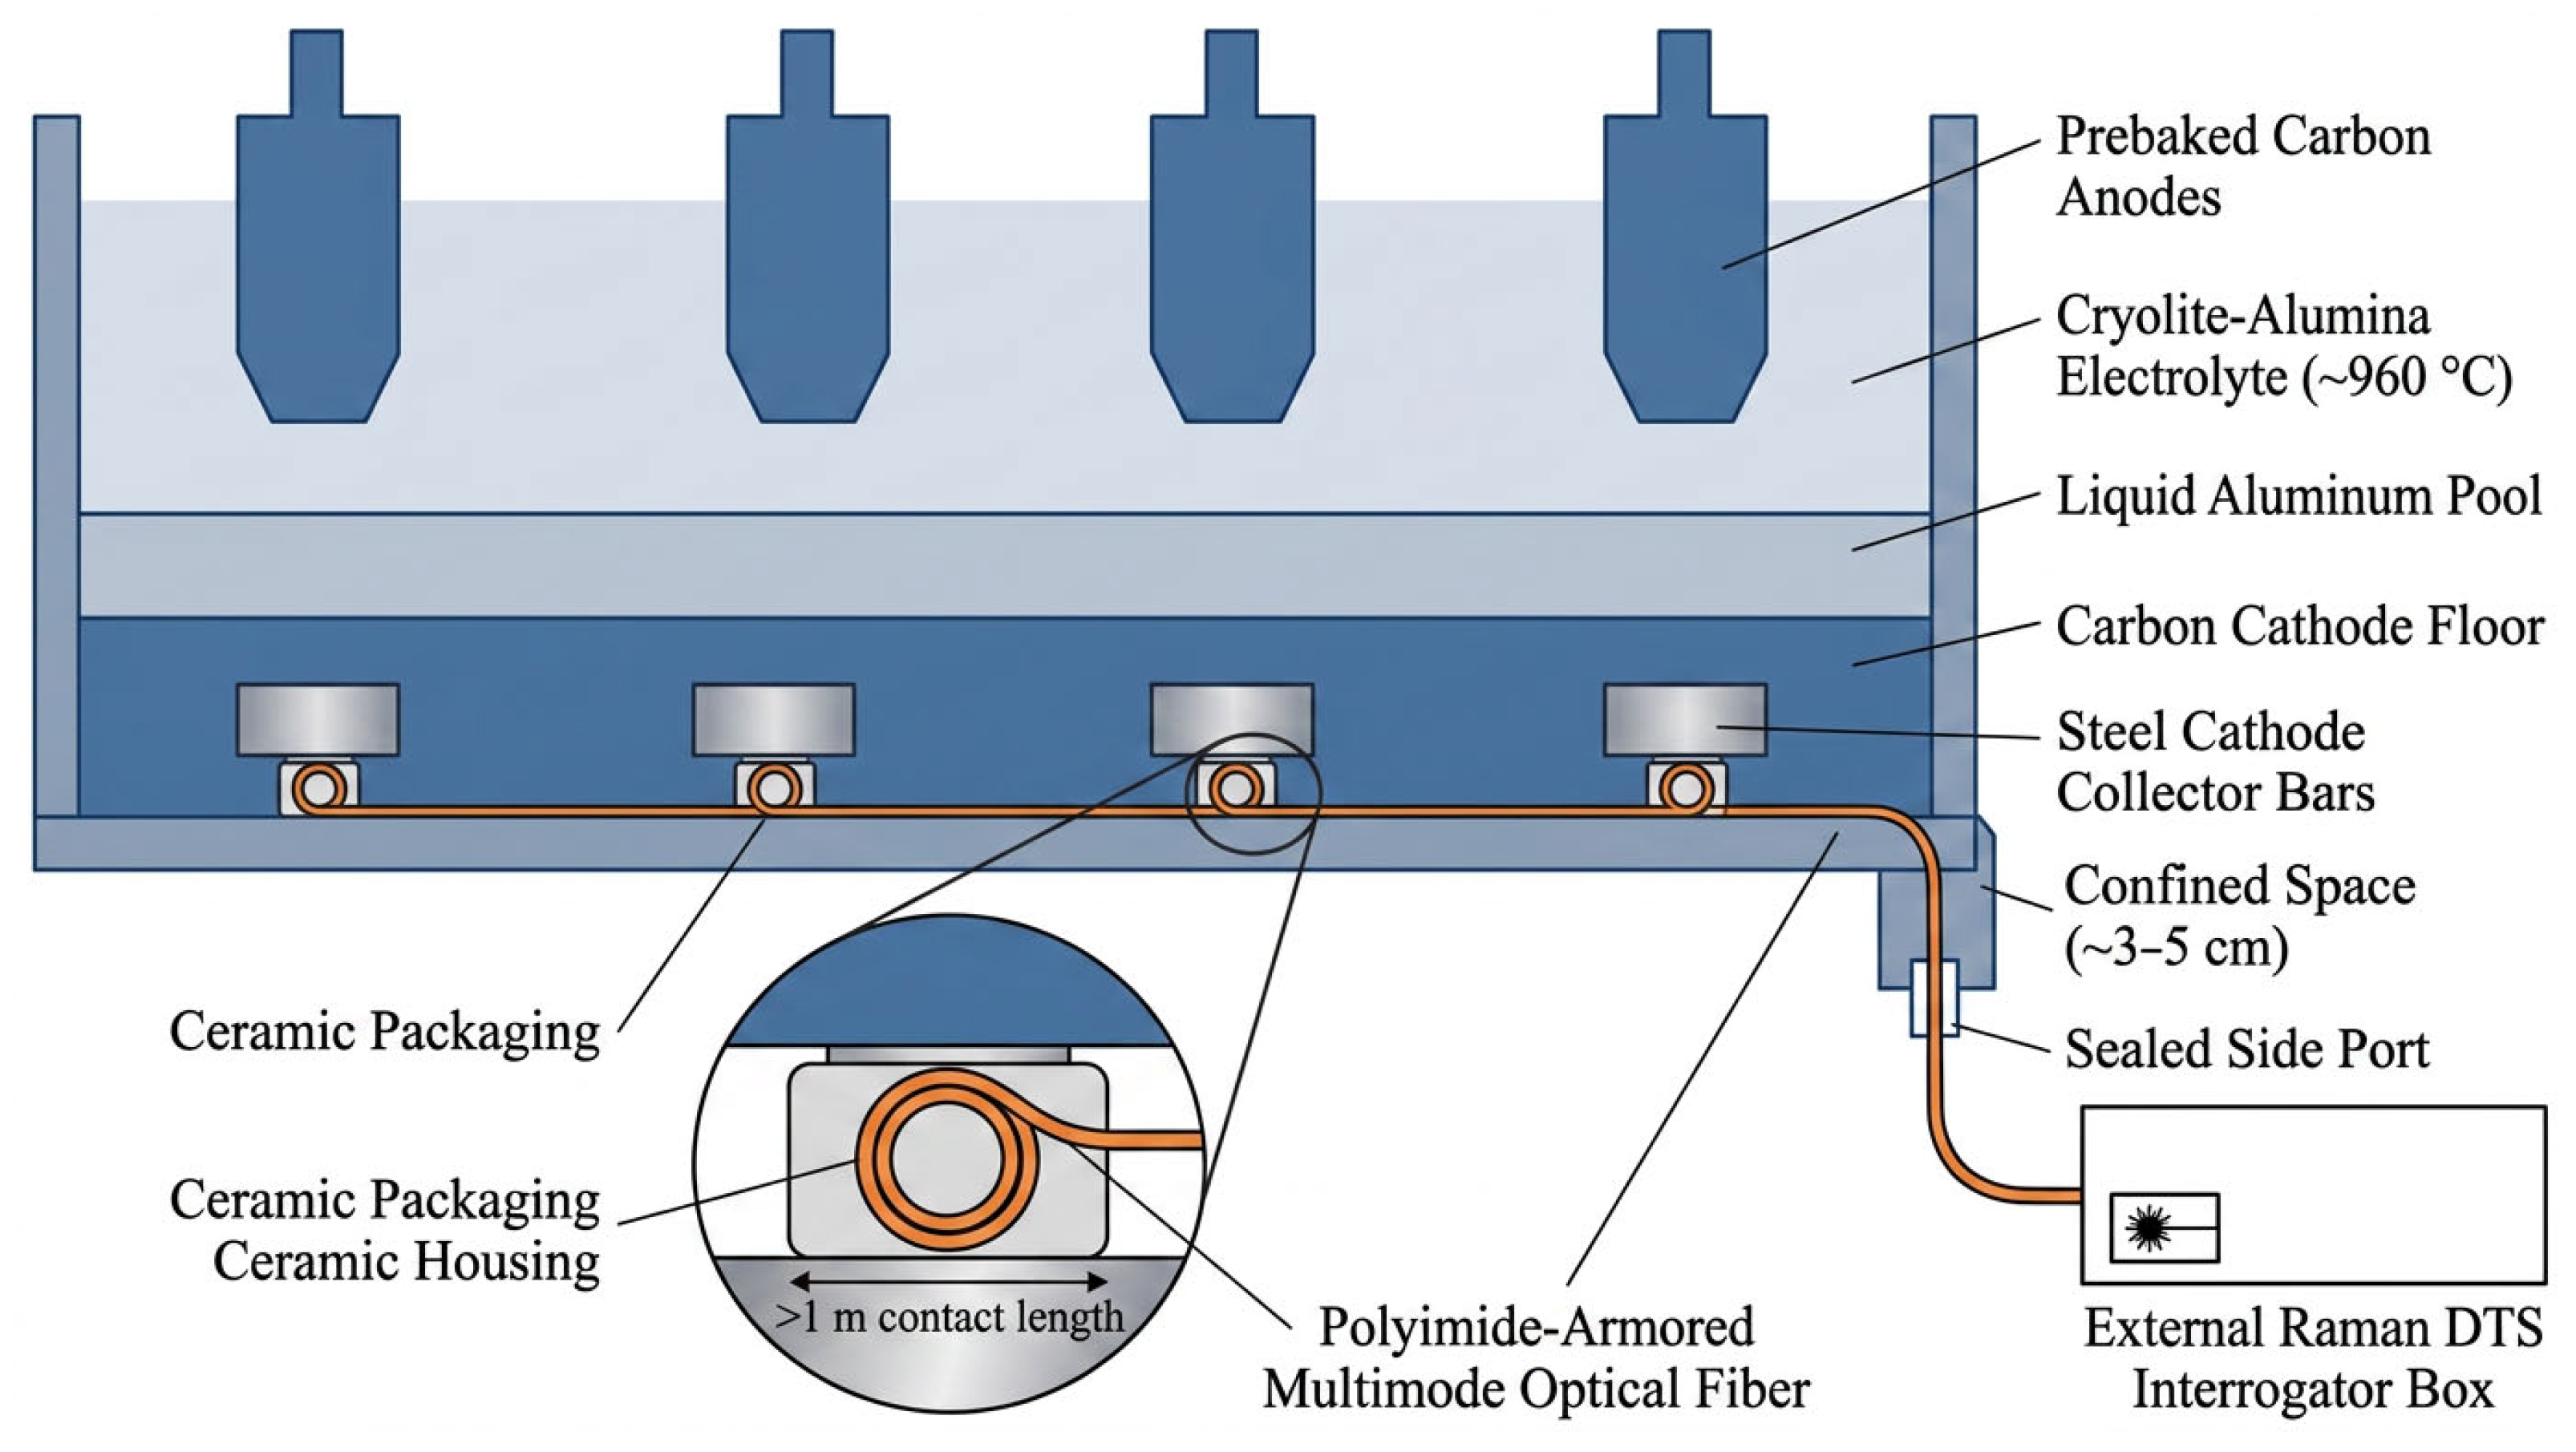
Figure 2.
Schematic framework of the domain-informed stacking ensemble learning model for predictive thermal modeling [26].
Figure 2.
Schematic framework of the domain-informed stacking ensemble learning model for predictive thermal modeling [26].
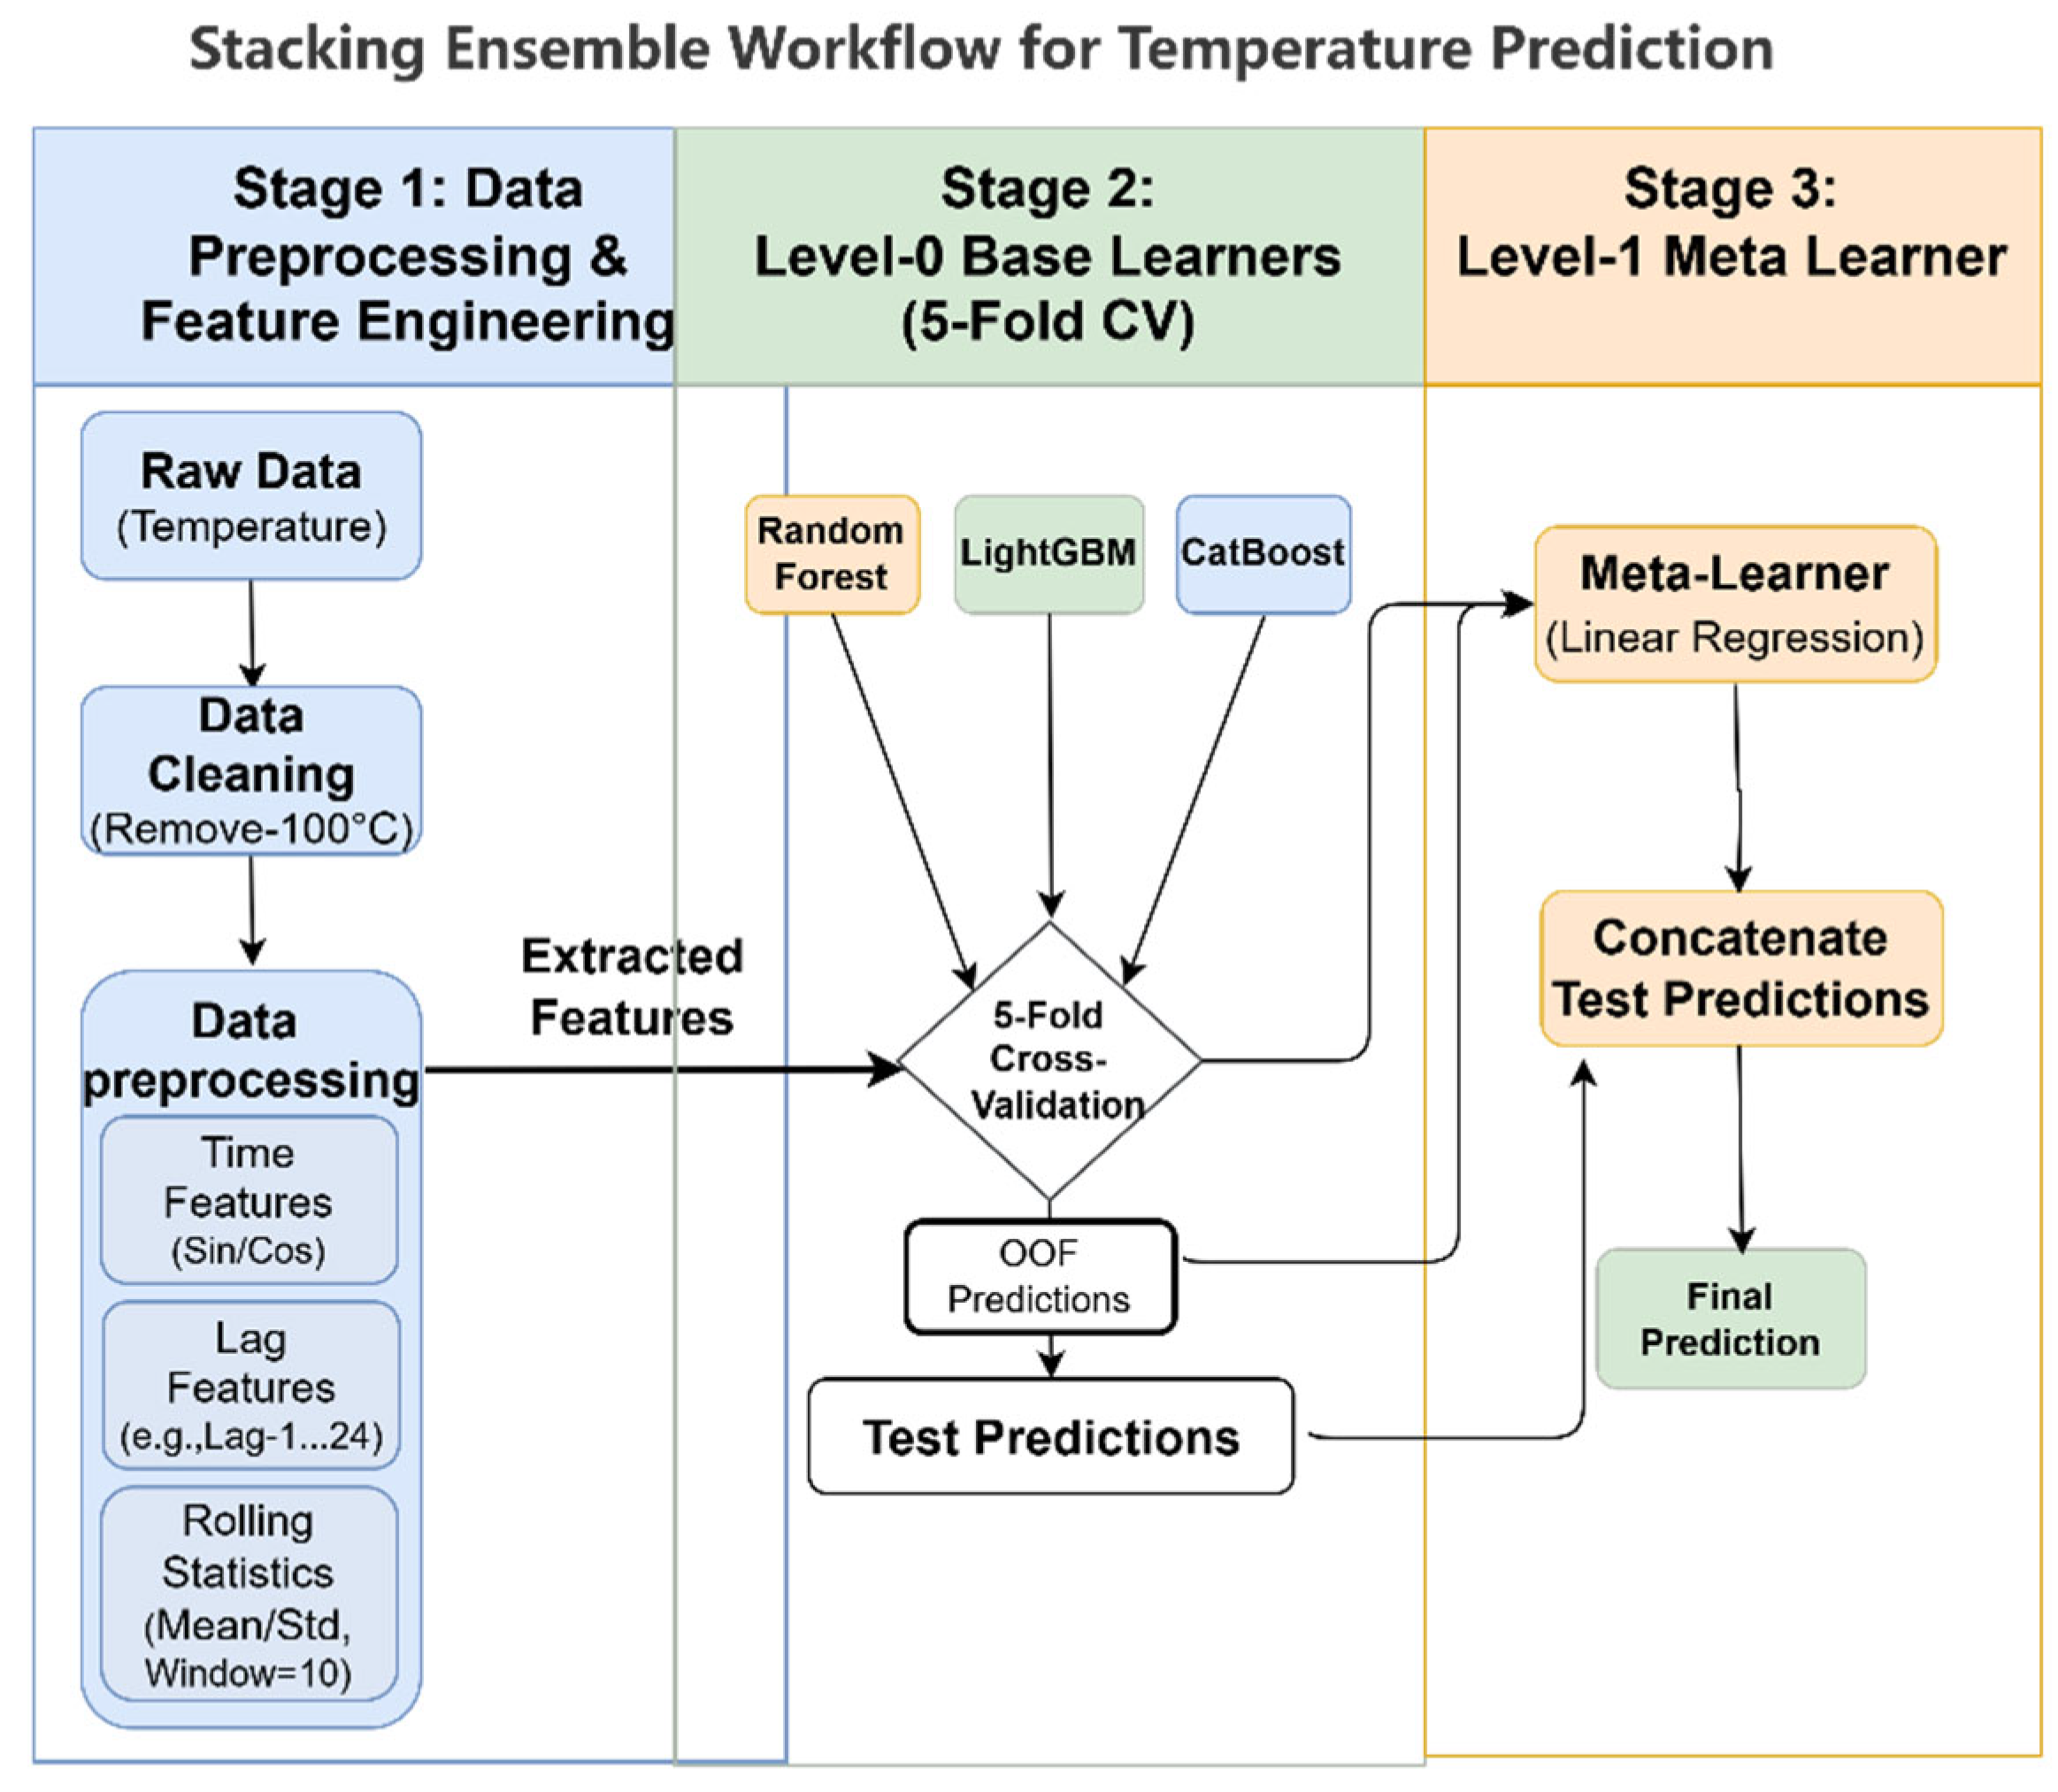
Figure 3.
Performance evaluation of the stacking ensemble model for temperature prediction. Quantitative metrics: MSE, RMSE, and R2 [26].
Figure 3.
Performance evaluation of the stacking ensemble model for temperature prediction. Quantitative metrics: MSE, RMSE, and R2 [26].
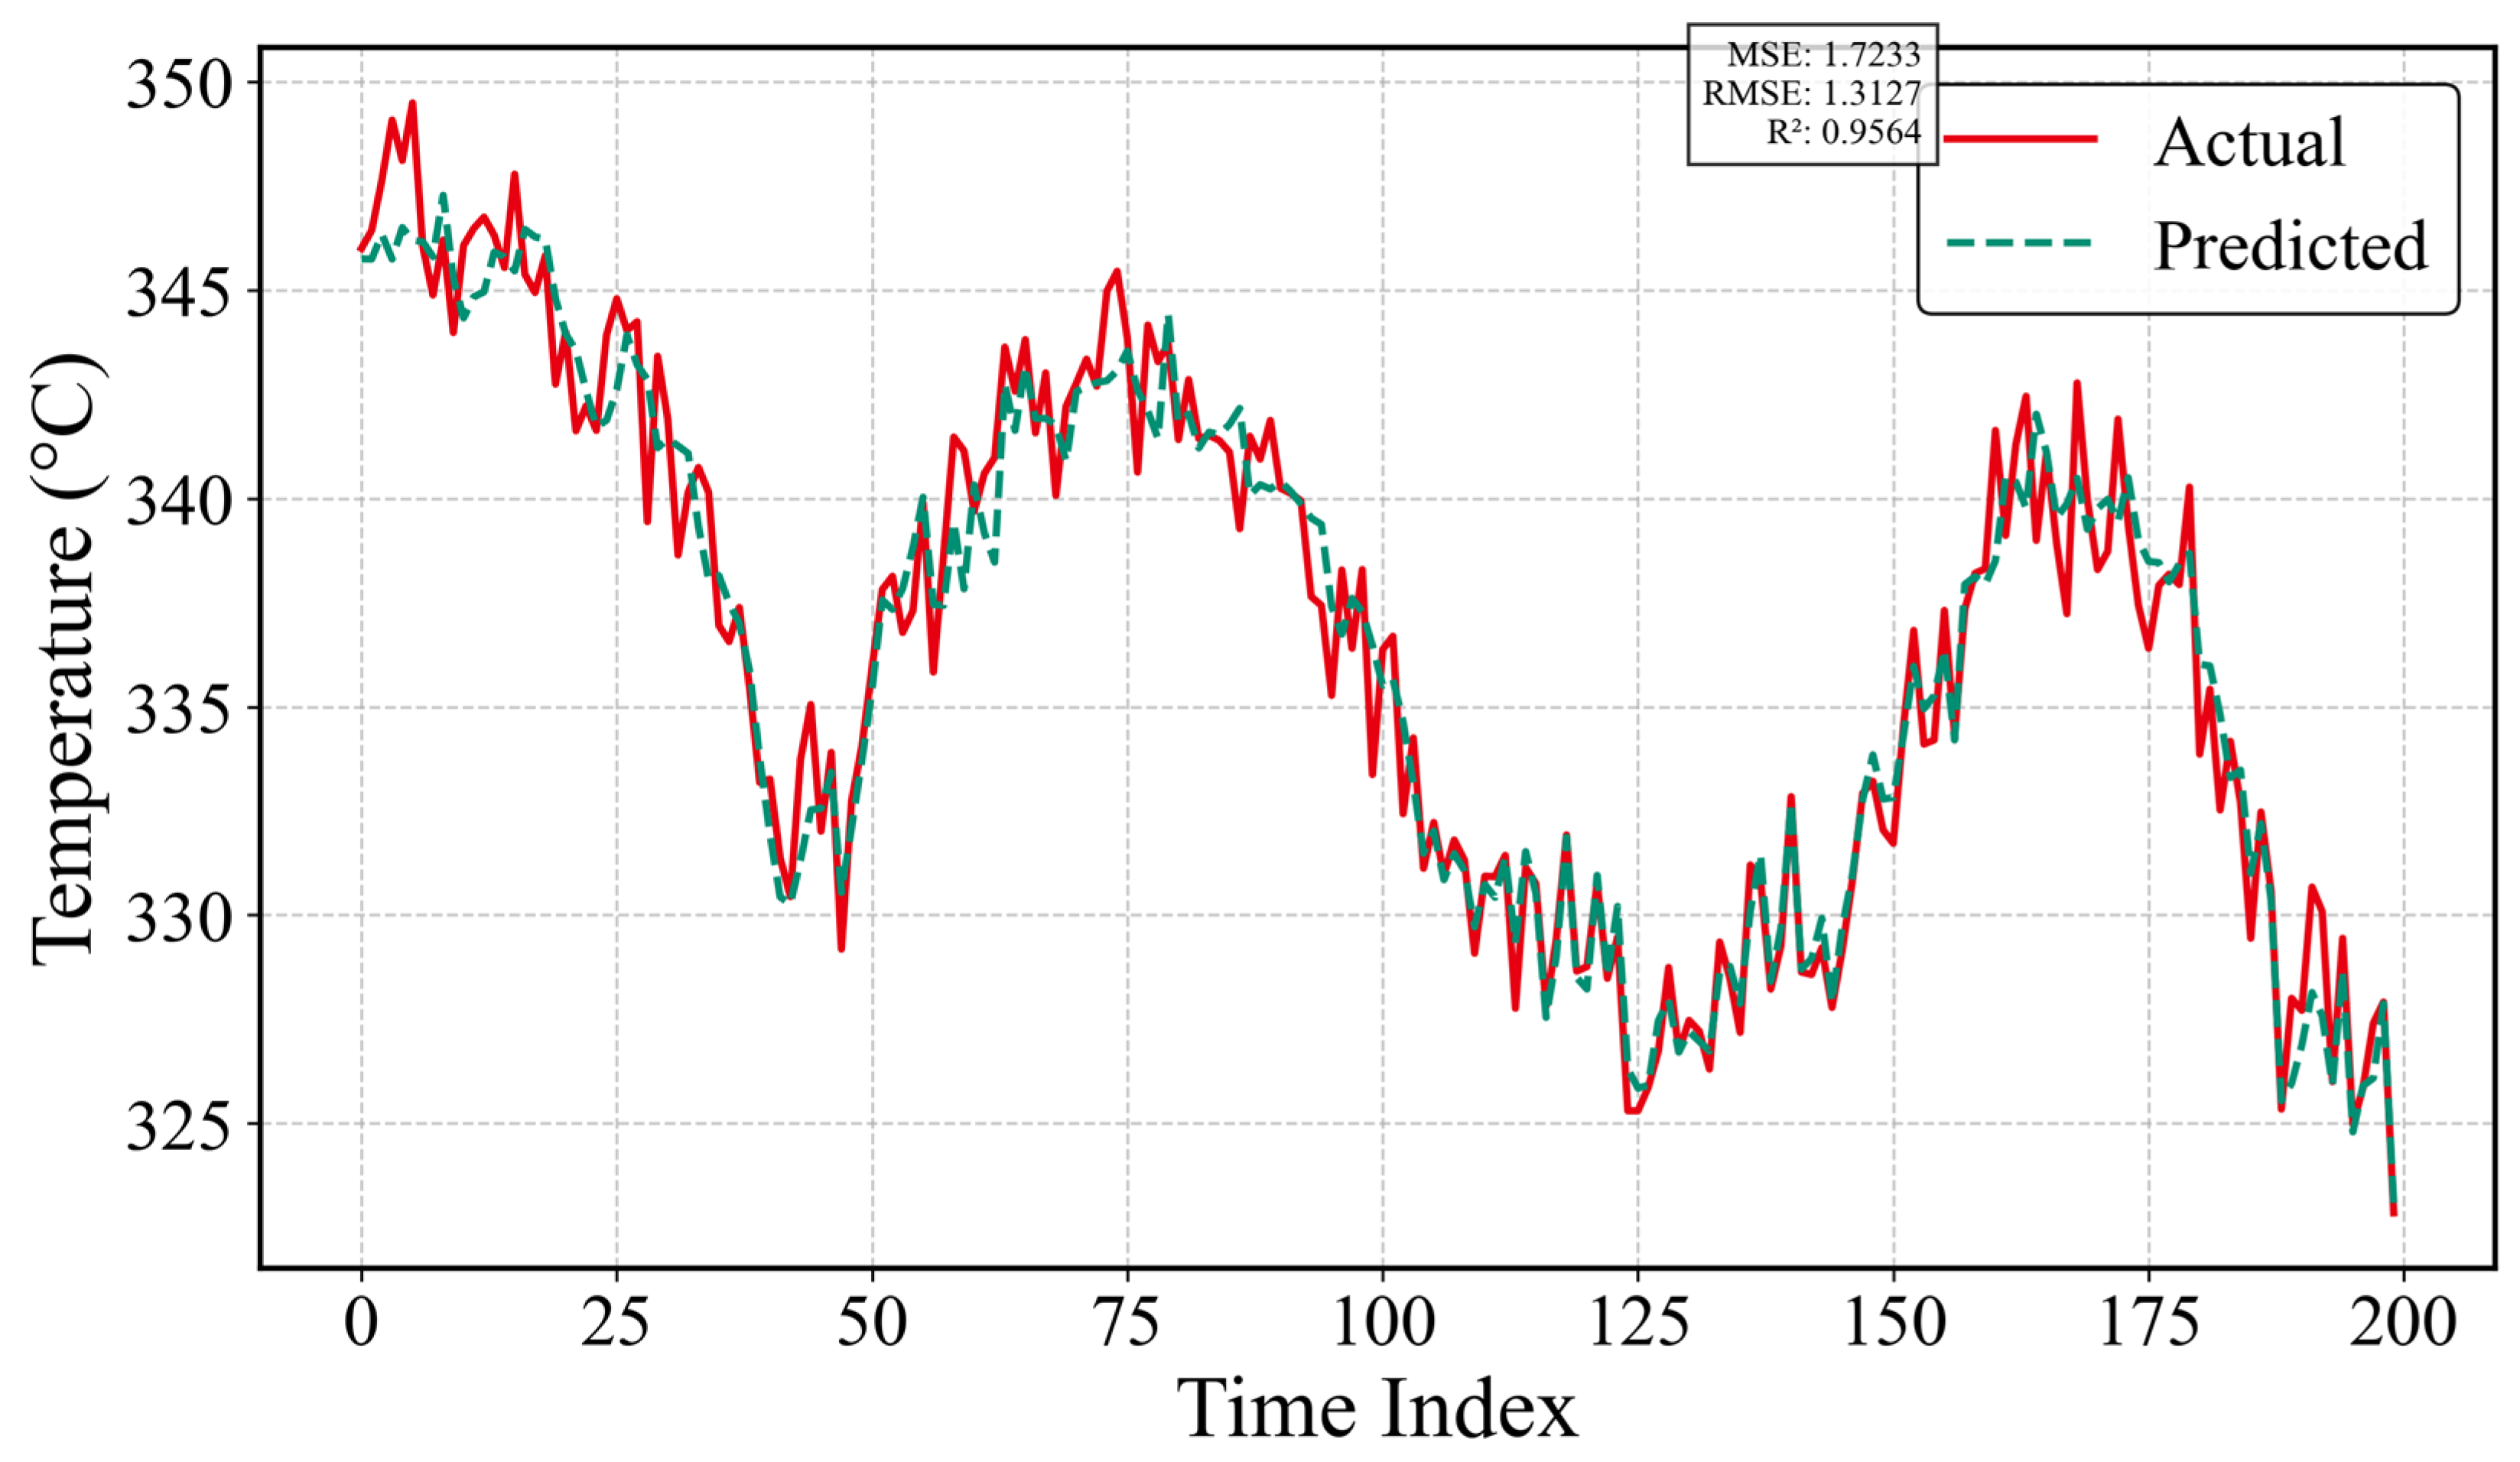
Figure 4.
Correlation matrix of base learner predictions within the stacking ensemble framework. The heatmap visualizes the Pearson correlation coefficients between the prediction vectors of the three base learners: Random Forest, LightGBM, and CatBoost [26].
Figure 4.
Correlation matrix of base learner predictions within the stacking ensemble framework. The heatmap visualizes the Pearson correlation coefficients between the prediction vectors of the three base learners: Random Forest, LightGBM, and CatBoost [26].
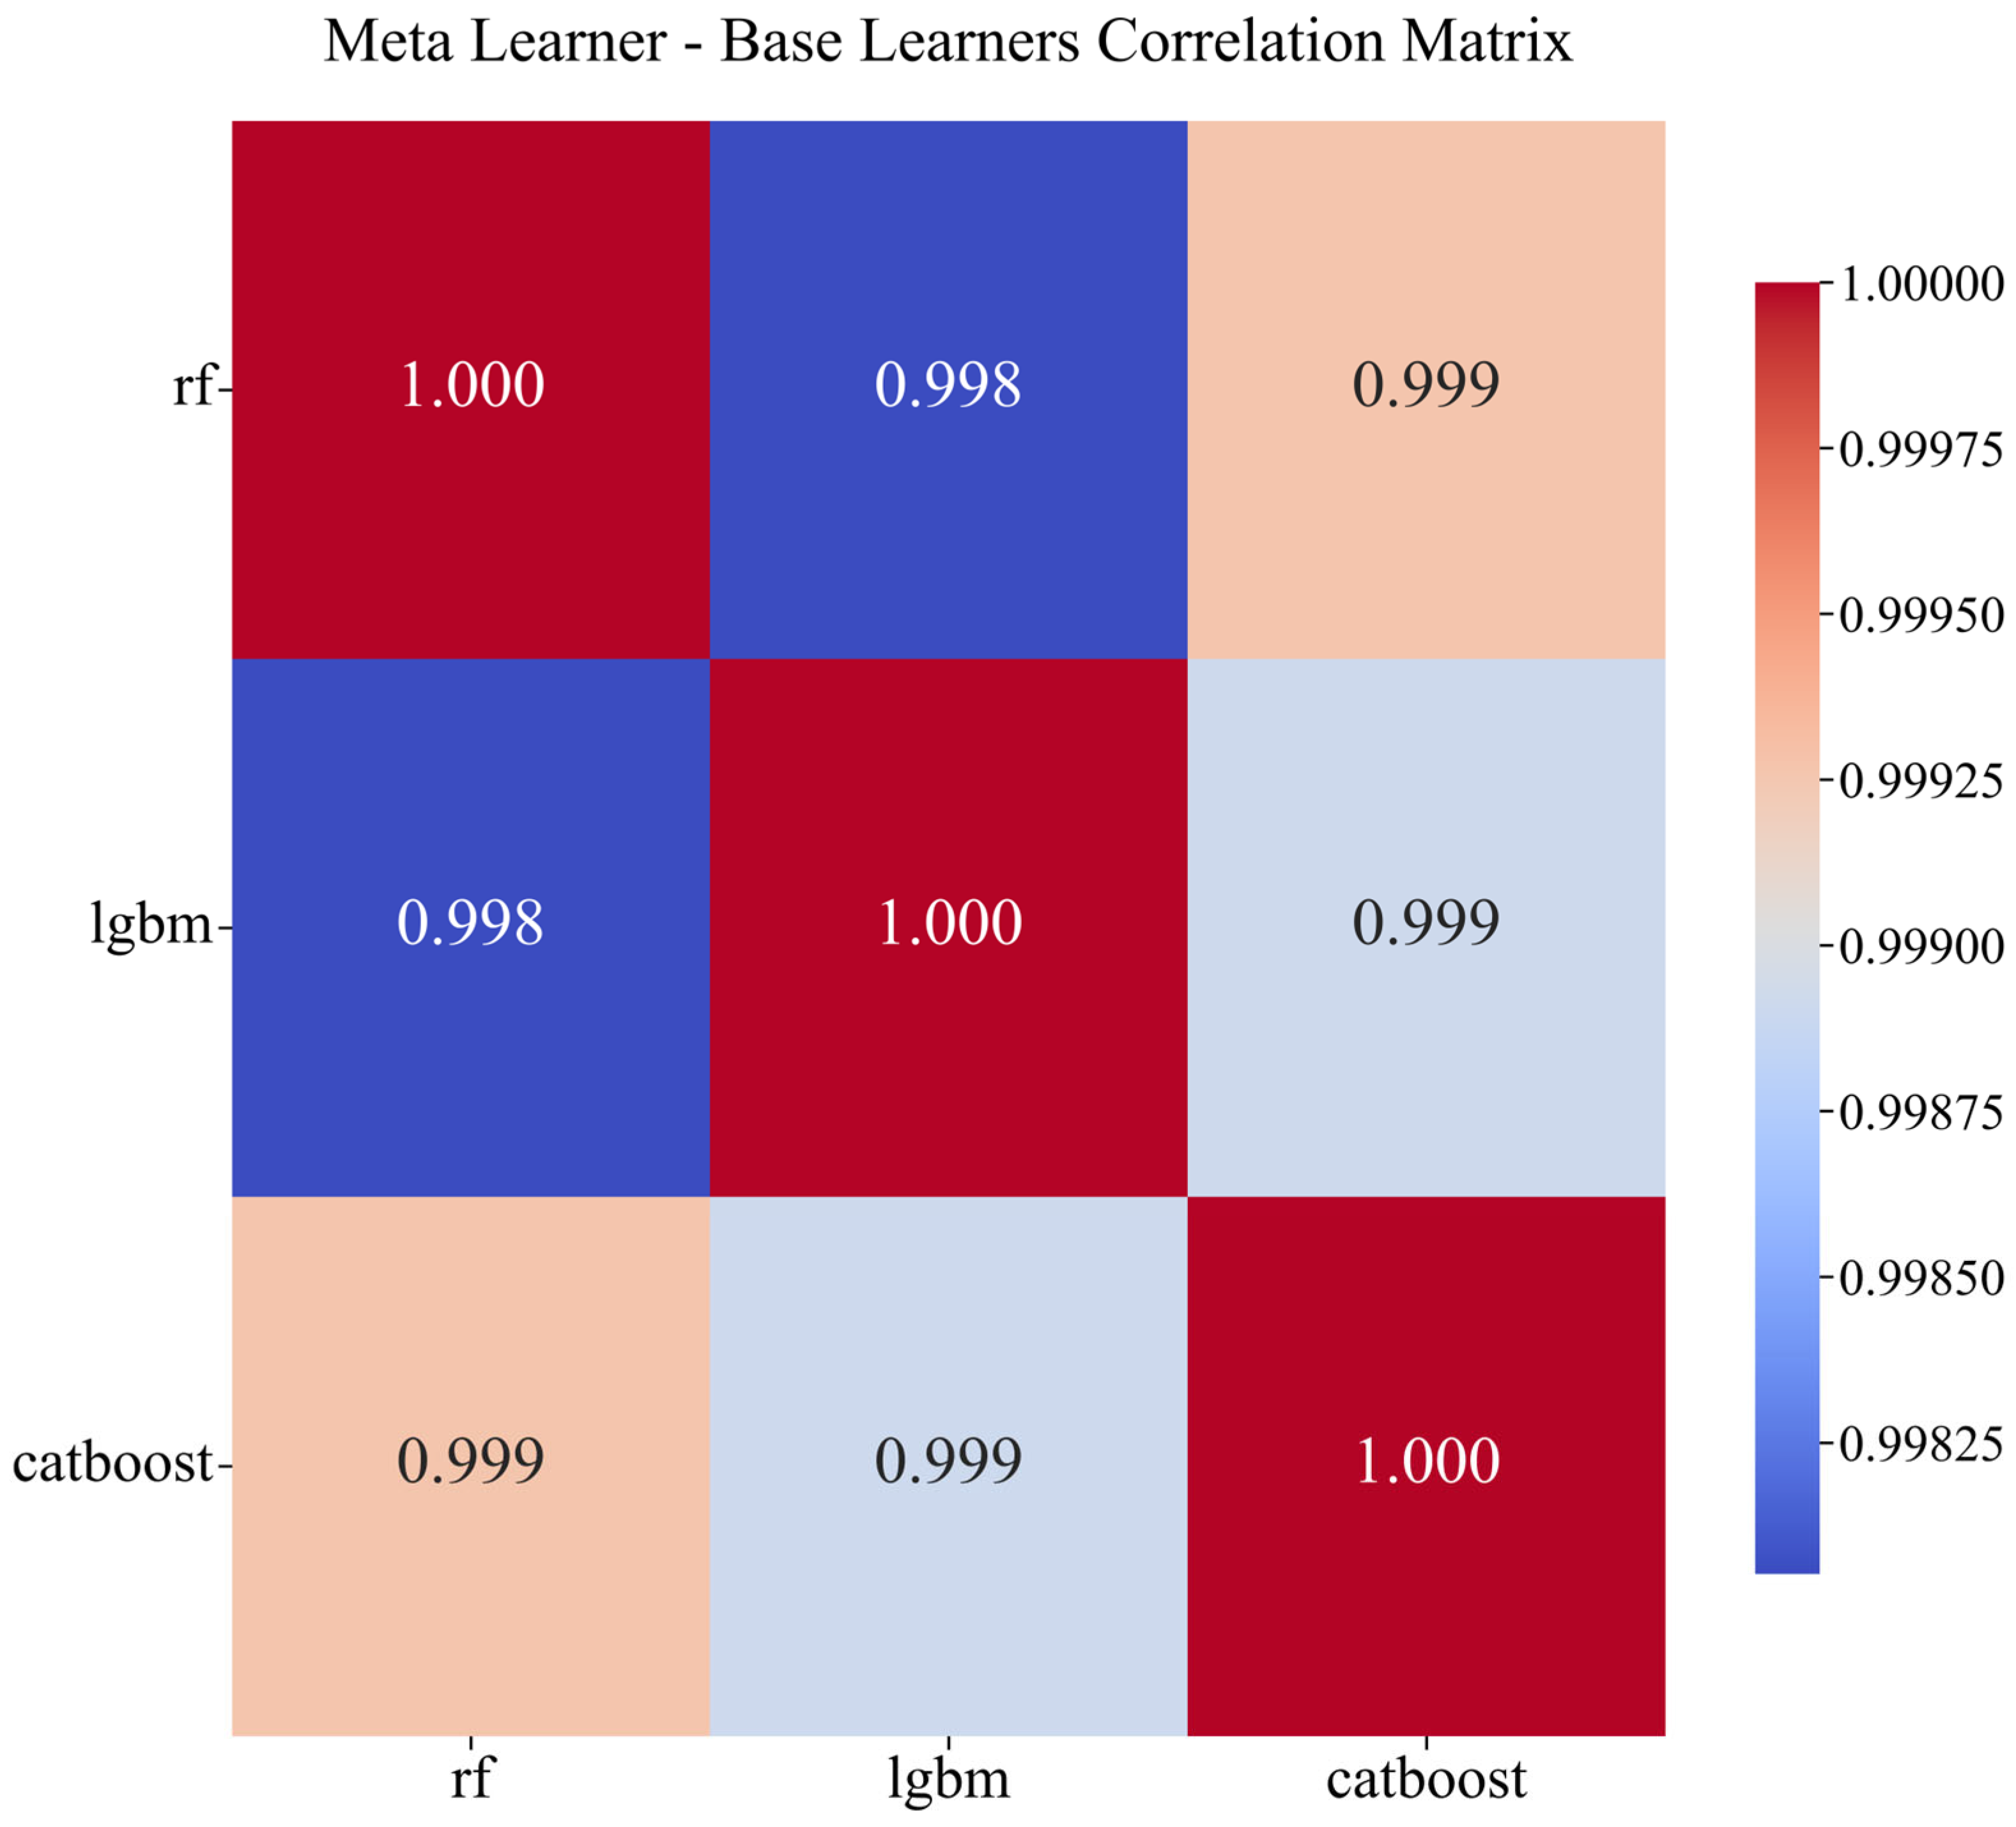
Figure 5.
Meta-learner coefficient analysis showing the contribution of each base learner to the final stacking prediction. The top three panels show scatter plots comparing the predictions of individual base learners (Random Forest, LightGBM, and CatBoost) against the final stacking model predictions [26].
Figure 5.
Meta-learner coefficient analysis showing the contribution of each base learner to the final stacking prediction. The top three panels show scatter plots comparing the predictions of individual base learners (Random Forest, LightGBM, and CatBoost) against the final stacking model predictions [26].
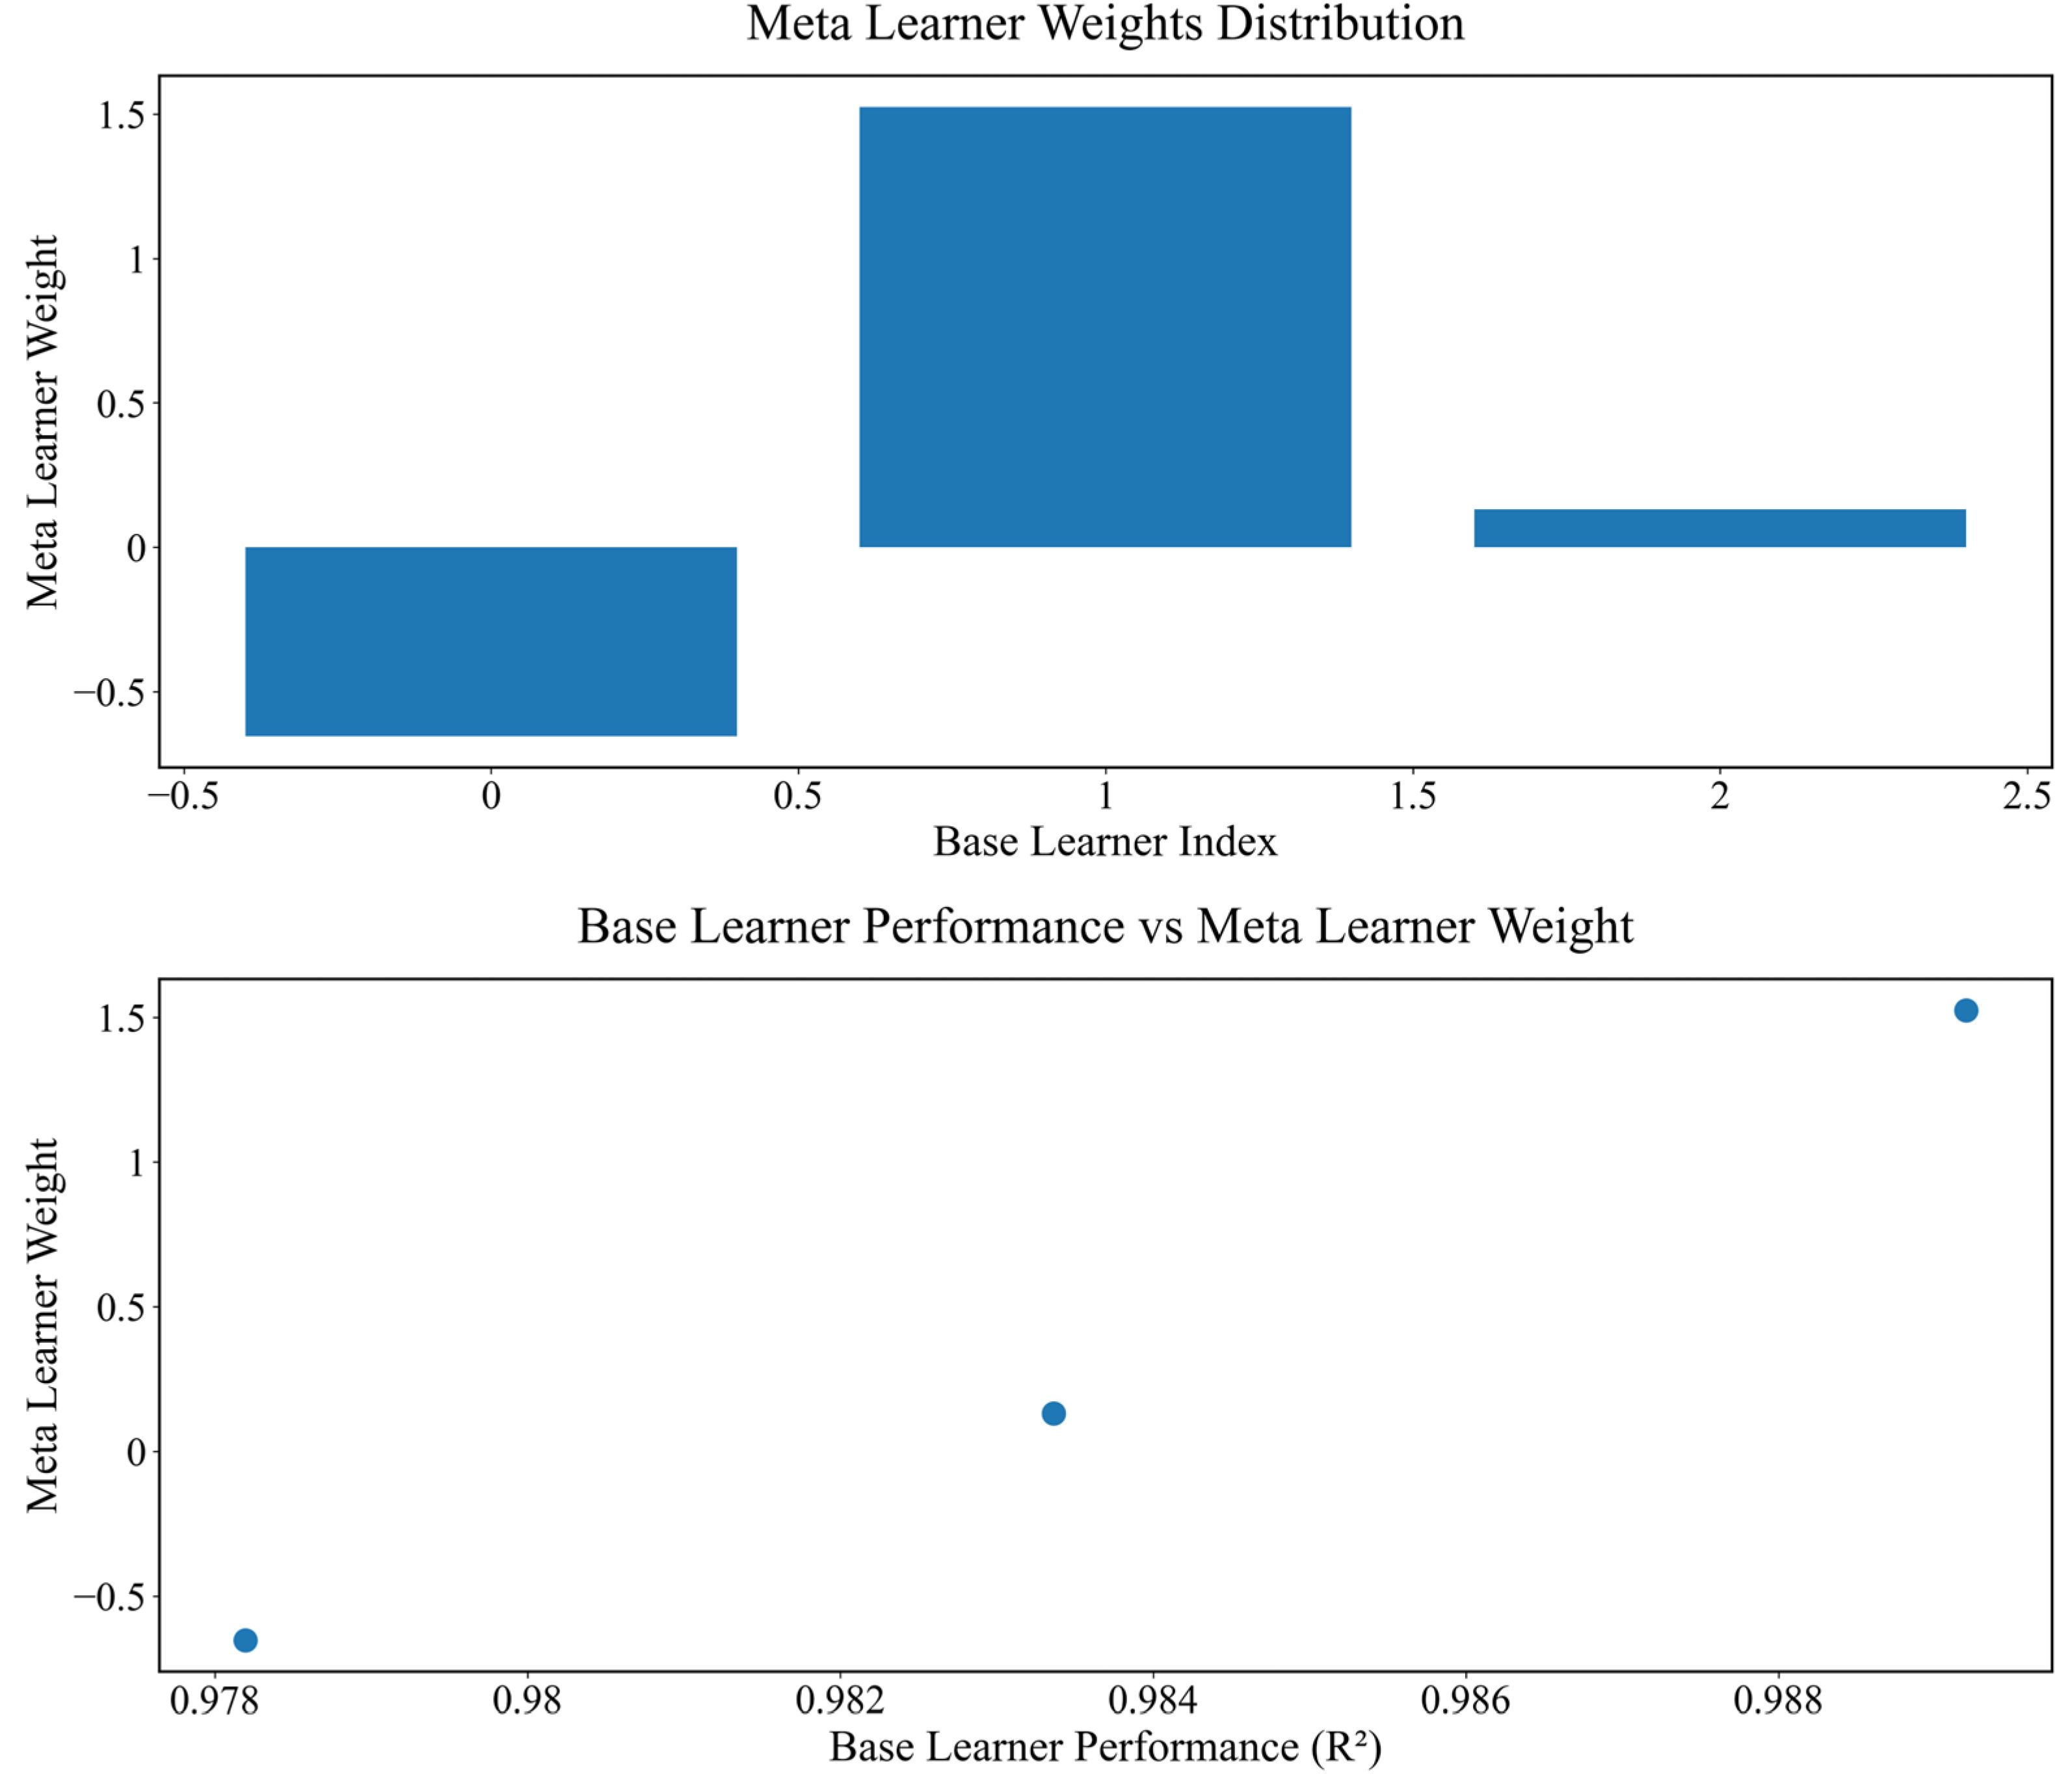

Table 1.
Distributed fiber optic temperature measurement system [26].
Table 1.
Distributed fiber optic temperature measurement system [26].
| Parameters | Value | Remark |
|---|---|---|
| Temperature measurement principle | ROTDR | Based on anti-Stokes/Stokes intensity ratio |
| Temperature measurement range | 0–450 °C | Covers cathode bar surface temperature (>300 °C) |
| Temperature resolution | 1 °C | --- |
| Spatial resolution | 1 m | Matches >1 m contact length per bar |
Table 2.
Aluminum Electrolytic Cell Operating Conditions [26].
Table 2.
Aluminum Electrolytic Cell Operating Conditions [26].
| Parameters | Value | Remark |
|---|---|---|
| Cell type | 380 KA | Prebaked anode Hall-Héroult cell |
| Electrolysis temperature | 935~965 °C | Normal cryolite melt operating range |
| Molecular ratio | 2.2~2.4 | NaF/AlF3 molar ratio |
| Collection duration | 2 months | Continuous acquisition under normal production |
Table 3.
Machine learning model hyperparameter settings [26].
Table 3.
Machine learning model hyperparameter settings [26].
| Model | Key Hyperparameters | Value | Optimization Methods |
|---|---|---|---|
| CatBoost | iterations | 1000 | |
| learning_rate | 0.1 | ||
| depth | 6 | ||
| LightGBM | num_leaves | 31 | Bayesian Optimization |
| bagging_freq | 5 | ||
| feature_fraction | 0.9 | ||
| Random Forest | n_estimators | 100 | |
| min_samples_split | 5 | ||
| MLP | random_state | 42 | Bayesian Optimization |
| learning_rate_init | 0.00001 |
Table 4.
Performance Evaluation of Each Model on the Test Set [26].
Table 4.
Performance Evaluation of Each Model on the Test Set [26].
| Model | MSE | RMSE (°C) | MAE (°C) | R2 |
|---|---|---|---|---|
| CatBoost | 1.4231 | 1.1930 | 0.9490 | 0.9857 |
| LightGBM | 2.9052 | 1.7045 | 1.3587 | 0.9706 |
| Random Forest | 1.8041 | 1.3432 | 1.0819 | 0.9819 |
| MLP | 5.1418 | 2.2676 | 1.7866 | 0.9483 |
| Stacking | 0.5552 | 0.7451 | 0.5184 | 0.9944 |
Disclaimer/Publisher’s Note: The statements, opinions and data contained in all publications are solely those of the individual author(s) and contributor(s) and not of MDPI and/or the editor(s). MDPI and/or the editor(s) disclaim responsibility for any injury to people or property resulting from any ideas, methods, instructions or products referred to in the content. |
© 2026 by the authors. Licensee MDPI, Basel, Switzerland. This article is an open access article distributed under the terms and conditions of the Creative Commons Attribution (CC BY) license (http://creativecommons.org/licenses/by/4.0/).
Copyright: This open access article is published under a Creative Commons CC BY 4.0 license, which permit the free download, distribution, and reuse, provided that the author and preprint are cited in any reuse.