

Submitted:
07 September 2026
Posted:
08 September 2026
You are already at the latest version
Abstract
Continuous meteorological data collection is essential for supporting management decisions in wheat cultivation, which is highly sensitive to environmental variations. This paper presents the implementation of a monitoring system based on a weather station and associated sensors, using LoRa technology and the LoRaWAN protocol to provide long-range connectivity in agricultural areas. The architecture integrates data acquisition devices, a LoRaWAN gateway, and server infrastructure to transmit data through the MQTT protocol and visualize them using dashboards. The system was configured and deployed in a wheat-growing area located in São Miguel Arcanjo (SP, Brazil). The resulting time series of atmospheric variables (temperature, humidity, pressure, precipitation, wind, and illuminance) were made available for graphical analysis and to support agricultural management decisions. The system exhibited low communication latency (<1.2 s), a minimum packet delivery ratio (PDR) of 82.7%, and signal-to-noise ratio (SNR) values between 9 and 10 dB after field deployment. The proposed solution demonstrates potential to support field management decisions with low operating costs and high scalability, provided that it is accompanied by validation of reliability, energy performance, and data consistency under real-world conditions.
Keywords:
LoRaWAN
; precision agriculture
; weather station
; Internet of Things
; environmental monitoring
; wheat
1. Introduction
Agriculture plays a central role in the Brazilian economy, and Brazil stands out as one of the world’s leading grain exporters.
Among major crops, wheat occupies a strategic position because of its economic importance and nutritional value, contributing dietary fiber, vitamins, and other nutrients to the human diet [1,2]. Improving wheat productivity and quality requires a detailed understanding of local environmental variables, such as temperature, humidity, atmospheric pressure, solar incidence, precipitation, wind speed and direction, among others, which may affect development, growth, and yield [3,4].
Recent advances in the Internet of Things (IoT) and its adoption in precision agriculture make it possible to instrument cultivated areas with distributed sensors and perform remote data collection and analysis [5,6,7,8]. In this context, long-range, low-power connectivity technologies are especially attractive for rural environments, where network infrastructure may be limited. LoRa technology and the LoRaWAN protocol provide an alternative for communication in unlicensed bands (for example, 915 MHz), enabling long-range coverage under favorable conditions and supporting organized networks with addressing, collision control, and security mechanisms [9,10,11,12,13].
This paper describes the implementation of a system for monitoring atmospheric variables (and integration with associated sensors), with transmission via LoRa/ LoRaWAN and data made available on a server through MQTT, with visualization through dashboards (Grafana). The system was deployed in a operational wheat-growing area located in São Miguel Arcanjo (SP, Brazil) and linked to Embrapa (Brazilian Agricultural Research Corporation) [14].
The main contributions of this study are: (i) the development of an end-to-end architecture for environmental monitoring in an agricultural area, integrating a LoRaWAN end device, gateway, and data server with MQTT and Grafana; (ii) the deployment and evaluation of the system in a commercial wheat-growing environment; (iii) the integration of environmental data with MQTT- and Grafana-based visualization; and (iv) the experimental assessment of communication latency, packet delivery ratio, signal quality, and system autonomy.
For this purpose, the following objectives were defined:
- Assembly of a weather station for monitoring environmental data, such as temperature, humidity, wind speed and direction, precipitation, among others, with these data visualized through dashboards, thereby enabling intuitive visualization and interpretation of the data collected in real time.
- Configuration of the gateway to receive data from the weather station through the LoRaWAN protocol and send the data to Smart Campus Mauá via Ethernet.
With the widespread adoption of connectivity in agriculture through IoT technologies and real-time data acquisition by Internet, improved accuracy and agility in decision-making by farmers are expected, consequently resulting in increased productivity and efficiency in the agricultural market.
2. Materials and Methods
2.1. Study Area and Deployment Context
The system was deployed in a wheat field located in the city of São Miguel Arcanjo (SP, Brazil), in an area linked to Embrapa in the Pinhalzinho neighborhood, at approximate coordinates 23°53′18″ S, 48°01′32″ W, state of São Paulo, Brazil. The region is characterized by gently rolling terrain, low-relief hills, agricultural plots on mild slopes, and small drainage valleys, and is located at an altitude of 630 to 700 m above sea level. The distance between the station and the gateway is approximately 20 m, and both were installed at a height of approximately 5 m. The system was installed on 10 June 2025, when continuous data acquisition and storage began.
2.2. Materials
The following materials were used during the project:
- Sensors of the Khomp W104 weather station (Figure 1), responsible for accurately and systematically collecting the environmental data mentioned above [15].
- Primary solar power supply (Figure 2(a)), included with the weather station and sufficient to power the sensors and maintain stable LoRaWAN communication.
- Secondary power supply, a 12 V, 7 Ah battery (Figure 2(b)), for periods when the primary source is insufficient to power the system.
The internal battery of the weather station and the solar panel ensure consistent autonomy through a balance between battery charging and the energy available for transmission throughout the day, regardless of weather conditions, from the installation date to the present.
- LoRa device (Figure 3) used for communication through the LoRaWAN protocol. The equipment consists of two integrated modules: the NIT 21LI, responsible for transmitting data to the gateway, and the EMW104, an IoT Climate Extender designed to expand the measurement capabilities of climate sensors and weather stations.
- Khomp ITG 201 Outdoor LoRaWAN gateway manufactured by Khomp (Figure 4) for receiving data through the LoRaWAN protocol and sending the data via an Ethernet connection to the server available at Instituto Mauá de Tecnologia, with access provided through Smart Campus Mauá.
Data transmission uses LoRaWAN Class A, and data collection occurs at a sampling interval of up to 5 min, with 289 messages expected per day.
The transmission power of the RN2903 module is up to +18.5 dBm (approximately 70 mW) in the 915 MHz band, as specified by the manufacturer, Microchip. This power can be adjusted through software but is subject to local regulations, such as those of Anatel – Agência Nacional de Telecomunicações (National Telecommunications Agency in Brazil), which follows the LA915 plan based on AU915. In the LoRaWAN standard, the code rate is fixed at 4/5 to balance efficiency and reliability. The bandwidth of LoRa devices can be configured to values such as 125 kHz, 250 kHz, or 500 kHz, depending on the region and application. For the RN2903 module, which operates in the 915 MHz band, the supported bandwidths are 125 kHz, 250 kHz, and 500 kHz, in accordance with regional plans such as AU915. In Brazil, the LA915 plan (based on AU915) defines the use of 64 channels of 125 kHz for uplink and 8 channels of 500 kHz for downlink.
The spreading factor (SF) in LoRa defines the number of bits per symbol and controls the trade-off among range, data rate, energy consumption, and immunity to interference. It typically ranges from SF7 to SF12. The Adaptive Data Rate is enabled between the server and the device, and because the spreading factor (SF) and data rate (DR) are inversely related, it can be changed at each transmission to optimize the relationship between transmission power and range. For the weather station, the DR values remain constant at DR5 (SF7, 125 kHz, 5470 bit/s).
LoRaWAN devices must comply with minimum requirements for transmission and reception by the gateway while maintaining data integrity. The estimated end-to-end latency may be considered between the device and gateway, between the gateway and server, and among the services that connect to the server and write to the database, as follows:
- -
- LoRa device → Gateway: 100 to 400 ms;
- -
- Gateway → Server (UDP/MQTT): 50 to 500 ms;
- -
- Server → Original MQTT broker: < 100 ms;
- -
- topic-rewrite program (Golang): 1 to 10 ms;
- -
- forwarding to the new MQTT broker: 1 to 50 ms;
- -
- parse-to-influxdb3 program (Golang): 1 to 15 ms;
- -
- writing to InfluxDB 3: 10 to 100 ms.
Therefore, transmission from the LoRa device to database writing can be considered to range from 163 ms to 1175 ms, depending on the software architecture and radio transmission limits used. The use of timestamps in communication allowed us to confirm that the latency is less than 1.2 seconds. Data validation can be performed using the message integrity check bits (CRC). Messages that fail the integrity check are discarded by the gateway itself. Therefore, packets forwarded by the gateway can be considered free of detectable transmission errors according to the CRC mechanism; however, this does not by itself guarantee the physical validity of the sensor measurements.
2.3. System Architecture and Communication
The first step was to identify the main environmental variables that affect effective wheat cultivation, with greater emphasis on temperature, humidity, atmospheric pressure, solar incidence, rainfall, and wind speed. Thus, the weather station supplied by Khomp was selected because of familiarity with its installation, its record of effectiveness as observed in the unit installed at IMT, and its long-distance communication using LoRa technology and the LoRaWAN protocol [11]. The process, configuration, and installation are detailed below.
Through Long Range (LoRa) communication, the data captured by the weather station are transmitted by radio waves in an unlicensed frequency band (915 MHz), enabling robust transmission over distances of up to 15 km under ideal conditions. This characteristic makes LoRa communication highly desirable for precision agriculture applications and IoT projects [9]. The data flow is received by a gateway using the LoRaWAN protocol, which then transmits the data to a network server, enabling the creation of dashboards for graphical visualization of the information collected by the weather station sensors.
The LoRaWAN protocol is a communication protocol that uses LoRa as the wireless communication channel to establish a complete connection with end-device addressing, gateways, packet anti-collision mechanisms, and other elements required for an organized network to operate properly, in addition to implementing several details and network security itself [16]. LoRaWAN consists of end devices that send the acquired data through LoRa technology and gateways that receive the data by radio and forward them to a network server, which can be accessed remotely via the Internet. Thus, the LoRaWAN protocol is a secure and reliable means of exchanging information among IoT devices.
The use of dashboard creation tools such as Grafana and Node-RED enables visualization of the real-time data received by the platform through the MQTT (Message Queuing Telemetry Transport) protocol. The interface allows a deeper and more contextualized analysis of local atmospheric conditions through several graphs of the time-series data. However, because Node-RED prioritizes only real-time data, Grafana was selected because it displays information obtained over a period defined by the user.
The block diagram of the complete sensor-signal monitoring system is presented in Figure 5. It shows an example of the data flow, from sensor readings at the weather station to the display of the collected data through dashboards, for greater clarity and understanding.
All weather station and gateway components were arranged to enable a simple and effective installation, as shown in Figure 6, using a sealed enclosure with an IP66 protection rating to protect them against weather, dust, and moisture.
The gateway supplied by Khomp was configured through a local web page, as shown in Figure 7(a), where the IMT network address, access ports, and IMT DNS were entered, as shown in Figure 7(b). The next step was to integrate the gateway into the IMT network server, which was accomplished by adding the gateway profile (Figure 8) and creating an authentication and activation profile for the weather station, thereby enabling stable and secure communication between the LoRa device and the network server (Figure 9). There are two different activation modes: Activation by Personalization (ABP) and Over-the-Air Activation (OTAA). It is recommended that devices under development use ABP and production devices use OTAA. For the weather station, OTAA mode is used (DevEUI: f8033201000385fa), with the JoinEUI (f803320100000000) and OTAA authentication credentials were configured on the network server; sensitive keys are omitted for security reasons. When OTAA activation is used, the DevAddr, NetworkSessionKey, and ApplicationSessionKey are generated automatically and periodically renewed according to the connection established between the device and server.
Finally, the “WeatherStation_4” application was developed to receive the data, providing the previously configured OTAA authentication and the gateway EUI (Figure 10). Figure 11 shows communication among the system points. After configuration, the data are sent through the MQTT protocol and collected by the gateway for delivery to the network server. Because it operates with limited resources and provides asynchronous, decoupled communication with high scalability potential, MQTT is an excellent solution for IoT applications [17,18,19,20].
After configuration, both the gateway and the weather station were installed on the farm in São Miguel Arcanjo, as shown in Figure 12.
Figure 13, Figure 14 and Figure 15 show data for received messages (Received), RSSI (Received Signal Strength Indication), SNR (Signal-to-Noise Ratio), distribution of received messages by frequency band and Data Rate (DR), and Activation Errors (OTAA) from April 2025 to March 2026 (one year), from 16 March to 15 April 2026 (one month), and between 14 and 15 April 2026 (one day).
It should be noted that the equipment was installed in the field only in June 2025; however, data had already been collected and evaluated since April during the equipment testing phase.
Figure 16 shows the sensor values received through MQTT.
3. Results
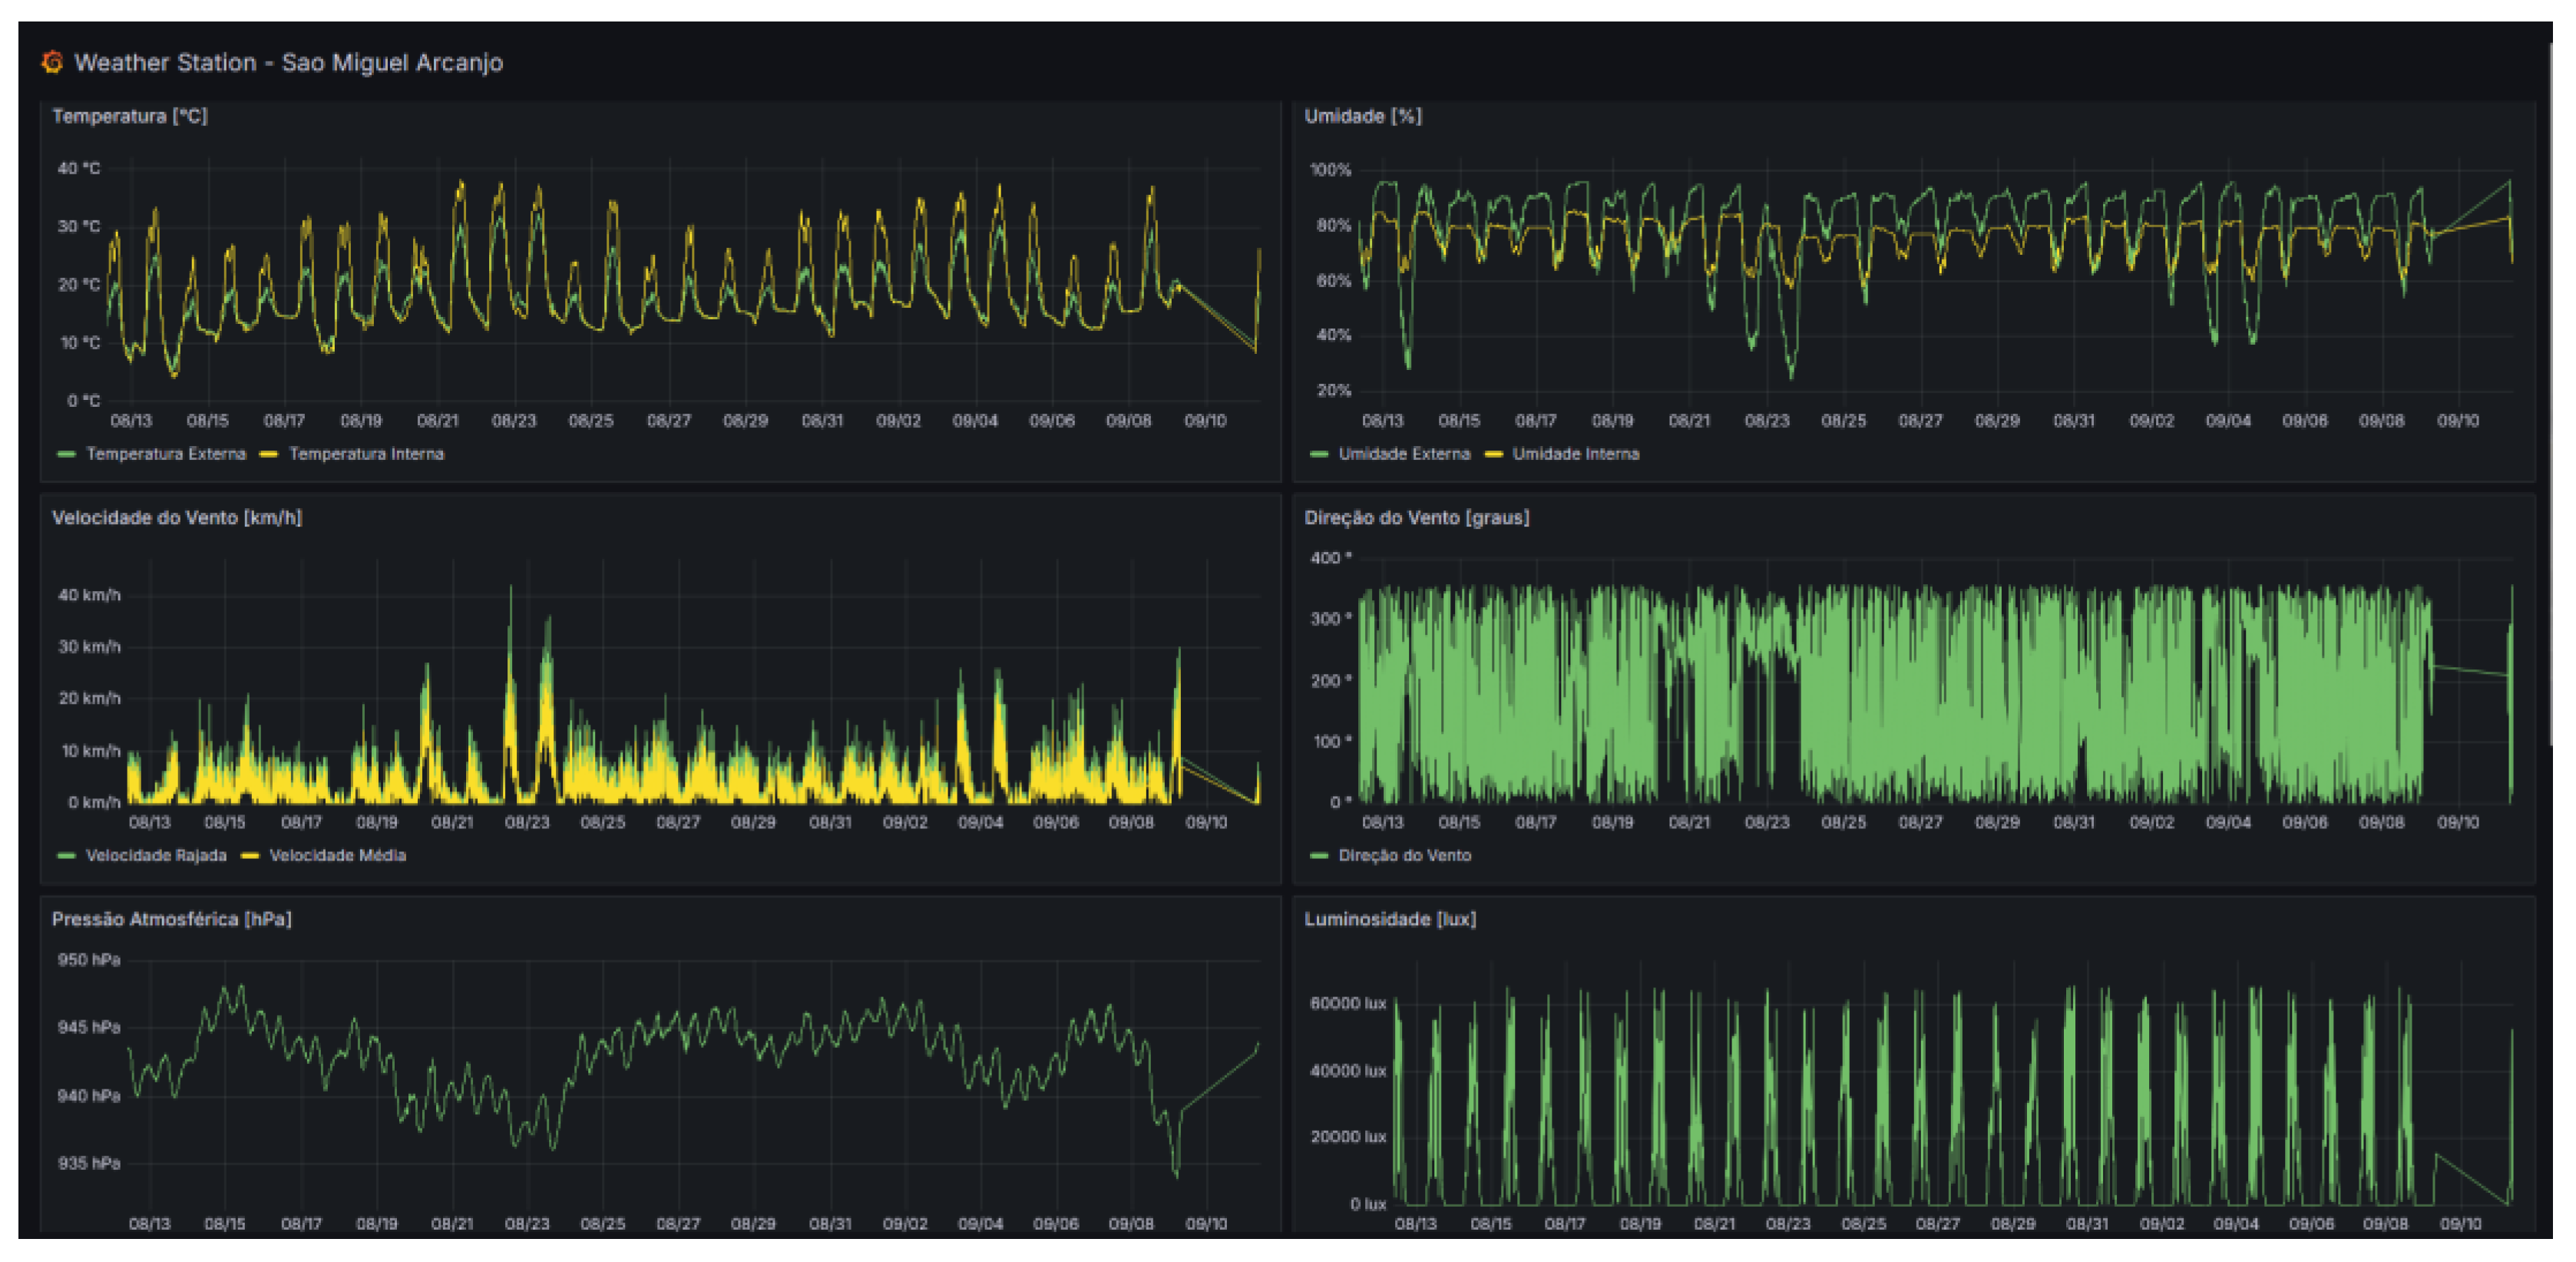
After the meteorological sensors were installed, the transmitted data readings were sent to the IMT Smart Campus, where the collected information was visualized through dashboards such as Grafana (Figure 17), thus enabling graphical and correlational analysis across sensor measurements. Grafana was selected because of its high versatility and strong potential for expansion in data analysis and processing. Several functions, such as alarms, are available; for example, a notification can be sent when high wind speed is detected at the site.
The database used is InfluxDB 3 in the Smart Campus Mauá production environment, running on a virtual machine with read and write access to the database through the DNS influxdb.maua.br.
The LoRaWAN devices were registered on an open-source ChirpStack LoRaWAN server instantiated on a publicly accessible virtual machine. This allows gateways connected to the server to send information from the devices connected to them, while user-side applications can connect and receive sensor information through services that interface with the platform so that the data are decoded and inserted into the database. The records corresponding to each device sensor are defined as follows: sensor_data is the table name; sensor_type is the sensor type; device_model is the associated device model; value_int, value_float, and value_bool are the fields associated with the values of each sensor_type.
Each sensor_type has the following characteristics:
- Rain gauge - records the accumulated precipitation level (in millimeters); includes a protective bird guard; precipitation measurement accuracy: less than 15 mm: ±1 mm and from 15 mm to 6553.5 mm: ±7%.
- Wind speed and direction sensor - records wind speed (average and gust) and angular direction where: wind direction: 0–359°; wind direction accuracy: 45° (8 points); wind speed: 0–180 km/h (0–50 m/s); wind speed accuracy: 2–10 m/s (±3 m/s); 10–56 m/s (±10%).
- Temperature and humidity sensor - records temperature and humidity at the operating site; humidity range: 10–99% (1% resolution); humidity measurement accuracy: ±5%; temperature range: −40 °C to +60 °C; temperature accuracy: ±1 °C.
- Illuminance sensor – measurement unit: lux; resolution: 1 lux; range: 0–128,000 lux; accuracy: ±15%.
- Ultraviolet sensor: UVB and UVA; index-scale accuracy: ±1 level.
Data cleaning routines are performed by InfluxDB itself and are associated with the database. Therefore, all tables created within the same database (bucket) must have the same data-retention policy.
4. Discussion and Conclusions
The developed system successfully acquired and transmitted environmental data on environmental variables through the Khomp weather station, with easy access enabled by the LoRaWAN® protocol and a user-friendly, comprehensive presentation through dashboards. Through this set of technologies, both current site data and data from the previous 30 days can be collected. These data are extremely valuable in agriculture because they enable highly precise, targeted changes in areas presenting irregularities and allow verification of their effectiveness.
The minimum PDR of 82.7% obtained in this study is consistent with the variability reported for LoRaWAN deployments in agricultural environments, where packet delivery is influenced by vegetation, network configuration, gateway positioning, and possible interferences. However, the short 20 m separation between the end device and gateway suggests that packet losses in the present system may also be associated with network-server availability or system-level communication rather than radio propagation alone. On the other hand, it is important to note that a significant portion of the data loss occurred during the device’s initialization and configuration process, during the first month after installation.
Furthermore, making information available via the Internet may provide greater operational flexibility and reduce the need for manual data collection. Examples of actions derived from the collected data include irrigation management, disease-risk assessment, frost alerts, crop-growth modeling, spraying-window planning, extreme-weather warnings and many other applications, thereby demonstrating the system’s relevance in precision agriculture.
Author Contributions
The individual contributions of the authors are described below: Conceptualization, W.O.A., J.G.A.B., A.C. and F.A.M.; methodology, R.C.P., W.O.A., J.G.A.B., A.D.C. and F.A.M.; software, R.C.P., O.B.N. and L.F.M.N.; validation, R.C.P., O.B.N., W.O. A. and L.F.M.N.; formal analysis, W.O.A., J.G.A.B. and A.D.C.; investigation, R.C.P., O.B.N. and W.O.A.; resources, O.B.N., W.O.A., J.G.A.B. and A.C.; data curation, R.C.P. and W.O.A.; writing—original draft preparation, R.C.P., O.B.N., W.O.A., J.G.A.B. and A.D.C.; writing—review and editing, W.O.A.; visualization, R.C.P. and W.O.A.; supervision, W.O.A.; project administration, W.O.A. and J.G.A.B.; funding acquisition, W.O.A., J.G.A.B.,A.D.C. and F.A.M.
Funding
This research was funded by the São Paulo Research Foundation (FAPESP), Brazil, through an undergraduate research fellowship, grant number 2024/04417-0, and by the Regular Research Grant “Estimating Wheat Yield Using Crop Modeling: Assimilation of In Situ Data”, grant number 2024/01308-3. The APC was funded by FAPESP.
Data Availability Statement
The data presented in this study are available from the corresponding author upon reasonable request.
Institutional Review Board Statement
Not applicable.
Informed Consent Statement
Not applicable.
Conflicts of Interest
The authors declare no conflicts of interest.
References
- Mora, R. C. Digestive Health Benefits of Wheat Bran: Scientific Evidence. Nutr. Hosp. 2015, v. 32, 41–45. Available online: https://www.aulamedica.es/nh/pdf/9478.pdf.
- Alomari, D. Z.; Schierenbeck, M.; Alqudah, A. M.; Alqahtani, M. D.; Wagner, S.; Rolletschek, H.; Borisjuk, L.; Röder, M. S. Wheat grains as a sustainable source of protein for health. Nutrients 2023, 15(20), 4398. [Google Scholar] [CrossRef] [PubMed]
- Guarienti, E. M. Effect of Meteorological Variables on the Industrial Quality of Wheat. Doctoral Thesis, Food Engineering, School of Food Engineering, Unicamp, São Paulo, 2001. [Google Scholar]
- Guarienti, E. M.; Ciacco, C. F.; Cunha, G. R.; Del Duca, L. J. A.; Camargo, C. M. O. Evaluation of the Effect of Meteorological Variables on the Industrial Quality and Grain Yield of Wheat Using Principal Component Analysis. Ciência E Tecnol. De Aliment. 2023, 23(3). [Google Scholar] [CrossRef]
- Ibañez, J. A. G.; Gonzalez, M. E.; Tejeda, M. A. M.; Gutierrez, M. G. R.; Aguirre, J. M. A.; Mendoza, C. A. M.; Zuñiga, D. T.; Gonzalez, V. I. L. SGreenH-IoT: IoT Platform for Precision Agriculture. Sist. Cibernética E Informática 2017, v. 14(n. 2). Available online: https://www.iiisci.org/journal/pdv/risci/pdfs/ca544si17.pdf.
- Pinho, T.; Cunha, J. B.; Morais, R. Electronic and Computing Technologies for Data Collection and Integration in Precision Agriculture. Rev. De Ciências Agrárias 2015, 38(3), 291–304. Available online: https://revistas.rcaap.pt/rca/article/view/16933/13788 (accessed on 10 July 2025).
- Jiménez, A. F.; Cárdenas, P.-F.; Jiménez, F. Intelligent IoT-multiagent precision irrigation approach for improving water use efficiency in irrigation systems at farm and district scales. Comput. Electron. Agric. 2022, vol. 192, art. 106635. [Google Scholar] [CrossRef]
- Coelho, A. D.; Dias, B. G.; Assis, W. O.; Martins, F. A.; Pires, R. C. Monitoring of Soil Moisture and Atmospheric Sensors with Internet of Things (IoT) Applied in Precision Agriculture. XIV Technologies Applied to Electronics Teaching Conference (TAEE) Porto, Portugal, 2020; pp. 1–8. [Google Scholar] [CrossRef]
- Usmonov, M.; Gregoretti, F. Design and Implementation of a LoRa-Based Wireless Control for Drip Irrigation Systems. 2nd International Conference on Robotics and Automation Engineering (ICRAE), Shanghai, China, 2017. [Google Scholar] [CrossRef]
- Froiz-Míguez, I.; Lopez-Iturri, P.; Fraga-Lamas, P.; Celaya-Echarri, M.; Blanco-Novoa, Ó.; Azpilicueta, L.; Falcone, F.; Fernández-Caramés, T. M. Design, Implementation, and Empirical Validation of an IoT Smart Irrigation System for Fog Computing Applications Based on LoRa and LoRaWAN Sensor Nodes. Sensors 2020, vol. 20(no. 23), art. 6865. [Google Scholar] [CrossRef] [PubMed]
- Semtech Corporation. LoRa® and LoRaWAN® AN1200.86 LoRa® and LoRaWAN®. Available online: https://www.semtech.com/uploads/technology/LoRa/lora-and-lorawan.pdf (accessed on 10 July 2025).
- Zhang, H.; He, L.; Gioia, F. D.; Choi, D.; Elia, A.; Heinemann, P. LoRaWAN based Internet of Things (IoT) system for precision irrigation in plasticulture fresh-market tomato. Smart Agric. Technol. 2022, vol. 2, art. 100053. [Google Scholar] [CrossRef]
- Ahmed, M. A.; Gallardo, J. L.; Zuniga, M. D.; Pedraza, M. A.; Carvajal, G.; Jara, N.; Carvajal, R. LoRa Based IoT Platform for Remote Monitoring of Large-Scale Agriculture Farms in Chile. Sensors 2022, vol. 22(no. 8), art. 2824. [Google Scholar] [CrossRef] [PubMed]
- EMBRAPA – Agriculture – Embrapa Portal. Available online: https://www.embrapa.br/agropensa/agro-em-dados/agricultura (accessed on 11 September 2025).
- KHOMP. Weather Station V2 LoRa: User Manual. Version PT v1.1; Khomp: Florianópolis, 2024; Available online: https://www.khomp.com/iot/wp-content/uploads/2024/11/Estacao_Meteorologica_V2_LoRa_-_PT_v1-1.pdf (accessed on 28 July 2026).
- Miles, B.; Bourennane, E.-B.; Boucherkha, S.; Chikhi, S. A study of LoRaWAN protocol performance for IoT applications in smart agriculture. Comput. Commun. 2020, vol. 164, 148–157. [Google Scholar] [CrossRef]
- Zamora-Izquierdo, M. A.; Santa, J.; Martinez, J. A.; Martínez, V. Smart farming IoT platform based on edge and cloud computing. Biosyst. Eng. 2019, vol. 177, 4–17. [Google Scholar] [CrossRef]
- Morales-García, J.; Breno-Crespo, A.; Martínez-España, R.; García, F. J.; Ros, S.; Fernández-Pedauyé, J.; Cecilia, J. M. SEPARATE: A tightly coupled, seamless IoT infrastructure for deploying AI algorithms in smart agriculture environments. Internet Things 2023, vol. 22, art. 100734. [Google Scholar] [CrossRef]
- Fathy, C.; Ali, H. M. A Secure IoT-Based Irrigation System for Precision Agriculture Using the Expeditious Cipher. Sensors 2023, vol. 23(no. 4), art. 2091. [Google Scholar] [CrossRef] [PubMed]
- Has, M.; Kreković, D.; Kušek, M.; Žarko, I. P. Efficient Data Management in Agricultural IoT: Compression, Security, and MQTT Protocol Analysis. Sensors 2024, vol. 24(no. 11), art. 3517. [Google Scholar] [CrossRef] [PubMed]
Figure 1.
Khomp weather station sensors.
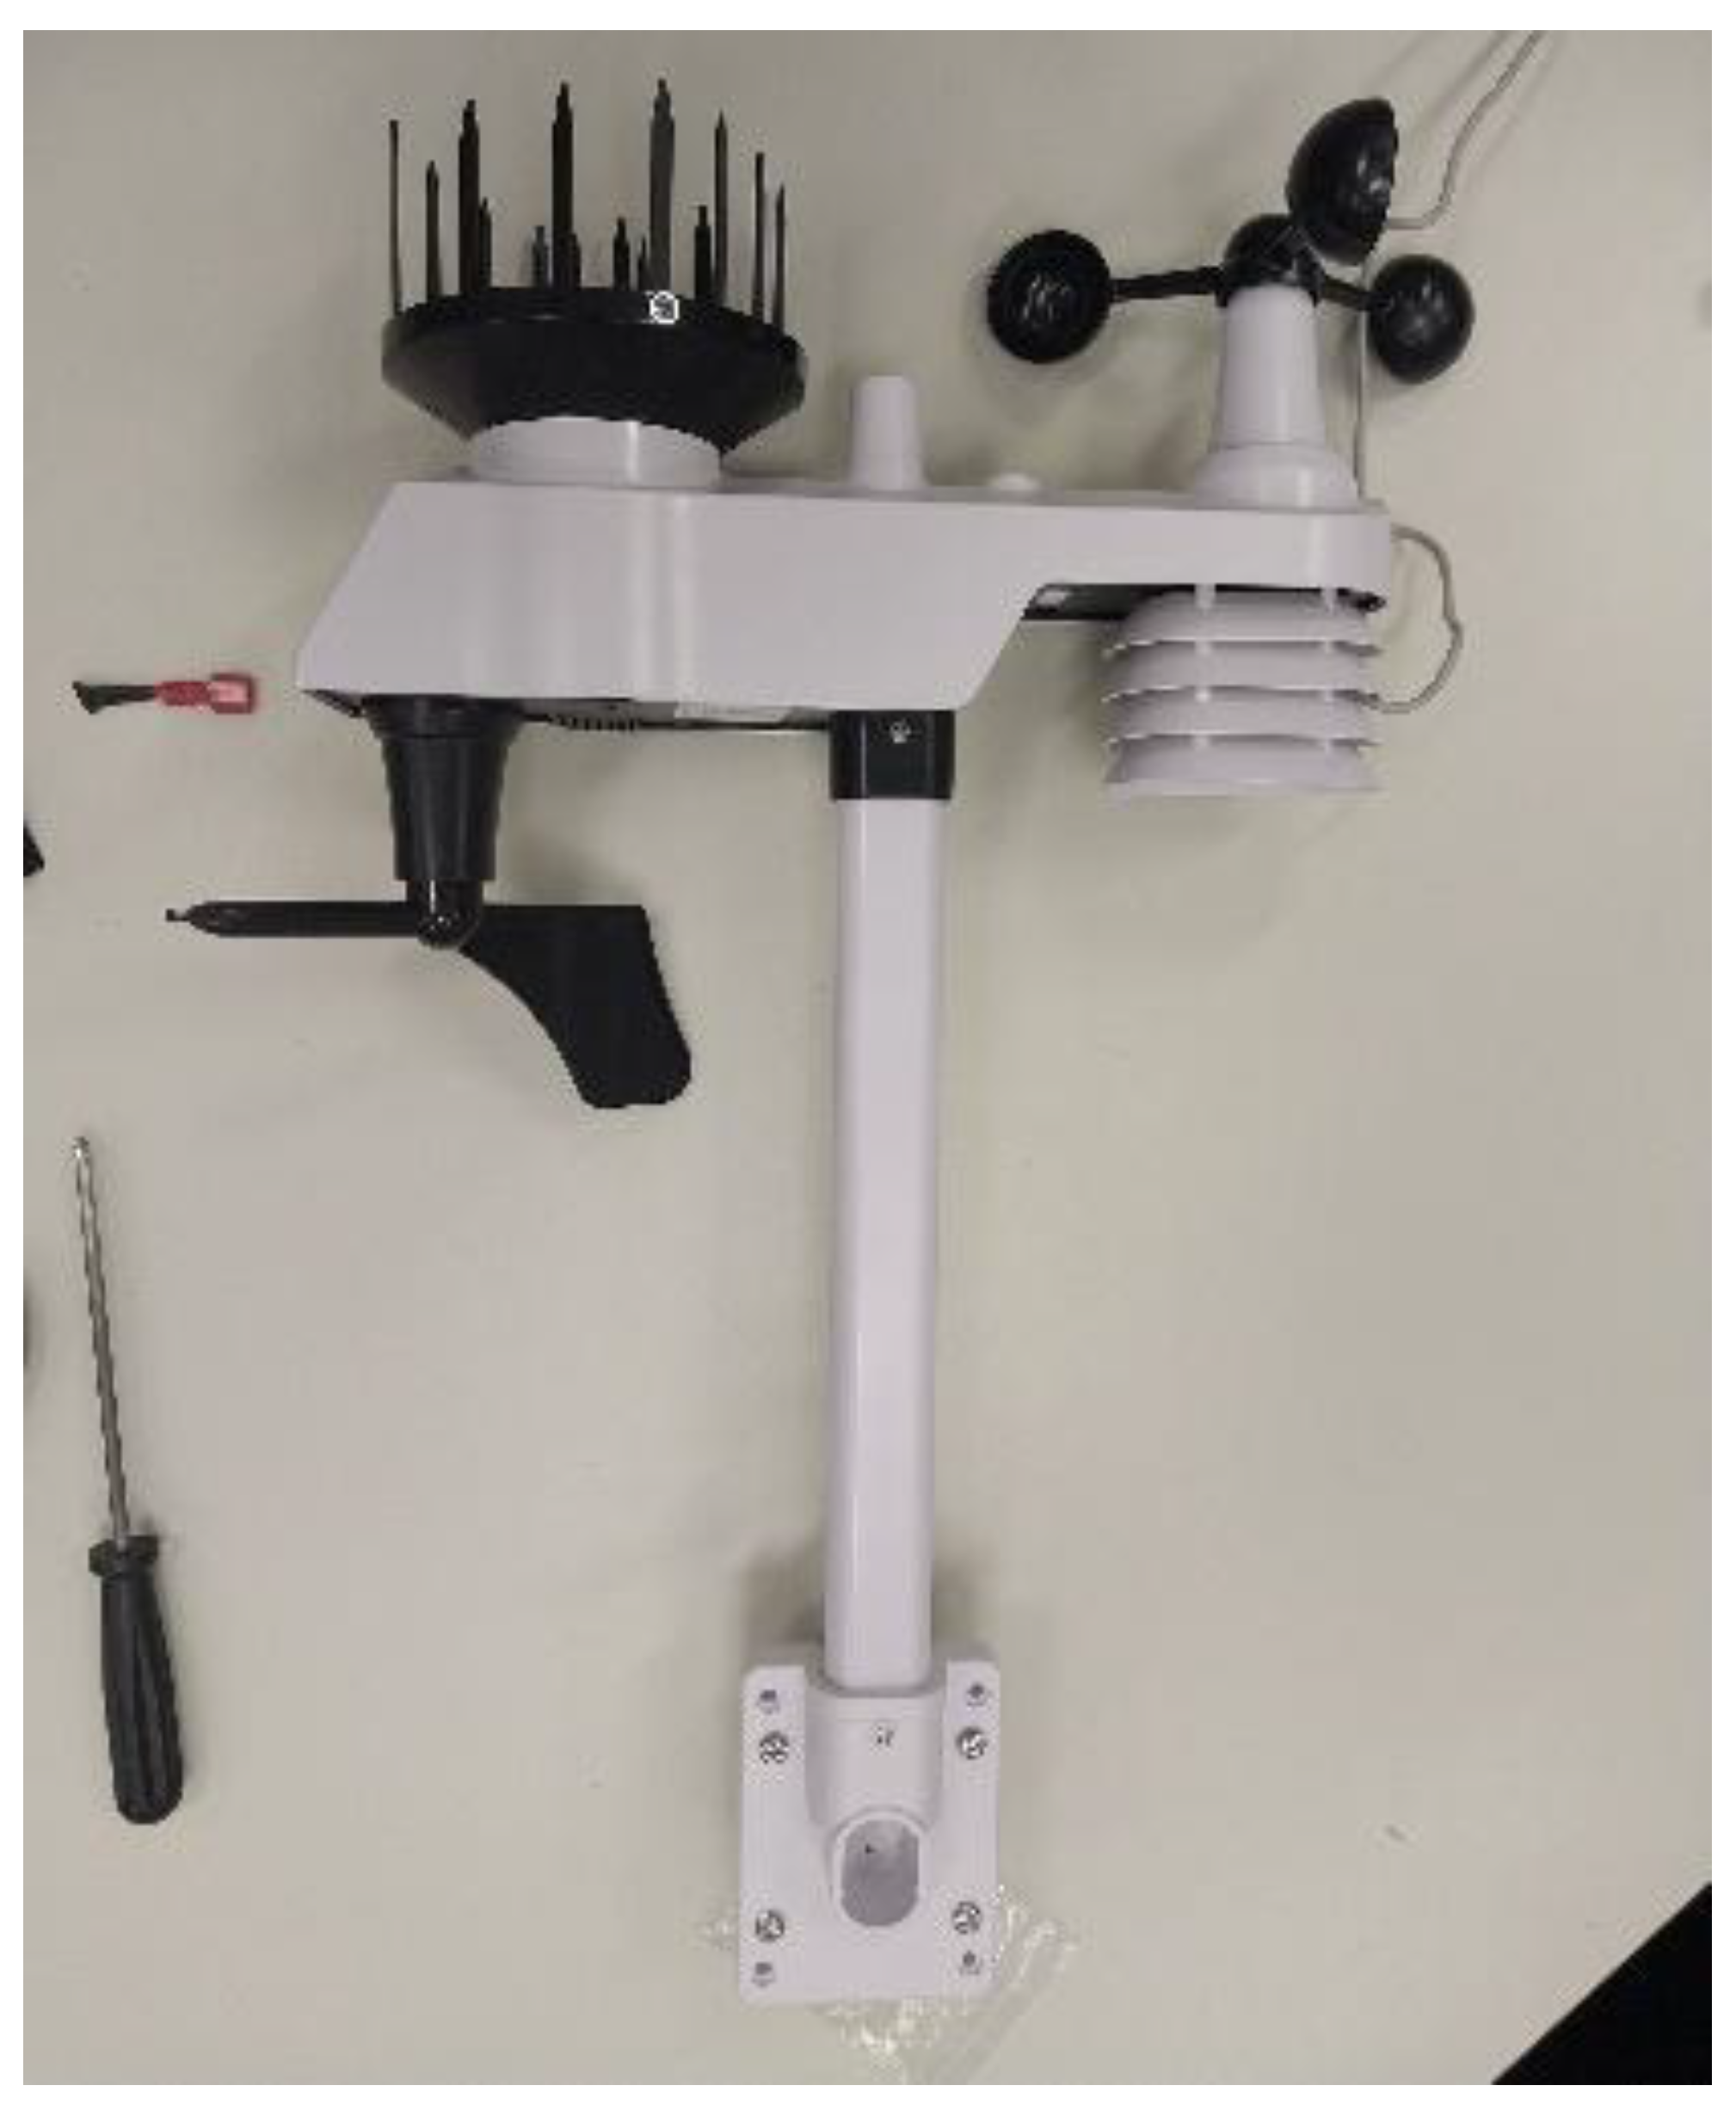
Figure 2.
Power supply system: (a) primary solar source; (b) secondary battery source.
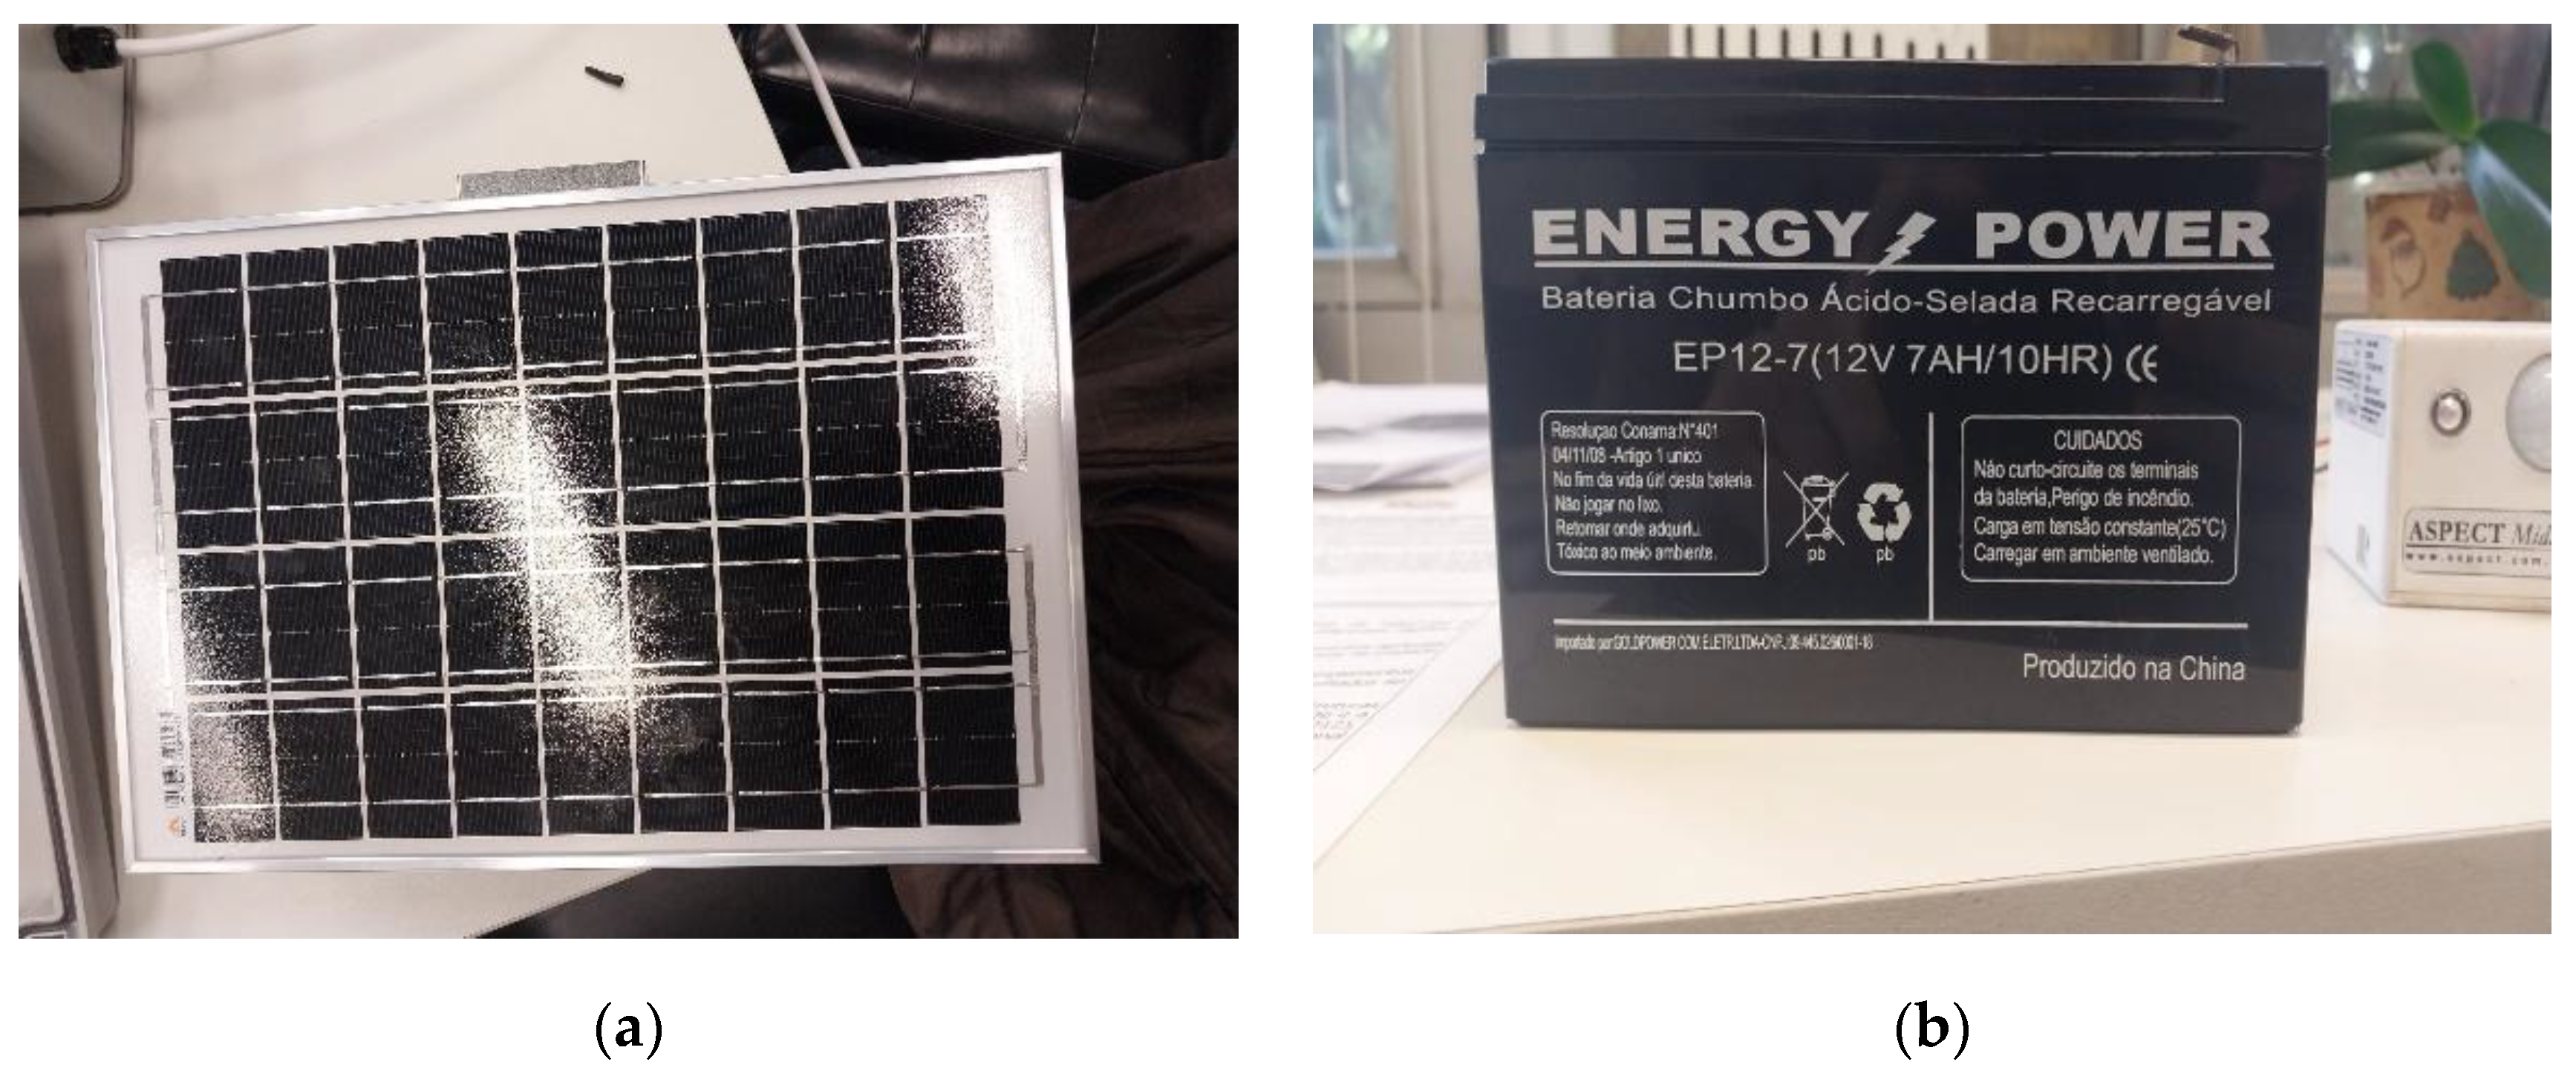
Figure 3.
NIT 21LI and EMW104 modules for communication through the LoRaWAN protocol.
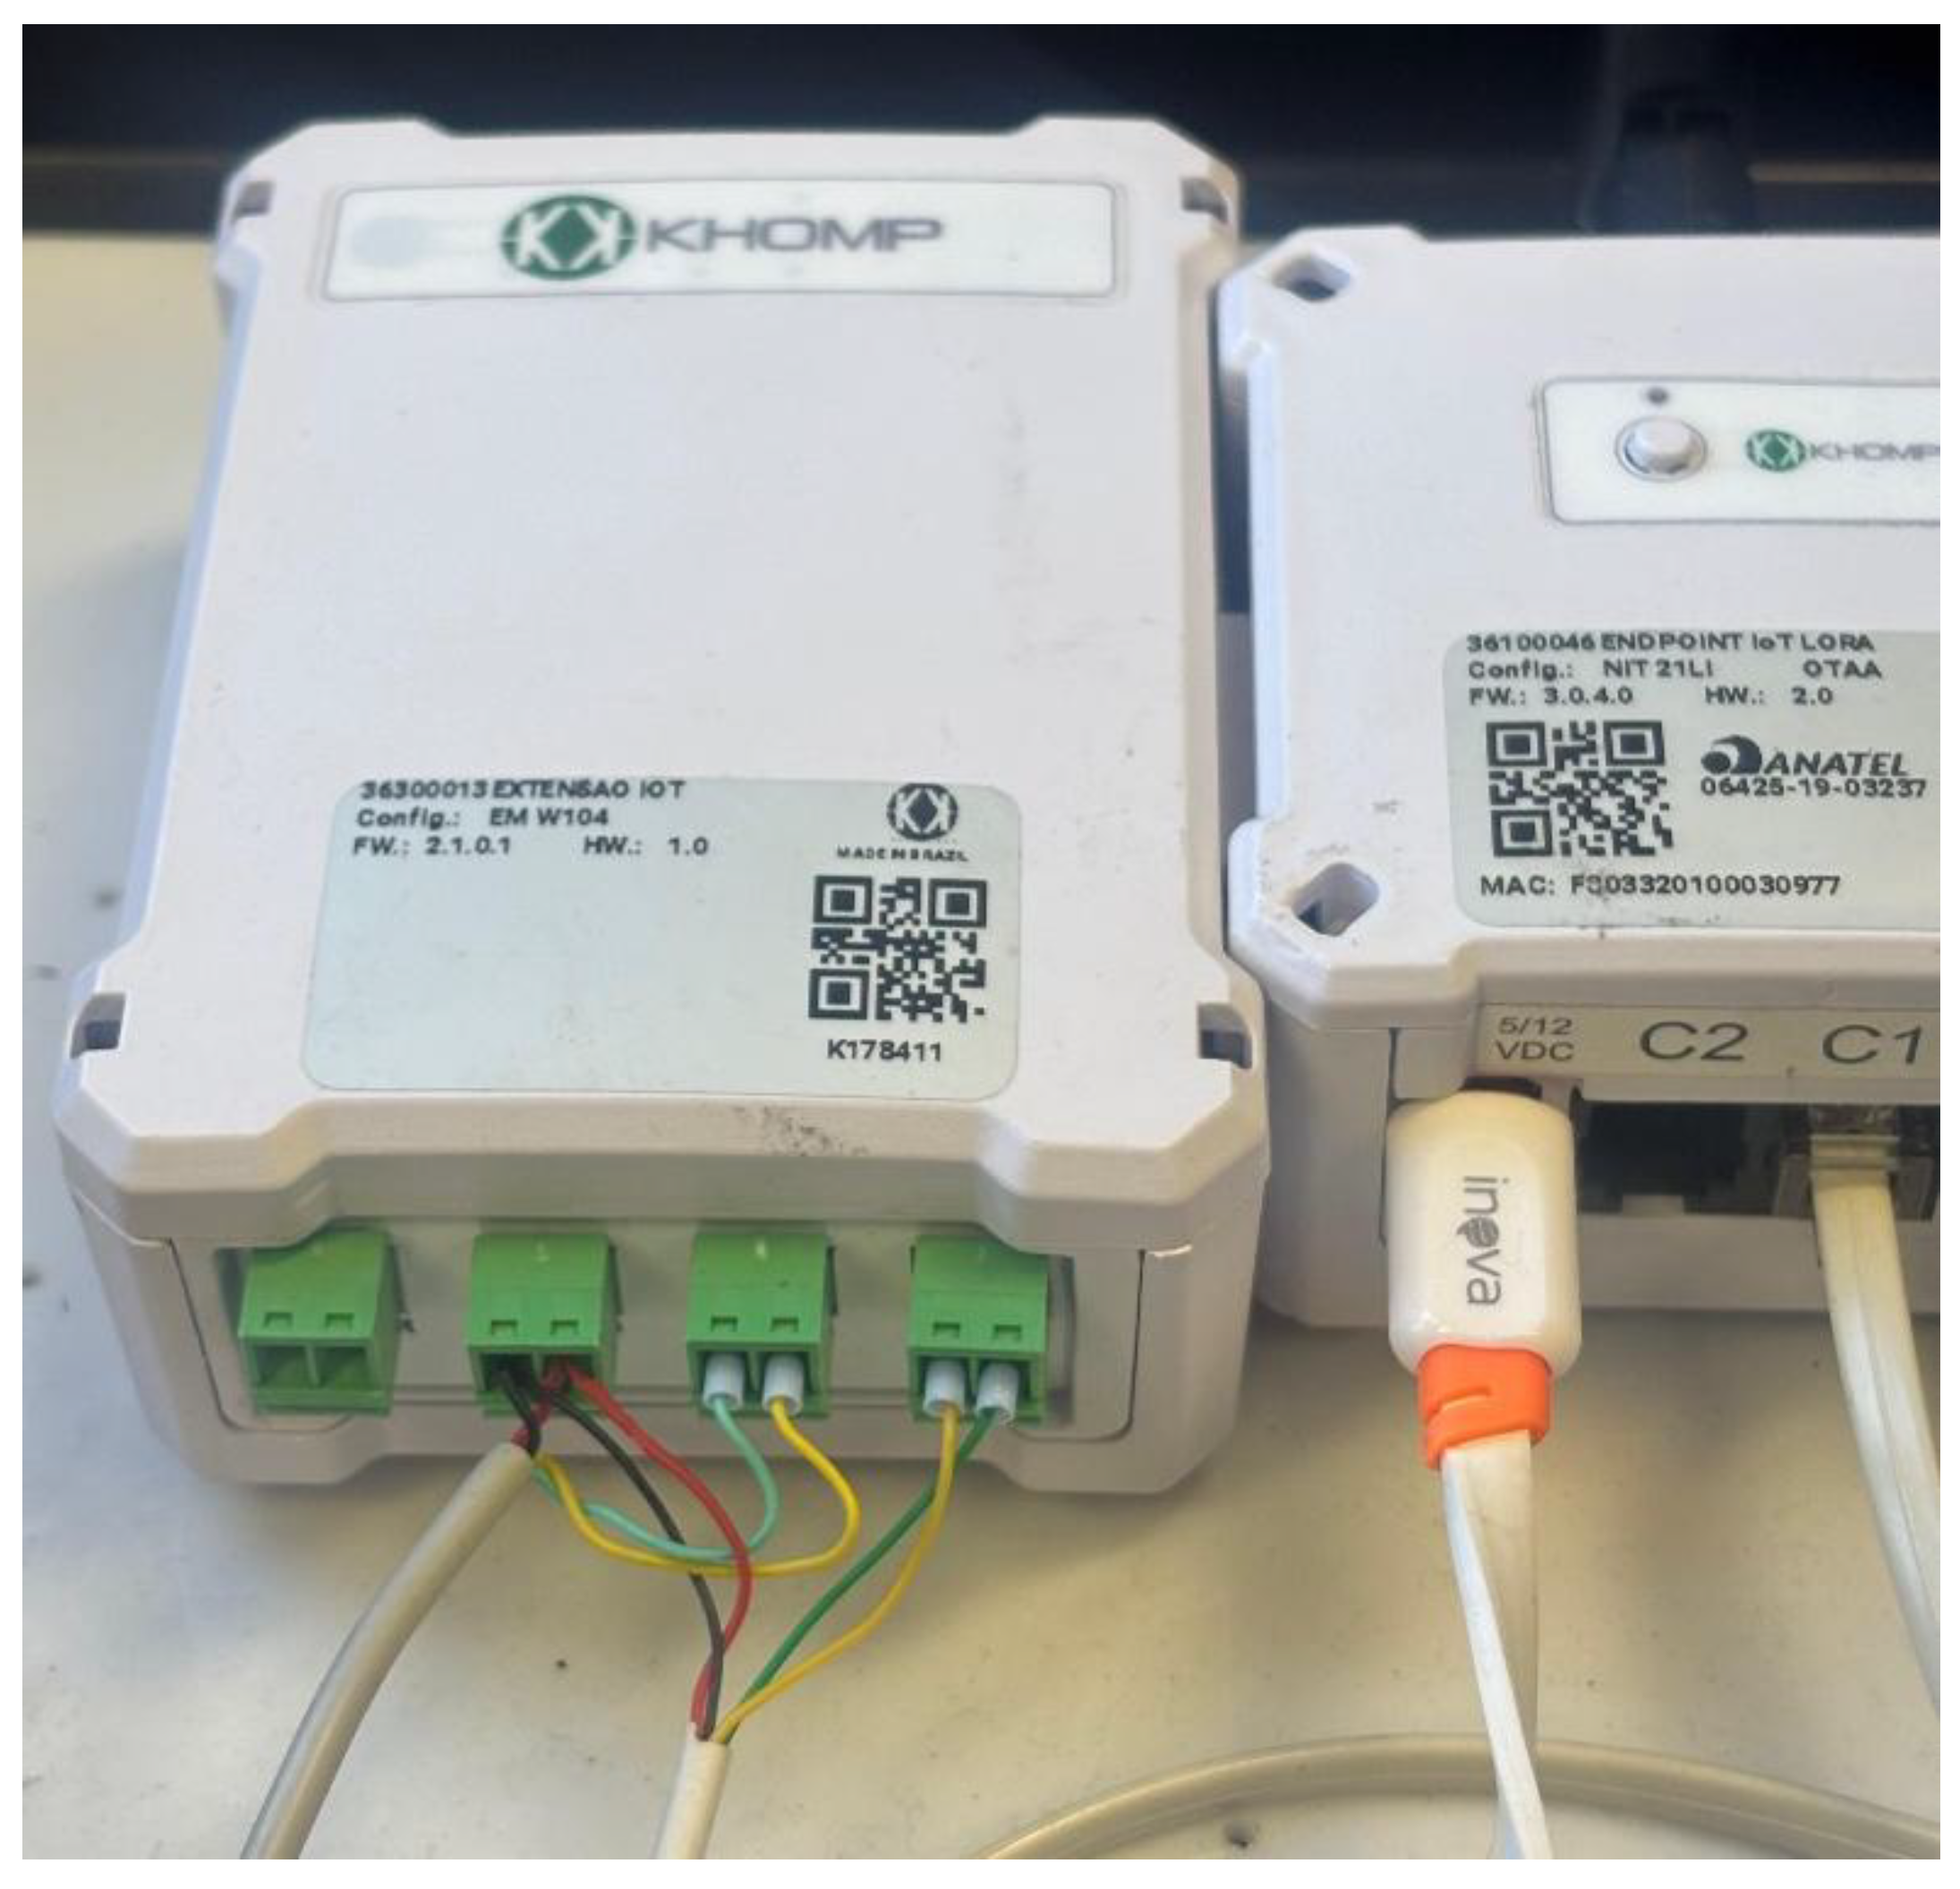
Figure 4.
Gateway manufactured by Khomp.
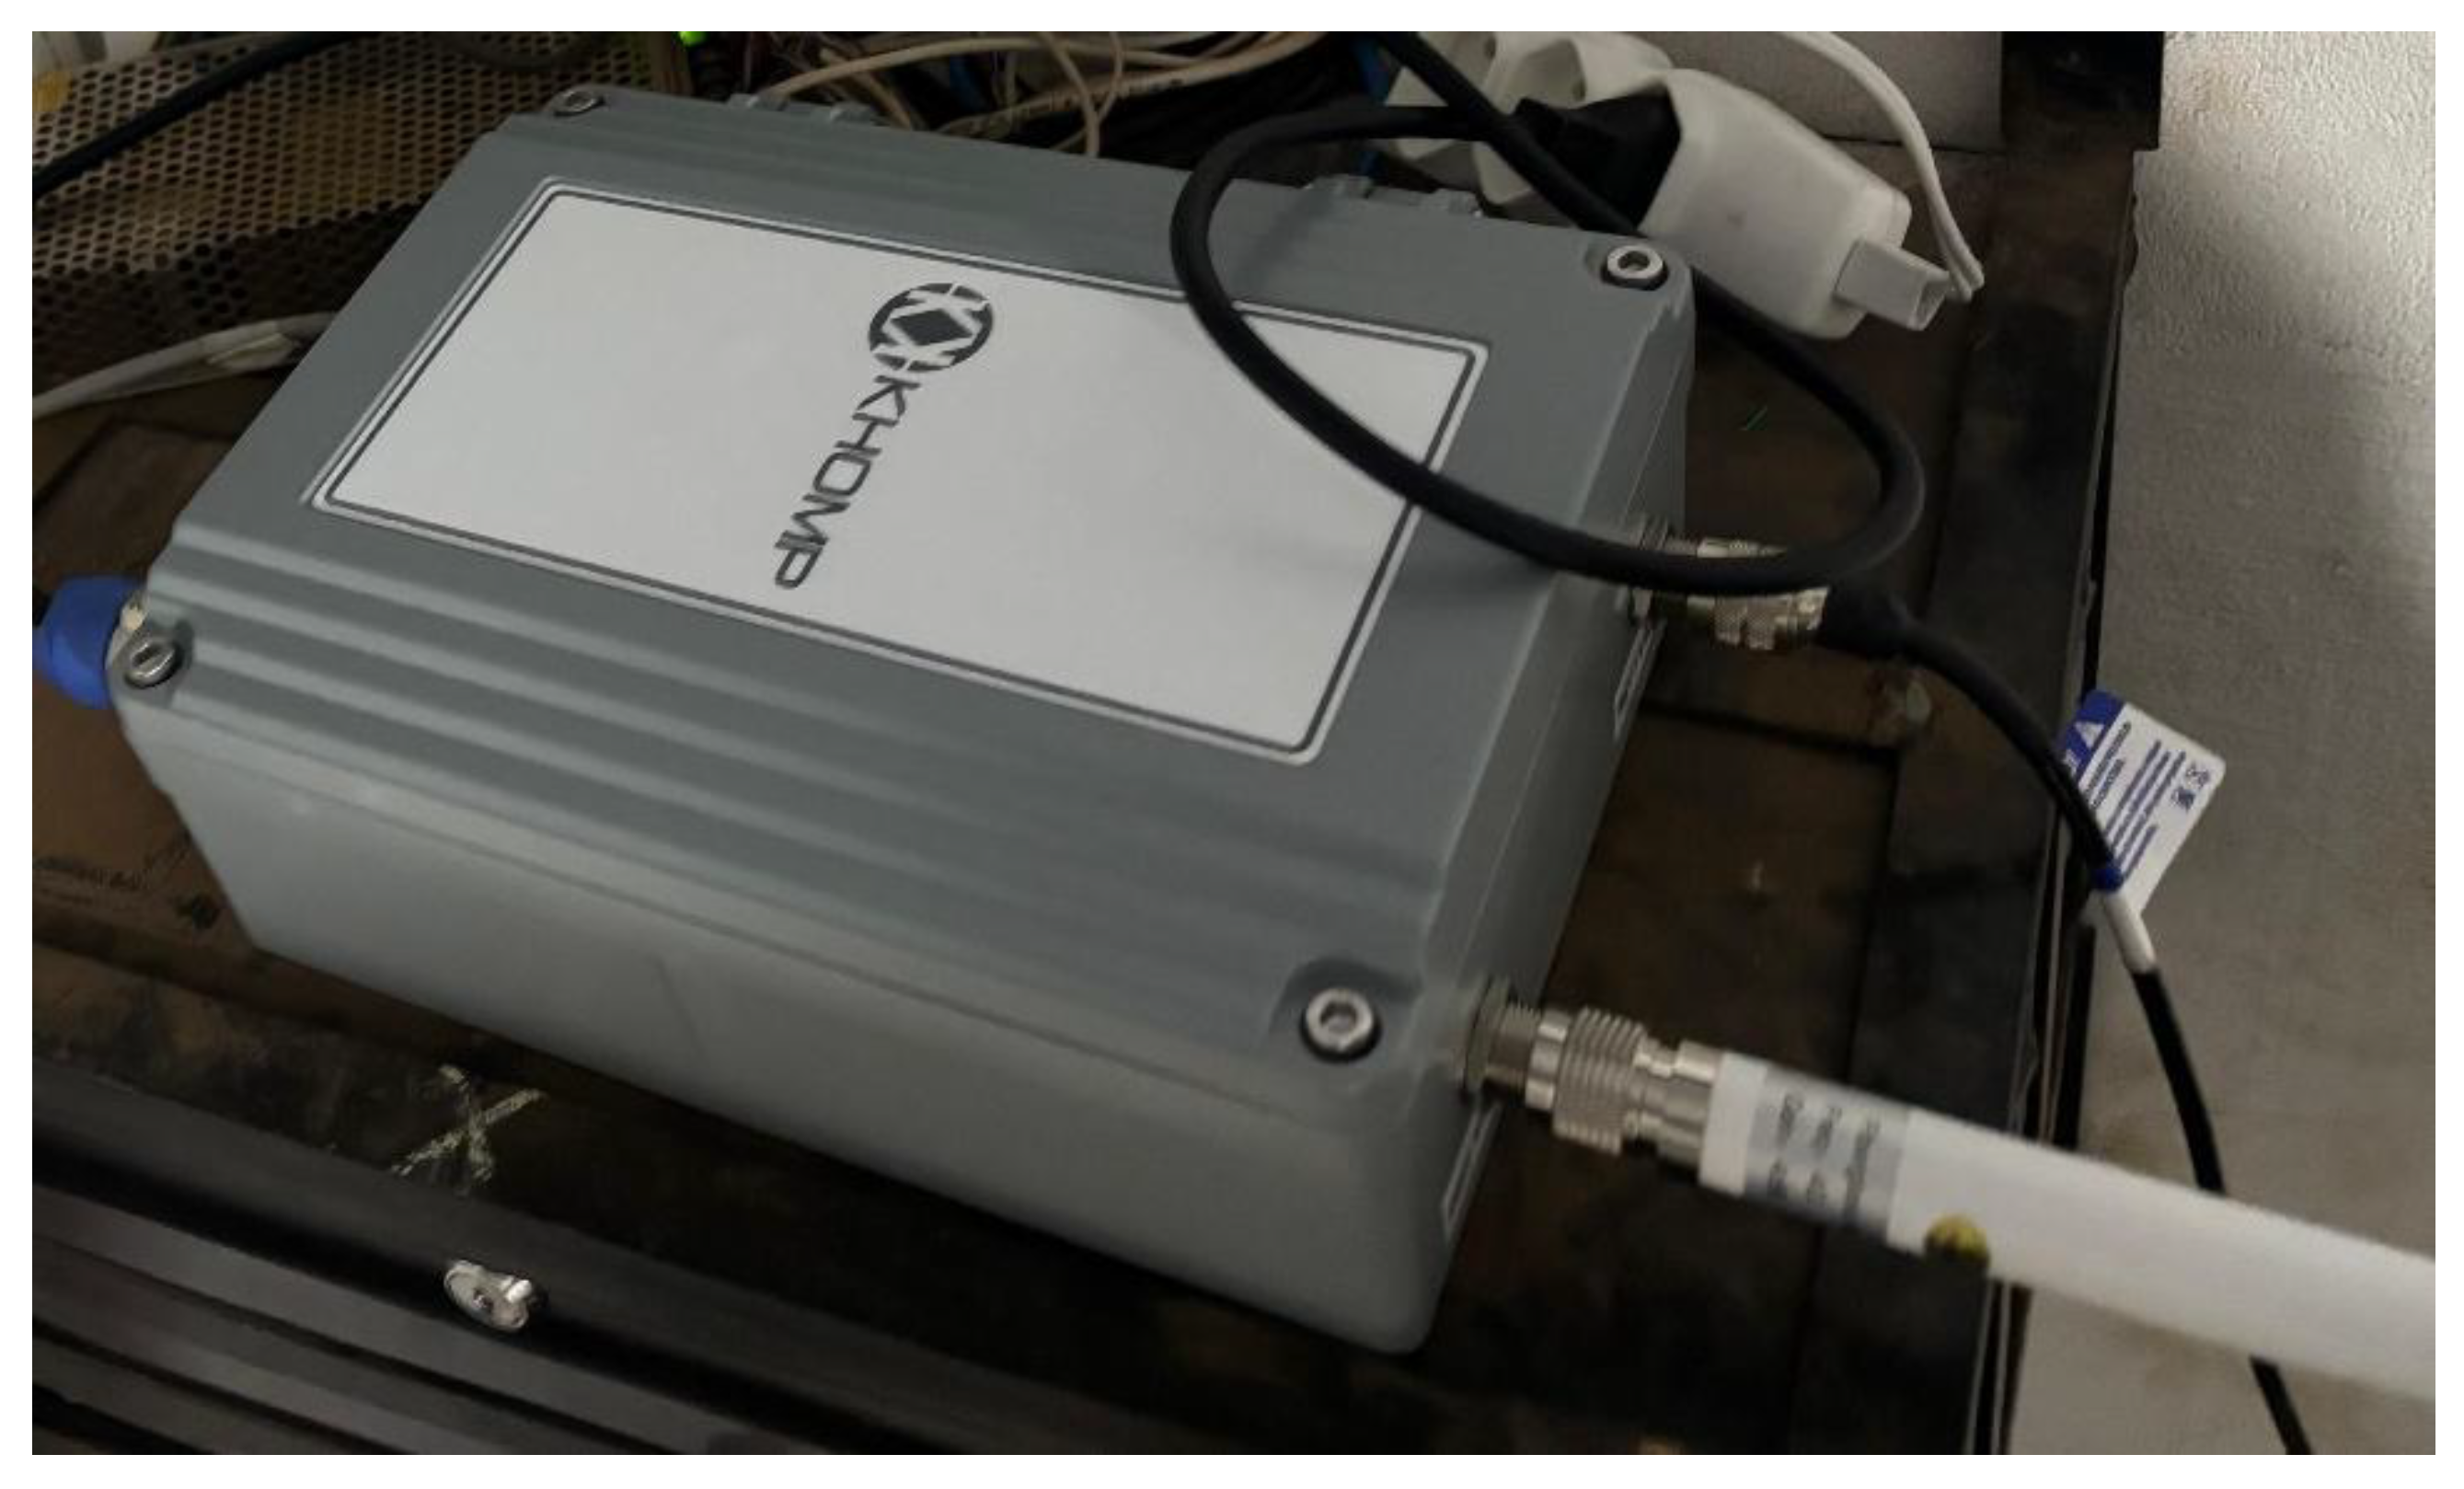
Figure 5.
Complete block diagram of data collection and transmission.
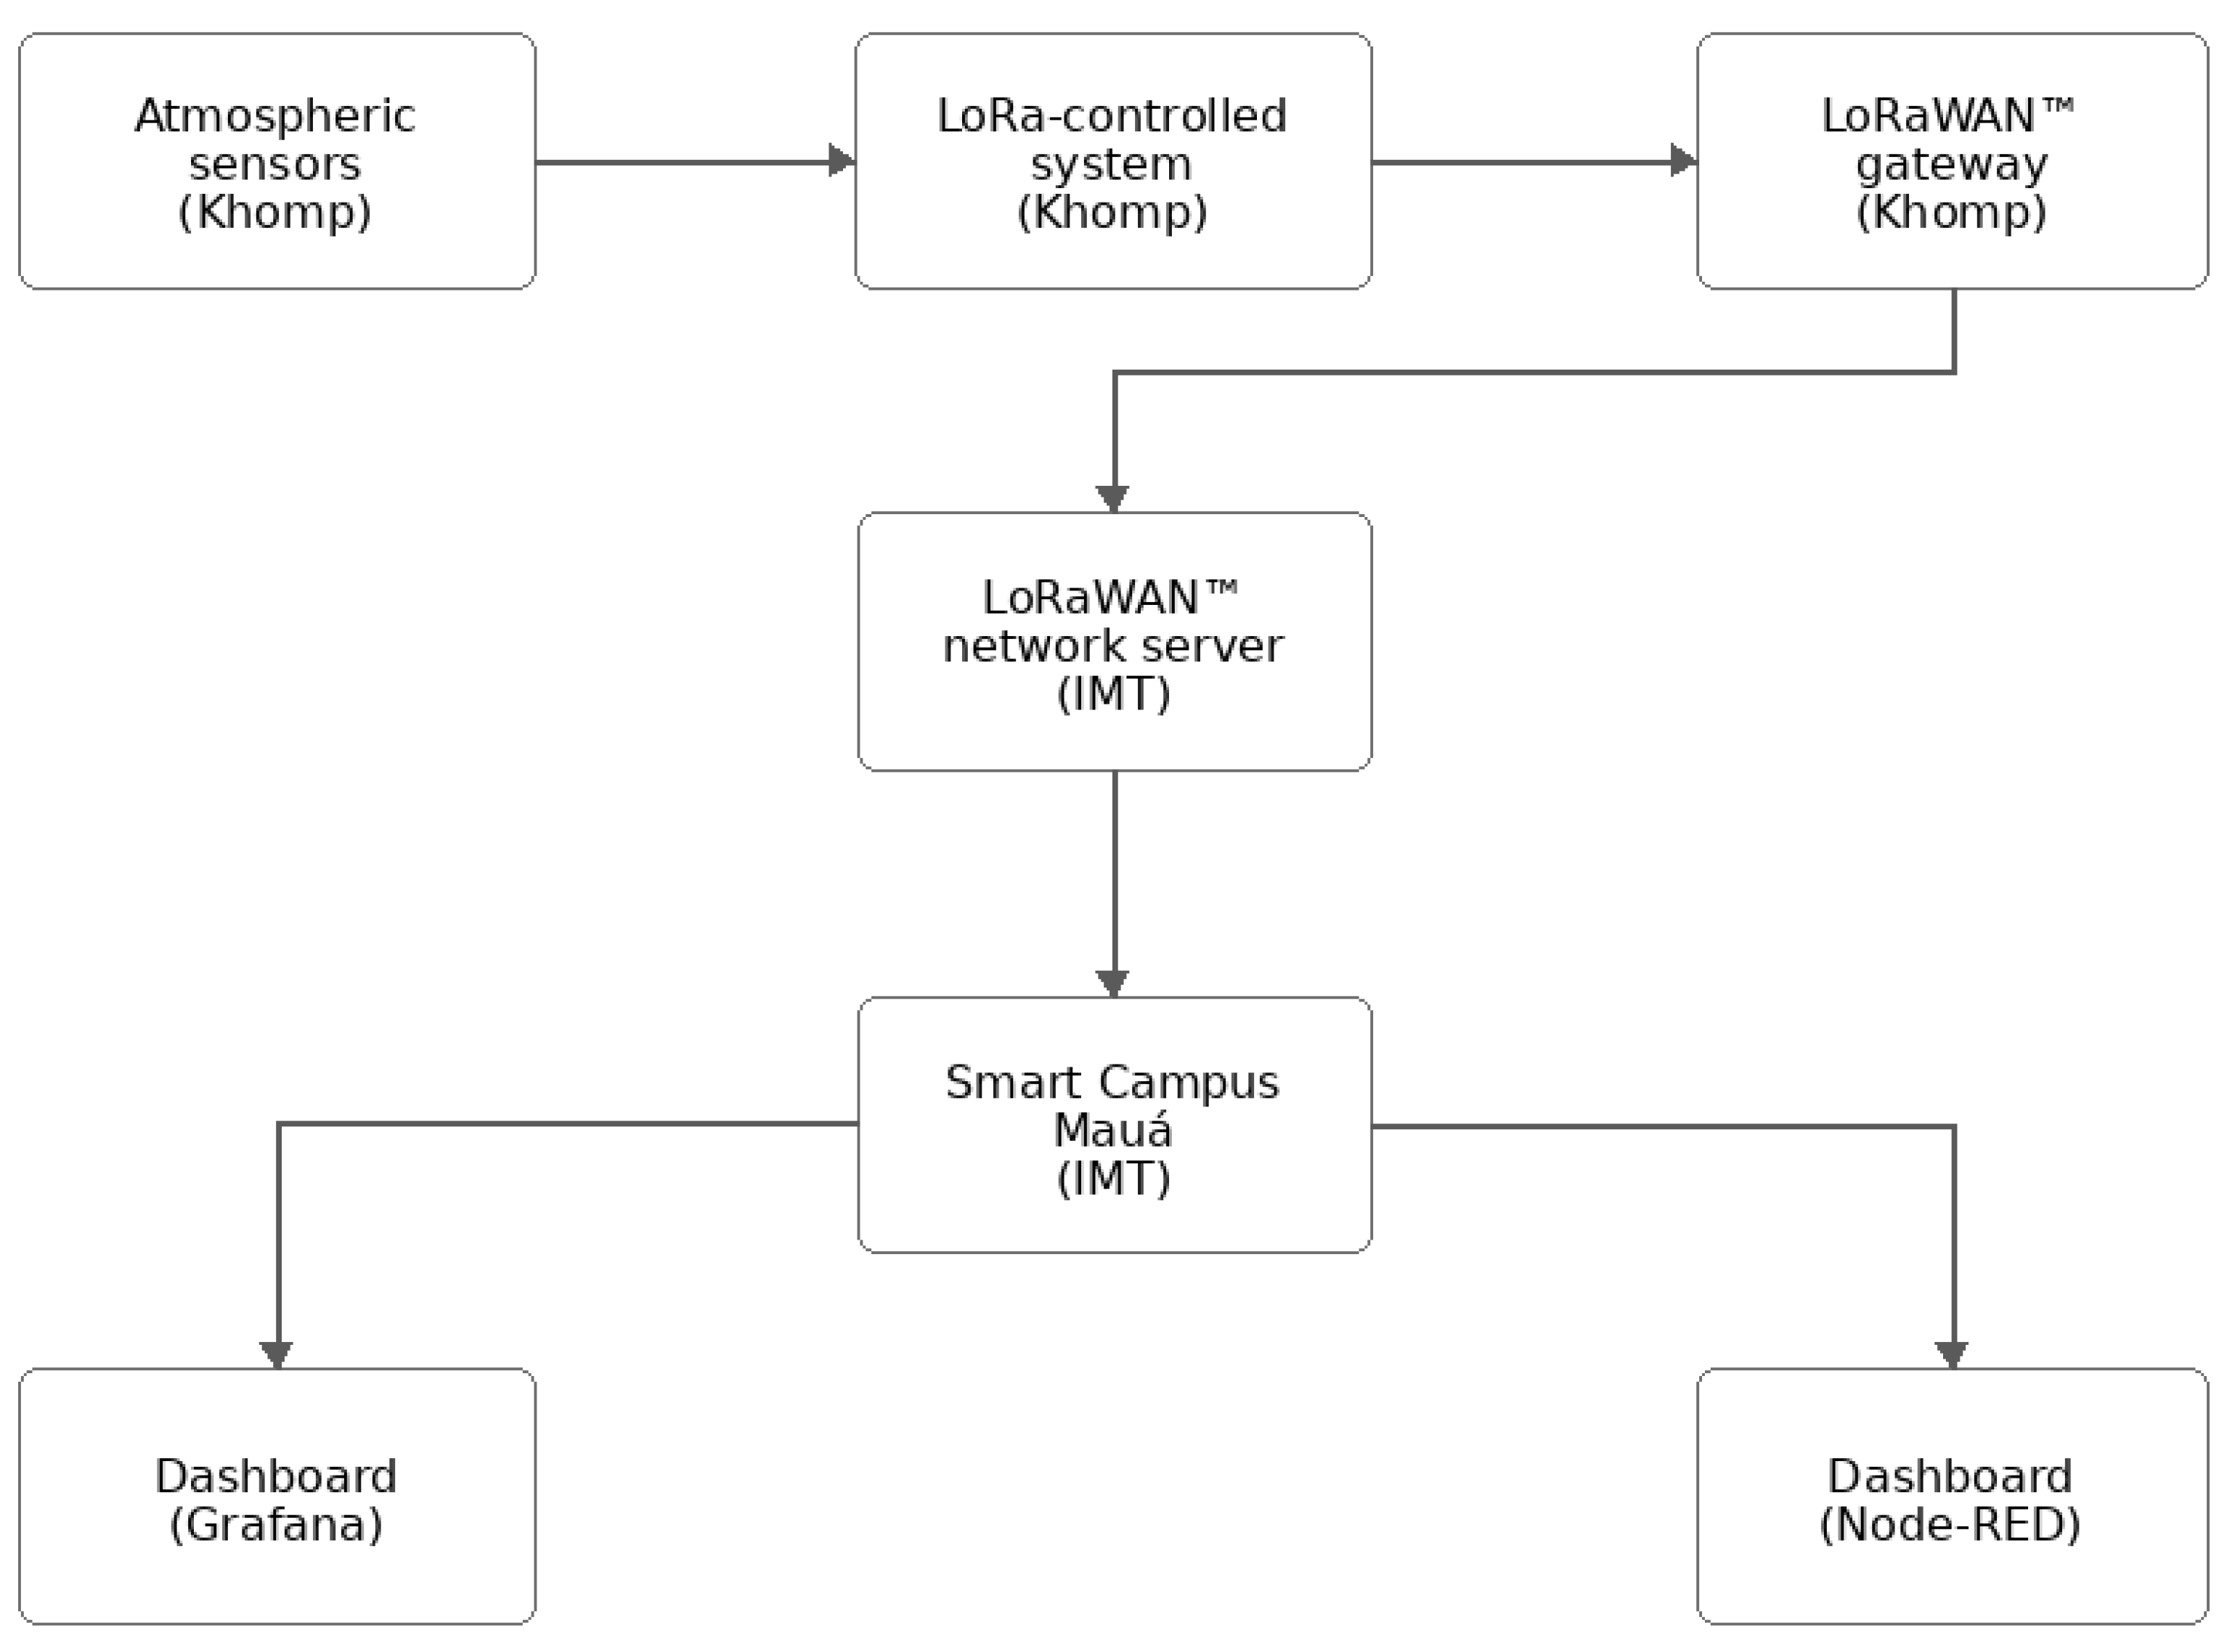
Figure 6.
Sealed enclosure with the installed equipment.
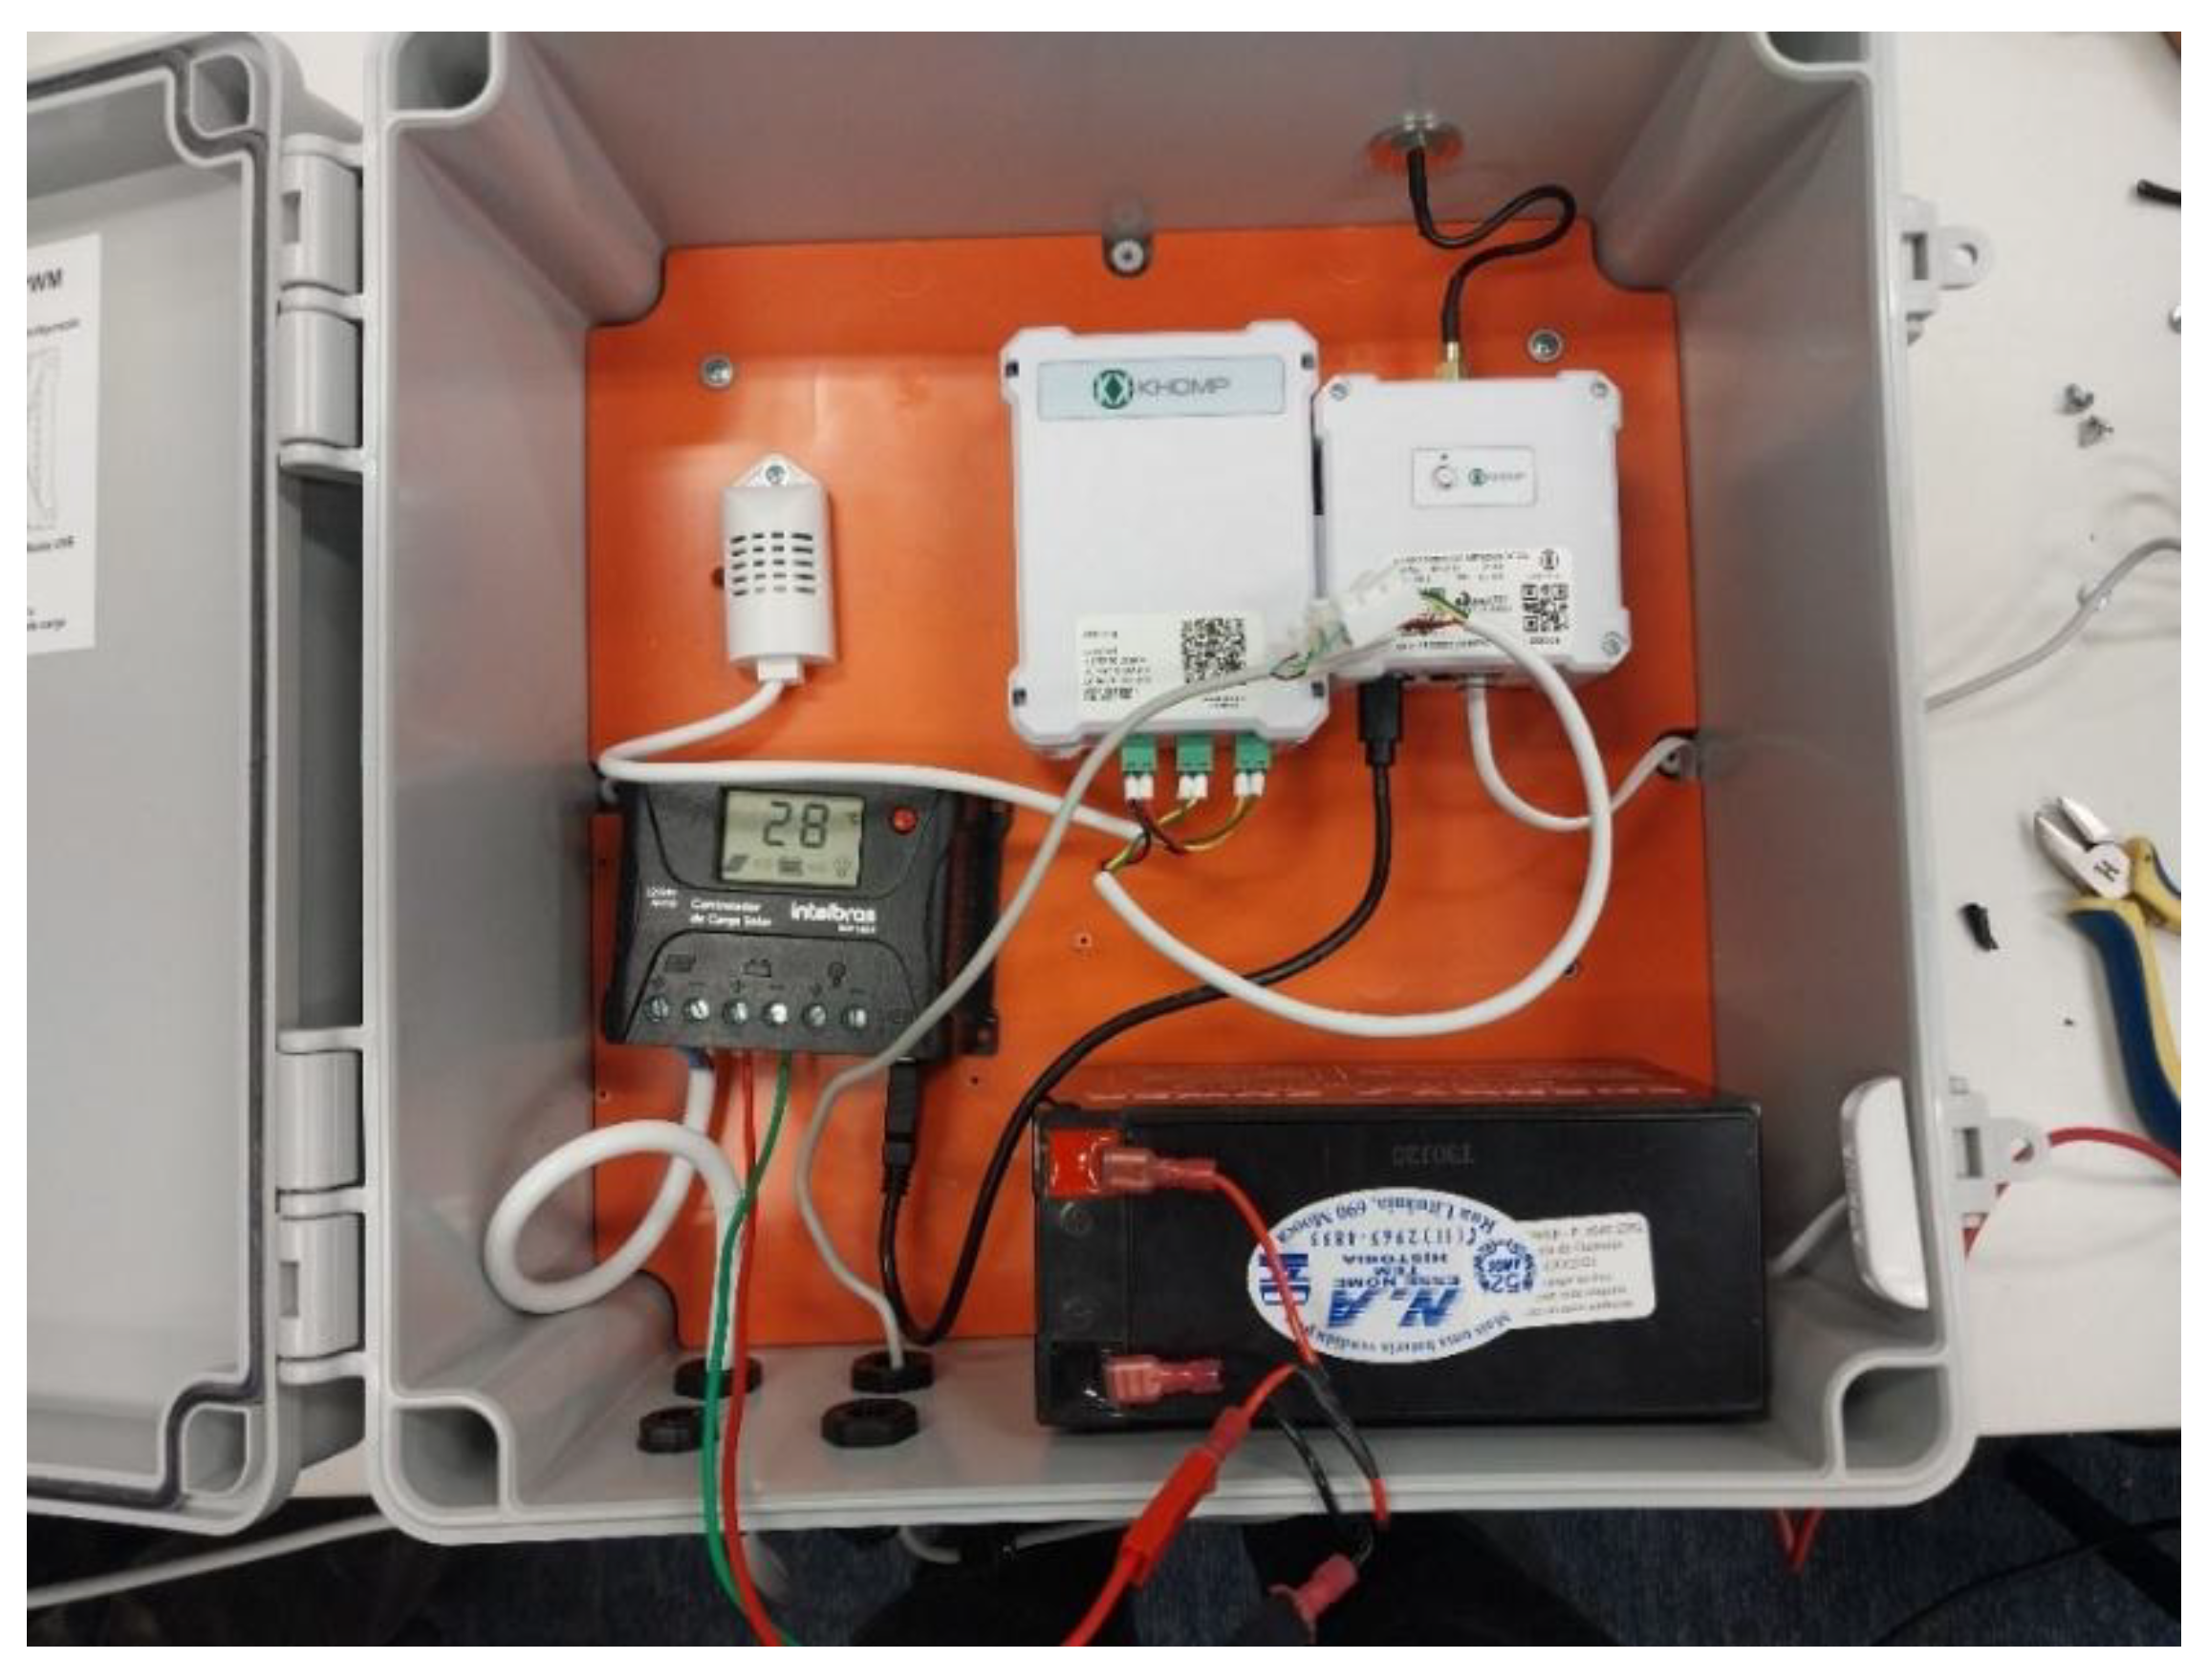
Figure 7.
System settings. (a) Network server settings; (b) Gateway DNS configuration.
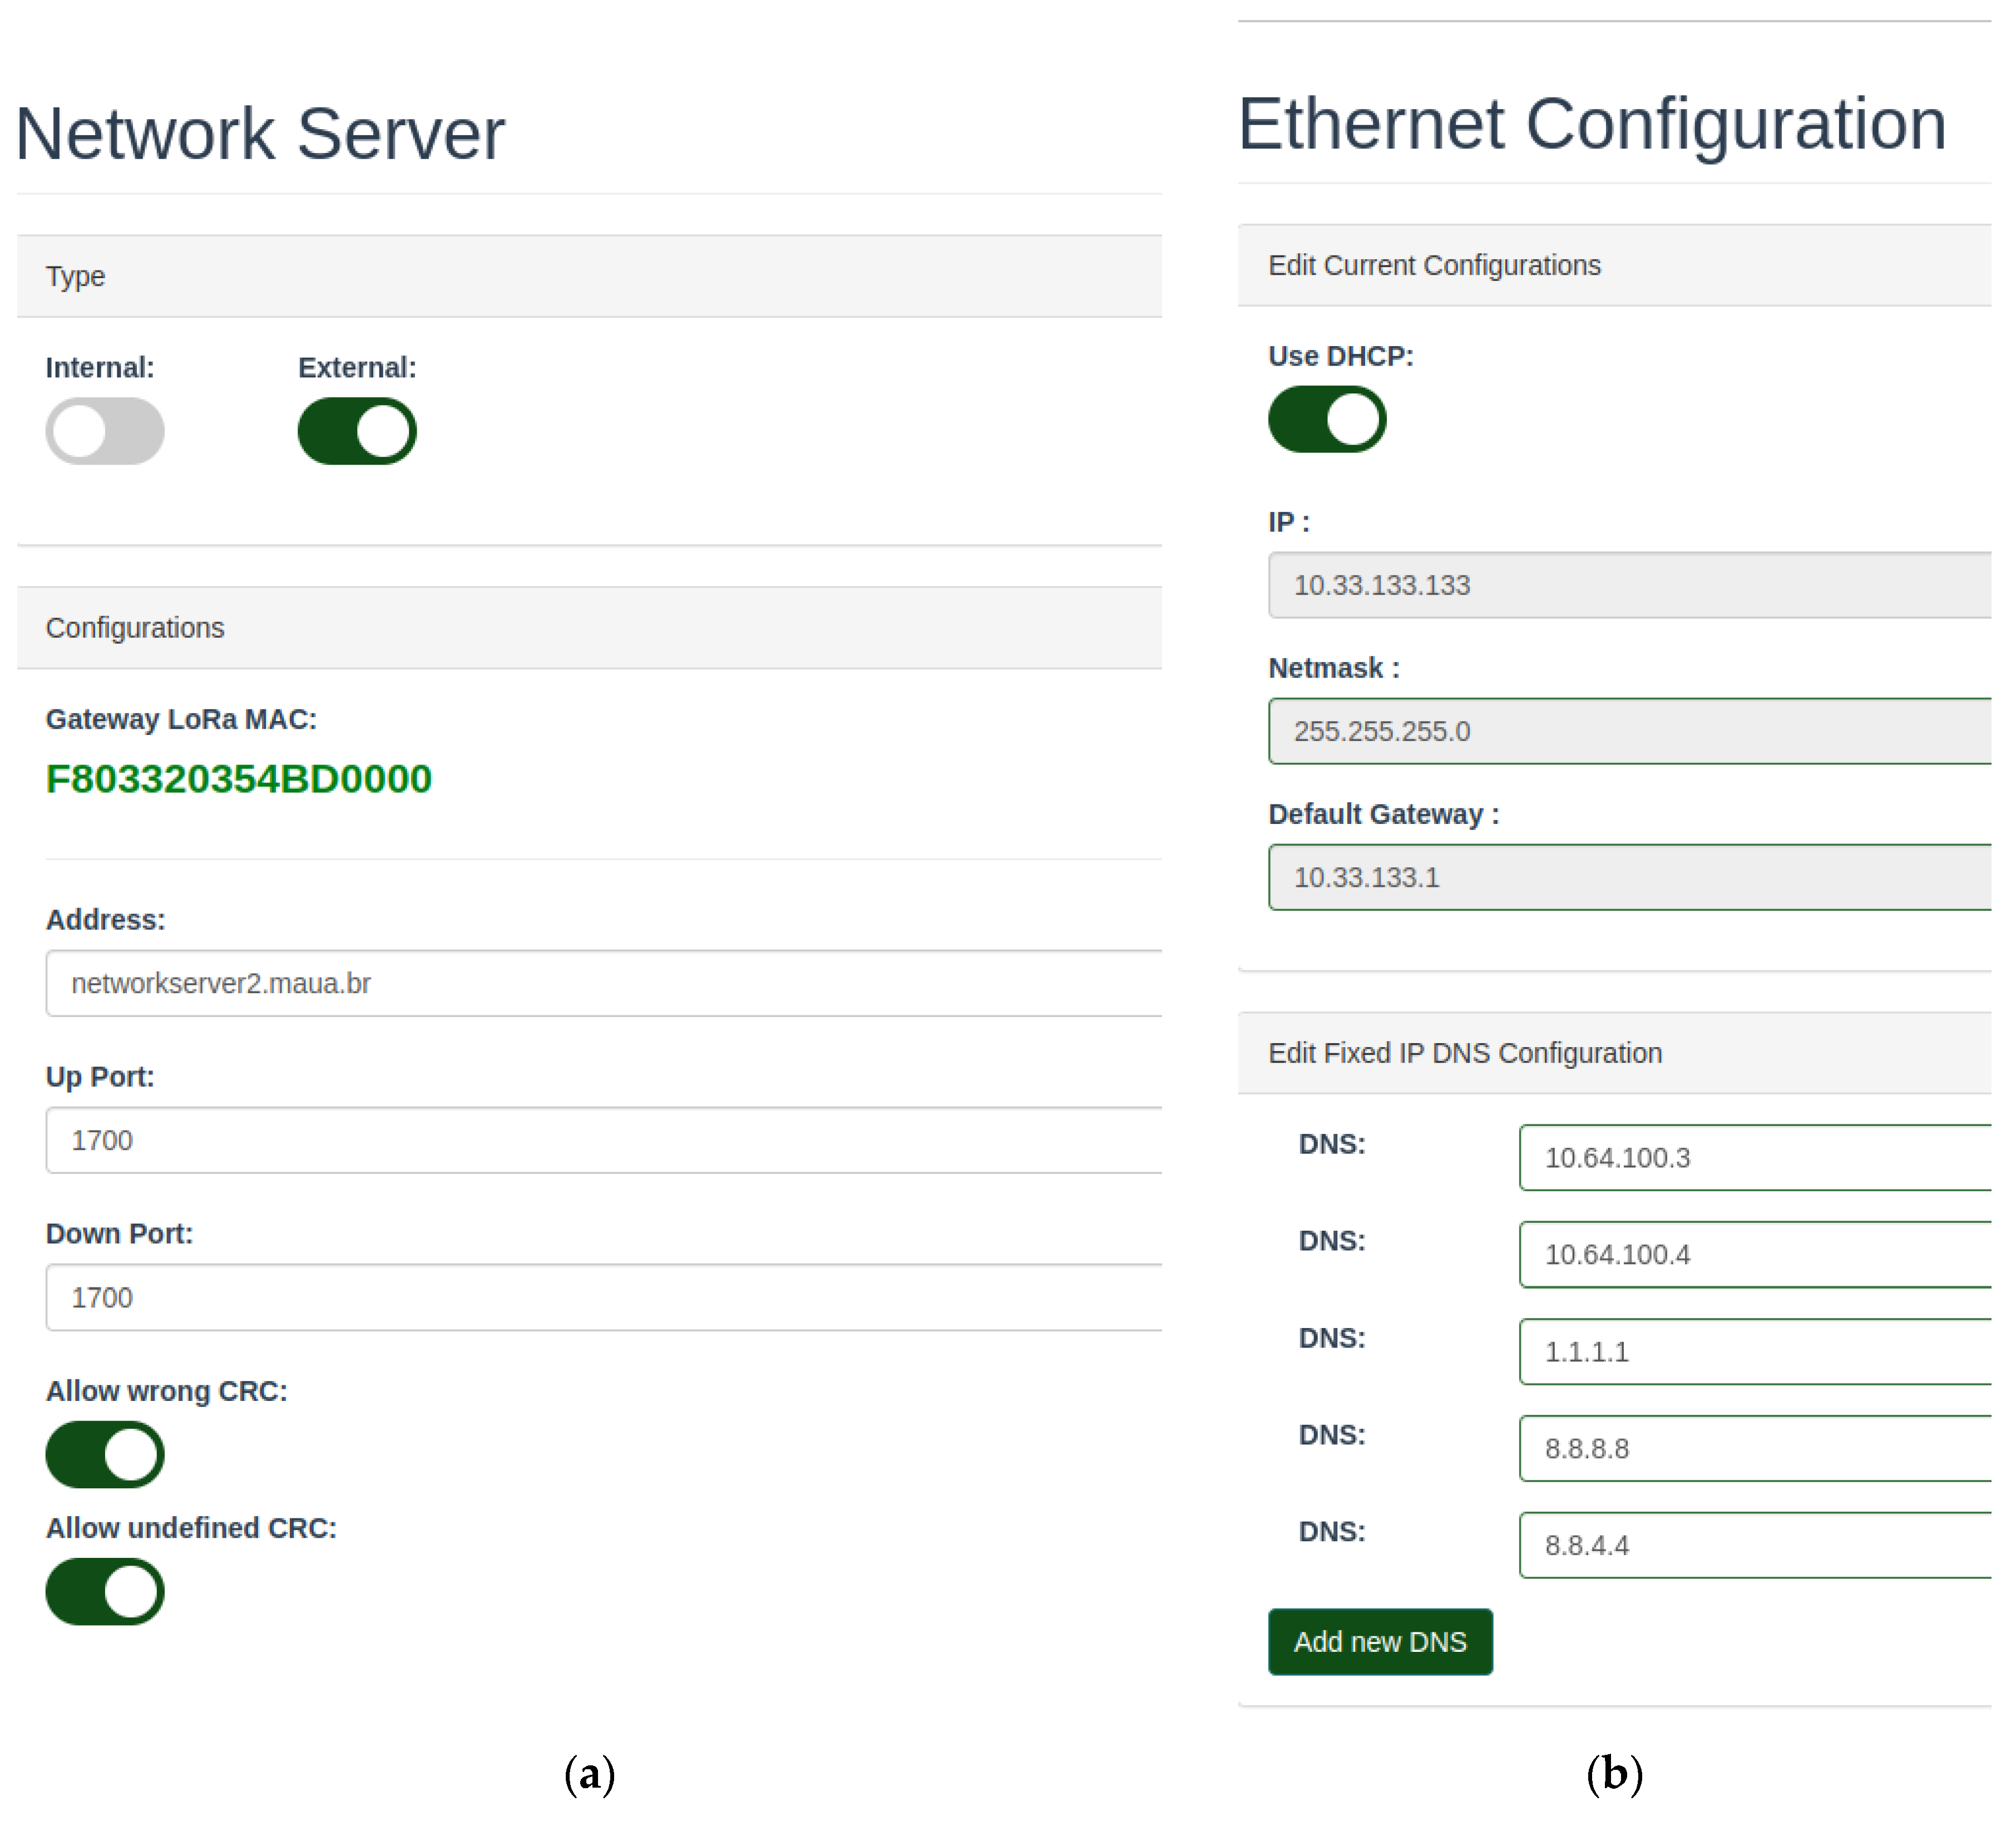
Figure 8.
Addition of the gateway profile.
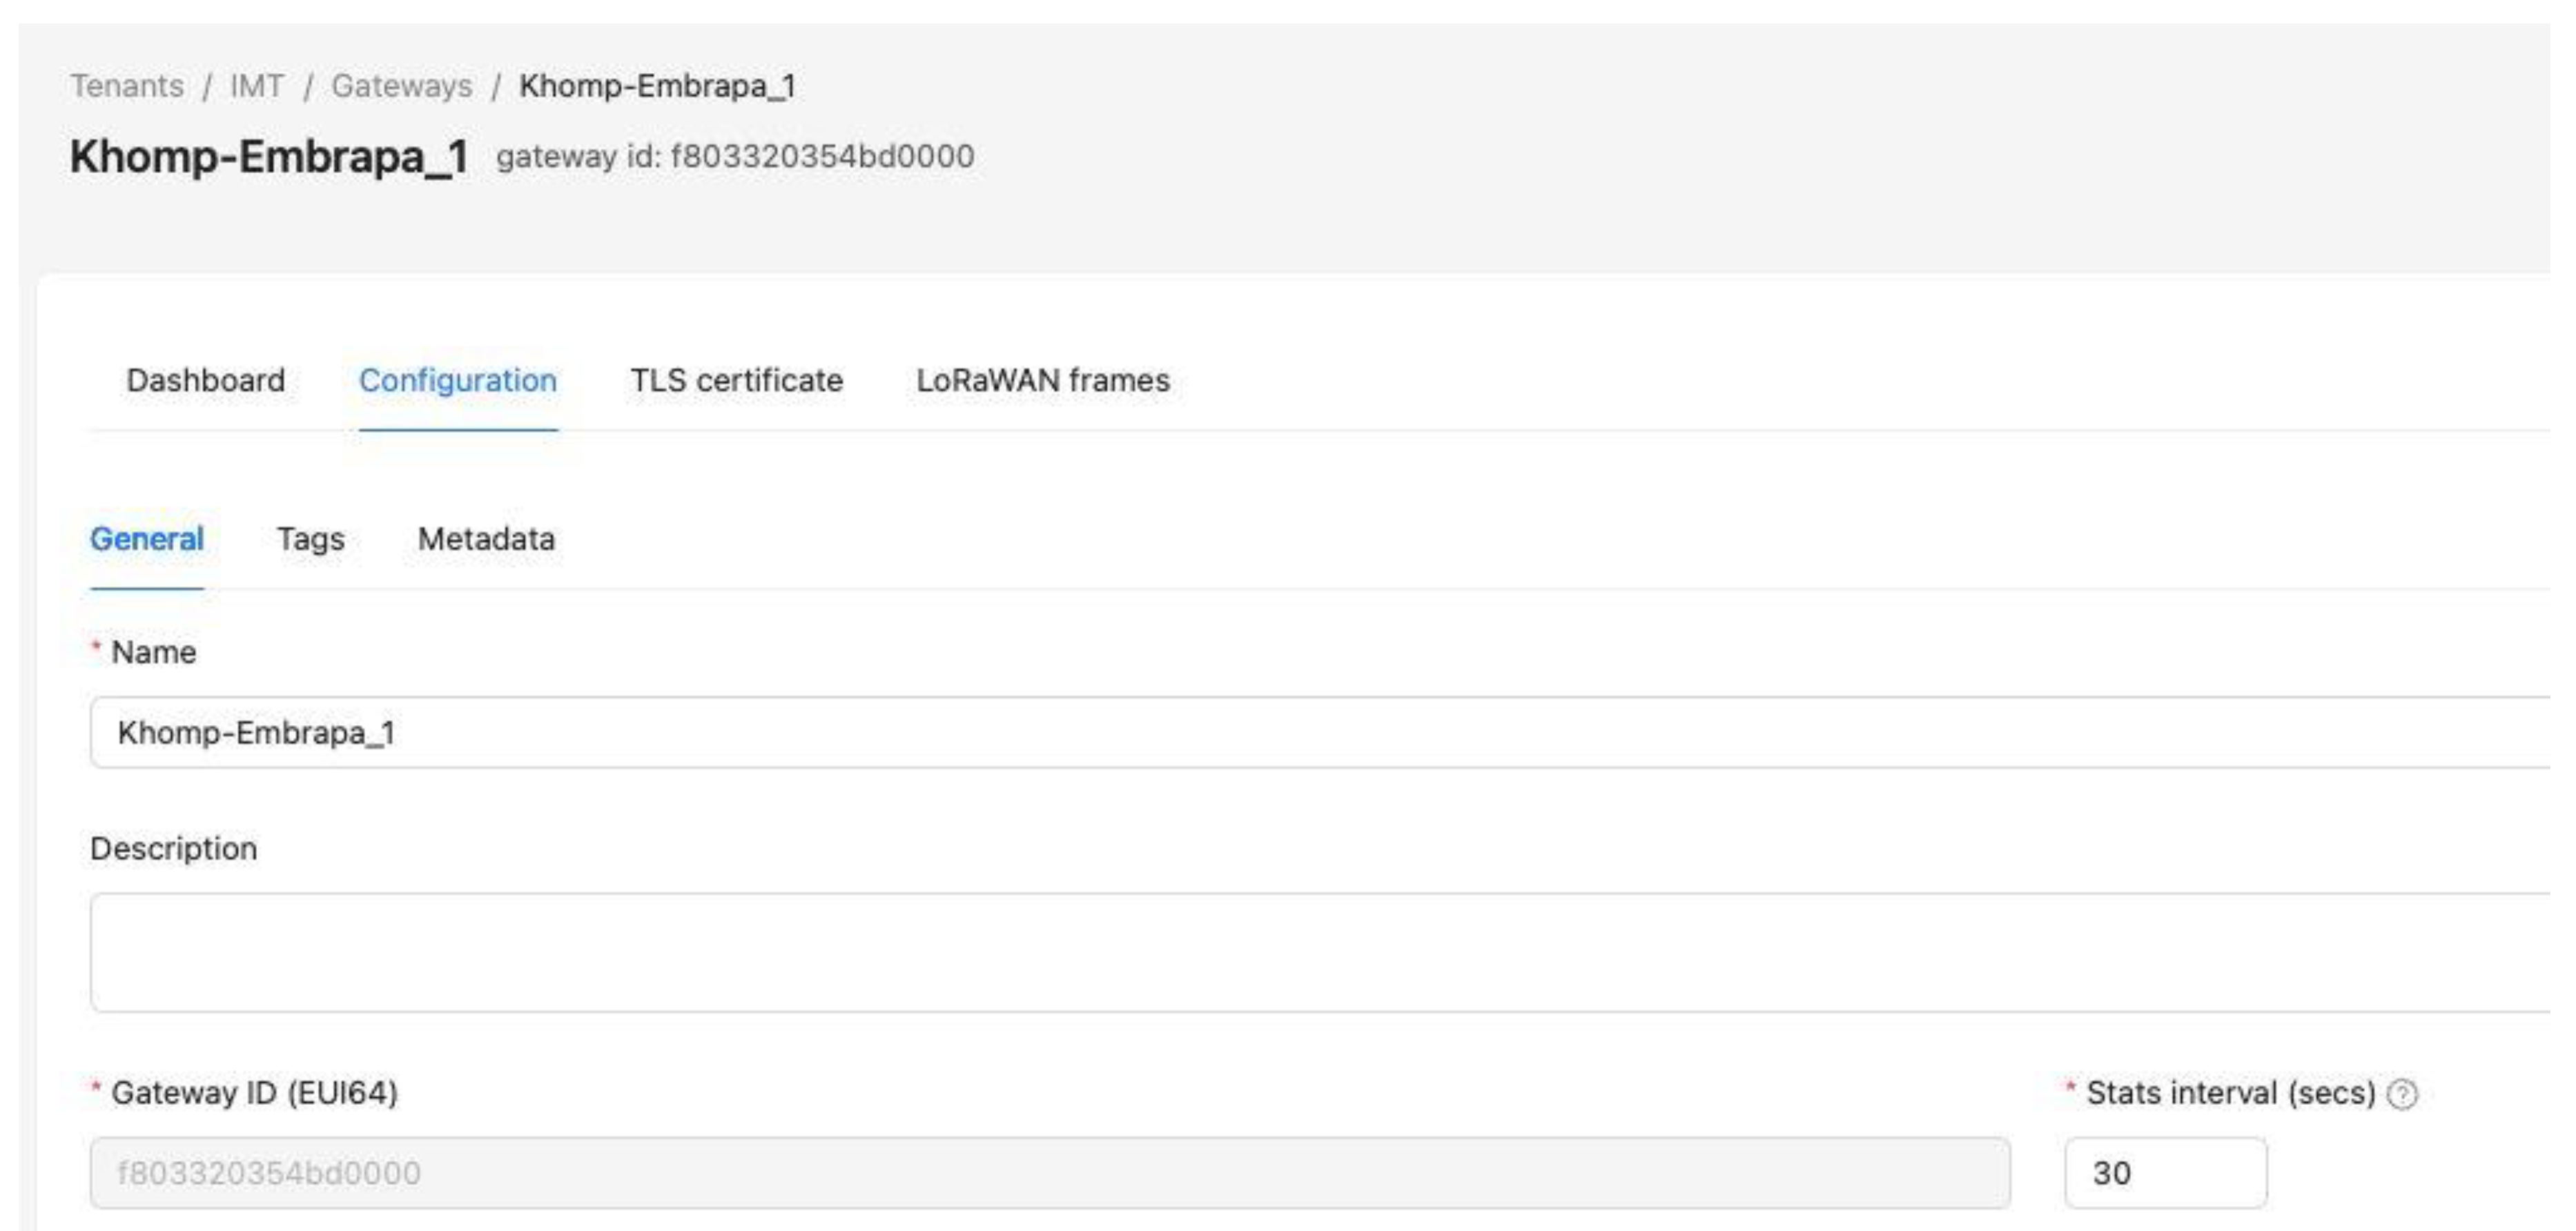
Figure 9.
Profile configuration for OTAA authentication.
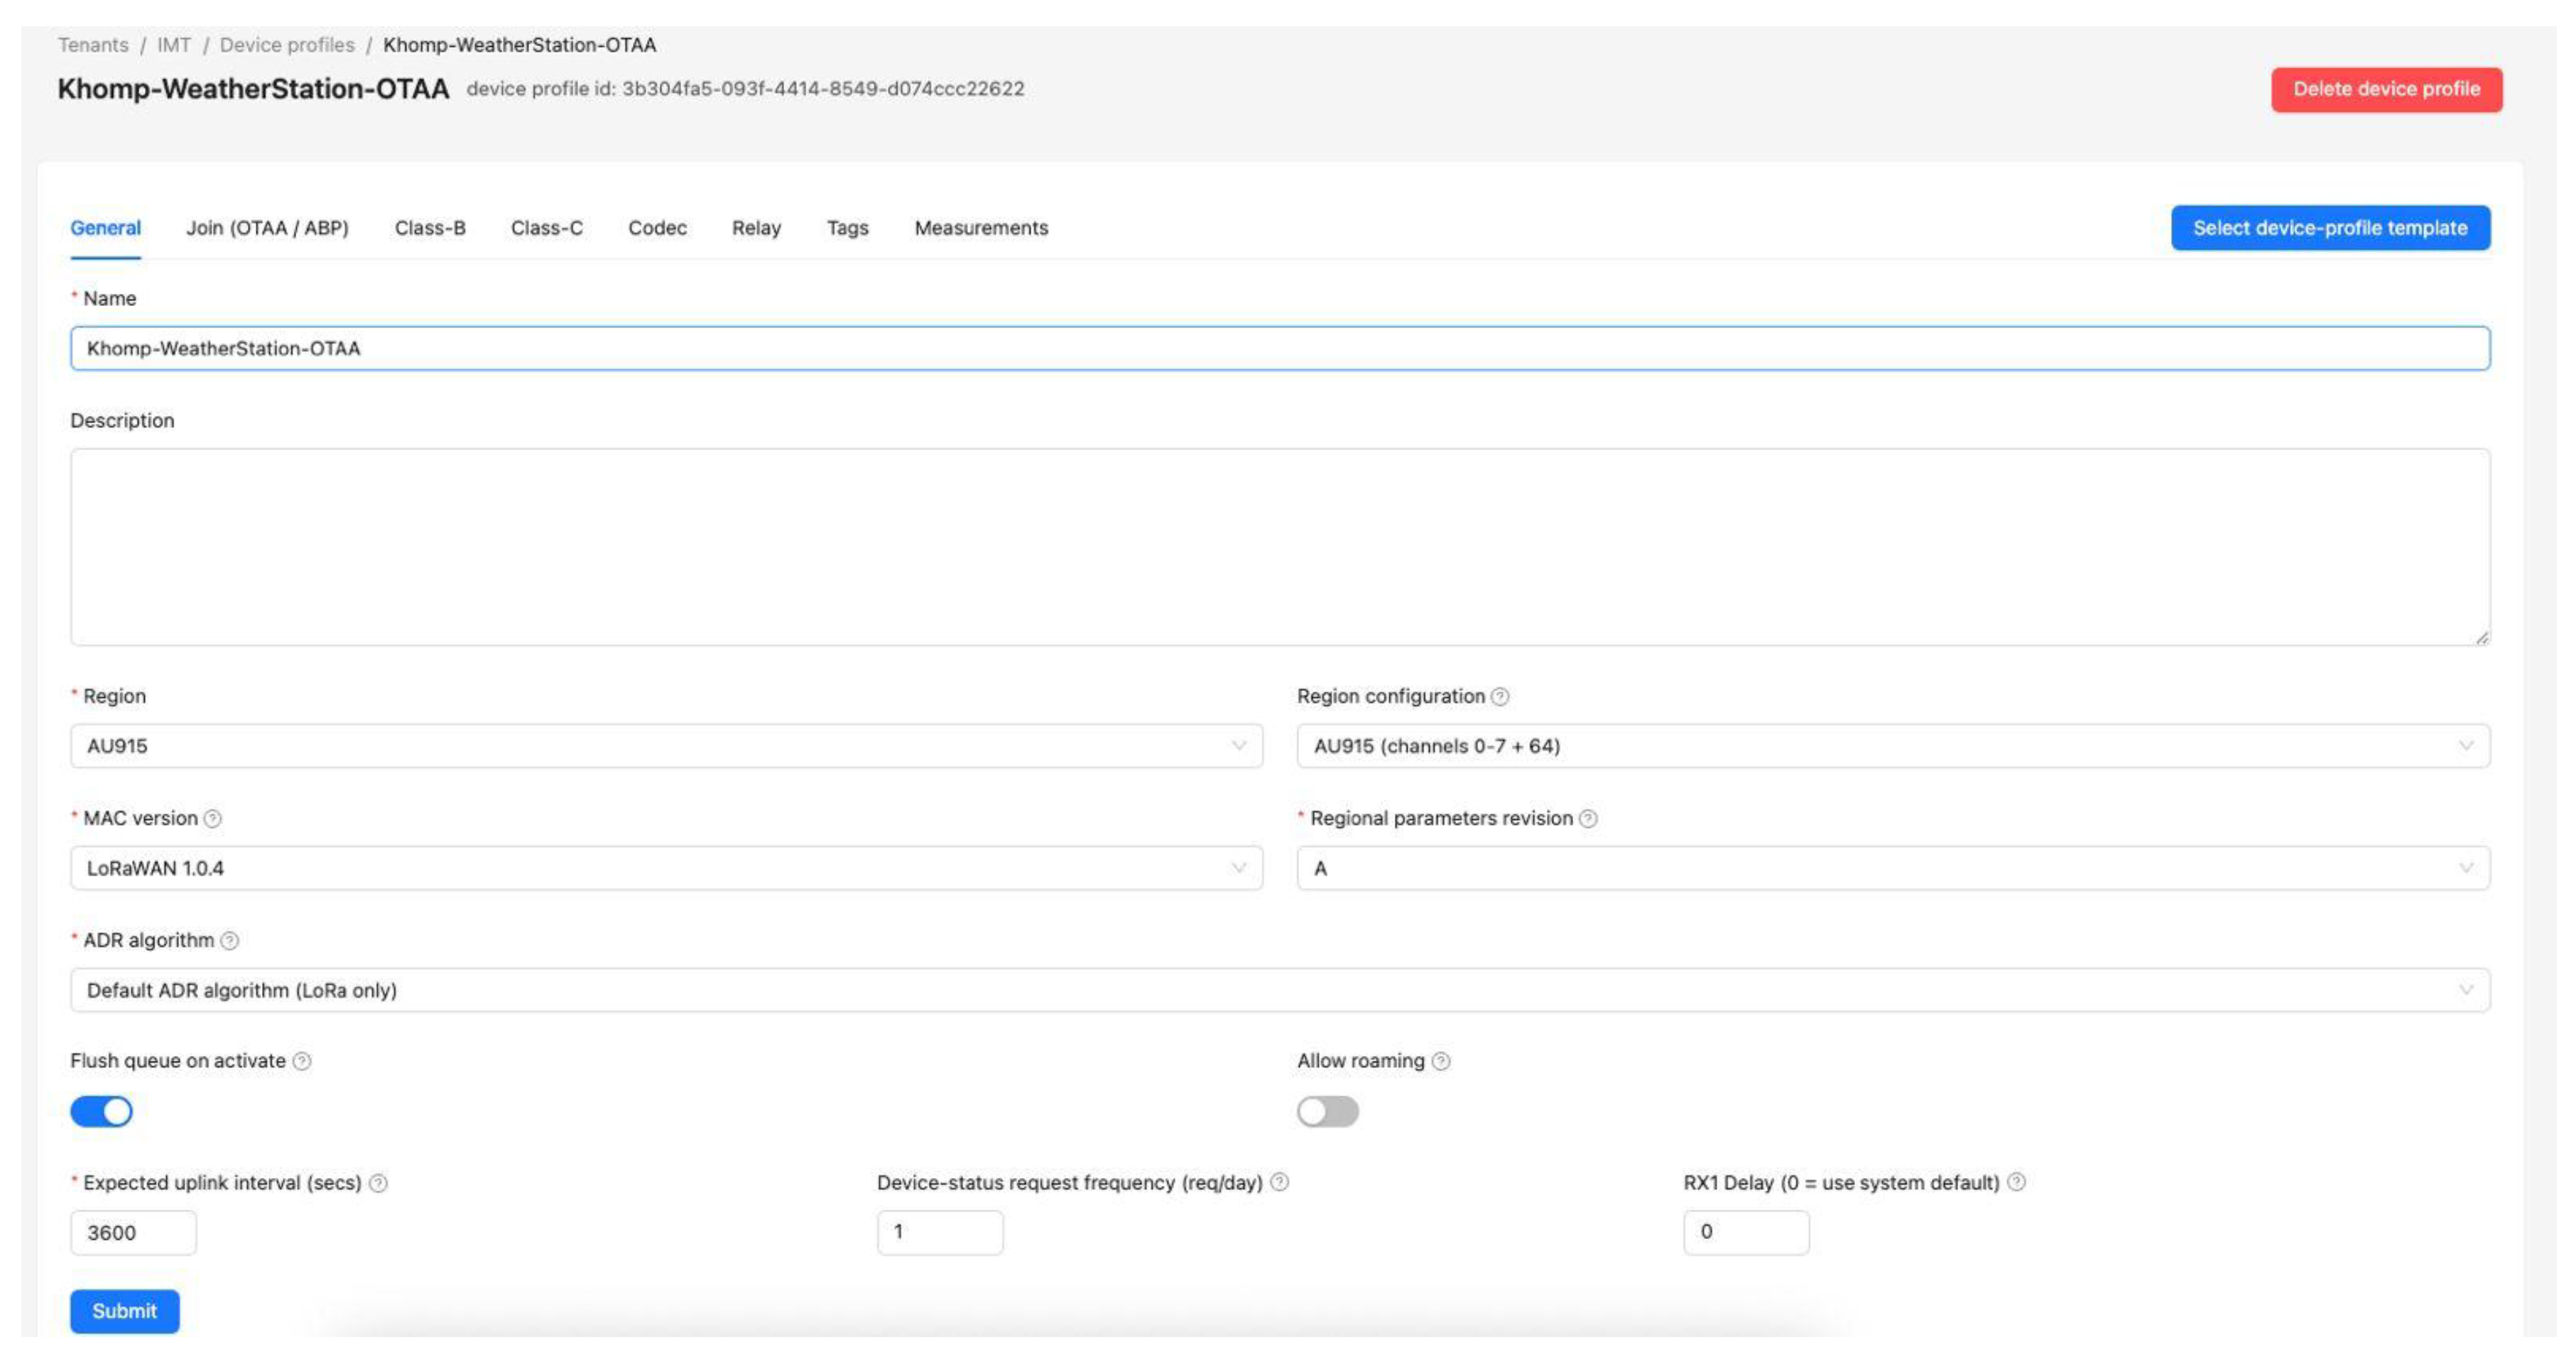
Figure 10.
Creation of the “WeatherStation_4” application.
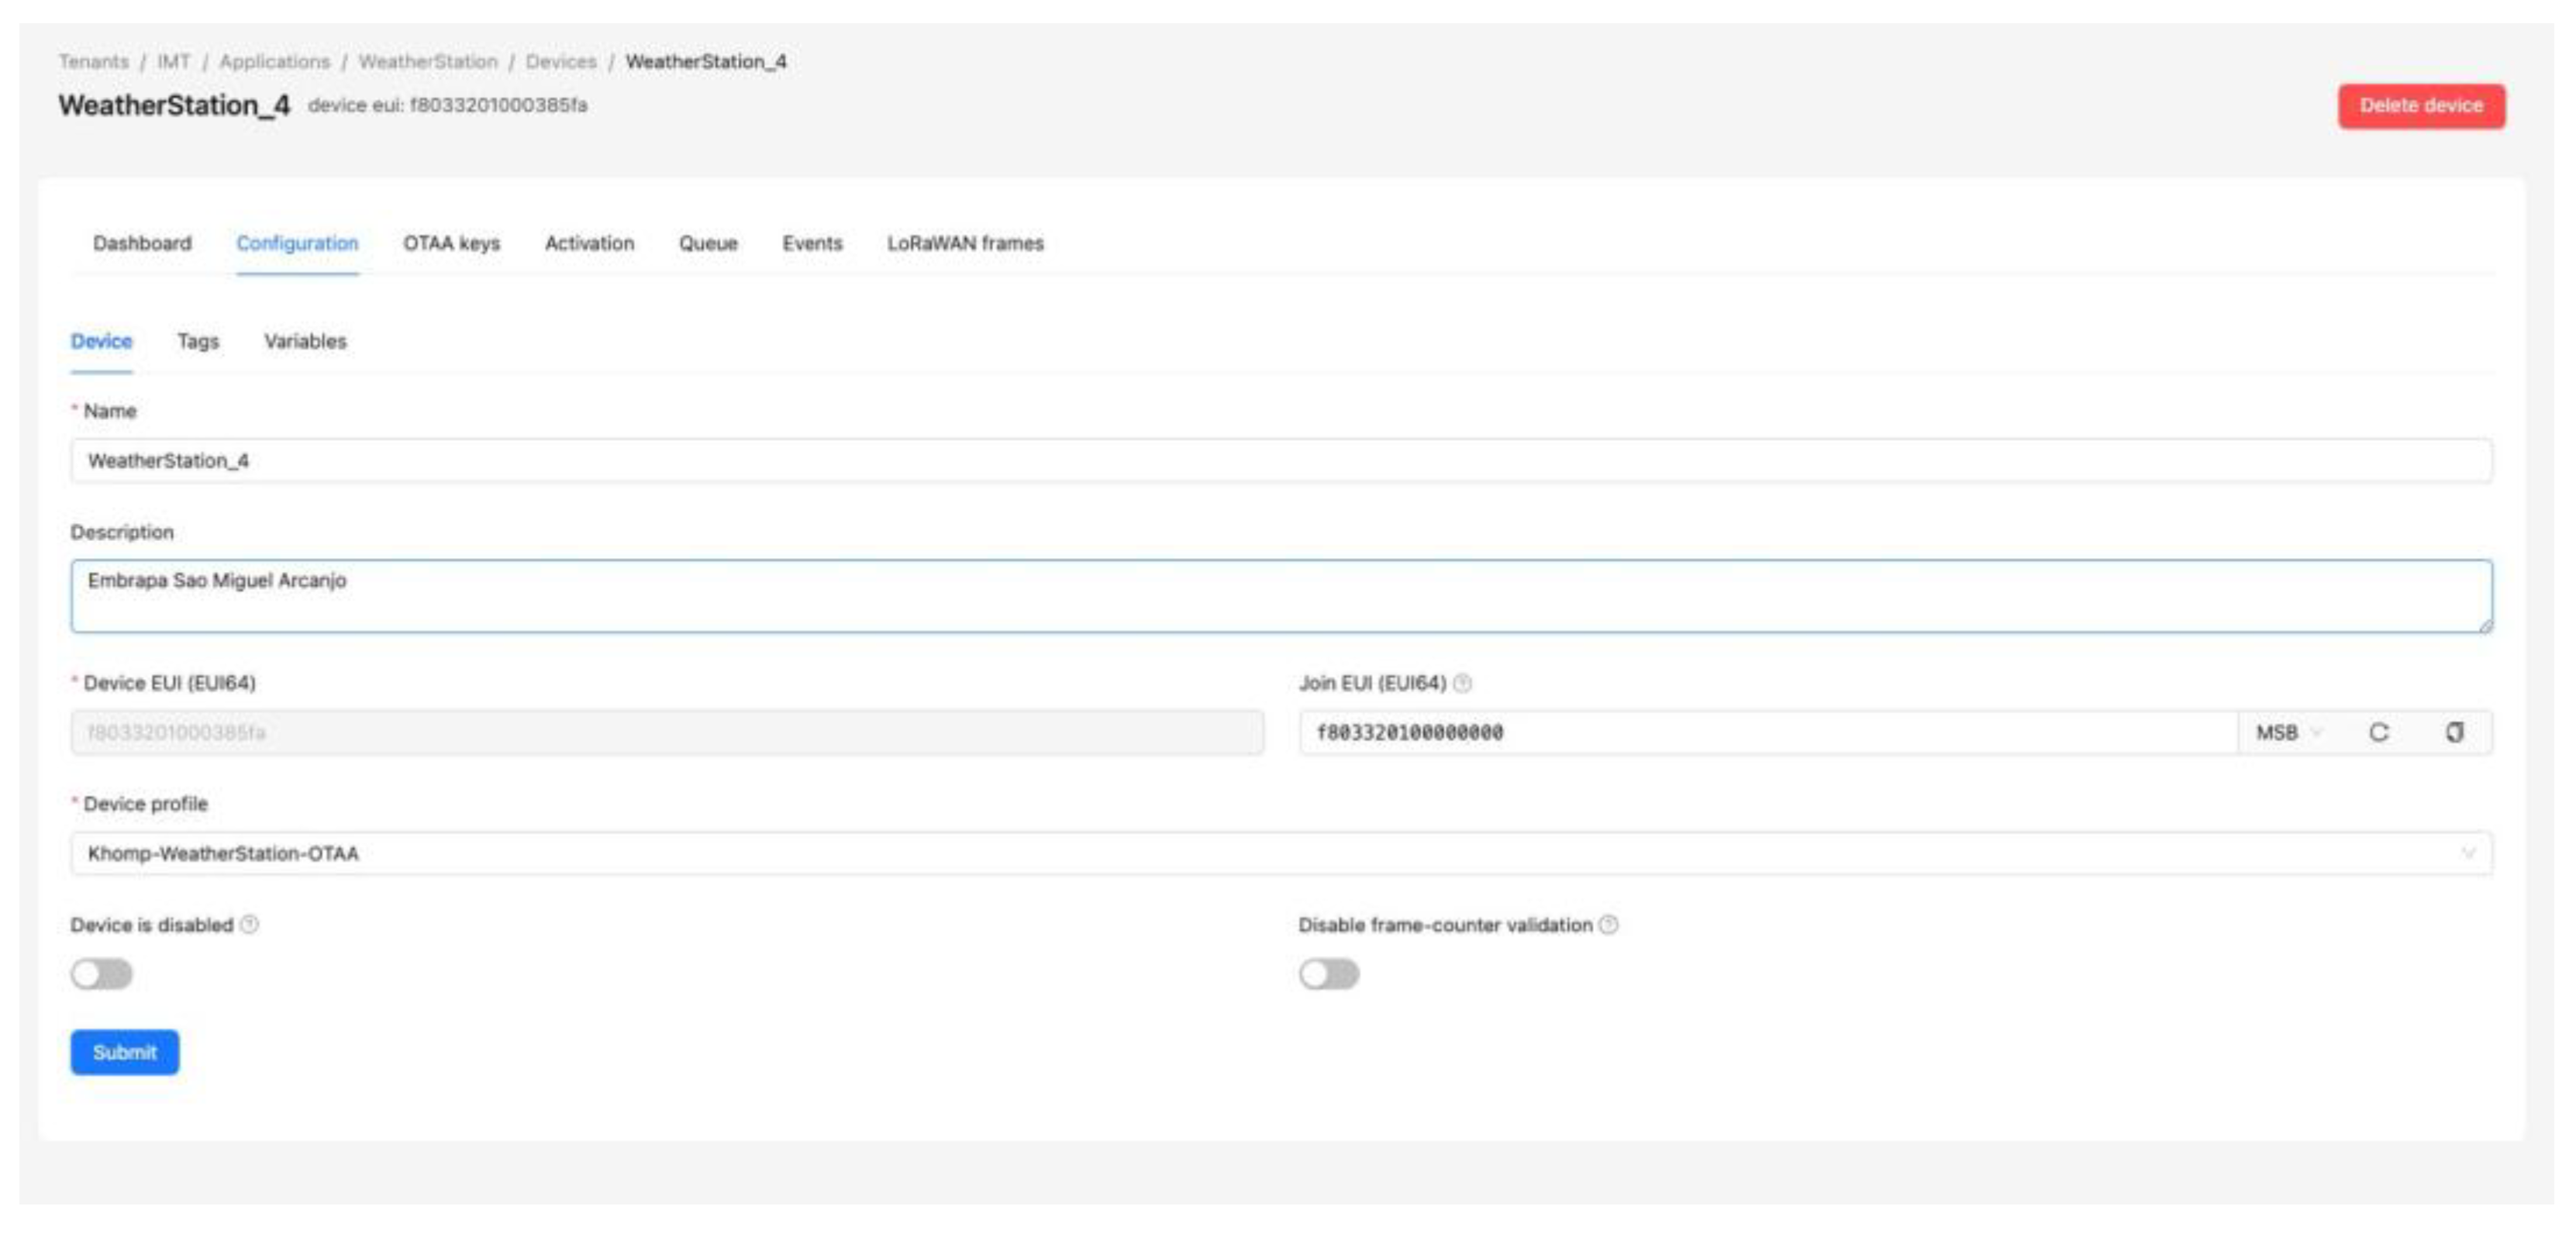
Figure 11.
Verification of transmission between the gateway and network server.
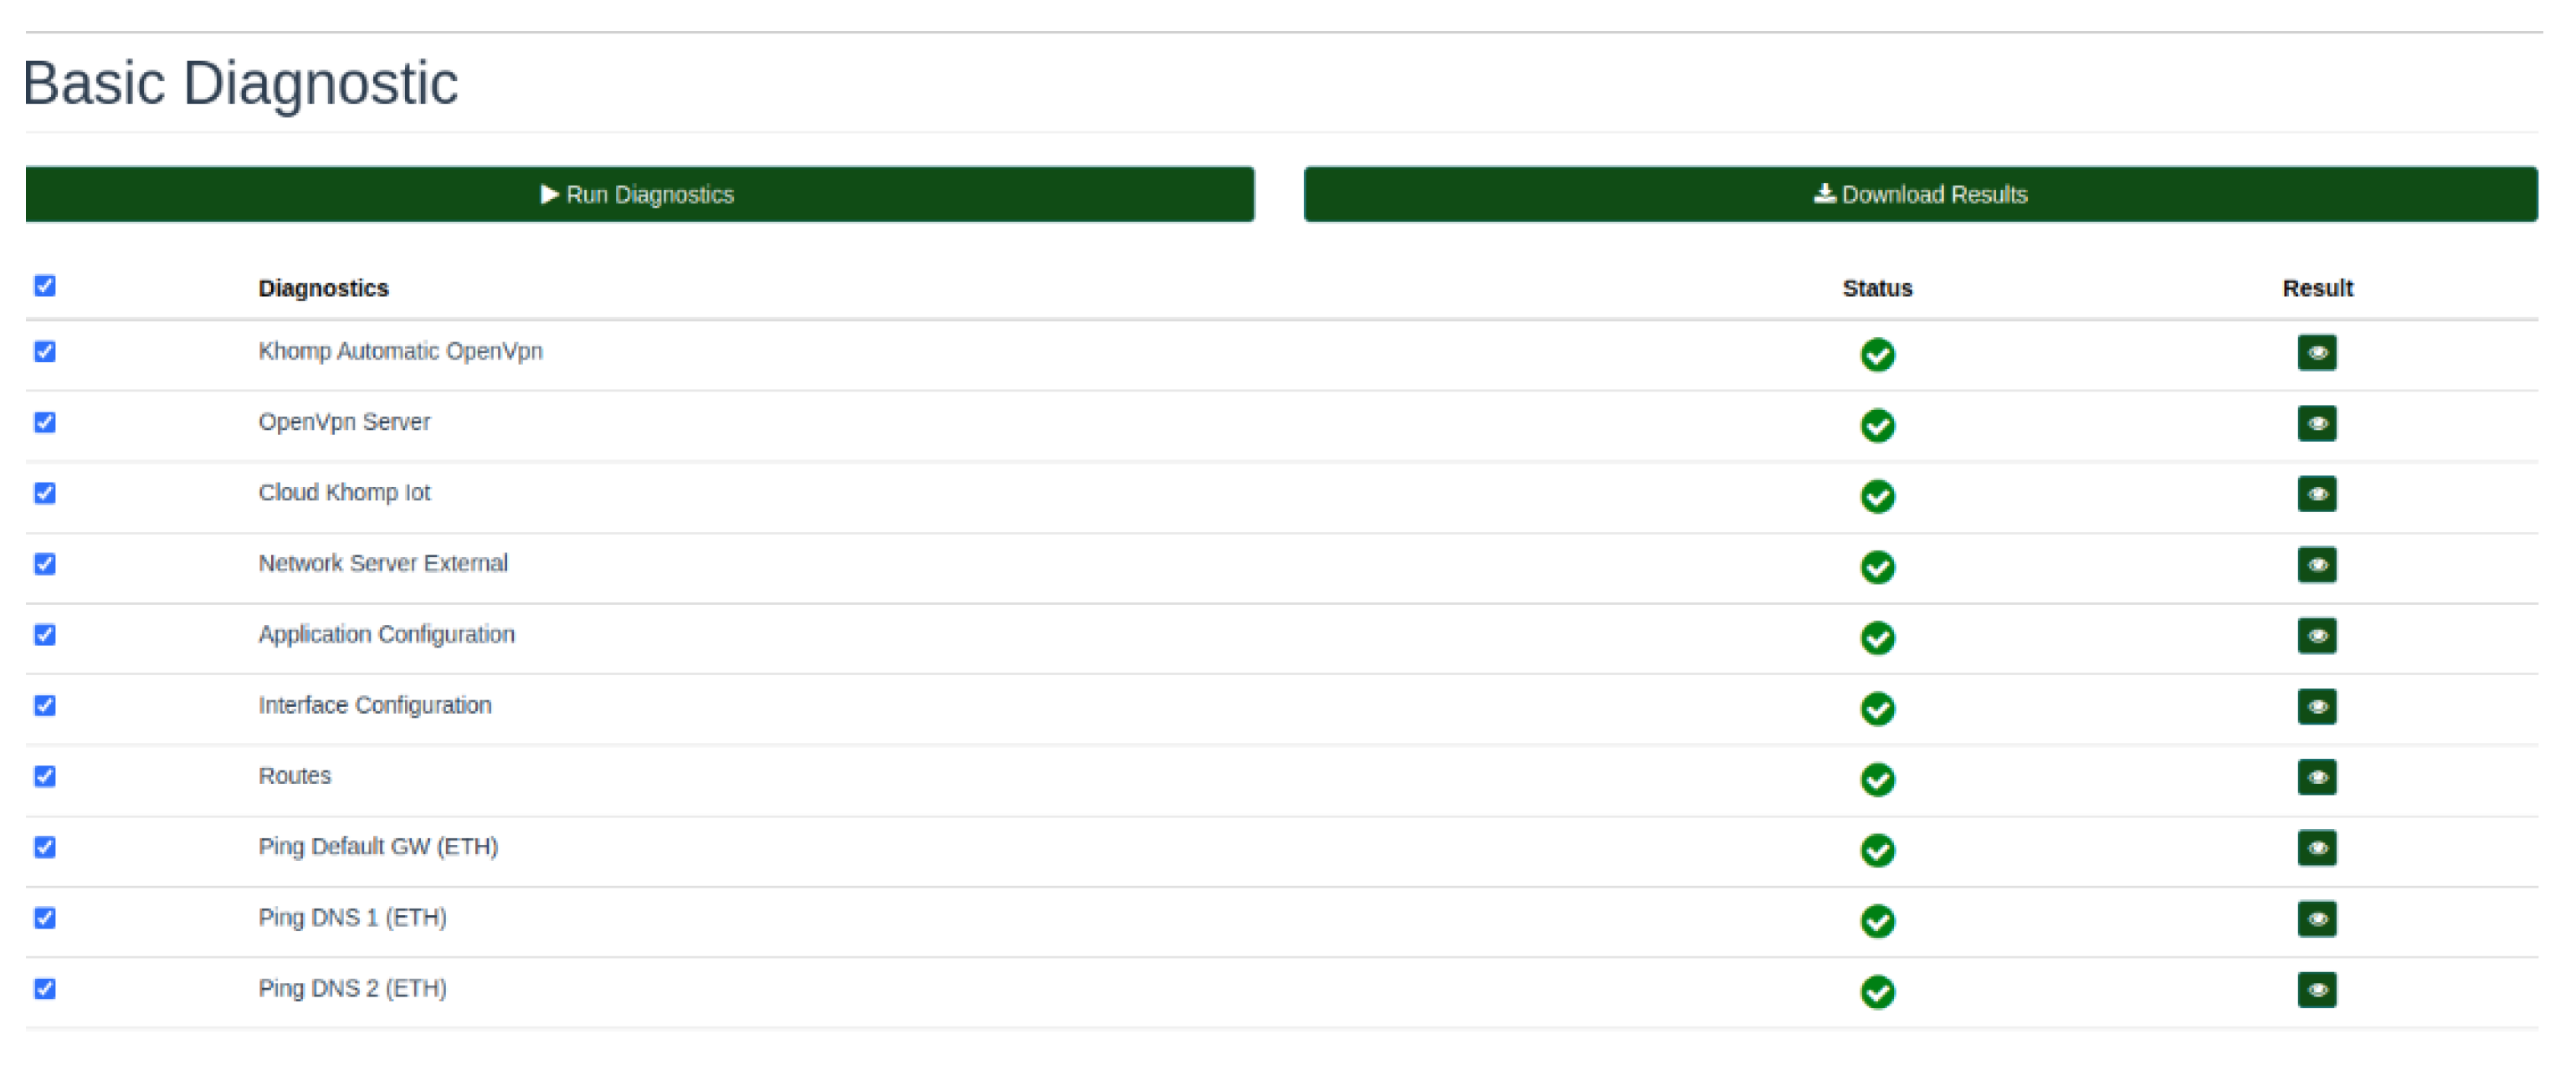
Figure 12.
Weather station installed in São Miguel Arcanjo.
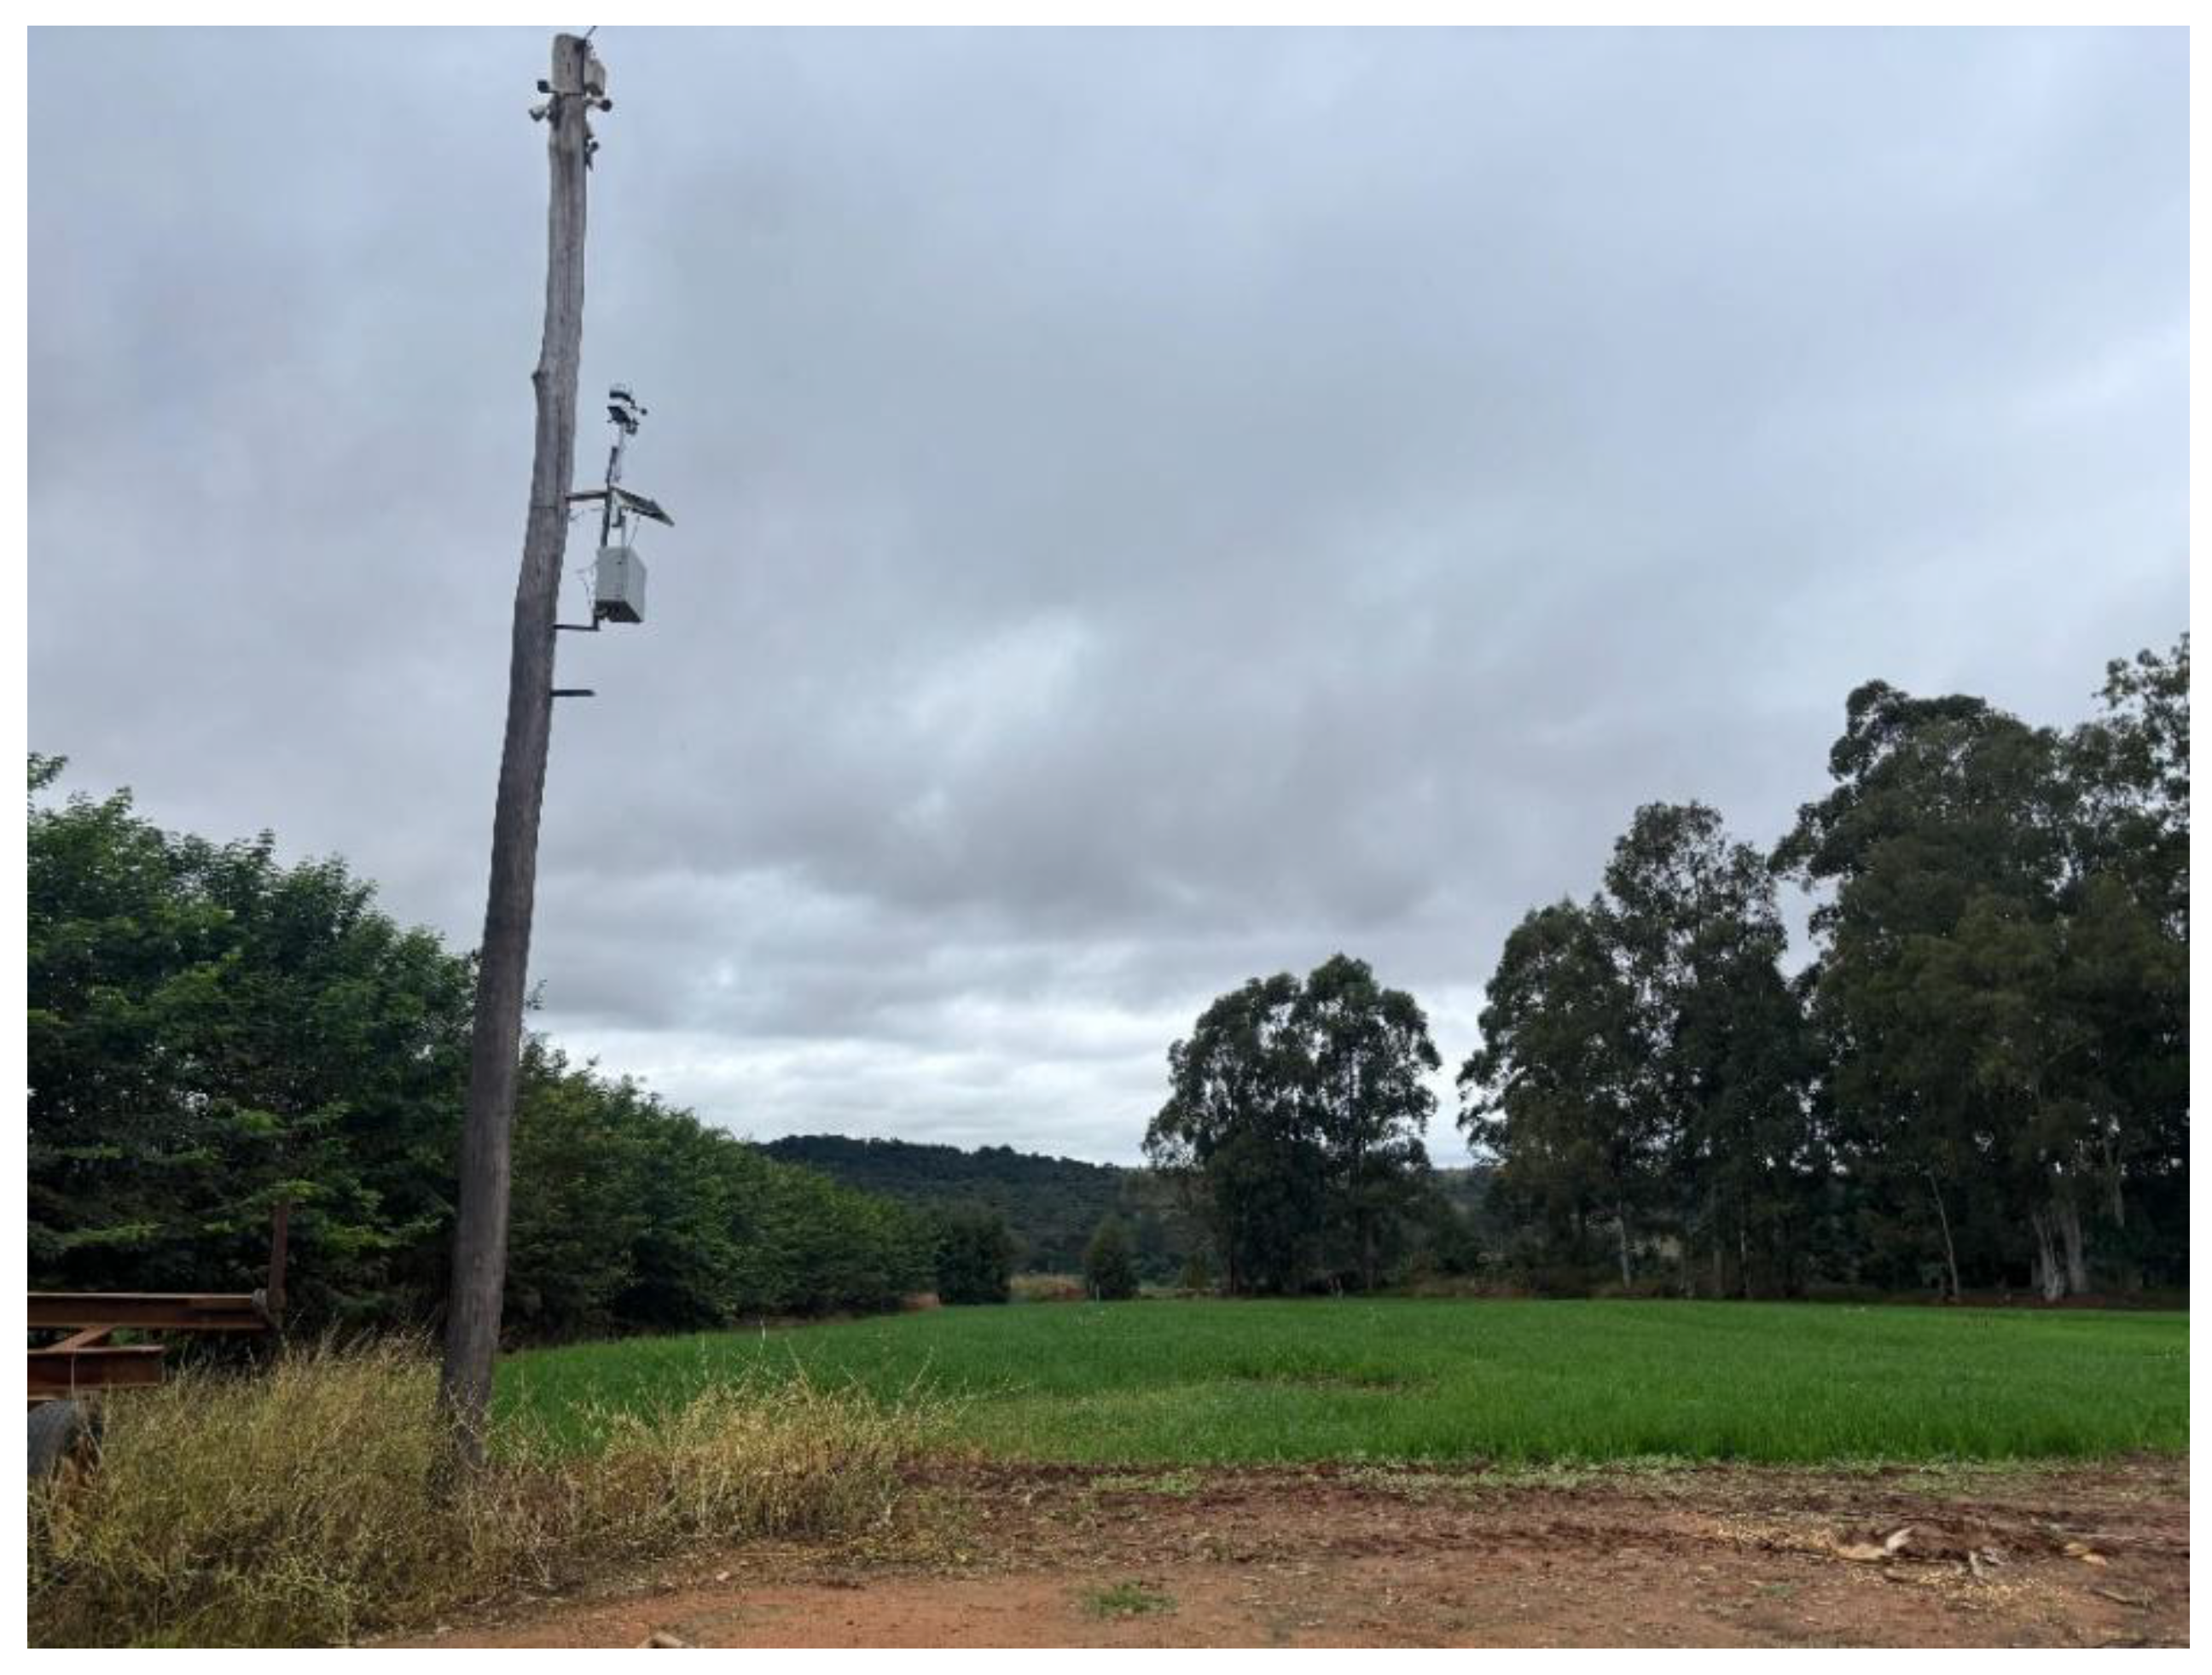
Figure 13.
Received data, RSSI, SNR, frequency, Data Rate, and errors during one year of communication between the gateway and network server.
Figure 13.
Received data, RSSI, SNR, frequency, Data Rate, and errors during one year of communication between the gateway and network server.
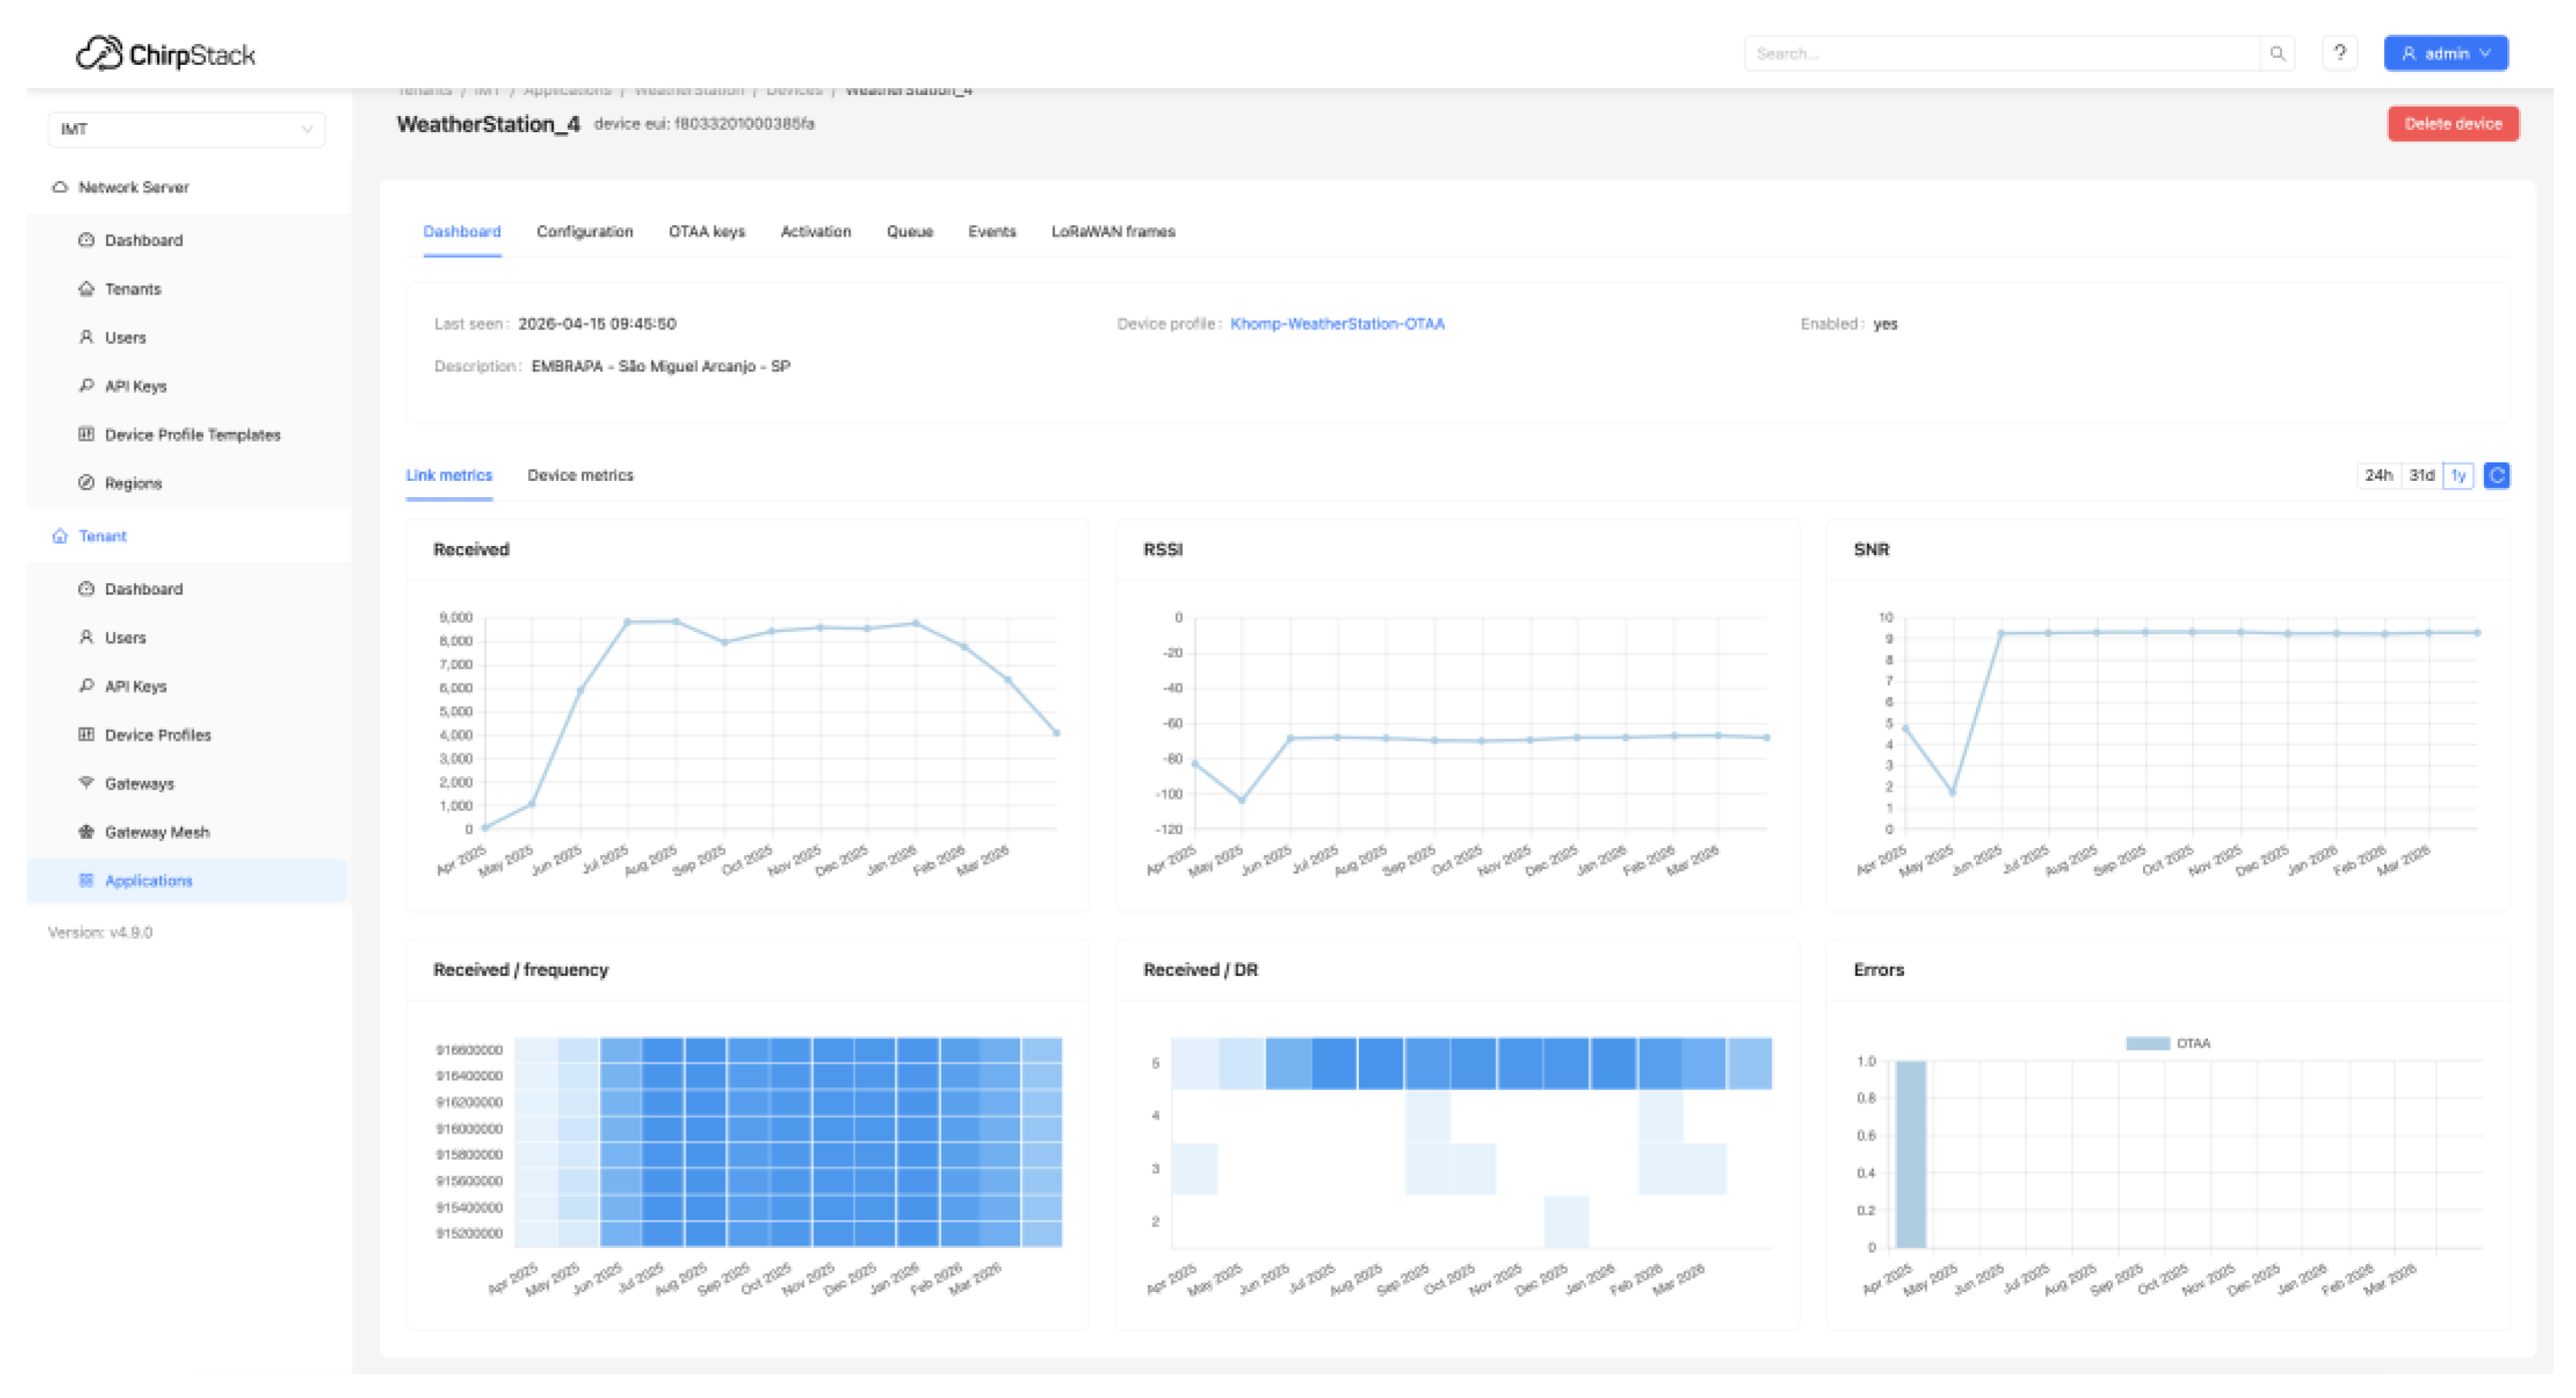
Figure 14.
Received data, RSSI, SNR, frequency, Data Rate, and errors during one month of communication between the gateway and network server.
Figure 14.
Received data, RSSI, SNR, frequency, Data Rate, and errors during one month of communication between the gateway and network server.
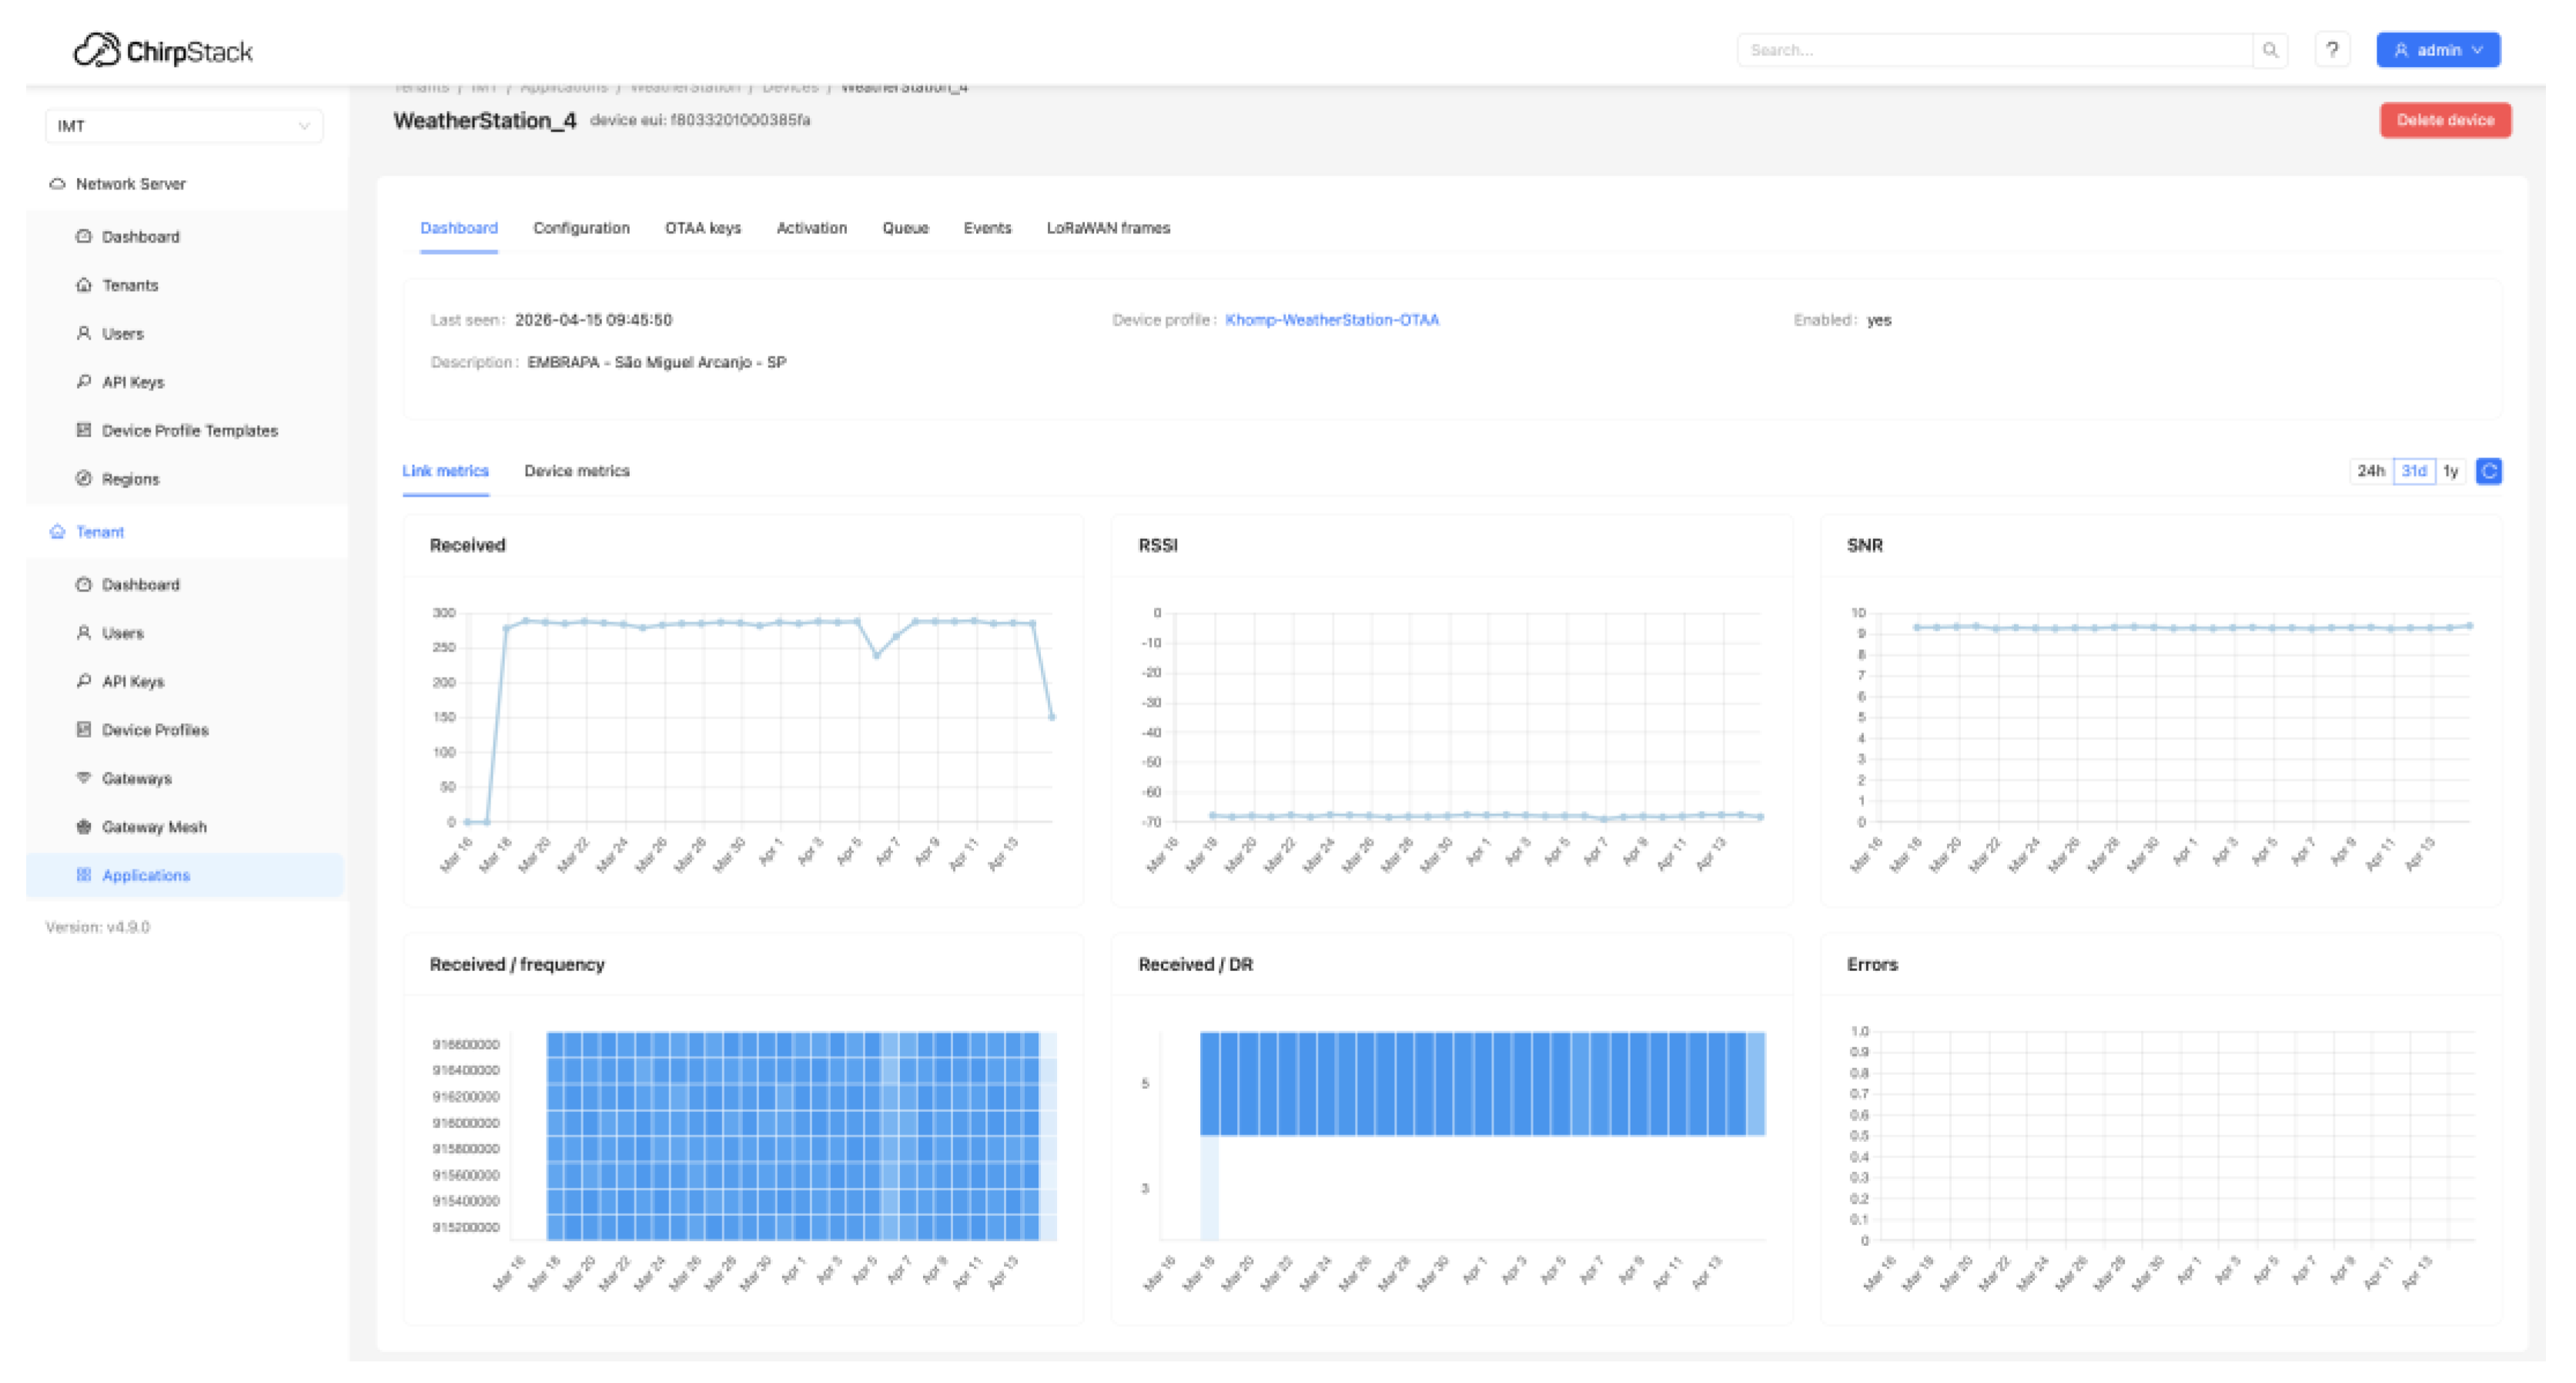
Figure 15.
Received data, RSSI, SNR, frequency, Data Rate, and errors during one day of communication between the gateway and network server.
Figure 15.
Received data, RSSI, SNR, frequency, Data Rate, and errors during one day of communication between the gateway and network server.
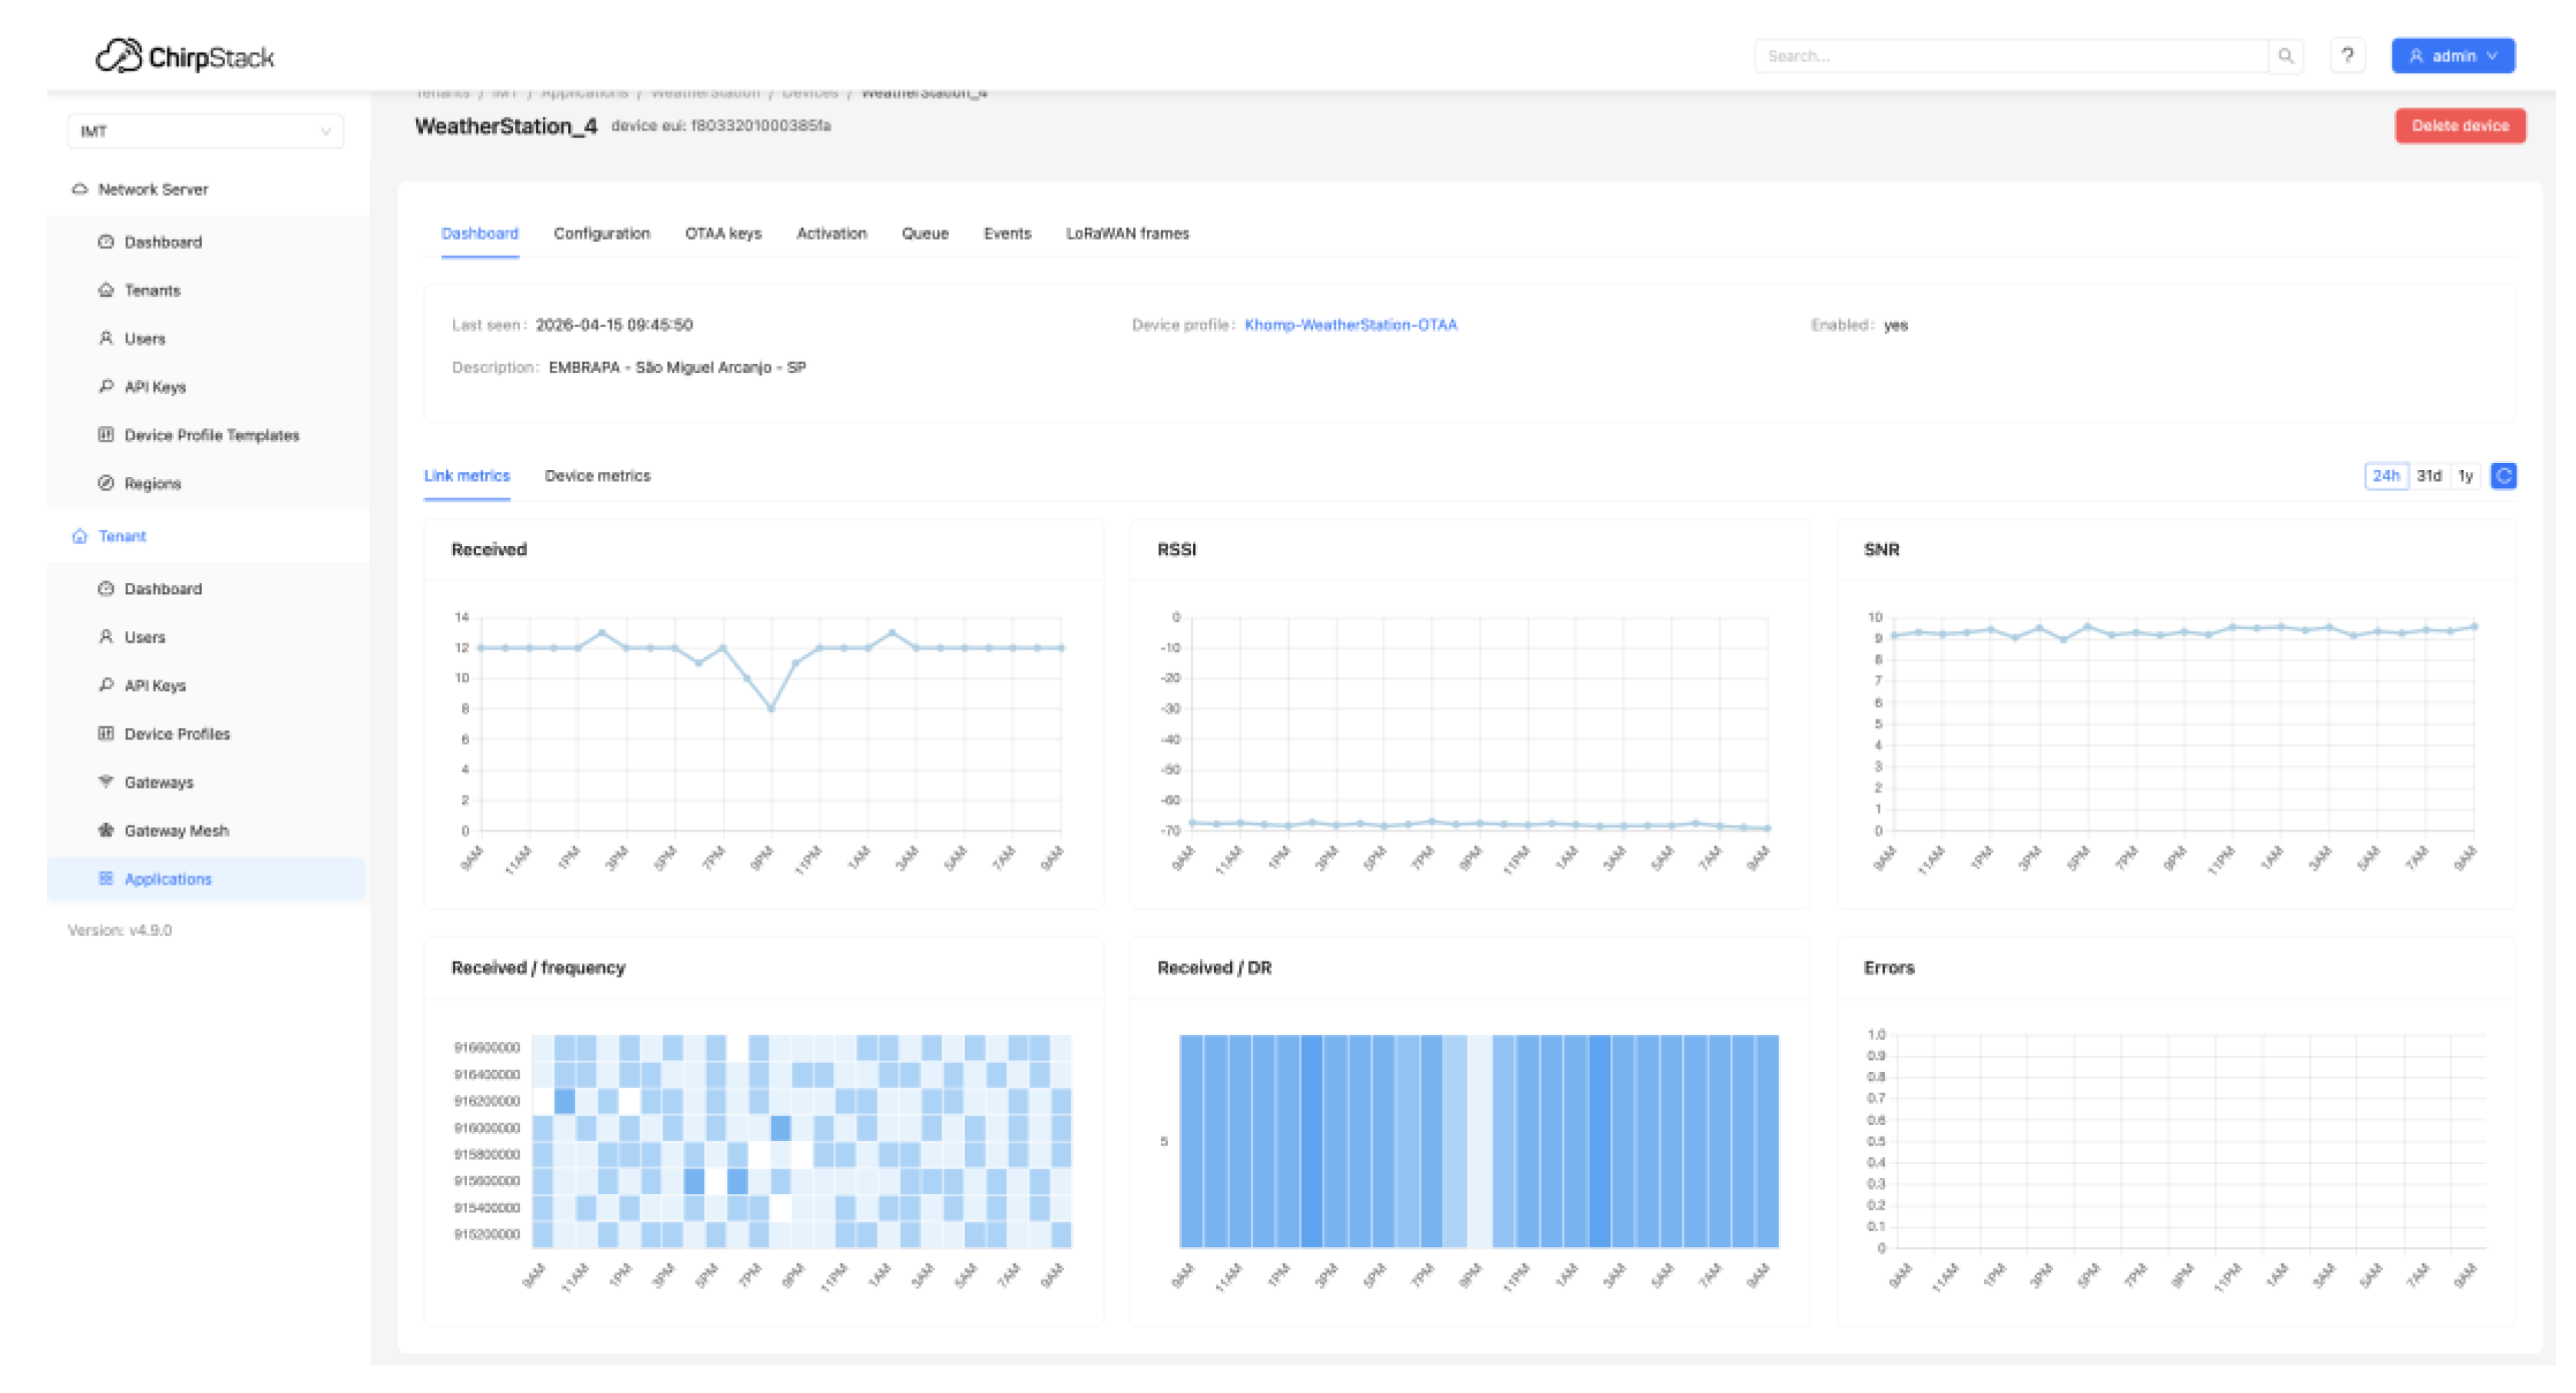
Figure 16.
Reception of weather station data through the MQTT protocol.
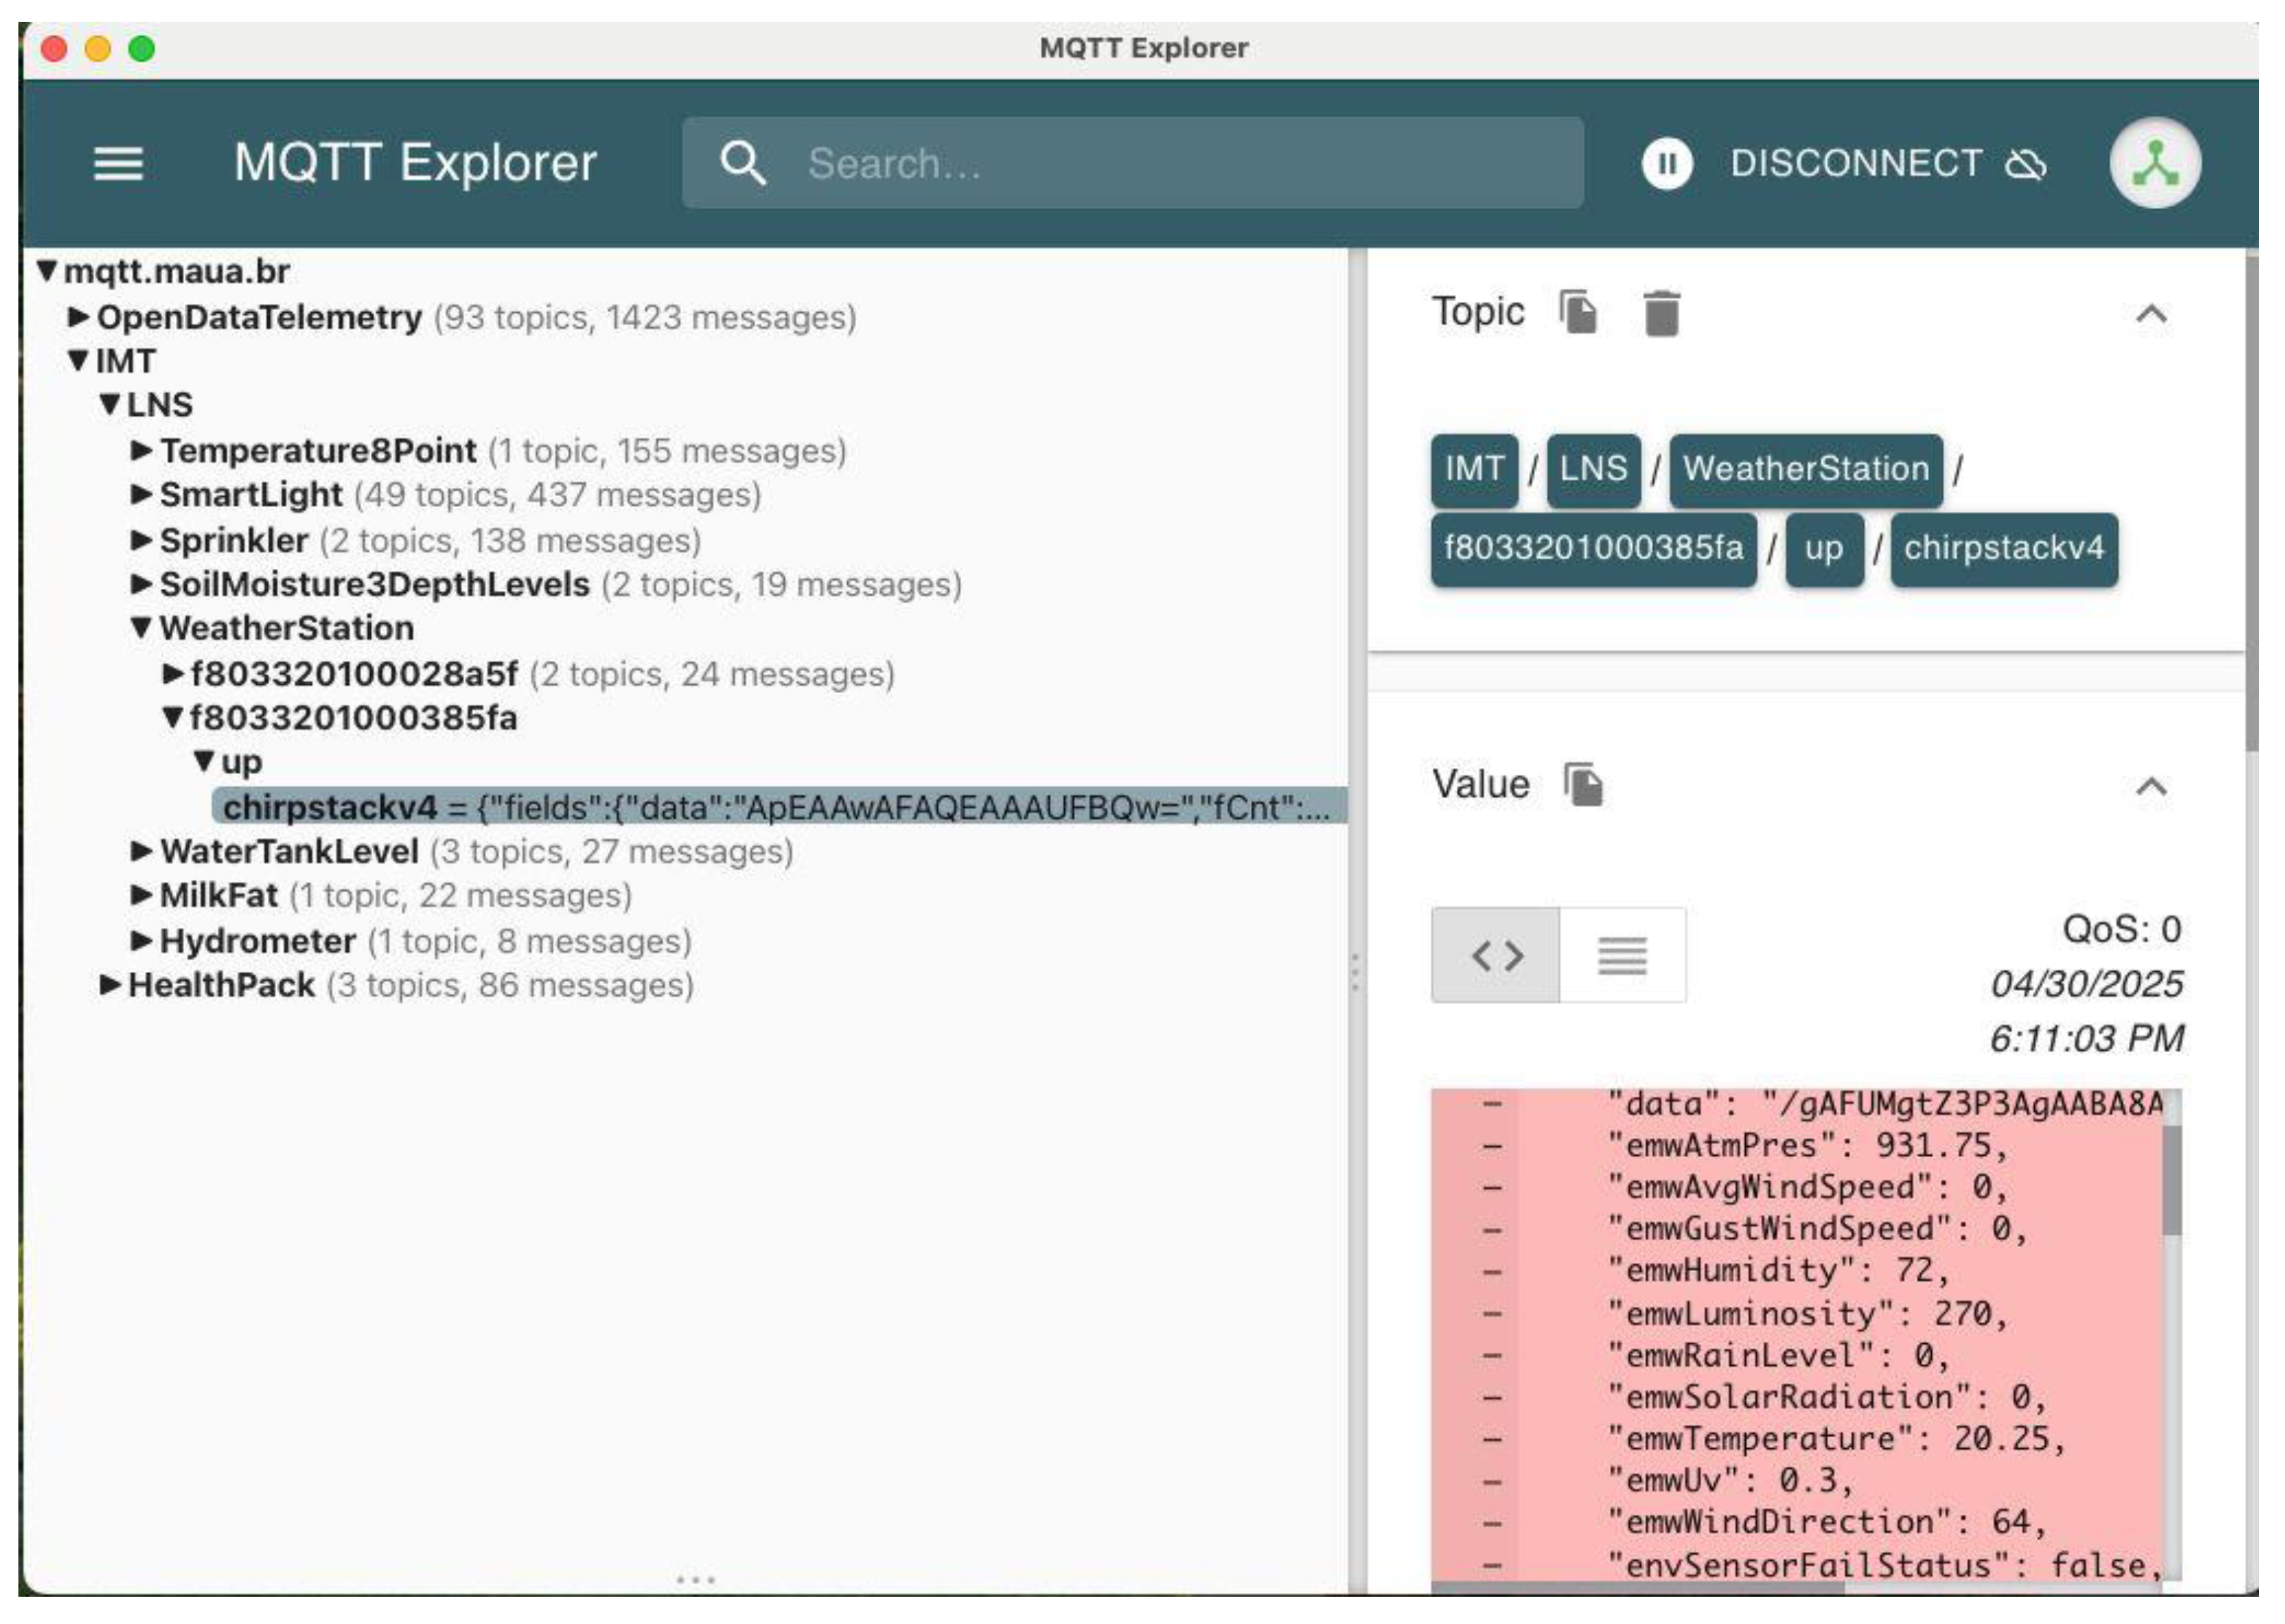
Figure 17.
Temperature, humidity, wind speed, wind direction, atmospheric pressure, and illuminance data represented graphically in Grafana.
Figure 17.
Temperature, humidity, wind speed, wind direction, atmospheric pressure, and illuminance data represented graphically in Grafana.
Disclaimer/Publisher’s Note: The statements, opinions and data contained in all publications are solely those of the individual author(s) and contributor(s) and not of MDPI and/or the editor(s). MDPI and/or the editor(s) disclaim responsibility for any injury to people or property resulting from any ideas, methods, instructions or products referred to in the content. |
© 2026 by the authors. Licensee MDPI, Basel, Switzerland. This article is an open access article distributed under the terms and conditions of the Creative Commons Attribution (CC BY) license (http://creativecommons.org/licenses/by/4.0/).
Copyright: This open access article is published under a Creative Commons CC BY 4.0 license, which permit the free download, distribution, and reuse, provided that the author and preprint are cited in any reuse.