

Submitted:
08 September 2026
Posted:
08 September 2026
You are already at the latest version
Abstract
Characterizing how the built environment shapes the health of aging populations is a growing priority for environmental assessment and for the spatial decision-support tools that inform age-friendly planning. Geographic information systems (GIS) allow neighborhood resources to be treated as measurable environmental exposures for older residents. We examined whether geographic information system (GIS)-derived measures of spatial accessibility to key urban resources are associated with cognitive impairment, physical and cognitive frailty subtypes, and polypharmacy in a cross-sectional study of 317 community-dwelling adults aged ≥65 years in the city of Talca, Chile. Physical frailty was assessed with the Fried phenotype, cognitive impairment with an abbreviated Mini-Mental State Examination, and polypharmacy as the daily use of ≥5 medications. A summary Urban Quality Index (UQI), a distance-based measure of spatial accessibility to neighborhood resources, was constructed from Euclidean distances and analyzed in quartiles and as a binary indicator. Cognitive impairment (25.2%), polypharmacy (49.5%), and frailty (35.0%) were highly prevalent and frequently co-occurred. In multivariable models adjusted for age, sex, education, body mass index, and nutritional risk, low UQI was not significantly associated with any outcome. Resource-specific distance patterns should be considered exploratory. These findings suggest that residence-based, straight-line accessibility may not capture the environmental exposures most relevant to healthy aging—consistent with the uncertain geographic context problem—and that richer indicators, such as walkability, public-space quality, physical barriers, and mobility-based exposure, are needed before such indices can support environmental decision-making. Given the cross-sectional design, the results are preliminary spatial associations and do not demonstrate that environmental accessibility influences these outcomes.
Keywords:
environmental exposure assessment
; spatial accessibility
; GIS
; spatial decision support
; built environment
; healthy aging
; age-friendly cities
; older adults
; frailty
; cognitive impairment
; polypharmacy
1. Introduction
The global population is aging at an accelerating rate. By 2050, the World Health Organization (WHO) estimates that approximately 22% of the world's population will be aged 60 years or older. In response to this demographic shift, the WHO introduced the concept of healthy aging, defined as the process of developing and maintaining the functional ability that enables well-being in older age. Functional ability results from the dynamic interaction between an individual’s intrinsic capacity and the environments in which they live [1]. This framing places the urban environment at the center of healthy aging and has motivated the age-friendly cities agenda, which calls on urban planning to ensure that older residents can reach the services, green spaces, and community resources they need. A central question for environmental and urban planning research is therefore whether, and how, the spatial accessibility of these resources relates to the health of older residents—information that can inform equitable, age-sensitive planning. From an environmental-science standpoint, the neighborhood built environment can be treated as a set of measurable exposures [66], and geographic information systems (GIS) provide the standard toolset for quantifying these exposures and translating them into evidence for spatial decision support [67,68]. Distance- and accessibility-based indices are widely used to summarize such exposures and, when combined with multicriteria methods, underpin spatial decision support systems (SDSS) for planning public services and age-friendly infrastructure [69]. Whether such residence-based accessibility metrics actually capture health-relevant environmental exposure in older adults, however, remains uncertain. Population aging has contributed to the growing public burden of cognitive impairment and dementia. Cognitive impairment is among the leading contributors to disability and dependence in older adults, and the burden of dementia is projected to rise substantially with population aging; in the United States, for example, the number of older adults living with dementia is projected to nearly double to approximately 14 million by 2060 [2]. Cognitive decline is increasingly recognized as a multifactorial process shaped by the interplay of biological, psychological, environmental, and social determinants [3]. Importantly, cognitive impairment, even in the absence of diagnosed dementia, is associated with an increased risk of disability, loss of autonomy, and substantial consequences for individuals, families, and health care systems [4]. Consequently, growing attention has been directed toward identifying modifiable factors, including lifestyle characteristics and therapeutic interventions, that may contribute to preserving cognitive function in older adults [5].
Frailty is a prevalent age-related condition that increases with advancing age and is associated with adverse outcomes, including falls, disability, hospitalization, and mortality [6]. Frailty is commonly conceptualized as a biological syndrome characterized by diminished physiological reserve and reduced resilience to stressors resulting from cumulative declines across multiple systems [7]. This framework distinguishes frailty from disability or comorbidity and highlights key features such as reductions in muscle mass, strength, mobility, balance, and physical activity, which collectively increase vulnerability in older adults [8].
Beyond its clinical manifestations, frailty reflects complex biological alterations involving chronic inflammation, oxidative stress, endocrine dysregulation, and hematologic and metabolic changes. Recent work has underscored the potential role of circulating biomarkers in refining frailty phenotyping and improving risk stratification [9,10]. Importantly, frailty and cognitive impairment exhibit a bidirectional relationship: frailty has been shown to precede and predict cognitive decline, while cognitive deficits increase the likelihood of developing frailty. This reciprocal association likely reflects shared pathophysiological mechanisms, including neurodegeneration, vascular risk factors, hormonal alterations, and chronic inflammation, contributing to declines in both physical and cognitive function [11].
Polypharmacy is highly prevalent among older adults and is increasingly regarded not only as a consequence of multimorbidity but also as an indicator of clinical vulnerability. Evidence indicates that the use of multiple medications is strongly associated with physical frailty and adverse health outcomes, including functional decline, disability, and mortality. Moreover, polypharmacy has been linked to poorer cognitive performance and an increased risk of cognitive impairment. From a broader perspective, patterns of polypharmacy are shaped not only by individual clinical complexity but also by social and contextual factors influencing access and utilization of health care services. Thus, polypharmacy may act as an intermediary pathway linking environmental and social determinants to clinical vulnerability, connecting frailty, cognitive decline, and adverse outcomes as interconnected dimensions of multidimensional vulnerability in older adults [12]. These observations highlight the importance of considering the broader neighborhood environment as a potential determinant of health and vulnerability in later life.
Cognitive aging is influenced by a complex interplay of biological, physical, and social factors. Older adults residing in socioeconomically disadvantaged neighborhoods experience faster cognitive decline and a higher risk of cognitive impairment, highlighting the role of unequal exposure to health risks, limited cognitive resources, and chronic stress [13]. A growing body of evidence, including systematic reviews, indicates that characteristics of the neighborhood-built environment play a significant role in shaping cognitive function in later life. Features such as walkability, street connectivity, access to public transportation, proximity to local destinations and services, availability of green spaces, and overall neighborhood quality have been consistently associated with better global cognitive performance and a lower risk of cognitive decline. Conversely, environments characterized by poor infrastructure, limited accessibility, and lower environmental quality have been linked to worse cognitive outcomes. These associations are thought to operate through interconnected pathways involving physical activity, social engagement, cognitive stimulation, and reduced exposure to environmental stressors, underscoring the built environment as a potentially modifiable determinant of cognitive aging [14].
Our research group has previously employed Geographic Information System (GIS)-based approaches in Talca, Chile, to investigate spatial patterns of frailty and their relationship with the urban physical environment. In prior work, we developed an urban quality index based on the spatial accessibility to key neighborhood resources, including fruit and vegetable shops, senior centers, pharmacies, emergency health centers, parks and squares, community centers, and exercise facilities. Greater spatial accessibility was associated with distinct hematological and nutritional profiles, as well as a greater burden of frailty among older adults [15]. Complementary analyses of the same cohort demonstrated that frail individuals tended to reside closer to emergency health centers, sports facilities, and major parks or squares than their non-frail counterparts, revealing meaningful geospatial patterns related to access to health care and recreational resources [16]. However, the extent to which GIS-derived spatial accessibility to neighborhood resources is associated with cognitive impairment, cognitive frailty subtypes, and polypharmacy remains unclear.
In this context, cognitive impairment, physical and cognitive frailty subtypes, and polypharmacy represent interconnected dimensions of geriatric vulnerability that may be spatially patterned according to the availability and accessibility of neighborhood resources. The primary aim of the present study was to evaluate whether a GIS-derived, distance-based spatial accessibility index to selected urban resources discriminates cognitive impairment, physical and cognitive frailty subtypes, and polypharmacy among community-dwelling older adults in Talca, Chile. A secondary aim was to assess whether decomposing the composite index into conceptually coherent resource groups provides more interpretable environmental-exposure evidence for spatial decision support in age-friendly urban planning. By integrating comprehensive geriatric assessments with detailed geospatial data, this study sought to generate spatially explicit evidence to inform environmental assessment, health-service organization, and age-friendly urban policy.
2. Materials and Methods
2.1. Participants And Study Design
This cross-sectional study was conducted within the framework of the Interdisciplinary Excellence Research Program on Healthy Aging (PIEI-ES), a community-based cohort comprising 1,205 adults aged 65 years and older residing in the Maule Region of central Chile. In the parent study, participants were randomly selected from registries of primary health care centers located in four urban provincial capitals and two rural communes. The proportions of participants from urban areas, stratified by sex, were defined based on the distribution of the population aged 65 years and older, using data from the National Socioeconomic Characterization Survey (CASEN).
The sample size calculation for the parent cohort considered a two-sided significance level of 0.05, 80% statistical power, an anticipated loss to follow-up of 20%, and an estimated national prevalence of frailty of approximately 22% [17]. Baseline assessments were conducted between September 2016 and October 2017 using a standardized protocol that included structured interviews, physical examinations, and comprehensive geriatric assessments, all performed by trained health professionals in local primary centers. For the present geospatial analysis, eligibility was restricted to participants aged 65 years or older residing within the urban boundaries of the city of Talca, where detailed and validated information on the urban environment and public facilities was available for GIS integration. Of the 1,205 participants in the parent cohort, 832 were excluded because they resided outside urban Talca: 601 in other urban areas and 231 in rural areas. Among the 373 urban Talca residents, 56 were excluded from the geospatial analysis because of incomplete data (n=13) or because their residential address could not be geocoded or verified with sufficient accuracy for spatial linkage (n=43). The final analytic sample comprised 317 community-dwelling older adults (Figure 1).
To assess the potential for selection bias, we compared the analytic sample with the source population described in the parent cohort study [17]. Within the parent cohort, 373 participants resided in urban Talca (1,205 minus 601 living in other urban areas and 231 in rural areas); of these, 56 were further excluded because of incomplete data (n=13) or because their residential addresses could not be geocoded or verified with sufficient accuracy for spatial linkage (n=43), yielding the final analytic sample of 317 (Figure 1). For external reference, the overall frailty prevalence in our analytic sample (frail 35.0%, pre-frail 37.2%, non-frail 27.8%) was closely comparable to that reported for Talca in the parent study (frail 34.5%, pre-frail 37.3%, non-frail 28.3%) [17], indicating that the geocoding-based restriction did not materially alter the frailty profile of the sample. Compared with the full PIEI-ES cohort (n=1,205), the analytic sample showed a higher prevalence of frailty (35.0% vs 24.6%), cognitive impairment (25% vs 19%), and nutritional risk (35% vs 23%); this is consistent with the parent study’s finding that Talca had the highest frailty prevalence among all surveyed localities in the Maule Region [17], rather than reflecting selective inclusion. Because the sample was restricted to urban Talca residents with geocodable addresses, generalization to rural or other settings should nonetheless be made with caution.
2.2. Frailty Diagnosis
Frailty status was determined based on the presence or absence of five predefined components: slowness, weakness, unintentional weight loss, exhaustion, and low physical activity [6,17]. Slowness was assessed using usual gait speed over 3-meter walk, with a cut-off of <0.8 m/s, adjusted for sex and height according to the Short Physical Performance Battery [18]. Weakness was evaluated by handgrip strength measured with an electronic dynamometer (Camry, City Industry, USA), using sex-specific cut-offs (<27 kg for men and <15 kg for women). Unintentional weight loss was defined as self-reported loss of at least 5 kg in the preceding 6 months [19]. Exhaustion was identified when participants reported experiencing either of the following statements from the Center for Epidemiological Studies Depression Scale: “I felt that anything I did was a big effort” or “I felt that I could not keep on doing things”, for at least 3 to 4 days a week. Low physical activity was defined based on two questions "Do you have difficulty walking a block?" or "Do you have difficulty climbing several flights of stairs without resting?" [19]. Participants were classified as frail if they met three or more criteria, pre-frail if they met one or two criteria, and non-frail or robust if none of the criteria were present.
2.3. Cognitive Status Assessment
Cognitive function was assessed using the abbreviated version of the Mini-Mental State Examination (MMSE), originally developed by Folstein et al. and validated for use in the Chilean population [20,21]. This version is routinely administered as part of the annual preventive health examination for individuals aged 65 years and older in Chilean primary health settings [22]. The abbreviated MMSE evaluates multiple cognitive domains, including temporal and spatial orientation, short- and long-term memory, attention and concentration, language, and visuoconstructive ability. The total score ranges from 0 to 19, with higher scores indicating better cognitive performance. Consistent with established cut-offs, a score of ≤13 was considered indicative of cognitive impairment, whereas a score ≥14 was classified as normal cognitive function [20,23,24]. The screening cut-off used in Chilean primary care identifies potential cognitive impairment and is not a diagnostic tool for dementia. Consequently, this study defines cognitive impairment as screening-based impairment, as indicated by the abbreviated MMSE.
2.4. Frailty Subtype Definitions
Frailty subtypes were defined by combining physical frailty status, based on the Fried phenotype, with cognitive status, assessed using the abbreviated MMSE. Physical frailty was defined as the presence of three or more Fried criteria in participants without screening-based cognitive impairment, whereas physical pre-frailty was defined as the presence of one or two Fried criteria in the absence of screening-based cognitive impairment. Cognitive frailty was defined as the coexistence of physical frailty and screening-based cognitive impairment, while cognitive pre-frailty was defined as the coexistence of physical pre-frailty and screening-based cognitive impairment. Participants with no Fried criteria and no screening-based cognitive impairment were classified as robust (non-frail). These physical/cognitive subtype categories were mutually exclusive. A small number of participants (n=5) had screening-based cognitive impairment but no Fried criteria; because they met neither the physical- nor the cognitive-frailty definitions and did not fulfil the robust definition, they were retained in the non-frail category for the cognitive-status analyses (Table 2) but were not assigned to any physical/cognitive frailty subtype in Table 4. Consequently, the subtype categories in Table 4 sum to the 111 frail participants (58 physical frailty and 53 cognitive frailty) and 118 pre-frail participants (96 physical pre-frailty and 22 cognitive pre-frailty), consistent with Table 2 and Table 5, and 6. Accordingly, Table 4 reports the four physical/cognitive vulnerability subtypes and should not be interpreted as a complete five-category classification of the entire analytic sample. Because clinical diagnoses of mild cognitive impairment or dementia were not available, the cognitive frailty and cognitive pre-frailty categories should be interpreted as operational classifications based on screening-detected cognitive impairment rather than consensus diagnostic definitions of cognitive frailty.
2.5. Nutritional Risk and Polypharmacy
Nutritional status was assessed using the Mini Nutritional Assessment-Short Form (MNA-SF), a validated 6-item instrument with scores ranging from 0 to 14. For analytical purposes, participants were classified as being at nutritional risk if they scored ≤11 points, encompassing both malnutrition (0-7 points) and risk of malnutrition (8-11 points). Scores of 12–14 points indicated normal nutritional status. Self-reported fruit and vegetable consumption was included as a descriptive dietary indicator and was defined as reporting fruit and vegetable intake on at least 5 days per week. This variable was not used to define nutritional risk and was not intended to represent a comprehensive nutritional assessment; nutritional risk was primarily evaluated using the MNA-SF.
Polypharmacy was defined as the concurrent use of five or more medications taken on a regular daily basis at the time of assessment, based on self-reported medication use verified during the clinical evaluation. The medication count included both medications prescribed by a health professional and regularly used self-medicated (non-prescribed) drugs; dietary supplements, vitamins, and other over-the-counter products not taken as regular medication were not counted. Prescribed and self-medicated drugs were recorded separately and summed to obtain the total daily medication count used to define polypharmacy.
2.6. Geospatial Database
A georeferenced database was constructed using GIS technology to represent both the urban physical environment of Talca and the residential locations of study participants (Figure 2). Each participant’s residence was geocoded as a point feature based on address information collected during the clinical evaluation. All spatial and attribute data were organized into point feature layers with corresponding thematic tables. The database incorporated multiple layers representing key factors of the urban physical environment, including fruit and vegetable shops, senior centers or communities, pharmacies, emergency health centers, main squares and parks, family or community health centers, and exercise facilities. Spatial data were obtained from OpenStreetMap (OSM), Google Maps, and the Geospatial Infrastructure of Chile (IDE Chile) and represented as point or polygon features at the neighborhood level. All spatial layers were curated to reflect the urban environment during the same period as the baseline clinical assessments (2016–2017), ensuring temporal consistency between exposure and outcome measurements. This framework operationalizes the neighborhood built environment as a set of georeferenced environmental exposures, and the resulting distance-based accessibility index is intended as an environmental-exposure metric of the kind used in GIS-based spatial decision support, rather than as a measure of individual mobility or activity space.
2.7. GIS-Derived Spatial Accessibility Index
The Urban Quality Index (UQI) was conceptualized as a GIS-derived, distance-based proxy of spatial accessibility to selected neighborhood resources relevant to healthy aging, rather than as a comprehensive measure of all dimensions of urban quality. The included facilities were selected because they represent key domains of the local urban environment that may influence older adults’ functional ability, health-care access, social participation, nutrition, recreation, and opportunities for physical activity. For consistency with prior work in the same cohort, in which the same instrument was used [15,16], we retained the label “Urban Quality Index”; however, throughout this paper the term denotes this specific distance-based accessibility measure and should not be read as encompassing broader dimensions of urban quality such as walkability, environmental quality, safety, or neighborhood socioeconomic conditions.
Each GIS layer was analyzed using the Euclidean distance method to estimate proximity from any location within the urban area to the nearest facility of each type. Distance rasters were subsequently classified into three categories: close, medium, and distant, each assigned a score from 1 to 3, with higher scores reflecting closer proximity. Distance thresholds were defined according to the local urban context and prior applications in the same study area (Table 1) [15,16]. A raster calculator was used to integrate all facility layers into a composite UQI, with higher values indicating greater overall spatial accessibility. Because locally validated weights reflecting the relative importance of each facility type for older adults in Talca were not available, all components were weighted equally. This approach was intended to provide a transparent and reproducible exploratory measure of overall spatial accessibility. However, the index should not be interpreted as implying that all resources have equivalent effects on health outcomes or that proximity to each facility necessarily operates in the same direction. The index was generated as a continuous raster surface with a spatial resolution of 50 meters covering the entire urban area. Values of the index were extracted at each participant’s geocoded residence using spatial join procedures. All GIS processing and analyses were performed using ArcGIS software (version 10; ESRI, Redlands, CA, USA).
For the analyses, the continuous UQI was operationalized in two complementary ways. First, it was divided into sample-based quartiles (Q1-Q4), with Q1 representing the lowest accessibility category and Q4 the highest, to examine graded associations across the distribution of spatial accessibility. Second, the index was dichotomized into lower versus higher spatial accessibility using two thresholds derived from its distribution in this sample: a primary cut-off at the lowest-quartile boundary (≤18 points) and a stricter cut-off (≤16 points) applied as a sensitivity analysis to isolate participants residing in the lowest spatial-accessibility stratum [15,16]. Because the summary index takes a limited number of discrete integer values (range 9-23), tied scores at the cut-points produced quartile groups of unequal size (Q1 n=125, Q2 n=73, Q3 n=55, Q4 n=64); these ties, rather than any data loss, account for the departure from exactly equal quartiles.
2.8. Statistical Analysis
Descriptive statistics and group comparisons were performed using GraphPad Prism version 9, and multivariable logistic regression models were fitted using IBM SPSS Statistics version 23. Firth penalized-likelihood models were estimated in Stata 17 (StataCorp LLC) using the user-written firthlogit command. Continuous variables were summarized as mean ± standard deviation (SD) or median with 95% confidence intervals (CI), as appropriate. Categorical variables were expressed as percentages with 95% CI. Group comparisons were conducted using the chi-square test with Yates correction for categorical variables and the t-test, Mann-Whitney U test, or analysis of variance (ANOVA) for continuous variables, depending on data distribution. For comparisons across the four UQI quartiles, one-way ANOVA or the Kruskal-Wallis test was used according to data distribution, and distance-based comparisons across frailty subtypes were analyzed using the Kruskal-Wallis test. When the omnibus Kruskal-Wallis test was statistically significant, pairwise post hoc comparisons were performed using the Dunn test with Bonferroni adjustment. Multivariable binary logistic regression models were fitted with each clinical outcome (cognitive impairment, polypharmacy, and frailty) as the dependent variable and low UQI (lower spatial accessibility) as the primary exposure, adjusting for age (years), sex, education (years), body mass index, and nutritional risk. Lower spatial accessibility was modelled using two pre-specified cut-offs (≤18 and ≤16 points); the continuous index and quartiles (reference: first quartile) were examined as sensitivity analyses. Adjusted odds ratios (aOR) and 95% CIs are reported for all model parameters, with the higher spatial-accessibility group as the reference category. Because the ≤16-point subgroup was small (n=36), Firth penalized logistic regression was performed as a sensitivity analysis for this cut-off to assess the robustness of the conventional logistic regression estimates and reduce potential sparse-data bias. Nutritional risk was defined as a Mini Nutritional Assessment-Short Form score ≤11, and comorbidity burden (count of physician-diagnosed chronic conditions) was added in a sensitivity analysis. Statistical significance was defined as a two-sided P value <.05. All analyses were conducted on complete cases. Participants with incomplete data had already been excluded during sample selection (see Figure 1), and the resulting analytic dataset (n=317) had no missing values for any of the exposure, outcome, or covariate variables; no imputation was therefore required. As an additional sensitivity analysis addressing the conceptual heterogeneity of the composite index, we constructed a beneficial-resource sub-index restricted to the four resources whose greater proximity is conceptually expected to be advantageous (main squares and parks, fruit and vegetable shops, exercise facilities, and senior centers), excluding health-need markers whose proximity may instead reflect clinical need or service allocation (emergency health centers, pharmacies, and family or community health centers). This sub-index was scored using the same distance thresholds as the main index (Table 1) and modelled, both continuously and dichotomized at its lowest quartile, against each outcome with the same covariate adjustment. For symmetry, we also constructed a complementary need-marker sub-index from the excluded health-service resources (emergency health centers, pharmacies, and family or community health centers) and modelled it analogously (Table S1). The comparisons of resource-specific distances across cognitive status, polypharmacy status, and frailty subtypes, as well as the comparisons across UQI quartiles, were considered exploratory and hypothesis-generating. Given the large number of comparisons, P values were not adjusted for multiple testing; these results should therefore be interpreted with caution, as some may represent false-positive findings. In addition to P values, effect sizes are reported throughout. For the primary analyses, the adjusted odds ratios with their 95% confidence intervals represent the main measures of effect size and precision for the associations between lower spatial accessibility and each clinical outcome. For the descriptive and resource-specific distance comparisons, between-group differences are presented as mean distances (in meters) with their 95% confidence intervals, which provide an interpretable measure of the magnitude of difference; the quartile-based comparisons are likewise interpreted in conjunction with the corresponding adjusted odds ratios rather than on the basis of P values alone.
2.9. Ethical Considerations
The PIEI-ES cohort was approved by the Scientific Ethics Committee of the Universidad de Talca, Chile, and conducted in accordance with national regulations and the principles of the Declaration of Helsinki (approval code: 2016-019-IP). All participants or their legal proxies provided written informed consent prior to enrollment. The present geospatial analysis of the Talca subsample was conducted under the same ethical approval. Participation was voluntary, and no monetary compensation was provided.
To protect geospatial privacy, all records were deidentified prior to linkage with GIS layers. Residential addresses were used exclusively for geocoding, which was performed within a secure, access-restricted institutional environment by authorized research personnel. Raw address files were stored separately from the deidentified analytical dataset and were not used in statistical analyses. After geocoding, residential locations were transformed into derived distance-based indicators and UQI values. The analytical dataset included only deidentified participant codes and derived geospatial indicators, with no raw addresses or individually identifiable residential locations. Analytical datasets were stored on secure, access-restricted institutional servers. All maps, tables, and geospatial outputs were reported only in aggregate form and designed to avoid disclosure of exact residential locations or potential reidentification of participants.
3. Results
3.1. Sociodemographic Characteristics, Frailty, and Spatial Accessibility by Cognitive Status
A total of 317 community-dwelling older adults were included in the analysis; 80 participants (25.2%) presented cognitive impairment and 237 (74.8%) had normal cognitive function (Table 2). Participants with cognitive impairment were significantly older (76.6 ± 6.3 vs 72.5 ± 5.2 years; P<.001) and had fewer years of formal education (7.4 ± 3.7 vs 9.3 ± 3.9 years; P<.001) than those with normal cognition. The proportion of women did not differ significantly between groups. No significant differences were observed between cognitive groups in BMI or self-reported fruit and vegetable consumption. In contrast, nutritional risk was significantly more prevalent among participants with cognitive impairment (53.8% vs 29.1%; P<.001). Frailty status differed markedly by cognitive status. Among participants with cognitive impairment, 66.3% were classified as frail and only 6.3% as non-frail, whereas in the normal cognition group, 24.5% were frail and 35.0% were non-frail (P<.001 for both parameters). Pre-frailty was less frequent in the cognitively impaired group (27.5% vs 40.5%; P=.04).
The UQI scores in this sample ranged from 9 to 23 points and were categorized into quartiles (Q1, 9-18; Q2, >18-19; Q3, >19-20; and Q4, >20-23), with Q1 representing the lowest and Q4 the highest spatial accessibility.
The distribution of participants across UQI quartiles did not differ significantly according to cognitive status. Although a higher proportion of cognitively impaired participants were observed in the second quartile (Q2), this difference did not reach statistical significance (P=.09).
3.2. Sociodemographic Characteristics, Frailty, and Spatial Accessibility by Polypharmacy Status
Polypharmacy was identified in 157 participants (49.5%), while 160 (50.5%) did not meet the polypharmacy criterion (Table 3). Sex distribution and mean age were similar between groups. Participants with polypharmacy had a significantly higher BMI (30.6 ± 4.7 vs 27.9 ± 4.4 kg/m²; P<.001) and fewer years of education (8.2 ± 3.9 vs 9.4 ± 4.0 years; P=.007). Nutritional risk was more prevalent among participants with polypharmacy (42.7% vs 28.1%; P=.007). Frailty was also more frequent in the polypharmacy group, with 42.0% classified as frail compared with 28.1% in the non-polypharmacy group (P=.01). There were no statistically significant differences in the proportions of non-frail and pre-frail individuals. As observed for cognitive status, the distribution across quartiles of the spatial-accessibility summary index did not differ significantly between participants with and without polypharmacy.
3.3. Frailty Subtypes, Physical Performance, and Polypharmacy Across Spatial-Accessibility Quartiles
Because frailty subtypes were mutually exclusive categories derived from the combination of Fried phenotype status and screening-based cognitive impairment, physical frailty/pre-frailty and cognitive frailty/pre-frailty were presented together to describe the distribution of distinct physical and cognitive vulnerability profiles across UQI quartiles.
When participants were stratified into quartiles of the composite UQI, frailty-related outcomes were largely similar across quartiles (Table 4). The prevalence of physical frailty, physical pre-frailty and cognitive pre-frailty did not differ significantly across spatial-accessibility levels. Cognitive frailty showed variation across quartiles but did not reach statistical significance (P=.052). Measures of physical performance, including Fried phenotype scores, handgrip strength, and gait speed, were comparable across quartiles. Likewise, the prevalence of individual Fried frailty criteria and polypharmacy characteristics did not differ significantly according to spatial-accessibility level.
3.4. Spatial Proximity to Urban Facilities by Cognitive Status, Polypharmacy, and Frailty Subtypes
From an environmental-exposure perspective, these resource-specific analyses describe how spatial accessibility to individual urban resources is distributed across older residents with different health profiles, complementing the composite-index models. Resource-specific comparisons are exploratory and were not adjusted for multiple testing; therefore, findings should be interpreted with caution as hypothesis-generating. Spatial analyses generally revealed heterogeneity in proximity to selected urban facilities (Figure 3, Figure 4 and Figure 5). However, participants with cognitive impairment lived farther from main squares and parks than those without cognitive impairment (240.8 m vs 211.1 m; P=.04), but were located closer to emergency health centers (688.7 m vs 919.8 m; P=.02; Figure 3). No differences emerged for the remaining facilities. These resource-level comparisons are the spatially most granular part of our analysis and speak directly to how the accessibility of specific urban resources is distributed across residents with differing health profiles—the question of central interest for age-friendly urban planning.
Participants with polypharmacy resided closer to emergency health centers (767.3 m vs 918.2 m; P=.04), family or community health centers (539.2 m vs 619.9 m; P=.04), and main squares and parks (212.3 m vs 239.7 m; P=.03; Figure 4) compared with those without polypharmacy. Comparisons were not statistically significant for fruit and vegetable shops, senior centers or community centers, pharmacies, or exercise facilities.
Across frailty subtypes, physically frail participants lived significantly closer to emergency health centers than non-frail individuals (602.3 m vs 975.8 m; P=.02). In addition, participants with physical frailty lived closer to family or community health centers than those with cognitive frailty (423.4 m vs 639.9 m; P=.03) and those with physical pre-frailty (423.4 m vs 652.0 m; P=.005). In contrast, participants with cognitive frailty lived farther from main squares and parks than both non-frail and physical frailty groups (Figure 5). Differences did not reach statistical significance for fruit and vegetable shops, senior centers or community centers, pharmacies, or exercise facilities (all P>.05).
3.5. Association Between Lower Spatial Accessibility and Clinical Outcomes
Multivariable binary logistic regression models were used to examine the association between lower spatial accessibility and each clinical outcome, adjusting for age, sex, education, body mass index, and nutritional risk. Using the ≤18-point cut-off (Table 5), lower spatial accessibility was not significantly associated with cognitive impairment (aOR 0.94, 95% CI 0.52–1.68), polypharmacy (aOR 0.89, 95% CI 0.55–1.45), or frailty (aOR 0.96, 95% CI 0.58–1.59). Results were consistent when the index was modelled continuously (per 1-point increase: all aORs between 0.98 and 1.01; all P>.70) and across quartiles. Using the stricter ≤16-point cut-off (Table 6), the point estimate for polypharmacy was higher but did not reach statistical significance after adjustment (aOR 2.07, 95% CI 0.95-4.51; P=.07); the other outcomes remained null. Firth penalized-likelihood models for the ≤16-point exposure yielded materially identical estimates (e.g., polypharmacy aOR 2.01, 95% CI 0.93-4.37), confirming that the models were stable and not affected by sparse-data bias. In this framing, low UQI (lower spatial accessibility) operationalizes limited access to the bundle of neighborhood resources captured by the index, and the models test whether such limited accessibility is associated with each outcome. In an additional sensitivity analysis further adjusting for the number of physician-diagnosed chronic conditions, the associations between lower spatial accessibility and all three outcomes remained non-significant (e.g., polypharmacy at ≤18 points aOR 1.18, 95% CI 0.61-2.30; at ≤16 points aOR 2.35, 95% CI 0.81-6.78); comorbidity count was itself a strong correlate of polypharmacy (aOR 5.31 per condition, 95% CI 3.59-7.85, P<.001), as expected, whereas spatial accessibility was not (Table S1). Across all models, nutritional risk and body mass index were the strongest and most consistent correlates of the three outcomes, rather than spatial accessibility. Overall, although cognitive impairment, frailty, and polypharmacy were highly prevalent and closely interrelated, their associations with objectively measured spatial accessibility were weak and not statistically significant after adjustment for individual-level factors. From an environmental assessment standpoint, two features of this mid-sized city help interpret these null associations. First, spatial contrast was limited: as a compact, medium-sized city, Talca offers relatively short and homogeneous distances to most essential resources, compressing the exposure range against which health differences could be detected. Second, where proximity did track health status, it did so in the direction expected if services are allocated toward higher-need areas—shorter distances to health facilities among frailer residents—rather than reflecting a health advantage of the built environment. In a sensitivity analysis restricting the index to conceptually beneficial resources (main squares and parks, fruit and vegetable shops, exercise facilities, and senior centers), low beneficial access was likewise not significantly associated with any outcome (cognitive impairment aOR 0.96, 95% CI 0.52-1.78, P=.91; polypharmacy aOR 1.25, 95% CI 0.74-2.11, P=.40; frailty aOR 1.17, 95% CI 0.69-2.00, P=.56), and results were consistent when the sub-index was modelled continuously (Table S1). A complementary sub-index restricted to health-need markers (emergency health centers, pharmacies, and family or community health centers) was likewise not associated with any outcome (cognitive impairment aOR 0.62, 95% CI 0.34-1.13, P=.12; polypharmacy aOR 0.85, 95% CI 0.52-1.39, P=.52; frailty aOR 0.98, 95% CI 0.59-1.63, P=.93; Table S1). Thus, neither the beneficial nor the need-marker components, analyzed separately, were associated with the outcomes.
4. Discussion
This study evaluated a GIS-derived, distance-based urban accessibility layer as an environmental exposure indicator for healthy-aging outcomes in a mid-sized Chilean city. The main finding was that, after adjustment for individual-level factors, the composite UQI showed limited discriminatory capacity for cognitive impairment, polypharmacy, or frailty. For environmental exposure assessment and decision support, this suggests that simple Euclidean proximity to selected resources may be insufficient to represent the urban conditions most relevant to older adults’ health. In this cross-sectional study of 317 community-dwelling older adults living in Talca, Chile, we identified a high burden of cognitive impairment, frailty, and polypharmacy, accompanied by weak and, after adjustment for individual-level factors, largely null associations with objective indicators of spatial accessibility. Approximately one quarter of participants had cognitive impairment; this group was older, had fewer years of formal education, greater nutritional risk, and showed a markedly higher prevalence of frailty than those with normal cognition. Frailty and pre-frailty were highly prevalent overall, and nearly half of the sample (49.5%) met criteria for polypharmacy (≥5 chronic medications).
Contrary to our initial hypothesis, the composite spatial-accessibility summary index, capturing proximity to key urban resources, did not differ substantially between groups defined by cognitive status, frailty, or polypharmacy when analyzed in quartiles. Similarly, no significant associations were observed when the index was dichotomized into low UQI (n = 125) versus higher spatial accessibility (n = 192) using the primary cut-off. When a stricter cut-off was applied in a sensitivity analysis, participants in the lowest spatial-accessibility stratum (n=36) showed a higher point estimate for polypharmacy, but this association did not reach statistical significance after adjustment for age, sex, education, body mass index, and nutritional risk (aOR 2.07, 95% CI 0.95-4.51; P=.07), and was confirmed as non-significant in Firth penalized models. After adjustment, lower spatial accessibility was not significantly associated with any of the three outcomes at either cut-off. These adjusted, largely null associations, rather than the exploratory distance comparisons, constitute the primary finding of this study: in this sample, lower spatial accessibility as captured by the composite index showed no statistically significant association with cognitive impairment, polypharmacy, or frailty once individual-level factors were taken into account.
Against this primary result, the following resource-specific distance patterns should be regarded as secondary and exploratory, and interpreted only in light of the null adjusted associations described above. Distance-based analyses examining proximity to individual urban resources revealed more nuanced spatial patterns. Older adults with cognitive impairment lived farther from main squares and parks and closer to emergency health centers than those with normal cognition. Polypharmacy was associated with shorter distances to emergency and family or community health centers and, unexpectedly, also with shorter distances to main squares and parks. Analysis by frailty subtypes suggested that physically frail participants tended to live closer to health services than non-frail older adults and were also located closer to family or community centers than those with cognitive frailty or physical pre-frailty. In contrast, individuals with predominantly cognitive frailty were more likely to reside farther from main squares and parks. Overall, these findings suggest that in this medium-sized Latin American city, the spatial distribution of cognitive impairment, frailty, and polypharmacy reflects a complex interplay between health needs, service allocation, and urban form, rather than a simple gradient of “better” versus “worse” neighborhoods. Framed as environmental-exposure evidence, these patterns speak to spatial equity in access to age-relevant resources: the accessibility, size, and quality of green and public spaces have been linked to older adults’ quality of life and mental health, and access is frequently distributed unequally across a city [63,64]. Notably, evidence that the health returns of green-space access may be non-linear, with threshold effects, further cautions against assuming a simple monotonic “closer-is-better” gradient of the kind embedded in distance-based indices [65]. In this sense, the UQI should be interpreted as a reproducible distance-based proxy of spatial accessibility to selected urban resources, but not as a comprehensive measure of neighborhood quality capable of capturing the multidimensional environmental determinants of geriatric vulnerability.
Importantly, the interpretation of proximity differs according to the type of resource. While shorter distances to parks, main squares, food outlets, or exercise facilities may plausibly represent greater opportunities for physical activity, social participation, and access to daily resources, shorter distances to health-care facilities, particularly emergency health centers, may also reflect concentration of clinical need, neighborhood vulnerability, or the strategic placement of services in higher-demand areas [25,26]. Therefore, the UQI should be interpreted as an exploratory indicator of spatial accessibility, whereas the resource-specific distance analyses may provide a more nuanced understanding of how urban environments relate to geriatric vulnerability.
The strong clustering of frailty and cognitive impairment observed in our cohort is consistent with a substantial body of evidence indicating that these conditions frequently co-occur and may reinforce one another over time. Systematic reviews and meta-analyses have demonstrated that frailty predicts incident cognitive disorders and dementia, while cognitive impairment increases the risk of transitioning to frailty, supporting a bidirectional relationship between these syndromes [27,28]. Recent longitudinal analyses using frailty indices further show graded associations between increasing frailty burden and poorer cognitive performance across multiple domains in community-dwelling older adults [29]. Our findings extend this literature by embedding frailty and cognitive status within a geospatial framework, illustrating how these geriatric syndromes are distributed within a specific urban context.
Polypharmacy was highly prevalent and strongly associated with frailty in our sample, consistent with international evidence. Systematic reviews report that polypharmacy and hyperpolypharmacy are consistently associated with frailty, higher mortality, and poorer functional outcomes in older adults [30,31]. A recent meta-analysis focusing on cardiometabolic multimorbidity also identified robust associations between polypharmacy and adverse health outcomes [32]. In parallel, a 2024 meta-analysis reported that polypharmacy was associated with 39% higher odds of cognitive impairment, with even greater risk observed for excessive polypharmacy [33]. Large population-based studies further demonstrate that the coexistence of frailty, polypharmacy, malnutrition, and multiple chronic conditions is common and associated with lower quality of life [34]. Within this context, the higher polypharmacy point estimate observed in the most disadvantaged urban stratum was not statistically significant after adjustment and should therefore be interpreted cautiously as hypothesis-generating. If confirmed in larger and longitudinal samples, such a pattern would be compatible with environmental deprivation acting as a distal determinant that may amplify medication burden among already vulnerable older adults, potentially through higher multimorbidity, fragmented care, and reduced capacity for deprescribing; however, our data do not support a robust independent association.
Evidence linking the neighborhood-built environment to cognitive outcomes in older adults has expanded rapidly. Systematic reviews and population-based studies indicate that walkable, amenity-rich, and greener neighborhoods are associated with better cognitive performance and lower dementia risk [35,36,37]. Conversely, neighborhood socioeconomic disadvantages, traffic-related exposures, and social deprivation have been associated with poorer cognitive outcomes [13,38]. Recent life-course research further suggests that cumulative neighborhood exposures may shape brain structure and cognitive reserve, with social deprivation associated with smaller gray matter volumes and markers of accelerated brain aging [38]. In this context, the relatively weak and inconsistent associations between our composite UQI and cognitive impairment may have several explanations. First, the index emphasizes access to specific services (health centers, pharmacies, senior centers, food shops, parks) and may not capture other relevant environmental domains such as walkability, safety, noise, air pollution, or social capital [14,38,39]. Second, Talca is a medium-sized city with relatively short average distances to essential services; consequently, spatial variability may be limited, reducing exposure contrast. Third, behavioral adaptations, such as family-driven relocation of frail or cognitively impaired older adults closer to health services, may attenuate or even reverse expected spatial gradients.
A systematic review on the built environment and cognitive function in older adults concluded that cognition has been associated with multiple neighborhood dimensions, including green spaces, walkability, destination availability, transportation, residential density, environmental quality, and environmental exposure [14]. This suggests that an index focused only on distance to selected resources may overlook important mechanisms such as physical activity, cognitive stimulation, social interaction, and reduced environmental stress.
Moreover, systematic literature reviews suggest that green spaces and urban nature may be associated with a lower risk of cognitive impairment and dementia in older adults [40], although the authors emphasize the need for standardized and longitudinal measurements of both built environment exposures and cognitive outcomes.
On the other hand, literature on daily mobility suggests that everyday mobility goes beyond linear distance between residence and services [41]. Rather, actual movement depends on physical capacity, transportation availability, social support, safety, and environmental barriers. This concern is central to contemporary environmental planning debates on proximity-based urban models, most visibly the “15-minute city,” in which everyday access to essential services underpins sustainable and age-friendly urban life [60]. Reviews of this literature emphasize that how proximity is measured strongly shapes conclusions, and that network-based accessibility models generally outperform simple straight-line metrics [60]. This is particularly consequential for older residents, whose service needs and walking capacity differ from those of the general population [61].
The relationship between the built environment and frailty has also been documented across multiple settings. Longitudinal data from the Japan Gerontological Evaluation Study (JAGES) demonstrated that living in neighborhoods with higher residential density and better access to destinations was associated with a lower incidence of frailty over time [42]. Other studies have reported that favorable built environments, higher perceived neighborhood quality, and better access to green spaces are associated with improved physical function and lower frailty risk [43,44], while life-course analyses suggest that prolonged exposure to deprived neighborhoods increases frailty risk in later life [45]. Our geospatial findings partly align and partly diverge from this literature. In previous analyses of the same Chilean cohort, frailty clustered in specific urban sectors, and higher spatial-accessibility scores were associated with more favorable frailty profiles and biological markers [15,16]. In contrast, when focusing specifically on cognitive impairment and polypharmacy and adjusting for individual-level factors, associations with UQI were null; only some resource-specific distance analyses showed significant differences. This pattern suggests that environmental influences may be more consistently detectable for frailty and intermediate biological markers than for cognitive impairment and medication use, which are influenced by additional clinical, behavioral, and health-system factors.
The resource-specific distance patterns provide further insight. Participants with cognitive impairment and cognitive frailty lived farther from main squares and parks, whereas physically frail and those with polypharmacy tended to live closer to primary and emergency health centers. Existing evidence indicates that access to green and public open spaces is associated with higher physical activity, greater social participation, and better cognitive outcomes in older adults [14,53,54,55], although, given the cross-sectional and exploratory nature of these comparisons, such proximity differences cannot be interpreted as causal in this setting [14,38,46,47]. In contrast, shorter distances to health centers among physically frail participants and those with polypharmacy may reflect both services allocation in higher-need areas and selective relocation toward care. Together, these patterns are consistent with a spatial distribution of geriatric syndromes shaped not only by the urban environment, but also by health-system organization and individual or family responses to vulnerability; therefore, directionality cannot be established.
This study has several strengths. It draws on a well-characterized cohort of community-dwelling older adults, with standardized assessment of frailty, cognitive status, nutritional risk, and polypharmacy. We used an objective, GIS-based characterization of the built environment, including Euclidean distance-based proximity metrics to multiple health and social resources and a composite UQI previously applied in the same cohort and region [15,16]. Moreover, the integration of frailty, cognitive impairment, polypharmacy, and geospatial exposures within a single analytic framework is relatively novel in Latin America and provides a more comprehensive understanding of how geriatric syndromes are embedded in urban contexts.
Several limitations should also be acknowledged. The cross-sectional design precludes causal inference and raises the possibility of reverse causality, whereby frailty, cognitive impairment, or polypharmacy may influence residential relocation or service placement rather than result from environmental exposure. The sample was drawn from a single medium-sized Chilean city, limiting generalizability to larger metropolitan areas, rural settings, or countries with different urban forms and health systems. Another limitation is that the UQI used equal weighting for all facilities and assumed that closer proximity generally represented better accessibility. Although this approach was transparent and consistent with previous applications in the same study area, it may oversimplify the heterogeneous role of different urban resources. In particular, proximity to health-care facilities may reflect higher health needs, service allocation in vulnerable areas, or family-driven relocation closer to care rather than an unequivocal environmental advantage. Moreover, the UQI may not capture micro-scale or subjective environmental features, such as sidewalk quality, perceived safety, social cohesion, noise, or air pollution, which are increasingly recognized as relevant to healthy aging and cognition. Cognitive impairment was assessed using a screening instrument rather than a comprehensive neuropsychological battery, and we could not differentiate mild cognitive impairment from dementia subtypes. More fundamentally, this is a limitation of construct validity: because the composite index aggregates heterogeneous resources with equal weights, and because some components (e.g., green and public spaces) are expected to be beneficial whereas others (e.g., emergency health centers) are better understood as markers of clinical need, summing them into a single “higher-is-better” score may obscure or cancel opposing signals. To probe this, we repeated the analysis using a sub-index restricted to conceptually beneficial resources; neither this coherent beneficial sub-index nor a complementary need-marker sub-index was significantly associated with any outcome (Table S1), suggesting that the null primary findings are not explained solely by combining resources with opposing expected directions. However, these exploratory sub-indices were not independently validated and retained equal weighting within each conceptual domain; therefore, they do not resolve the underlying construct-validity limitations of the original composite index. Nonetheless, the composite index should be interpreted with caution, and the resource-specific analyses are conceptually more informative than the aggregate score. Several non-environmental explanations could also account for the spatial patterns observed. Living closer to health centers may reflect relocation of older adults after functional or cognitive decline, selective sampling because participants were recruited through primary care registries (which may over-represent individuals living near health facilities), or the deliberate placement of services in higher-need neighborhoods, rather than any causal effect of the environment on health. These alternatives cannot be distinguished in a cross-sectional design. A further central limitation concerns the geospatial exposure itself. Proximity to each resource was measured as the straight-line (Euclidean) distance from the participant’s geocoded residence to the nearest facility. Euclidean distance is a relatively crude proxy for real-world accessibility and does not capture the route an older adult would actually travel. In particular, it ignores street-network configuration and connectivity, physical barriers, terrain and slope, pedestrian-crossing safety, the availability and quality of public transport, and broader walkability, factors that are especially consequential for older adults with reduced mobility and that may differ substantially from straight-line proximity. Network distance or travel time would provide more meaningful measures of accessibility, but these were not available for the present study and could not be computed from the existing data. Consequently, the UQI should be interpreted as an approximate, distance-based indicator of spatial accessibility rather than a measure of experienced accessibility, and this measurement limitation may have attenuated or obscured genuine environment-health associations. Future studies should incorporate network-based distances, travel-time estimates, and objective walkability metrics. Polypharmacy was defined solely by medication count, without assessment of prescribing appropriateness or drug–drug interactions. Residual confounding by socioeconomic factors, life-course exposures, and unmeasured health behaviors is likely. Finally, geospatial measures were based on residential addresses and did not account for activity spaces or life-space mobility; future studies incorporating Global Positioning System (GPS) based tracking or standardized instruments such as the Environmental Assessment of Seniors for Active Living (EASE) could better capture these dynamics [48]. Comparative geospatial analyses that place Euclidean, network, and travel-time metrics side by side confirm that straight-line distance can misclassify neighborhoods relative to network-based measures, supporting the interpretation of our index as a first approximation rather than a measure of experienced accessibility [62]. This limitation is a specific instance of the uncertain geographic context problem, whereby residence-based, statically bounded exposure measures may not represent the environmental contexts that individuals actually experience [70]. Environmental-exposure research increasingly shows that estimated exposure depends strongly on the spatial scale and buffer chosen [71], and that micro-scale features of the pedestrian environment—such as sidewalk condition and physical barriers—can modify effective access for older adults well beyond what straight-line distance conveys [72]. A further, theoretically grounded reason for weak associations is the neighborhood effect averaging problem: because mobile individuals accumulate exposures across many settings, residence-based estimates tend to regress toward the study-area mean, attenuating true environment–health associations [73]. Analyses using network-based and equity-oriented accessibility measures likewise show that where and how access is quantified materially changes conclusions [74]. In addition, the analysis involved numerous comparisons across quartiles, frailty subtypes, cognitive and polypharmacy status, and seven separate distance measures. Because these exploratory comparisons were not corrected for multiple testing, the borderline P values observed for some resource-specific distances may reflect type I error, and these associations require confirmation in independent samples. Finally, because the present study did not implement a formal SDSS, scenario simulation, participatory GIS interface, or multicriteria decision model, its contribution should be interpreted as environmental exposure assessment and spatial evidence generation rather than as a complete decision-support tool.
Despite these limitations, the findings have important implications for environmental assessment, age-friendly planning, health-service organization, and future research. From a planning perspective, the results suggest that residence-based Euclidean proximity can provide a transparent first screening layer for identifying spatial patterns in access to age-relevant resources, but it should not be used as a stand-alone basis for prioritizing interventions. The strong clustering of frailty, cognitive impairment, and polypharmacy also highlights the need for coordination between urban planning and primary care, particularly in areas where clinical vulnerability and service dependence overlap [49,50]. In such contexts, spatial evidence can help guide where integrated geriatric assessment, medication review, and environmental improvements may need to be coordinated—supported, for example, by multidisciplinary deprescribing programs and computerized decision-support tools [50,51,52]—while avoiding causal interpretations that the present cross-sectional design cannot support.
Future research should prioritize longitudinal and quasi-experimental designs to clarify temporal relationships between environmental exposures, frailty trajectories, cognitive decline, and polypharmacy. Integrating repeated geriatric assessments with high-resolution geospatial data and life-space mobility measures would improve understanding of how, when, and under what conditions older adults interact with their environments [56]. Recent work combining wearable sensors, GPS tracking, and detailed built environment metrics among older adults with and without cognitive impairment illustrates the potential of these approaches [57]. Multicity studies across diverse Latin American settings, as well as natural experiments involving new parks, pedestrianization initiatives, or reconfiguration of health facilities, are needed to determine whether modifications to the built environment can improve frailty and cognitive outcomes or reduce inappropriate polypharmacy [31,58,59]. By integrating geriatric assessment with geospatial analysis, this study contributes to a growing paradigm that conceptualizes frailty, cognitive impairment, and polypharmacy as conditions embedded within the urban fabric, a perspective that may inform future work on age-friendly cities and primary care for aging populations [53]. Because the present associations are cross-sectional, exploratory, and largely null after adjustment, they do not by themselves justify specific urban-design recommendations. Nevertheless, they generate hypotheses that future studies could test. In particular, the observation that cognitively vulnerable groups tended to live farther from parks and main squares, whereas frail and polypharmacy groups lived closer to health services, is consistent with a pattern in which service provision aligns with clinical need while potentially restorative green and public spaces remain less accessible. Whether improving access to such spaces would actually reduce cognitive or functional vulnerability, as proposed by the WHO age-friendly cities framework and suggested by prior scoping reviews [46,47,53,54,55], can only be established through longitudinal and quasi-experimental designs, and should not be inferred from the present data. In addition, rather than relying on a single composite index that combines heterogeneous resources, future work should build on these exploratory sensitivity analyses by developing and independently validating conceptually coherent sub-indices. In particular, combining main squares, parks, and exercise facilities into a dedicated “social-exercise” index (capturing opportunities for physical activity and social participation) may bear a stronger and more interpretable relationship to physical and cognitive status than the broader accessibility index, and constructing and validating such a measure is a priority for subsequent studies. Beyond equal weighting, future indices could assign component weights informed by empirical evidence on the relative importance of each resource type for older adults’ health, ideally derived and locally validated within the target population rather than transposed from other settings, so that the resulting measure has stronger construct validity.
5. Conclusions
In this cross-sectional study of community-dwelling older adults in Talca, Chile, cognitive impairment, frailty, and polypharmacy were highly prevalent and frequently co-occurred. Treating GIS-derived spatial accessibility to urban resources as an environmental exposure, we found that the composite index had limited capacity to discriminate these outcomes after adjustment for individual-level factors, whereas resource-specific distance patterns were exploratory and require confirmation. From an environmental-assessment and decision-support perspective, these findings indicate that straight-line proximity to individual facilities is an insufficient exposure metric for healthy aging, particularly in compact mid-sized cities where basic services are already broadly proximate. Environmental exposure assessment for age-friendly planning should therefore incorporate network-based travel, walkability, physical barriers, and the quality, safety, usability, and equity of public and green spaces, and embed such indicators within formal spatial decision-support frameworks. These cross-sectional associations do not demonstrate that environmental accessibility influences frailty, cognition, or polypharmacy and should be interpreted as preliminary spatial evidence rather than environmental effects.
Supplementary Materials
The following supporting information can be downloaded at the journal website. Table S1: Sensitivity analyses decomposing the composite Urban Quality Index into a beneficial-resource sub-index and a need-marker sub-index, and comorbidity-adjusted, continuous, and quartile-based models, each modelled against cognitive impairment, polypharmacy, and frailty (adjusted logistic regression models, n=317).
Author Contributions
Conceptualization, DA, YO, JCC; data curation, formal analysis, DA and YO; funding acquisition, CM, IP, EF; investigation, DA, YO, JCC, VV; methodology, DA, NM, YO, JCC; project administration, CM, IP, EF; resources, CM, IP; software, YO; supervision, CM, IP; validation, CM, IP; writing—original draft and writing—review and editing, DA, YO. All authors have read and agreed to the published version of the manuscript.
Funding
This research was funded by ANID/FONDECYT grant N°3230783, the Interuniversity Center for Healthy Aging (Code RED211993), and ANID/FONDECYT grant N°1211136.
Institutional Review Board Statement
The study was conducted in accordance with the Declaration of Helsinki and approved by the Scientific Ethics Committee of the Universidad de Talca, Chile (approval code: 2016-019-IP).
Informed Consent Statement
Informed consent was obtained from all subjects involved in the study.
Data Availability Statement
The data presented in this study are available on reasonable request from the corresponding author. The data are not publicly available due to privacy restrictions related to geolocated participant information.
Acknowledgments
The authors thank the participants of the PIEI-ES cohort and the collaborating institutions.
Conflicts of Interest
The authors declare no conflicts of interest.
Abbreviations
| The following abbreviations are used in this manuscript | ANOVA, analysis of variance; aOR, adjusted odds ratio; BMI, body mass index; CASEN, National Socioeconomic Characterization Survey; CI, confidence interval; GIS, Geographic Information System; GPS, Global Positioning System; JAGES, Japan Gerontological Evaluation Study; MMSE, Mini-Mental State Examination; MNA-SF, Mini Nutritional Assessment–Short Form; OSM, OpenStreetMap; PIEI-ES, Excellence Research Program on Healthy Aging; UQI, Urban Quality Index; WHO, World Health Organization. |
References
- Zhou, Y.; Ma, L. Intrinsic Capacity in Older Adults: Recent Advances. Aging Dis. 2022, 13(2), 353–9. [Google Scholar] [CrossRef] [PubMed]
- Blass, B.; Ford, C.B.; Soneji, S.; Zepel, L.; Rosa, T.D.A.; Kaufman, B.G.; et al. Incidence and prevalence of dementia among US Medicare beneficiaries, 2015-21: population based study. BMJ 2025, 389, e083034. [Google Scholar] [CrossRef] [PubMed]
- Livingston, G.; Huntley, J.; Sommerlad, A.; Ames, D.; Ballard, C.; Banerjee, S.; et al. Dementia prevention, intervention, and care: 2020 report of the Lancet Commission. Lancet 2020, 396(10248), 413–46. [Google Scholar] [CrossRef] [PubMed]
- Li, J.; Xia, D.; Cui, M.; Wang, Y.; Li, J.; Jin, L.; et al. Disease trajectories before dementia: evidence from a large-scale community-based prospective study. Br. J. Psychiatry 2024, 225(6), 538–46. [Google Scholar] [CrossRef] [PubMed]
- Kivipelto, M.; Mangialasche, F.; Snyder, H.M.; Allegri, R.; Andrieu, S.; Arai, H.; et al. World-Wide FINGERS Network: A global approach to risk reduction and prevention of dementia. Alzheimers Dement 2020, 16(7), 1078–94. [Google Scholar] [CrossRef] [PubMed]
- Fried, L.P.; Tangen, C.M.; Walston, J.; Newman, A.B.; Hirsch, C.; Gottdiener, J.; et al. Frailty in older adults: evidence for a phenotype. J. Gerontol. A Biol. Sci. Med. Sci. 2001, 56(3), M146–56. [Google Scholar] [CrossRef] [PubMed]
- Dent, E.; Morley, J.E.; Cruz-Jentoft, A.J.; Woodhouse, L.; Rodríguez-Mañas, L.; Fried, L.P.; et al. Physical Frailty: ICFSR International Clinical Practice Guidelines for Identification and Management. J. Nutr. Health Aging 2019, 23(9), 771–87. [Google Scholar] [CrossRef] [PubMed]
- Clegg, A.; Young, J.; Iliffe, S.; Rikkert, M.O.; Rockwood, K. Frailty in elderly people. Lancet 2013, 381(9868), 752–62. [Google Scholar] [CrossRef] [PubMed]
- Soysal, P.; Stubbs, B.; Lucato, P.; Luchini, C.; Solmi, M.; Peluso, R.; et al. Inflammation and frailty in the elderly: A systematic review and meta-analysis. Ageing Res. Rev. 2016, 31, 1–8. [Google Scholar] [CrossRef] [PubMed]
- Vatic, M.; von Haehling, S.; Ebner, N. Inflammatory biomarkers of frailty. Exp. Gerontol. 2020, 133, 110858. [Google Scholar] [CrossRef] [PubMed]
- Robertson, D.A.; Savva, G.M.; Kenny, R.A. Frailty and cognitive impairment--a review of the evidence and causal mechanisms. Ageing Res. Rev. 2013, 12(4), 840–51. [Google Scholar] [CrossRef] [PubMed]
- Gutiérrez-Valencia, M.; Izquierdo, M.; Cesari, M.; Casas-Herrero, Á.; Inzitari, M.; Martínez-Velilla, N. The relationship between frailty and polypharmacy in older people: A systematic review. Br. J. Clin. Pharmacol. 2018, 84(7), 1432–44. [Google Scholar] [CrossRef] [PubMed]
- Vassilaki, M.; Aakre, J.A.; Castillo, A.; Chamberlain, A.M.; Wilson, P.M.; Kremers, W.K.; et al. Association of neighborhood socioeconomic disadvantage and cognitive impairment. Alzheimers Dement 2023, 19(3), 761–70. [Google Scholar] [CrossRef] [PubMed]
- Song, Y.; Liu, Y.; Bai, X.; Yu, H. Effects of neighborhood built environment on cognitive function in older adults: a systematic review. BMC Geriatr. 2024, 24(1), 194. [Google Scholar] [CrossRef] [PubMed]
- Mena, C.; Ormazábal, Y.; Molina, N.; Fuentes, E.; Cantillana, J.C.; Villalobos, V.; et al. Urban Quality and Biochemical, Hematological, and Nutritional Markers in Older Adults: Cross-Sectional Geospatial Study. JMIR Aging 2025, 8, e74313. [Google Scholar] [CrossRef] [PubMed]
- Ormazábal, Y.; Arauna, D.; Cantillana, J.C.; Palomo, I.; Fuentes, E.; Mena, C. Unveiling the Frailty Spatial Patterns Among Chilean Older Persons by Exploring Sociodemographic and Urbanistic Influences Based on Geographic Information Systems: Cross-Sectional Study. JMIR Aging 2025, 8, e64254. [Google Scholar] [CrossRef] [PubMed]
- Palomo, I.; Giacaman, R.A.; León, S.; Lobos, G.; Bustamante, M.; Wehinger, S.; et al. Analysis of the characteristics and components for the frailty syndrome in older adults from central Chile. The PIEI-ES study. Arch. Gerontol. Geriatr. 2019, 80, 70–5. [Google Scholar] [CrossRef] [PubMed]
- Guralnik, J.M.; Simonsick, E.M.; Ferrucci, L.; Glynn, R.J.; Berkman, L.F.; Blazer, D.G.; Scherr, P.A.; Wallace, R.B. A short physical performance battery assessing lower extremity function: association with self-reported disability and prediction of mortality and nursing home admission. J. Gerontol. 1994, 49(2), M85–94. [Google Scholar] [CrossRef] [PubMed]
- Albala, C.; Lera, L.; Sanchez, H.; Angel, B.; Márquez, C.; Arroyo, P.; et al. Frequency of frailty and its association with cognitive status and survival in older Chileans. Clin. Interv. Aging 2017, 12, 995–1001. [Google Scholar] [CrossRef] [PubMed]
- Folstein, M.F.; Folstein, S.E.; McHugh, P.R. Mini-mental state". A practical method for grading the cognitive state of patients for the clinician. J. Psychiatr. Res. 1975, 12(3), 189–98. [Google Scholar] [CrossRef] [PubMed]
- Albala, C.; Icaza, G.; Vio, F.; García, C.; Marín, P.P.; Quiroga, P. A short test to evaluate cognitive impairment based on Folstein’s MMSE. Gerontology 2001, 47(S1), S183. [Google Scholar]
- MINSAL. Manual de Aplicación del Examen de Medicina Preventiva del Adulto Mayor. 2010; p. 16. [Google Scholar]
- Noh, B.; Youm, C.; Lee, M.; Park, H. Associating Gait Phase and Physical Fitness with Global Cognitive Function in the Aged. Int. J. Environ. Res. Public Health 2020, 17(13). [Google Scholar] [CrossRef] [PubMed]
- Muñoz Silva, C.A.; Rojas Orellana, P.A.; Marzuca-Nassr, G.N. Criterios de valoración geriátrica integral en adultos mayores con dependencia moderada y severa en Centros de Atención Primaria en Chile. Rev. Médica De Chile 2015, 143, 612–8. [Google Scholar] [CrossRef] [PubMed]
- McCormack, G.R.; Cabaj, J.; Orpana, H.; Lukic, R.; Blackstaffe, A.; Goopy, S.; et al. A scoping review on the relations between urban form and health: a focus on Canadian quantitative evidence. Health Promot Chronic Dis. Prev. Can. 2019, 39(5), 187–200. [Google Scholar] [CrossRef] [PubMed]
- Skovrup, N.F.; Freudendal-Pedersen, M. Geographical Proximity and Community Health Centres: A Sustainable Solution for Denmark. Int. J. Environ. Res. Public Health 2026, 23(2), 173. [Google Scholar] [CrossRef] [PubMed]
- Borges, M.K.; Canevelli, M.; Cesari, M.; Aprahamian, I. Frailty as a Predictor of Cognitive Disorders: A Systematic Review and Meta-Analysis. Front Med. 2019, 6, 26. [Google Scholar] [CrossRef] [PubMed]
- Zhou, J.; Li, Y.; Zhu, L.; Yue, R. Association between frailty index and cognitive dysfunction in older adults: insights from the 2011–2014 NHANES data. In Frontiers in Aging Neuroscience; 2024; pp. 16–2024. [Google Scholar]
- Han, S.; Gao, T.; Mo, G.; Liu, H.; Zhang, M. Bidirectional relationship between frailty and cognitive function among Chinese older adults. Arch. Gerontol. Geriatr. 2023 2023/11/01/, 114, 105086. [Google Scholar] [CrossRef] [PubMed]
- Palmer, K.; Villani, E.R.; Vetrano, D.L.; Cherubini, A.; Cruz-Jentoft, A.J.; Curtin, D.; et al. Association of polypharmacy and hyperpolypharmacy with frailty states: a systematic review and meta-analysis. Eur. Geriatr. Med. 2019, 10(1), 9–36. [Google Scholar] [CrossRef] [PubMed]
- Arauna, D.; Cerda, A.; García-García, J.F.; Wehinger, S.; Castro, F.; Méndez, D.; et al. Polypharmacy Is Associated with Frailty, Nutritional Risk and Chronic Disease in Chilean Older Adults: Remarks from PIEI-ES Study. Clin. Interv. Aging 2020, 15, 1013–22. [Google Scholar] [CrossRef] [PubMed]
- Cheung, J.T.K.; Yu, R.; Woo, J. Is polypharmacy beneficial or detrimental for older adults with cardiometabolic multimorbidity? Pooled analysis of studies from Hong Kong and Europe. Fam. Pract. 2020, 37(6), 793–800. [Google Scholar] [CrossRef] [PubMed]
- Yu, X.; Qian, Y.; Zhang, Y.; Chen, Y.; Wang, M. Association between polypharmacy and cognitive impairment in older adults: A systematic review and meta-analysis. Geriatr. Nurs. 2024, 59, 330–7. [Google Scholar] [CrossRef] [PubMed]
- Liu, Y.; Huang, L.; Hu, F.; Zhang, X. Investigating Frailty, Polypharmacy, Malnutrition, Chronic Conditions, and Quality of Life in Older Adults: Large Population-Based Study. JMIR Public Health Surveill. 2024, 10, e50617. [Google Scholar] [CrossRef] [PubMed]
- Sylvers, D.L.; Hicken, M.; Esposito, M.; Manly, J.; Judd, S.; Clarke, P. Walkable Neighborhoods and Cognition: Implications for the Design of Health Promoting Communities. J. Aging Health 2022, 34(6-8), 893–904. [Google Scholar] [CrossRef] [PubMed]
- Timmermans, E.J.; Leeuwis, A.E.; Bots, M.L.; van Alphen, J.L.; Biessels, G.J.; Brunner-La Rocca, H.-P.; et al. Neighbourhood walkability in relation to cognitive functioning in patients with disorders along the heart-brain axis. Health Place 2023 2023/01/01/, 79, 102956. [Google Scholar] [CrossRef] [PubMed]
- Rosso, A.L.; Shaaban, C.E.; Cheng, G.; Buchanich, J.M.; Butters, M.A.; Cohen, A.; et al. Associations of Neighborhood Walkability with Cognitive Impairment Depend on Geographic Context. Alzheimer's Dement. 2024 2024/12/01, 20(S7), e089103. [Google Scholar] [CrossRef]
- Chen, Y.; Xu, L.; Cui, X.; Yang, H.; Liu, Y.; Gao, X.; et al. A systematic review on the associations between built environment and mental health among older people. Front. Public Health 2025, 13–2025. [Google Scholar] [CrossRef] [PubMed]
- Baranyi, G.; Buchanan, C.R.; Conole, E.L.S.; Backhouse, E.V.; Maniega, S.M.; Valdés Hernández, MdC; et al. Life-course neighbourhood deprivation and brain structure in older adults: the Lothian Birth Cohort 1936. Mol. Psychiatry 2024 2024/11/01, 29(11), 3483–94. [Google Scholar] [CrossRef] [PubMed]
- Chen, X.; Lee, C.; Huang, H. Neighborhood built environment associated with cognition and dementia risk among older adults: A systematic literature review. Soc. Sci. Med. 2022, 292, 114560. [Google Scholar] [CrossRef] [PubMed]
- Rosso, A.L.; Auchincloss, A.H.; Michael, Y.L. The urban built environment and mobility in older adults: a comprehensive review. J. Aging Res. 2011, 2011, 816106. [Google Scholar] [CrossRef] [PubMed]
- Mori, Y.; Tsuji, T.; Watanabe, R.; Hanazato, M.; Miyazawa, T.; Kondo, K. Built environments and frailty in older adults: A three-year longitudinal JAGES study. Arch. Gerontol. Geriatr. 2022, 103, 104773. [Google Scholar] [CrossRef] [PubMed]
- Koohsari, M.J.; McCormack, G.R.; Nakaya, T.; Shibata, A.; Ishii, K.; Yasunaga, A.; et al. Walking-friendly built environments and objectively measured physical function in older adults. J. Sport Health Sci. 2020, 9(6), 651–6. [Google Scholar] [CrossRef] [PubMed]
- Ferreira, L.D.S.; da Silva, T.E.M.; Batista Dos Santos, E.; Fank, F.; Neto, J.A.B.; Menezes, E.C. The influence of the built environment and perceived neighborhood on physical frailty and sarcopenia in older adults: A systematic review. Arch. Gerontol. Geriatr. 2025, 137, 105910. [Google Scholar] [CrossRef] [PubMed]
- Baranyi, G.; Welstead, M.; Corley, J.; Deary, I.J.; Muniz-Terrera, G.; Redmond, P.; et al. Association of Life-Course Neighborhood Deprivation With Frailty and Frailty Progression From Ages 70 to 82 Years in the Lothian Birth Cohort 1936. Am. J. Epidemiol. 2022, 191(11), 1856–66. [Google Scholar] [CrossRef] [PubMed]
- Wang, Q.; Song, J.; Liu, Z.; Shi, C. Green space and older adults’ health: a scoping review. Innov. Aging 2025, 9(12), igaf119. [Google Scholar] [CrossRef] [PubMed]
- Fowler Davis, S.; Benkowitz, C.; Nield, L.; Dayson, C. Green spaces and the impact on cognitive frailty: a scoping review. Front Public Health 2023, 11, 1278542. [Google Scholar] [CrossRef] [PubMed]
- Ng, Y.S.; Zhao, F.; Ho, L.Y.-C.; Tay, L.; Shum, E.; Latib, A.; et al. Elderly Activity Life-Space Envelopes (EASE): Development and Feasibility of a Comprehensive, Integrated Protocol for Life-Space Mobility Research in Population Health. JMIR Res. Protoc. 2025 2025/12/19, 14, e79308. [Google Scholar] [CrossRef] [PubMed]
- Nwadiugwu, M.C. Frailty and the Risk of Polypharmacy in the Older Person: Enabling and Preventative Approaches. J. Aging Res. 2020, 2020, 6759521. [Google Scholar] [CrossRef] [PubMed]
- Thompson, W.; McDonald, E.G. Polypharmacy and Deprescribing in Older Adults. Annu Rev. Med. 2024, 75, 113–27. [Google Scholar] [CrossRef] [PubMed]
- Monteiro, L.; Maricoto, T.; Solha, I.; Ribeiro-Vaz, I.; Martins, C.; Monteiro-Soares, M. Reducing Potentially Inappropriate Prescriptions for Older Patients Using Computerized Decision Support Tools: Systematic Review. J. Med. Internet Res. 2019, 21(11), e15385. [Google Scholar] [CrossRef] [PubMed]
- Radcliffe, E.; Saucedo, A.R.; Howard, C.; Sheikh, C.; Bradbury, K.; Rutter, P.; et al. Development of a complex multidisciplinary medication review and deprescribing intervention in primary care for older people living with frailty and polypharmacy. PLoS ONE 2025, 20(4), e0319615. [Google Scholar] [CrossRef] [PubMed]
- World Health O. Global age-friendly cities: A guide: World Health Organization; 2007; ISBN 9241547308. [Google Scholar]
- Beard, J.R.; Officer, A.; de Carvalho, I.A.; Sadana, R.; Pot, A.M.; Michel, J.P.; et al. The World report on ageing and health: a policy framework for healthy ageing. Lancet 2016, 387(10033), 2145–54. [Google Scholar] [CrossRef] [PubMed]
- Liu, S.; Ho, H.C.; Wilson, J.P. Effects of urban green space on human cognition: A systematic search and scoping review. Urban Clim. 2025 2025/03/01/, 60, 102372. [Google Scholar] [CrossRef]
- Johnson, J.; Rodriguez, M.A.; Al Snih, S. Life-Space Mobility in the Elderly: Current Perspectives. Clin. Interv. Aging 2020, 15, 1665–74. [Google Scholar] [CrossRef] [PubMed]
- Liu, Y.; Wong, C.H.; Shoval, N.; Ho, M.R.; Theng, Y.L. Urban Environment and Outdoor Walking Mobility Among Older Adults With and Without Cognitive Impairment in Singapore: Formative Study. JMIR Form. Res. 2025, 9, e76777. [Google Scholar] [CrossRef] [PubMed]
- Baeza, F.; Vives Vergara, A.; González, F.; Orlando, L.; Valdebenito, R.; Cortinez-O’Ryan, A.; et al. The Regeneración Urbana, Calidad de Vida y Salud - RUCAS project: a Chilean multi-methods study to evaluate the impact of urban regeneration on resident health and wellbeing. BMC Public Health 2021 2021/04/15, 21(1), 728. [Google Scholar] [CrossRef] [PubMed]
- Rojas-Rueda, D.; Vaught, E.; Buss, D. Why a New Research Agenda on Green Spaces and Health Is Needed in Latin America: Results of a Systematic Review. Int. J. Environ. Res. Public Health 2021, 18(11). [Google Scholar] [CrossRef] [PubMed]
- Omwamba, J.; Rotaris, L.; Longo, G. An assessment of proximity in the 15-minute city: A systematic literature review. Urban Transit. 2025, 3, 100012. [Google Scholar] [CrossRef]
- Deng, Z.; Lee, J.; Gim, T.H.T. 15-minute city for all? Rethinking the 15-minute city for urban older populations. J. Transp. Geogr. 2025, 128, 104302. [Google Scholar] [CrossRef]
- Shakeri, S.; Motieyan, H.; Azmoodeh, M. Comparative analysis of 15-minute neighborhoods through different cumulative-based accessibility measures. GeoJournal 2024, 89, 222. [Google Scholar] [CrossRef]
- Yu, J.; Zhang, L.; Shi, Q. Impact of Green Space on Older Adults’ Quality of Life Based on Spatial and Non-Spatial Analyses. Land. 2024, 13(11), 1874. [Google Scholar] [CrossRef]
- Xu, Y.; Wu, W.; Shen, Z.; Zhu, J.; Chen, H. Urban Park Accessibility for the Elderly and Its Influencing Factors from the Perspective of Equity. Land. 2026, 15(1), 141. [Google Scholar] [CrossRef]
- Yang, J.; Li, P.; Li, J.; Chen, J. Is More Green Space Always Better for Healthy Aging? Exploring Spatial Threshold and Mediation Effects in the United States. Land. 2026, 15(2), 207. [Google Scholar] [CrossRef]
- Arriazu-Ramos, A.; Santamaría, J.M.; Monge-Barrio, A.; Bes-Rastrollo, M.; Gutierrez Gabriel, S.; Benito Frias, N.; Sánchez-Ostiz, A. Health Impacts of Urban Environmental Parameters: A Review of Air Pollution, Heat, Noise, Green Spaces and Mobility. Sustainability 2025, 17(10), 4336. [Google Scholar] [CrossRef]
- Malczewski, J. GIS-based multicriteria decision analysis: a survey of the literature. Int. J. Geogr. Inf. Sci. 2006, 20(7), 703–726. [Google Scholar] [CrossRef]
- Geurs, K.T.; van Wee, B. Accessibility evaluation of land-use and transport strategies: review and research directions. J. Transp. Geogr. 2004, 12(2), 127–140. [Google Scholar] [CrossRef]
- Krügel, F.; Mäs, S.; Hindorf, P.; Buthmann, E. An Online Multicriteria–Spatial Decision Support System for Public Services Planning. Appl. Sci. 2024, 14(4), 1526. [Google Scholar] [CrossRef]
- Kwan, M.P. The uncertain geographic context problem. Ann. Assoc. Am. Geogr. 2012, 102(5), 958–968. [Google Scholar] [CrossRef]
- Zheng, P.; Zhang, X.; Pan, W. Multi-Scale Analysis of Urban Greenspace Exposure and Equality: Insights from a Population-Enhanced Vegetation Index (EVI)-Weighted Model in the West Side Straits Urban Agglomeration. Land. 2025, 14(1), 132. [Google Scholar] [CrossRef]
- Stasinos, N.; Kalogeropoulos, K.; Tsatsaris, A.; Mantzorou, M. Uneven Paths to Health: A Spatial Analysis of Sidewalk Conditions and Healthcare Access for Older Adults. ISPRS Int. J. Geo-Inf. 2026, 15(3), 137. [Google Scholar] [CrossRef]
- Kwan, M.P. The neighborhood effect averaging problem (NEAP): an elusive confounder of the neighborhood effect. Int. J. Environ. Res. Public Health 2018, 15(9), 1841. [Google Scholar] [CrossRef] [PubMed]
- Cimini, A.; De Fioravante, P.; Marinosci, I.; Congedo, L.; Cipriano, P.; Dazzi, L.; Marchetti, M.; Scarascia Mugnozza, G.; Munafò, M. Green Urban Public Spaces Accessibility: A Spatial Analysis for the Urban Area of the 14 Italian Metropolitan Cities Based on SDG Methodology. Land. 2024, 13(12), 2174. [Google Scholar] [CrossRef]
Figure 1.
Flow diagram of participant selection for the geospatial analysis.
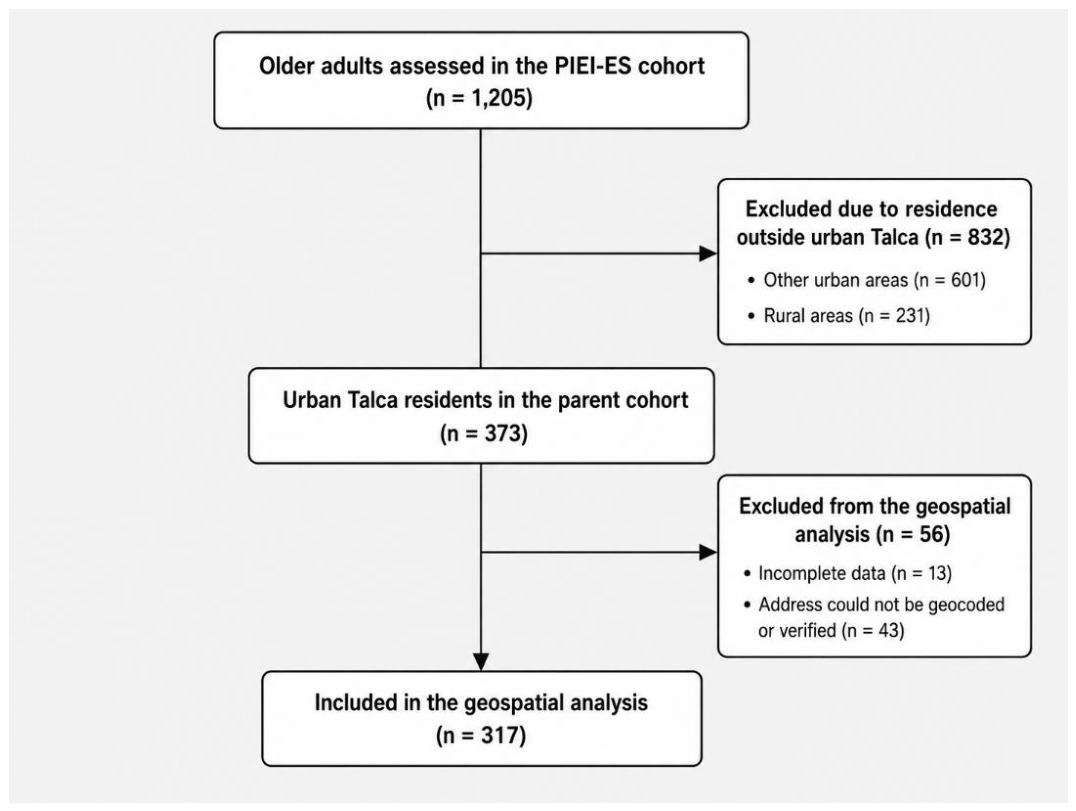
Figure 2.
Spatial distribution of older adults included in the study within the city of Talca and the available urban physical facilities.
Figure 2.
Spatial distribution of older adults included in the study within the city of Talca and the available urban physical facilities.
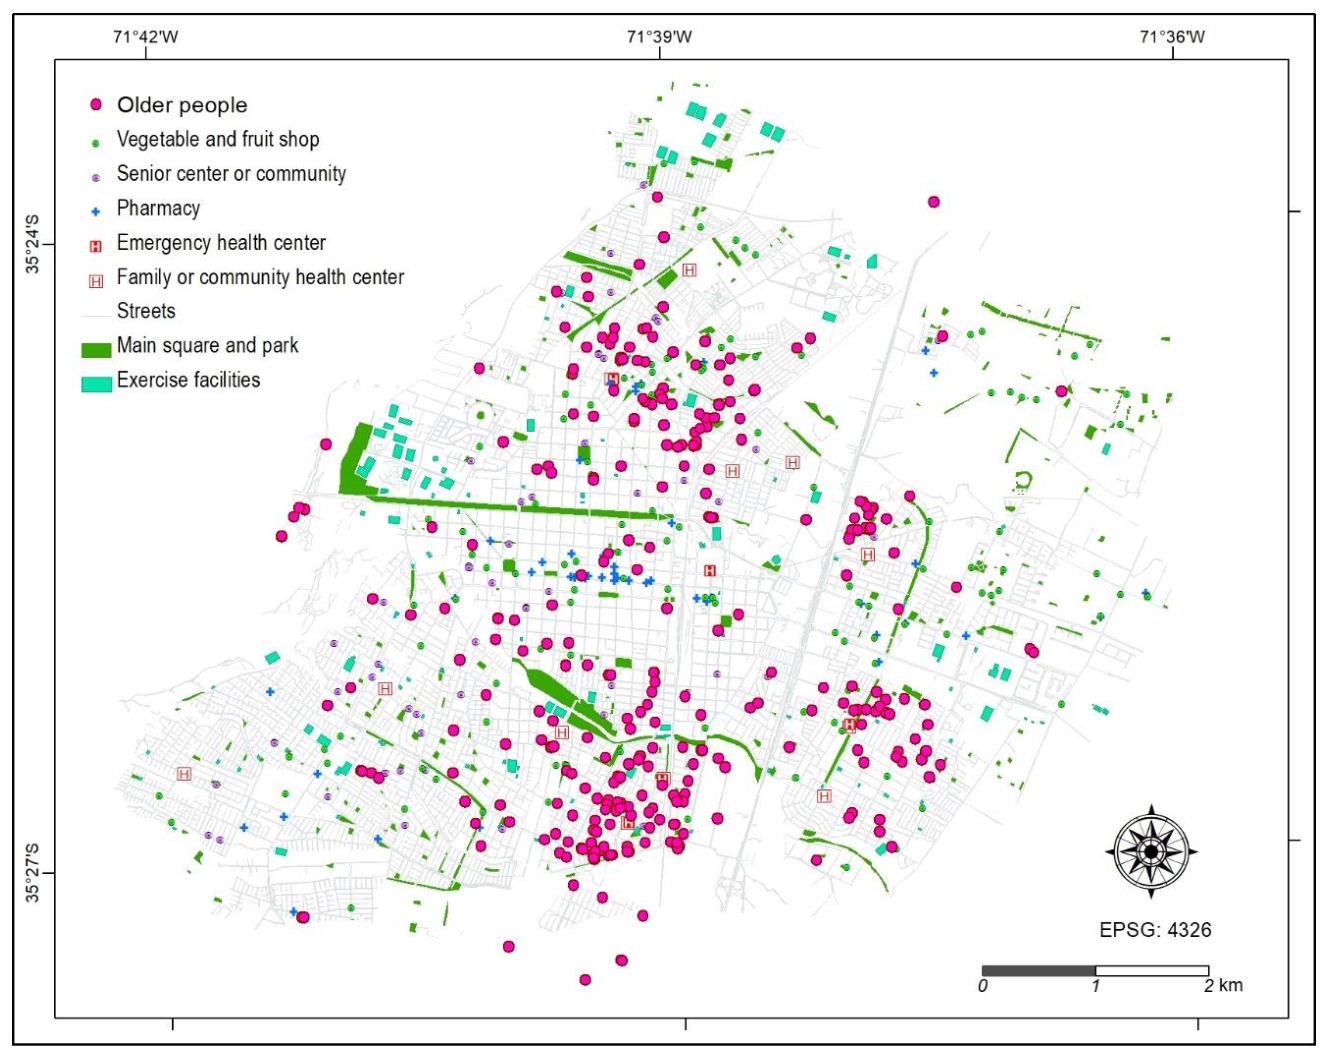
Figure 3.
Comparison of mean distances to relevant urban facilities according to cognitive status: (A) fruit and vegetable shops, (B) senior centers or communities, (C) pharmacies, (D) emergency health centers, (E) family or community health centers, (F) main squares and parks, (G) exercise facilities. Data are presented as mean with 95% CI. Statistical analysis was performed using the t test or Mann-Whitney U test, as appropriate. *P<.05.
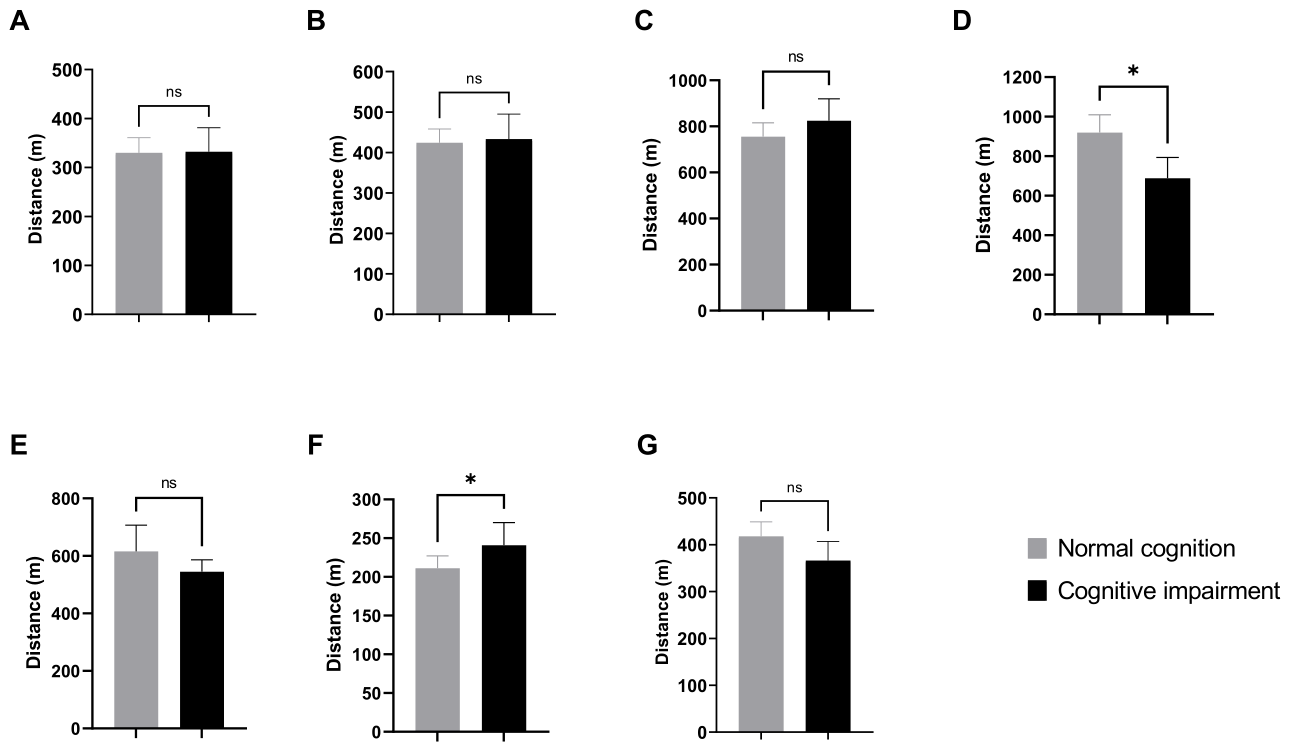
Figure 4.
Comparison of mean distances to relevant urban facilities according to polypharmacy status: (A) fruit and vegetable shops, (B) senior centers or communities, (C) pharmacies, (D) emergency health centers, (E) family or community health centers, (F) main squares and parks, (G) exercise facilities. Data are presented as mean with 95% CI. Statistical analysis was performed using the t test or Mann-Whitney U test, as appropriate. *P<.05.
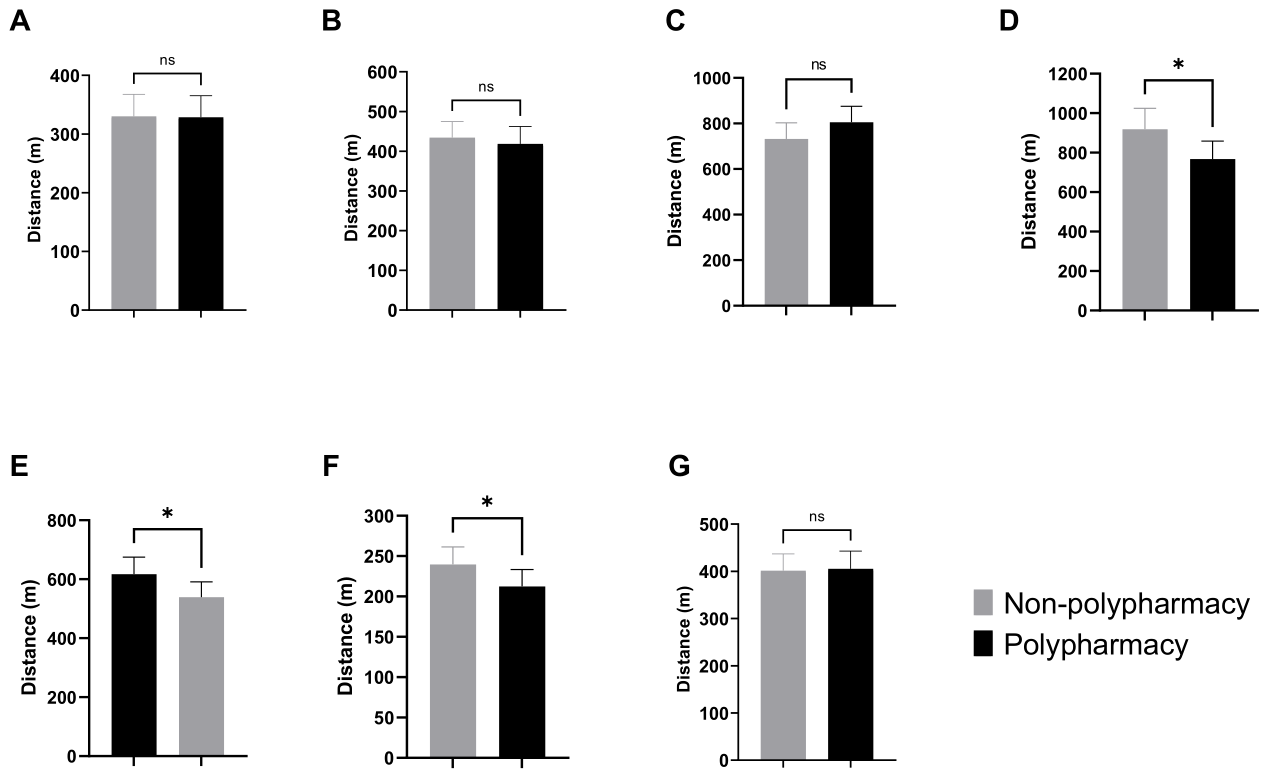
Figure 5.
Comparison of mean distance to relevant urban facilities according to frailty subtypes: (A) fruit and vegetable shops, (B) senior centers or communities, (C) pharmacies, (D) emergency health centers, (E) family or community health centers, (F) main squares and parks, (G) exercise facilities. Data are presented as mean with 95% CI. Statistical analysis was performed using Kruskal-Wallis test. When the omnibus test was significant, pairwise post hoc comparisons were performed using Dunn’s test with Bonferroni adjustment. *P<.05; **P<.01.
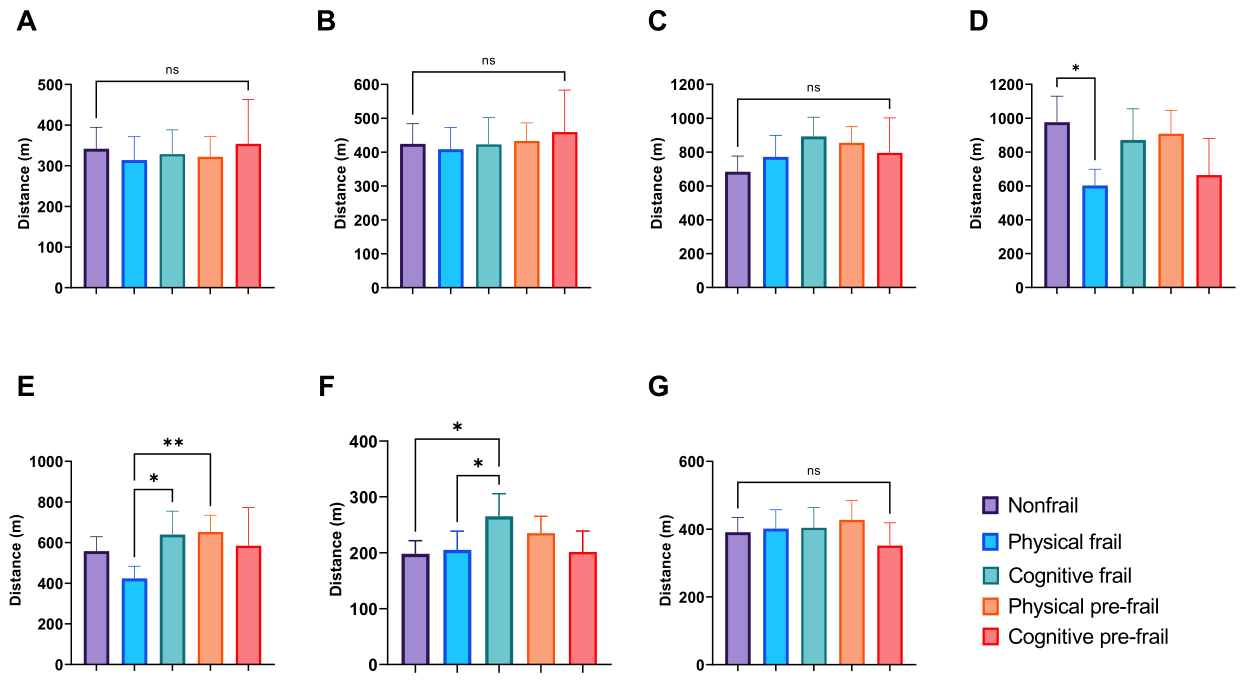

Table 1.
Distance ranges and associated values for each urban physical facility.
| Facility | Distance Ranges (m) | ||
|---|---|---|---|
| Fruit and vegetable shops | <300 | 300 - 600 | >600 |
| Senior centers or communities | <500 | 500 - 1000 | >1000 |
| Pharmacies | <500 | 500 - 1000 | >1000 |
| Emergency health centers | <1000 | 1,000 - 2000 | >2000 |
| Main squares and parks | <200 | 200 - 400 | >400 |
| Family or community health centers | <700 | 700 - 1400 | >1400 |
| Exercise facilities (stadiums and green areas with urban assets designed for physical activity) | <400 | 400 - 600 | >600 |
| Value | |||
| 3 | 2 | 1 | |
Table 2.
Sociodemographic description, frailty prevalence, and geospatial distribution of the study sample of older adults according to cognitive status.
Table 2.
Sociodemographic description, frailty prevalence, and geospatial distribution of the study sample of older adults according to cognitive status.
| Variable | Normal cognition (n=237) | Cognitive impairment (n=80) | P value |
|---|---|---|---|
| Sociodemographic characteristics | |||
| Female % (95% CI) | 59.5 (53.1-65.5) | 67.5 (56.6-76.8) | .23 |
| Age (mean ± SD) | 72.5 ± 5.2 | 76.6 ± 6.3 | <.001 |
| BMI (mean ± SD) | 29.3 ± 4.4 | 29.3 ± 5.5 | .67 |
| Total years of education (mean ± SD) | 9.3 ± 3.9 | 7.4 ± 3.7 | <.001 |
| Consume fruits and vegetables 5 days a week % (95% CI) | 42.2 (36.1-48.6) | 45.0 (34.6-55.9) | .70 |
| Nutritional risk % (95% CI) | 29.1 (23.7-35.2) | 53.8 (42.9-64.3) | <.001 |
| Frailty prevalence | |||
| Non-frail % (95% CI) | 35.0 (29.2-41.3) | 6.3 (2.7-13.8) | <.001 |
| Pre-frail % (95% CI) | 40.5 (34.5-46.9) | 27.5 (18.9-38.1) | .045 |
| Frail % (95% CI) | 24.5 (19.4-30.3) | 66.3 (55.4-75.7) | <.001 |
| Summary index distribution | |||
| Q1 % (95% CI) | 40.5 (34.3-46.8) | 36.2 (25.7-46.8) | .50 |
| Q2 % (95% CI) | 20.7 (15.5-25.8) | 30.0 (20.0-40.0) | .09 |
| Q3 % (95% CI) | 18.6 (13.6-23.5) | 13.8 (6.2-21.3) | .33 |
| Q4 % (95% CI) | 20.3 (15.1-25.4) | 20.0 (11.2-28.8) | .96 |
Table 3.
Sociodemographic characteristics, frailty prevalence, and geospatial distribution of the study sample of older adults according to polypharmacy status.
Table 3.
Sociodemographic characteristics, frailty prevalence, and geospatial distribution of the study sample of older adults according to polypharmacy status.
| Variable | Non-polypharmacy (n=160) | Polypharmacy (n=157) | P value |
|---|---|---|---|
| Sociodemographic characteristics | |||
| Female % (95% CI) | 57.5 (49.8-65.2) | 66.2 (58.8-73.6) | .11 |
| Age (mean ± SD) | 73.4 ± 5.8 | 73.6 ± 5.8 | .62 |
| BMI (mean ± SD) | 27.9 ± 4.4 | 30.6 ± 4.7 | <.001 |
| Total years of education (mean ± SD) | 9.4 ± 4.0 | 8.2 ± 3.9 | .007 |
| Consume fruits and vegetables 5 days a week % (95% CI) | 41.2 (33.6-48.9) | 44.6 (36.8-52.4) | .55 |
| Nutritional risk % (95% CI) | 28.1 (21.7-35.5) | 42.7 (34.9-50.4) | .007 |
| Frailty status | |||
| Non-frail, n (%) | 50 (31.2) | 38 (24.2) | .20 |
| Pre-frail, n (%) | 65 (40.6) | 53 (33.8) | .25 |
| Frail, n (%) | 45 (28.1) | 66 (42.0) | .01 |
| Summary index distribution | |||
| Q1 % (95% CI) | 41.9 (34.2-49.5) | 36.9 (29.4-44.5) | .37 |
| Q2 % (95% CI) | 20.6 (14.4-26.9) | 25.5 (18.7-32.3) | .31 |
| Q3 % (95% CI) | 19.4 (13.3-25.5) | 15.3 (9.7-20.9) | .34 |
| Q4 % (95% CI) | 18.1 (12.2-24.1) | 22.3 (15.8-28.8) | .36 |
Table 4.
Prevalence of Physical and Cognitive Frailty, Physical Performance, and Fried Frailty Criteria according to the quartile distribution of the summary index.
Table 4.
Prevalence of Physical and Cognitive Frailty, Physical Performance, and Fried Frailty Criteria according to the quartile distribution of the summary index.
| Variable | Q1 (n=125) (9-18) |
Q2 (n=73) (>18-19) |
Q3(n=55) (>19-20) |
Q4 (n=64) (>20-23) |
P value |
|---|---|---|---|---|---|
| Frailty prevalence and physical performance | |||||
| Physical Frailty % (95% CI) | 16.8 (11.3-24.3) | 17.8 (10.7-28.1) | 18.2 (10.2-30.3) | 21.9 (13.5-33.4) | .86 |
| Physical Pre-frailty % (95% CI) | 32.8 (24.7-41.8) | 30.1 (19.9-42.0) | 32.7 (20.7-46.7) | 23.4 (13.8-35.7) | .58 |
| Cognitive Frailty % (95% CI) | 16.0 (10.6-23.4) | 26.0 (17.3-37.1) | 12.7 (6.3-24.0) | 10.9 (5.4-20.9) | .052 |
| Cognitive Pre-frailty % (95% CI) | 5.6 (2.4-10.8) | 6.8 (2.2-15.3) | 5.5 (1.1-15.1) | 10.9 (5.4-20.9) | .55 |
| Fried Phenotype Score (mean ± SD) | 1.9 ± 0.8 | 2.1 ± 1.4 | 1.6 ± 1.4 | 1.7 ± 1.5 | .12 |
| Handgrip strength (kg, mean ± SD) | 21.4 ± 7.8 | 22.0 ± 8.9 | 21.8 ± 8.4 | 19.8 ± 7.5 | .39 |
| Gait time for 3-meter walk (s, mean ± SD) | 3.9 ± 1.4 | 4.1 ± 1.4 | 3.8 ± 1.3 | 3.9 ± 1.4 | .86 |
| Fried Frailty Criteria | |||||
| Weight loss % (95% CI) |
16.8 (10.2-23.4) | 19.2 (10.1-28.2) | 10.9 (2.7-19.1) | 12.5 (4.4-20.6) | .52 |
| Slowness % (95% CI) |
44.8 (36.1-53.5) | 54.8 (43.4-66.2) | 41.8 (28.8-54.9) | 37.5 (25.6-49.4) | .21 |
| Exhaustion % (95% CI) |
41.6 (33.0-50.2) | 53.4 (42.0-64.9) | 40.0 (27.1-52.9) | 46.9 (34.6-59.1) | .35 |
| Weakness % (95% CI) |
36.8 (28.3-45.3) | 41.1 (29.8-52.4) | 27.3 (15.5-39.0) | 34.4 (22.7-46.0) | .43 |
| Low physical activity% (95% CI) |
32.8 (24.6-41.0) | 35.6 (24.6-46.6) | 40.0 (27.1-52.9) | 34.4 (22.7-46.0) | .83 |
| Polypharmacy characteristics | |||||
| Number of medications per day (mean ± SD) | 4.3 ± 2.4 | 4.8 ± 2.7 | 4.2 ± 2.4 | 4.9 ± 2.5 | .26 |
| Prevalence of polypharmacy % (95% CI) | 46.4 (37.7-55.1) | 54.8 (43.4-66.2) | 43.6 (30.5-56.7) | 54.7 (42.5-66.9) | .43 |
Table 5.
Multivariable binary logistic regression of lower spatial accessibility (≤18 points) and clinical outcomes (cognitive impairment, polypharmacy, and frailty), adjusted for age, sex, education, body mass index, and nutritional risk (n=317).
Table 5.
Multivariable binary logistic regression of lower spatial accessibility (≤18 points) and clinical outcomes (cognitive impairment, polypharmacy, and frailty), adjusted for age, sex, education, body mass index, and nutritional risk (n=317).
| Variable | aOR | 95% CI | P value |
|---|---|---|---|
| Cognitive impairment (events 80/317) | |||
| Low UQI (≤18 points) | 0.94 | 0.52-1.68 | .83 |
| Age, per year | 1.14 | 1.08-1.20 | <.001 |
| Female sex | 1.06 | 0.58-1.91 | .86 |
| Education, per year | 0.91 | 0.85-0.98 | .02 |
| BMI, per kg/m² | 1.06 | 0.99-1.12 | .08 |
| Nutritional risk (MNA-SF ≤11) | 3.01 | 1.68-5.38 | <.001 |
| Polypharmacy (events 157/317) | |||
| Low UQI (≤18 points) | 0.89 | 0.55-1.45 | .64 |
| Age, per year | 1.03 | 0.98-1.07 | .22 |
| Female sex | 1.36 | 0.83-2.24 | .22 |
| Education, per year | 0.94 | 0.89-1.00 | .06 |
| BMI, per kg/m² | 1.16 | 1.10-1.23 | <.001 |
| Nutritional risk (MNA-SF ≤11) | 2.24 | 1.34-3.76 | .002 |
| Frailty (events 111/317) | |||
| Low UQI (≤18 points) | 0.96 | 0.58-1.59 | .87 |
| Age, per year | 1.05 | 1.01-1.10 | .02 |
| Female sex | 1.18 | 0.70-1.98 | .54 |
| Education, per year | 0.95 | 0.90-1.02 | .14 |
| BMI, per kg/m² | 1.10 | 1.05-1.17 | <.001 |
| Nutritional risk (MNA-SF ≤11) | 2.84 | 1.70-4.77 | <.001 |
Table 6.
Multivariable binary logistic regression of lower spatial accessibility (≤16 points) and clinical outcomes, adjusted for age, sex, education, body mass index, and nutritional risk, with Firth penalized estimates for the exposure as a sensitivity analysis (n=317).
Table 6.
Multivariable binary logistic regression of lower spatial accessibility (≤16 points) and clinical outcomes, adjusted for age, sex, education, body mass index, and nutritional risk, with Firth penalized estimates for the exposure as a sensitivity analysis (n=317).
| Variable | aOR | 95% CI | P value |
|---|---|---|---|
| Cognitive impairment (events 80/317) | |||
| Low UQI (≤16 points) | 0.98 | 0.39-2.47 | .97 |
| Age, per year | 1.14 | 1.08-1.20 | <.001 |
| Female sex | 1.06 | 0.59-1.92 | .85 |
| Education, per year | 0.91 | 0.85-0.98 | .02 |
| BMI, per kg/m² | 1.06 | 0.99-1.12 | .08 |
| Nutritional risk (MNA-SF ≤11) | 3.02 | 1.69-5.39 | <.001 |
| Firth penalized (exposure) | 1.01 | 0.41-2.52 | .98 |
| Polypharmacy (events 157/317) | |||
| Low UQI (≤16 points) | 2.07 | 0.95-4.51 | .07 |
| Age, per year | 1.03 | 0.99-1.08 | .13 |
| Female sex | 1.39 | 0.84-2.29 | .19 |
| Education, per year | 0.95 | 0.89-1.01 | .09 |
| BMI, per kg/m² | 1.16 | 1.10-1.24 | <.001 |
| Nutritional risk (MNA-SF ≤11) | 2.29 | 1.36-3.85 | .002 |
| Firth penalized (exposure) | 2.01 | 0.93-4.37 | .08 |
| Frailty (events 111/317) | |||
| Low UQI (≤16 points) | 0.95 | 0.43-2.10 | .91 |
| Age, per year | 1.05 | 1.01-1.10 | .02 |
| Female sex | 1.18 | 0.70-1.98 | .54 |
| Education, per year | 0.95 | 0.90-1.02 | .14 |
| BMI, per kg/m² | 1.11 | 1.05-1.17 | <.001 |
| Nutritional risk (MNA-SF ≤11) | 2.85 | 1.70-4.77 | <.001 |
| Firth penalized (exposure) | 0.97 | 0.44-2.13 | .94 |
Disclaimer/Publisher’s Note: The statements, opinions and data contained in all publications are solely those of the individual author(s) and contributor(s) and not of MDPI and/or the editor(s). MDPI and/or the editor(s) disclaim responsibility for any injury to people or property resulting from any ideas, methods, instructions or products referred to in the content. |
© 2026 by the authors. Licensee MDPI, Basel, Switzerland. This article is an open access article distributed under the terms and conditions of the Creative Commons Attribution (CC BY) license.
Copyright: This open access article is published under a Creative Commons CC BY 4.0 license, which permit the free download, distribution, and reuse, provided that the author and preprint are cited in any reuse.