

Submitted:
08 September 2026
Posted:
08 September 2026
You are already at the latest version
Abstract
Digestate is a by-product of the anaerobic digestion of food waste and can be used as a fertilizer for agricultural production. The partial replacement of mineral fertilizers with food waste digestate represents a promising strategy to improve soil fertility and enhance plant nutrition and growth. Therefore, this study evaluated the effects of dif-ferent proportions of digestate derived from the anaerobic digestion of food waste combined with mineral fertilization on soil fertility, growth, and nutritional status of maize (Zea mays L.) plants. The experiment was conducted in a greenhouse using a completely randomized design with six treatments: unfertilized control (C0), 100% mineral fertilizer (M100), 75% mineral fertilizer + 25% digestate (M75D25), 50% min-eral fertilizer + 50% digestate (M50D50), 25% mineral fertilizer + 75% digestate (M25D75), and 100% digestate (D100), with four replicates. The M25D75 treatment significantly increased cation exchange capacity, base saturation, and pH, also result-ing in higher concentrations of P and Mg in the soil. Furthermore, this treatment pro-moted higher chlorophyll index, stem diameter, leaf number, plant height, and dry biomass, as well as increased plant concentrations of P, K, Ca, and Mg. In contrast, the exclusive application of digestate (D100) increased electrical conductivity, exchangea-ble sodium percentage, and sodium concentrations in both soil and plants, leading to reduced plant growth. Multivariate analysis confirmed the association of the M25D75 treatment with simultaneous improvements in soil fertility, plant nutrition, and plant growth. The combined application of mineral fertilizers and digestate improved soil fertility, plant nutrition, and plant growth, allowing up to 75% of the mineral fertilizer to be replaced by food waste digestate. These findings support the sustainable recycling of food waste through its agricultural use as digestate, contributing to circular nutrient management and reducing dependence on synthetic mineral fertilizers.
Keywords:
sustainable fertilization
; circular economy
; organic waste recycling
; maize nutrition
; Zea mays L.
1. Introduction
Mineral fertilization provides nutrients readily available for plant uptake. However, the continuous use of mineral fertilizers may increase production costs and cause environmental impacts, such as nutrient losses and contamination of water resources [1,2,3]. Studies have shown that the partial replacement of mineral fertilizers with organic sources can improve soil physical properties as well as chemical attributes, including cation exchange capacity and nutrient availability [4,5].
Among organic nutrient sources, digestate derived from the anaerobic digestion of food waste has emerged as a promising alternative for agricultural use because it contains essential nutrients, such as nitrogen, phosphorus, and potassium, in addition to micronutrients and organic matter, which can improve soil health and promote plant development [6,7]. Nutrient inputs supplied through digestate may enhance plant growth parameters, including plant height, root elongation, leaf number, and, consequently, increase shoot biomass and chlorophyll content [7].
In addition to its agronomic benefits, the use of digestate reduces dependence on mineral fertilizers and promotes more sustainable agricultural practices [8]. The disposal of food waste in landfills causes social, environmental, and economic problems. Converting these residues into digestate supports circular waste management and may reduce dependence on synthetic fertilizers. However, its agronomic performance depends on digestate composition, soil properties, crop demand, and application rate, while excessive use may increase salinity and sodium accumulation. Therefore, local evidence is needed to define safe and efficient substitution rates [9,10]. Nevertheless, the application of digestate as a fertilizer must be carefully managed and properly dosed, since excessive application rates may increase soil salinity and sodium concentration, negatively affecting plant growth and development [5,10,11].
The growth and nutritional status of maize plants are directly related to soil fertility conditions, particularly in tropical regions, where natural constraints such as low nutrient availability and high soil acidity are common [1]. Maize (Zea mays L.) is one of the most widely cultivated crops worldwide and plays an important role in human nutrition, animal feed production, and several agro-industrial value chains. In addition to its economic and social importance, maize is widely used for the production of food, starch, vegetable oil, and biofuels. It is also among the crops with the highest demand for mineral fertilizers [5]. Consequently, maize is an important model crop for studies evaluating the feasibility of organic fertilizers or their combination with mineral fertilizers. In this context, appropriate soil fertility management is essential to maintain crop productivity and the quality of agricultural production systems [12,13].
The combined application of mineral and organic fertilizers has been associated with positive effects on maize growth and plant nutrition, depending on the proportions used [14,15,16,17]. Therefore, the application of digestate in combination with mineral fertilizers may represent a viable strategy for promoting sustainable agricultural production [10]. Thus, the partial replacement of mineral fertilization with food waste digestate would improve nutrient availability in the soil and the vegetative growth of maize. Accordingly, the objective of this study was to evaluate the effects of combinations of mineral fertilizers and food waste digestate on soil fertility, as well as on the growth and nutritional status of maize plants.
2. Materials and Methods
2.1. Experimental Site and Soil
The experiment was conducted over a 48-day period, between January and March 2025, in a greenhouse located at the Department of Soil Science, Federal University of Ceará (UFC), Fortaleza, Ceará State, Brazil (3°44′34.87″ S, 38°34′31.34″ W) (Figure 1). The regional climate is classified as tropical subhumid, with average temperatures ranging from 26 to 28 °C.
The physical and chemical characterization of the soil was performed according to the methodology described by Teixeira et al. [18]. The physical analysis of the soil was performed based on particle-size distribution. In the 0–20 cm layer, the soil con-tained 73% sand, 17% silt, and 10% clay, and was classified as sandy. The initial chem-ical properties of the soil resulted in: 0.41, 1.30, 0.60, and 0.30 cmolc dm−3 of potassium (K), calcium (Ca), magnesium (Mg), and sodium (Na), respectively; and 0.01, 37.00, 9.00, 12.00, and 6.00 mg kg−1 of phosphorus (P), iron (Fe), copper (Cu), zinc (Zn), and manganese (Mn), respectively. Furthermore, the hydrogenic potential (pH in water 1:2.5), electrical conductivity (EC), potential acidity (H+Al), sum of exchangeable bases (SB), cation exchange capacity (CEC), base saturation (V%), exchangeable sodium per-centage (ESP), and sodium adsorption ratio (SAR) were 5.80, 0.30 dS m−1, 1.30 cmolc dm−3, 2.61 cmolc dm−3, 3.91 cmolc dm−3, 66.75%, 6.50%, and 0.30, respectively.
2.2. Production of Food Waste Digestate
Food waste collected from university restaurants at the Universidade Federal do Ceará (UFC) was used to produce the digestate. The digestate was generated in a fiberglass-reinforced plastic (FRP) biodigester (UASB) with a conical bottom, measuring 2.0 m in internal diameter and 6.0 m in height, with an approximate capacity of 22 m3. The biodigester was equipped with three sampling and recirculation ports positioned at 1.5 m intervals along its height.
During the grinding and homogenization stage of the food waste, water was added to facilitate the flow of the slurry through the biodigester piping system. In all processing stages, volatile total solids (VTS) concentrations of 1, 5, 10, and 15% were maintained.
Chemical characterization of the digestate yielded: 0.70 g kg−1 total nitrogen (N), 0.60 g kg−1 phosphorus (P), 0.60 g kg−1 potassium (K), 3.75 g kg−1 calcium (Ca), 0.90 g kg−1 magnesium (Mg), and 1.30 g kg−1 sodium (Na). These analyses were performed ac-cording to the conventional digestion procedure (Method SW-846 3051A/3051B) for soils, sediments, and wastes, established by the United States Environmental Protec-tion Agency (EPA). Total nitrogen (N) was determined using the Kjeldahl method [18].
2.3. Experimental Design and Treatments
The experiment was arranged in a completely randomized design (CRD) with six treatments and four replicates, totaling 24 experimental units. The proportions of digestate and mineral fertilizers corresponded to the following treatments: unfertilized control (C0), 100% mineral fertilizer (M100), 75% mineral fertilizer + 25% liquid digestate (M75D25), 50% mineral fertilizer + 50% liquid digestate (M50D50), 25% mineral fertilizer + 75% liquid digestate (M25D75), and 100% liquid digestate (D100).
The application rates of mineral fertilizers and digestate were established according to the fertilizer recommendations for maize provided in the 5th Edition of the Recommendations for the Use of Lime and Fertilizers in Minas Gerais (1999). The amounts of digestate applied in each treatment were calculated based on its total nitrogen content. The mineral fertilizers used were urea (120 kg ha-1), triple superphosphate (TSP) (80 kg ha-1), and potassium chloride (70 kg ha-1) (KCl).
The M100 treatment represented the full mineral fertilization rate recommended for maize, adjusted to the soil volume used in each 15-L pot, resulting in 4.00 g of urea, 2.60 g of TSP, and 1.50 g of KCl per pot. In the combined treatments, mineral N was reduced proportionally according to the replacement level: 75%, 50%, and 25% of the mineral N rate were supplied in M75D25 (3.00 g of urea, 2.41 g of TSP and 0.84 g of KCl), M50D50 (2.00 g of urea, 2.21 g of TSP and 0.18 g of KCl), and M25D75 (1.00 g of urea, 2.01 g of TSP, no KCl), respectively. The amount of digestate was calculated based on its total N concentration, resulting in 642.86, 1,285.71, 1,928.57, and 2,571.43 g per pot for M75D25, M50D50, M25D75, and D100, respectively. The TSP and KCl rates were then adjusted by discounting the P and K supplied by the digestate, which explains the progressive reduction of TSP and KCl, and the absence of KCl in M25D75 and D100.
2.4. Experimental Procedure
The experimental units consisted of 15-L plastic pots filled with soil. Soil moisture was maintained near pot capacity using distilled water and was monitored with a WET-150 Soil Moisture Kit sensor (Delta-T).
After the application of the treatment mixtures (mineral fertilizer + liquid digestate), five maize seeds were sown per pot at a depth of 5 cm. Two thinning operations were performed. The first was conducted seven days after seedling emergence (DAE), leaving the four most vigorous seedlings per pot, and the second at 15 DAE, leaving only one plant per pot. The plants were grown until the end of the V7 vegetative growth stage, approximately 48 days after sowing (DAS) (Figure 2).
2.5. Experimental Evaluations
Soil samples were collected from each experimental unit at 48 DAS. The samples were air-dried in a drying facility located at the Departamento de Ciências do Solo under continuous natural ventilation, indirect light exposure, and protection from rainfall and direct solar radiation, with temperatures ranging from 28 to 35 °C. Subsequently, the samples were sent to the Laboratório de Química e Fertilidade do Solo of the UFC, where their chemical properties were determined. Electrical conductivity (EC), exchangeable sodium percentage (ESP), cation exchange capacity (CEC), base saturation (V%), pH, sodium (Na), and macronutrients (P, K, Ca, and Mg) were determined according to the methodology described by Teixeira et al. [18].
Also at 48 DAS (V7 vegetative growth stage), the following variables were evaluated: chlorophyll index (CH), measured using a chlorophyll meter (Opti-Sciences, CCM-200 Plus model); plant height (PH), measured from the soil surface to the apical meristem using a graduated measuring tape; leaf number (LN), counted from the emergence of the first leaf at the V1 stage until the V7 stage; and stem diameter (SD), measured using a 300-mm digital caliper (Zaas). After these evaluations, the aboveground plant material was harvested and transported to the Soil Chemistry Laboratory at the UFC. Leaves and stems were placed in paper bags and dried in a forced-air circulation oven at 65 °C until constant weight was achieved. Subsequently, the samples were weighed using a precision analytical balance (Tecnal Mark 2200) to determine shoot dry matter (DM).
The dried leaves and stems were incinerated in a muffle furnace (7Lab, 16-L capacity) at temperatures ranging from 450 to 550 °C. The resulting ash was dissolved in diluted nitric acid solution (1 N HNO3), and the concentrations of macronutrients (N, P, K, Ca, and Mg) and sodium (Na) in the plant tissues were determined according to the methodology described by Silva et al. [20].
2.6. Statistical Analysis
The assumptions of normality of the residuals (Shapiro–Wilk test) and homogeneity of variances (Levene’s test) were verified prior to statistical analysis. Subsequently, the data were subjected to analysis of variance (ANOVA). When significant, treatment means were compared using Tukey’s test at the 5% significance level (p < 0.05). Multivariate analyses were also performed, in which the data were subjected to principal component analysis (PCA) to evaluate the relationships between soil fertility variables and plant growth and nutritional parameters. All statistical analyses were performed using the R software.
3. Results
3.1. Subsection
Soil fertility-related variables differed significantly among treatments (p < 0.05), according to the analysis of variance, for electrical conductivity (EC), exchangeable sodium percentage (ESP), cation exchange capacity (CEC), base saturation (V%), soil pH, and sodium (Na) concentration following the application of the fertilizer formula-tions (Figure 4).
Electrical conductivity (EC) was higher in the treatment receiving 100% liquid digestate (D100) (3.06 dS m−1) than in the treatments receiving 25% mineral fertilizer + 75% liquid digestate (M25D75), 75% mineral fertilizer + 25% liquid digestate (M75D25), 50% mineral fertilizer + 50% liquid digestate (M50D50), 100% mineral fer-tilizer (M100), and the unfertilized control (C0) (Figure 3A).
Exchangeable sodium percentage (ESP) was lowest in the C0 and M100 treat-ments, with values of 2.8 and 3.5%, respectively, and increased with digestate applica-tion, reaching intermediate values in M75D25 (9.9%) and M50D50 (11.9%), and the highest values in M25D75 (15.8%) and D100 (18.2%) (Figure 3B).
Soil cation exchange capacity (CEC) was highest in the M50D50 treatment (5.65 cmolc dm−3), followed by M25D75, M75D25, and D100 (5.29, 5.12, and 4.97 cmolc dm−3, respectively), which did not differ significantly from one another but were significant-ly higher than M100 and C0, which presented values of 2.67 and 2.26 cmolc dm−3, re-spectively (Figure 3C).
Base saturation (V%) was highest in the D100 and M25D75 treatments (89.17 and 90.03%, respectively), which did not differ significantly from each other, and lowest in the C0 and M100 treatments (55.86 and 57.37%, respectively) (Figure 3D).
Soil pH increased with digestate application and reached its highest value in the D100 treatment, 7.5, followed by M25D75, M50D50, M75D25, C0, and M100, with values of 7.2, 7.0, 6.9, 5.9, and 5.6, respectively (Figure 3E).
Soil Na concentration was lowest in the C0 and M100 treatments, with values of 0.065 and 0.09 cmolc dm−3, respectively, and increased with digestate application, reaching intermediate values in M75D25 (0.51 cmolc dm−3) and M50D50 (0.67 cmolc dm−3), and the highest values in M25D75 (0.83 cmolc dm−3) and D100 (0.90 cmolc dm−3) (Figure 3F).
Analysis of variance revealed significant differences among treatments (p < 0.05) for soil P, K, Ca, and Mg concentrations following the application of different fertilizer formulations (Figure 4).
Figure 4.
Soil macronutrient availability after partial replacement of mineral fertilizer with food waste digestate. Mean concentrations of phosphorus (P) (A), potassium (K) (B), calcium (Ca) (C), and magne-sium (Mg) (D) in the soil following the application of fertilizer formulations. Treatments corresponded to different proportions of mineral fertilizer and liquid digestate: unfertilized control (C0), 100% mineral fertilizer (M100), 75% mineral fertilizer + 25% liquid digestate (M75D25), 50% mineral fertilizer + 50% liquid digestate (M50D50), 25% mineral fertilizer + 75% liquid digestate (M25D75), and 100% liquid digestate (D100). Means followed by different letters indicate significant differences according to Tukey’s test at the 5% probability level. Vertical lines represent the standard error of the mean.
Figure 4.
Soil macronutrient availability after partial replacement of mineral fertilizer with food waste digestate. Mean concentrations of phosphorus (P) (A), potassium (K) (B), calcium (Ca) (C), and magne-sium (Mg) (D) in the soil following the application of fertilizer formulations. Treatments corresponded to different proportions of mineral fertilizer and liquid digestate: unfertilized control (C0), 100% mineral fertilizer (M100), 75% mineral fertilizer + 25% liquid digestate (M75D25), 50% mineral fertilizer + 50% liquid digestate (M50D50), 25% mineral fertilizer + 75% liquid digestate (M25D75), and 100% liquid digestate (D100). Means followed by different letters indicate significant differences according to Tukey’s test at the 5% probability level. Vertical lines represent the standard error of the mean.
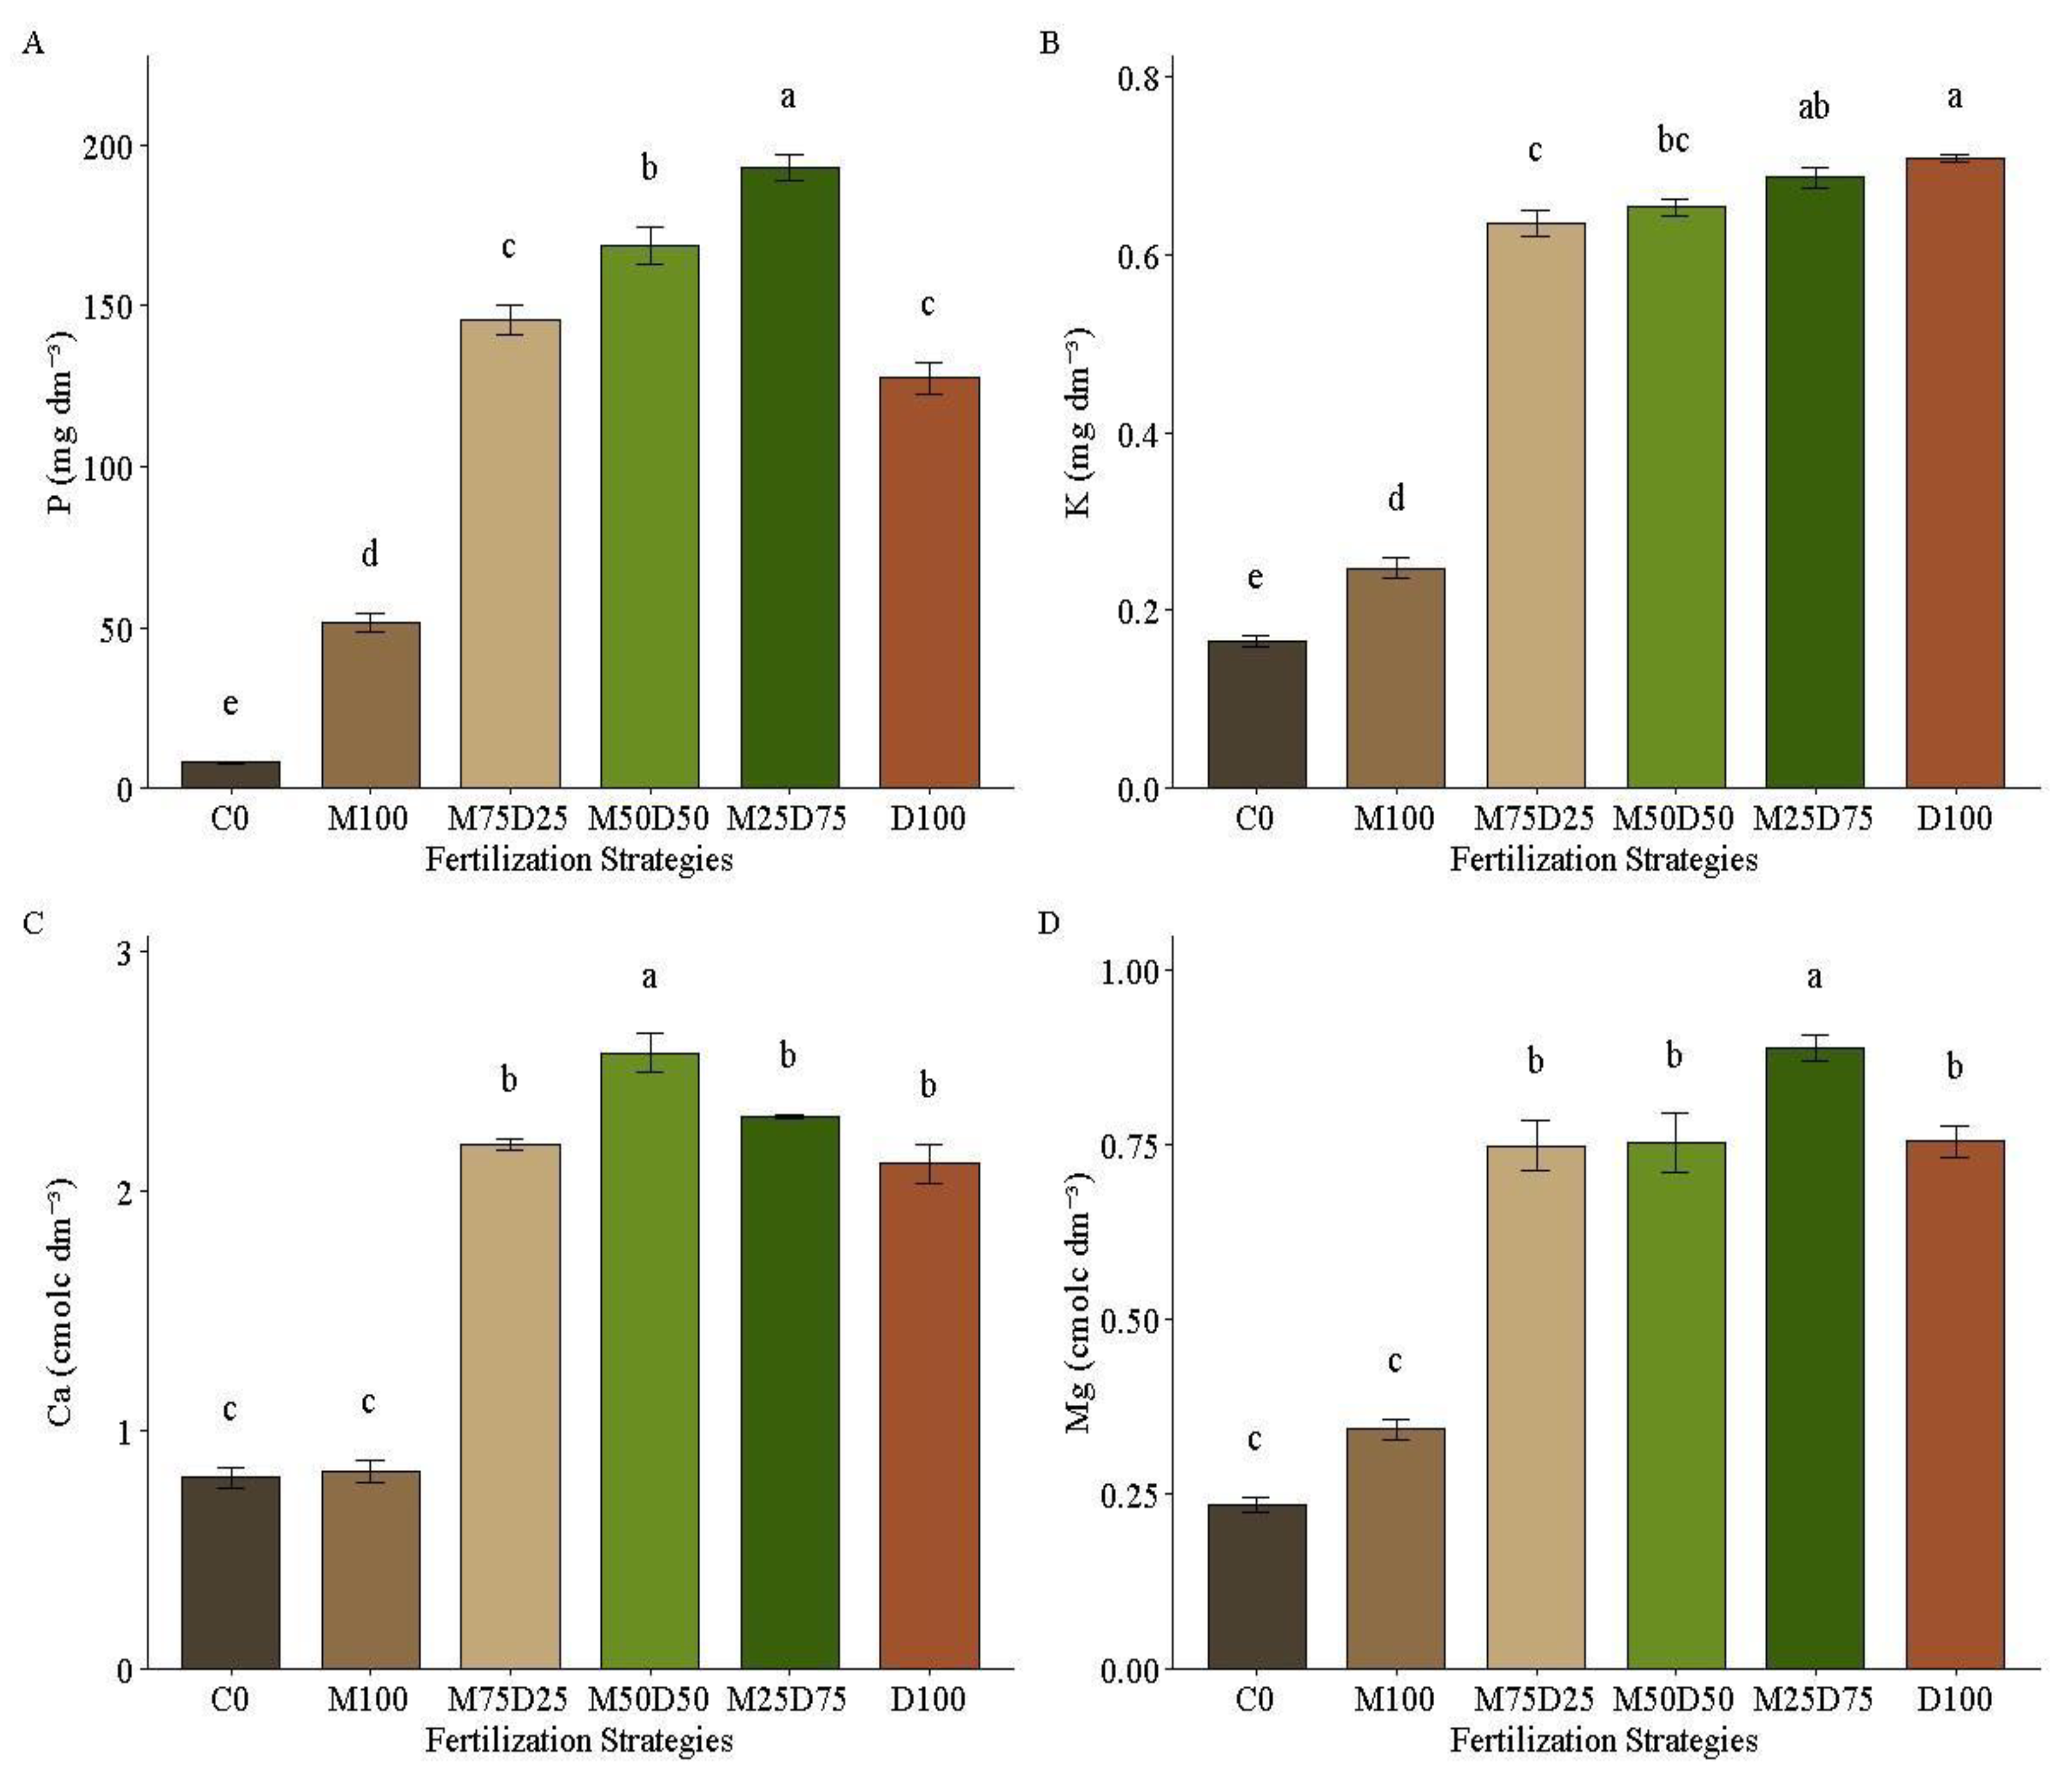
Soil P concentration increased with the combined application of mineral fertilizer and digestate, with the highest value observed in the M25D75 treatment (191.00 mg L−1), followed by M50D50 (168.5 mg L−1) (Figure 4A).
Soil K concentration increased with digestate application and was highest in the D100 and M25D75 treatments, which did not differ significantly from each other, with values of 0.70 and 0.68 cmolc dm−3, respectively, but differed from the remaining treatments. The lowest K concentration was observed in the C0 treatment (Figure 4B).
Similarly, soil Ca and Mg concentrations increased with digestate application, although only up to a certain level. The highest Ca concentration was observed in the M50D50 treatment, with a value of 2.5 cmolc dm−3, whereas the highest Mg concentra-tion occurred in the M25D75 treatment, with a value of 0.88 cmolc dm−3 (Figure 4C,D).
3.2. Plant Growth and Nutrition
Analysis of variance revealed significant differences among treatments (p < 0.05) for chlorophyll index (CH), stem diameter (SD), leaf number (LN), plant height (PH), and shoot dry matter (DM) of maize plants following the application of the fertilizer formulations (Figure 5).
Estimated chlorophyll index (CH) values increased significantly when combined applications of mineral fertilizer and liquid digestate were used compared with the unfertilized control (C0). However, the M100 treatment produced the highest value (17.05), differing significantly from all other treatments (Figure 5A).
Stem diameter was greatest in the M100, M50D50, M25D75, and M75D25 treat-ments, with values of 21.97, 21.72, 20.08, and 19.74 mm, respectively. These treatments did not differ significantly from one another but exhibited significantly greater stem diameters than C0 and D100, which showed the lowest values (9.62 and 10.32 mm, respectively) (Figure 5B).
Leaf number was highest in the M75D25, M50D50, M25D75, and M100 treat-ments, which did not differ significantly from one another and averaged 9, 9, 9, and 8 leaves per plant, respectively. The lowest values were observed in the C0 and D100 treatments, both averaging 6 leaves per plant (Figure 5C).
Plant height was greatest in the M25D75, M50D50, M100, and M75D25 treat-ments, with values of 128.50, 128.50, 120.50, and 119.50 cm, respectively, and these treatments did not differ significantly from one another. The lowest values were ob-served in the D100 and C0 treatments, with heights of 78.25 and 70.00 cm, respectively (Figure 5D).
Shoot dry matter was highest in the M25D75, M100, M50D50, and M75D25 treatments, with values of 24.62, 21.75, 21.45, and 20.07 g, respectively. These treat-ments did not differ significantly from one another but were significantly greater than D100 and C0, which exhibited values of 4.02 and 3.72 g, respectively (Figure 5E).
Analysis of variance revealed significant differences among treatments (p < 0.05) for the concentrations of N, P, K, Ca, Mg, and Na in maize plants (Figure 6).
Nitrogen (N) concentration was highest in plants subjected to the M100 treatment (19.38 g kg−1), differing significantly from the combined treatments M75D25, M50D50, and M25D75, which exhibited lower values of 17.62, 17.52, and 17.52 g kg−1, respec-tively. The lowest concentrations were observed in the D100 and C0 treatments, with values of 11.81 and 7.57 g kg−1, respectively (Figure 6A).
Phosphorus (P) concentration reached its maximum value in the M50D50 treat-ment (23.25 mg kg−1), differing significantly from all other treatments. The M75D25 and M25D75 treatments followed, with values of 21.75 and 21.27 mg kg−1, respectively, and did not differ significantly from each other. However, both treatments exceeded M100, D100, and C0, which presented mean values of 14.11, 6.00, and 3.70 mg kg−1, respectively (Figure 6B).
Potassium (K) concentration was highest in plants subjected to the M25D75 treatment (135.63 mg kg−1), although it did not differ significantly from M100 (128.93 mg kg−1). Both treatments differed significantly from the remaining treatments, which exhibited lower K concentrations. The lowest mean K concentration was observed in plants grown under the C0 treatment (75.89 mg kg−1) (Figure 6C).
Calcium (Ca) concentration increased in response to fertilization, with the highest values observed in the M75D25, M25D75, and M50D50 treatments (26.08, 24.95, and 22.41 mg kg−1, respectively), which did not differ significantly from one another. The lowest concentrations were recorded in the D100 and C0 treatments, with values of 12.27 and 13.67 mg kg−1, respectively (Figure 6D).
A similar pattern was observed for magnesium (Mg) concentration, with the highest values found in the M75D25, M25D75, and M100 treatments (18.95, 17.97, and 17.23 mg kg−1, respectively), which did not differ significantly from one another. The lowest values were observed in the C0 and D100 treatments, with concentrations of 9.82 and 4.90 mg kg−1, respectively (Figure 6E).
Sodium (Na) concentration was highest in plants fertilized exclusively with digestate (D100), reaching 28.43 mg kg−1 and differing significantly from all other treatments. The lowest concen-tration was observed in plants that received no fertilization (C0), with a value of 8.40 mg kg−1 (Figure 6F).
3.3. Principal Component Analysis (PCA)
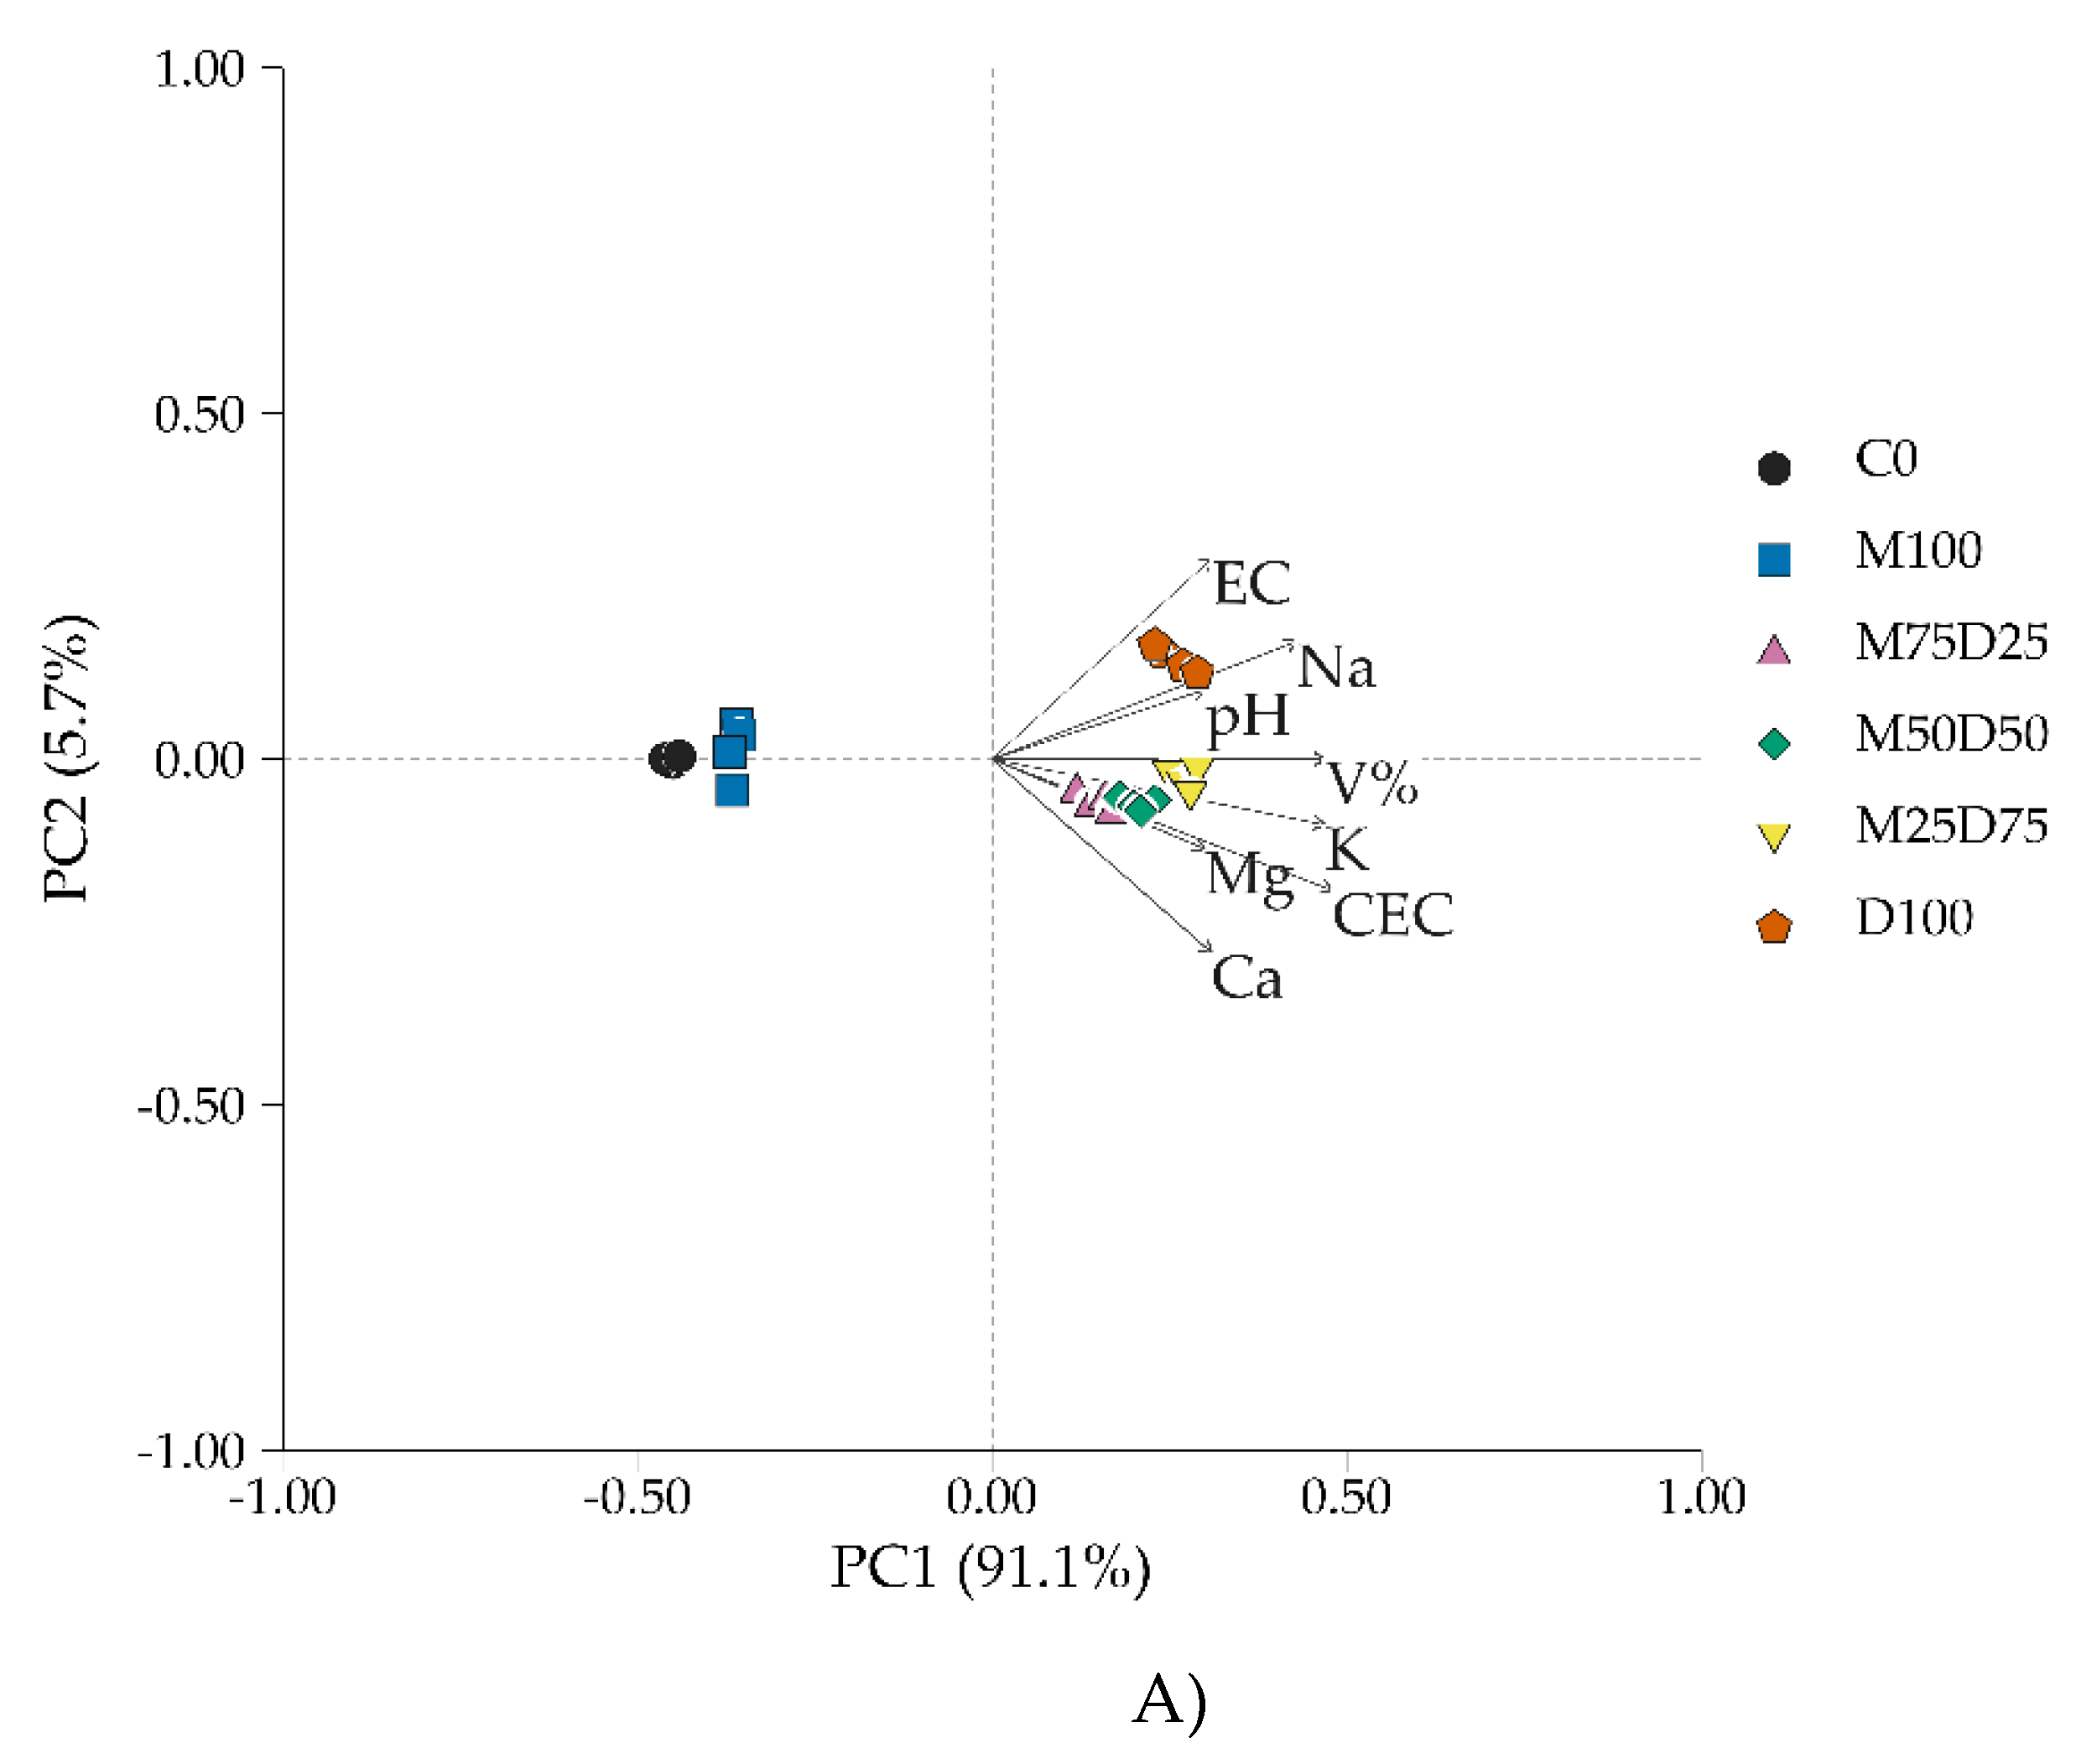
The principal component analysis (PCA) distributed the soil fertility variables across four quadrants according to their contribution to the first two principal com-ponents (PC1 and PC2). Together, these components accounted for 96.8% of the vari-ance, indicating a high representativeness of the data, with 91.1% explained by PC1 and 5.7% by PC2 (Figure 7A).
PC1 was positively correlated with soil fertility variables such as cation exchange capacity (CEC), pH, macronutrients (P, K, Ca, and Mg), and sodium (Na). On the other hand, PC2 was positively correlated with EC, positioned in the upper quadrant. The unfertilized control (C0) and the 100% mineral fertilizer (M100) treatments were con-centrated in quadrants II and III, respectively, positioned in the opposite direction to the fertility and salinity parameters. The 75% mineral fertilizer + 25% liquid digestate (M75D25) treatment was concentrated in quadrant I, as well as the 50% mineral ferti-lizer + 50% liquid digestate (M50D50) treatment, the latter being moderately associat-ed with CEC and Ca concentrations (Figure 7A). The 25% mineral fertilizer + 75% liq-uid digestate (M25D75) and 100% liquid digestate (D100) treatments were concen-trated in quadrant IV. The M25D75 treatment was more closely associated with pH and most soil fertility variables, such as CEC, Ca, P, Mg, and K (Figure 7A), indicating higher soil fertility and providing a more balanced and favorable chemical environ-ment for plant growth. The D100 treatment was most strongly associated with Na and EC (Figure 7A).
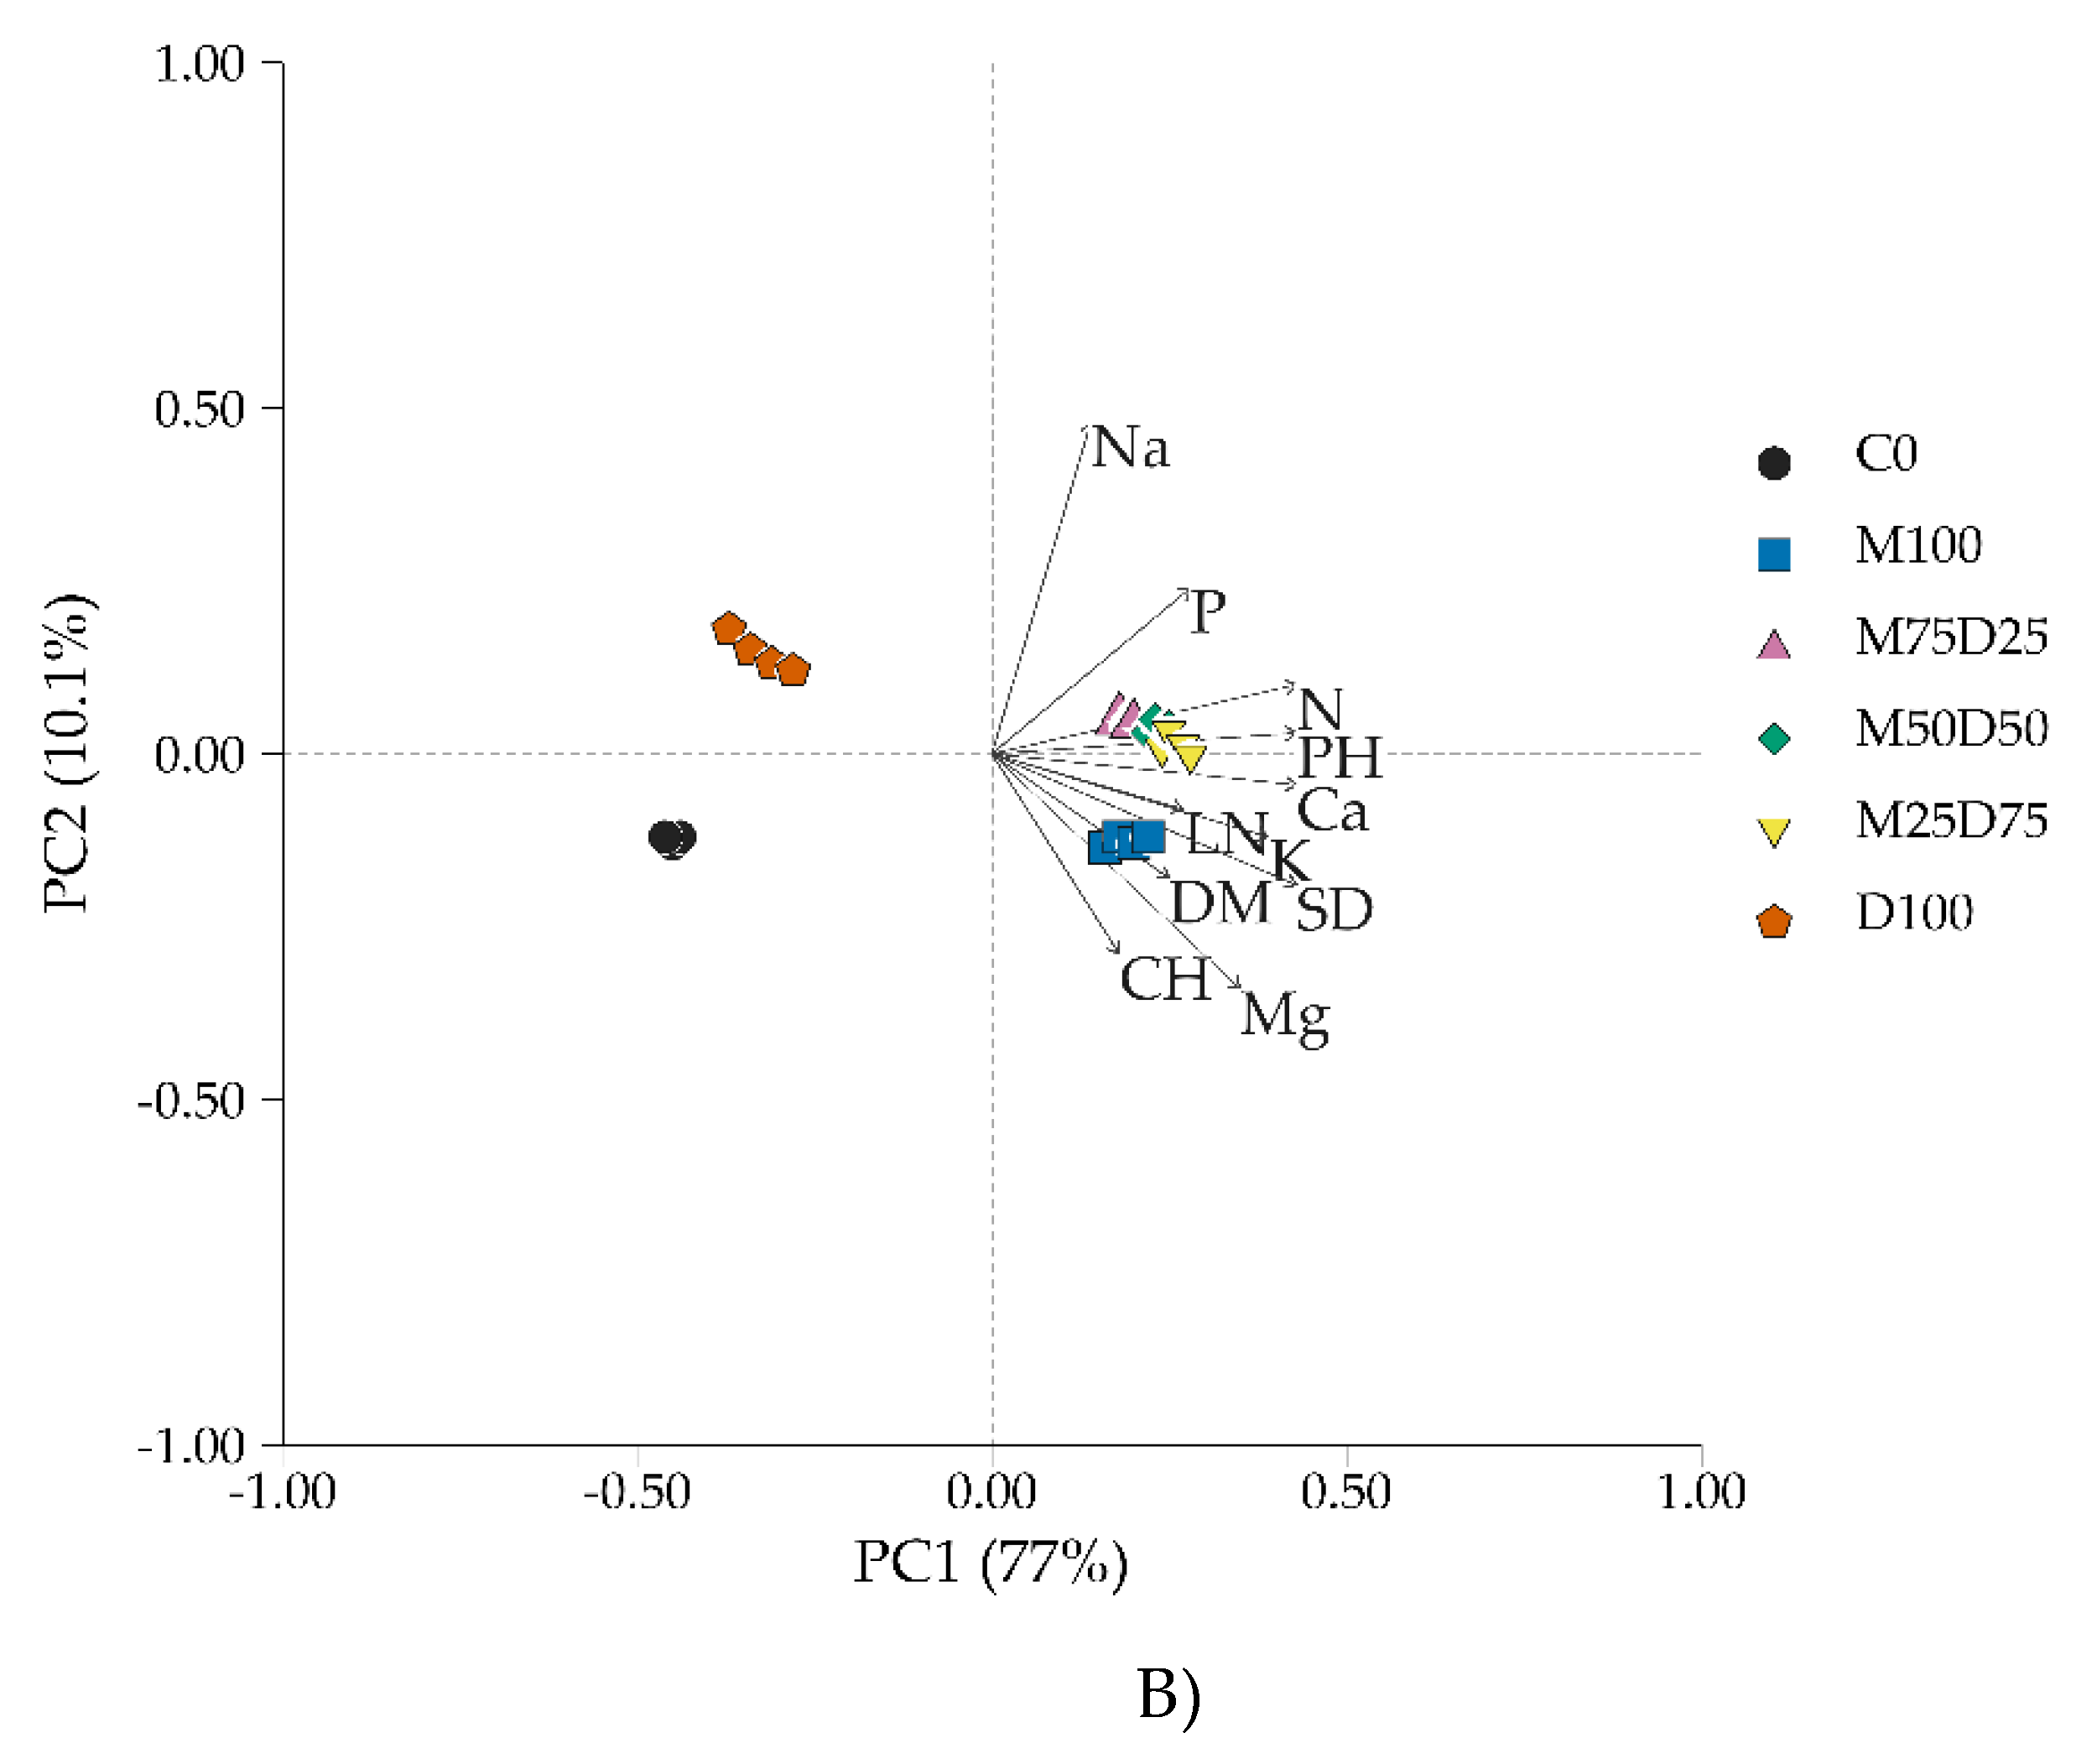
The principal component analysis (PCA) of the plant parameters resulted in two principal components that accumulated 87.1% of the variance, indicating high data representativeness, with 77% explained by PC1 and 10.1% by PC2. The variables that contributed most positively to PC1 were biometric parameters related to plant growth (PH, LN, DM, and SD), as well as chlorophyll (CH) and nutrient concentrations such as N, Ca, K, P, Mg. The variables Na, and EC were positively associated with PC2. The unfertilized control (C0) and 100% liquid digestate (D100) treatments were concen-trated in quadrants II and III, respectively, indicating a low correlation with the measured plant variables. The 50% mineral fertilizer + 50% liquid digestate (M50D50) and 25% mineral fertilizer + 75% liquid digestate (M25D75) treatments were concen-trated in quadrant I. The M25D75 treatment was more strongly associated with most variables, including plant height (PH), leaf number (LN), stem diameter (SD), shoot dry matter (DM), chlorophyll (CH), and nutrient concentrations (N, Ca, K, P, and Mg). In addition to resulting in the highest growth increment and better plant nutritional composition, this treatment showed a low association with sodium (Na) concentration. The 100% mineral fertilizer (M100) and 75% mineral fertilizer + 25% liquid digestate (M75D25) treatments were concentrated in quadrant IV, showing a moderate associa-tion with Mg concentration and low association with most other plant parameters, leading to lower growth compared to the other combined mineral fertilizer and diges-tate treatments (Figure 7B).
4. Discussion
4.1. Soil Fertility
The increase in EC is related to the chemical composition of the digestate, which contained high concentrations of basic cations such as Ca, Mg, Na, and K, leading to an increase in the concentration of salinizing ions in the soil [21]. The high concentration of these ions is attributed to the high salt content of food waste [22]. Similarly, other researchers have reported increases in soil pH and EC following the application of or-ganic and mineral fertilizers [1]. This increase in soil pH is related to the alkaline na-ture of the digestate, as well as its composition of elements such as Ca, Mg, K, and Na, which can alter the cationic balance in soil colloids and raise the pH [22].
The increase in CEC in treatments containing digestate is related to the higher concentration of organic matter in this material, which raises the density of negative charges in the soil. Furthermore, the increase in pH in the digestate treatments may have resulted in the dissociation of protons from organic matter and soil colloids, in-creasing the amount of available negative charges (pH-dependent charges) and, con-sequently, increasing soil CEC [22].
The high ESP in the soil was likely due to the direct application of digestate, either unmixed or with low amounts of other fertilizers, which increased Na concentration and consequently affected the amount of exchangeable sodium [17]. This high sodium concentration in the soil can displace Ca, Mg, and K ions from the soil exchange sites, leading to sodicity [23].
The increase in P concentration in the M25D75 treatment suggests that the com-bination of mineral fertilizer and digestate enhanced both the supply and availability of this nutrient, possibly by reducing P fixation in the soil due to the action of organic matter. Additionally, the digestate increased soil pH, contributing to the generation of pH-dependent negative charges, which favored the increase in CEC and P availability [4,15,16]. Corroborating these results, other researchers have observed increased CEC and P availability in the soil when combining biofertilizers and mineral fertilization [24]. Similarly, higher levels of available phosphorus were found in the soil following the application of organic fertilizers [4].
The increase in soil K concentration following the application of the D100 treat-ment occurred due to the high concentration of this element in the digestate, as con-firmed by its chemical characterization. Our results corroborate those observed in oth-er studies, which also reported increased soil K concentrations following the applica-tion of organic fertilizers [3]. Potassium occurs predominantly in free ionic forms and is rapidly released into the soil solution following residue application; in contrast, Ca, Mg, and P exhibit more complex soil dynamics, potentially influenced by processes such as adsorption, precipitation, retention by colloids, and ionic competition. Thus, the exclusive application of D100 primarily favored an increase in K, whereas the highest values for Ca, Mg, and P were observed in combined treatments, indicating that the combination of mineral fertilizer and digestate may have promoted a better balance in the availability of these nutrients [25].
The higher Ca and Mg concentrations in the combined treatments indicate that the partial substitution of mineral fertilization promotes a more balanced soil fertiliza-tion, as these nutrients were not provided by the exclusive mineral fertilization. Simi-lar results have been observed where the increase in Ca and Mg following the applica-tion of organic sources and mineral fertilizers demonstrated that this strategy is a promising alternative for improving soil fertility [25,26].
Although D100 supplied large amounts of digestate, its effect was nutri-ent-specific. The maximum soil K concentration in D100 can be attributed to the high K content and high solubility of this nutrient in the digestate. In contrast, Ca and Mg did not reach maximum values in D100, probably because the higher Na concentration and ESP in this treatment altered the cationic balance and promoted competition among exchangeable cations. Similarly, soil P was highest in the combined treatments, particularly M25D75, suggesting that the association between mineral P and organic compounds from the digestate was more effective in increasing P availability than di-gestate alone [3,4,25].
The higher Na concentration in the M25D75 and D100 treatments is associated with the presence of this element in both the soil and the digestate. As previously men-tioned, higher Na concentrations displace other ions from the soil exchange sites, leading to their reduction and an increase in sodium.
Consequently, based on the results, organic fertilization with liquid digestate combined with mineral fertilizers enhances soil fertility, allowing for the partial re-duction of mineral fertilization without compromising crop growth [1,5,25,27,28]. Although the application of digestate increased soil CEC, a limitation of this study was the absence of post-harvest soil organic matter or total carbon measurements, which would have significantly strengthened the interpretation of the observed alterations in CEC. Furthermore, while the chemical quantification of the digestate highlighted its rich supply of macronutrients (Table 1), food waste digestate typically contains organ-ic matter and micronutrients (such as Fe, Cu, Zn, and Mn) that also critically influence soil properties and plant nutrition. Future studies should incorporate these compre-hensive analyses to better understand the full impact of organomineral interactions on soil health.
4.2. Plant Growth and Nutrition
The growth results demonstrate that reducing mineral fertilizers by up to 75% (M25D75), supplemented with the same level of digestate, did not compromise the performance of maize plants, maintaining equivalent values for stem diameter, plant height, leaf number, and shoot dry matter compared to the 100% mineral fertilization treatment. This behavior highlights a greater efficiency of the soil-plant system in the combined treatments, possibly associated with improved soil chemical conditions and a continuous nutrient supply provided by the organic fertilizer [22].
The increase in chlorophyll index in this study is likely related to the increased availability and assimilation of nitrogen from the highly soluble mineral nitrogen ferti-lization. In a peat-based study, researchers observed that nitrogen fertilization in-creased the chlorophyll content in maize leaves, resulting in significant improvements in soil quality, yield components, overall yield, and maize grain quality [29].
Stem diameter was positively influenced by the digestate, which, when used as a biofertilizer alongside mineral fertilizers, provided a higher concentration of macro-nutrients responsible for stem growth (N) and cellular tissue reinforcement (P). Similar results have been reported where researchers using biological fertilization (a bioferti-lizer composed of cattle manure, water, and a commercial product Microgeo®) com-bined with 75% mineral fertilizers observed no reduction in the stem diameter of maize plants even after a 25% reduction in mineral fertilizer application [24]. In our study, the efficiency of the digestate maintained stem diameters equivalent to the mineral control even at higher substitution rates of 50% and 75%.
Leaf number was positively affected by the combination of organic and mineral fertilizers, likely due to a greater supply of essential chemical elements, which pro-moted higher shoot growth and, consequently, a greater number of leaves. This result aligns with findings from other researchers who observed increased plant growth when combining organic and mineral fertilizers [30].
The fertilizer mixture formulations likely promoted an increase in plant height due to the improvement of soil chemical and biological properties. The application of these inputs contributed to the increased availability of essential nutrients, such as ni-trogen, phosphorus, and potassium (NPK), while also favoring the diversity and activ-ity of beneficial microorganisms [22,27].
The increase in plant dry matter can be attributed to the improved soil nutrient dynamics provided by the combined application of digestate and mineral fertilizers. This optimization allowed the plants to meet their nutritional demands, resulting in greater vegetative growth and, consequently, higher biomass accumulation. Similar results were observed in another study applying sewage sludge (in composted and or-ganomineral forms) to a maize crop. The researchers found an increase in leaf dry weight with formulations containing 50% or more mineral fertilizer [31].
Because the experiment was conducted only until the vegetative stage, grain yield was not measured. Therefore, growth variables should be interpreted as early indica-tors of plant performance. Future studies should evaluate the full crop cycle to relate these responses to final yield.
The superiority of the M100 treatment regarding N concentration indicates that mineral fertilizer still plays an important role in the immediate supply of this nutrient. However, the combined treatments maintained adequate N levels, demonstrating that the digestate can partially contribute to its supply. Researchers have noted that nitro-gen fertilization increased N assimilation, which enabled improvements in plant growth and yield [29].
Phosphorus (P) assimilation increased with the fertilizer formulations (M100, M75D25, M25D75) due to the enhanced soil availability of this element resulting from the combination of organic and mineral fertilizers. Similar findings were reported in another study, where researchers observed an increase in available soil P and its as-similation following the combined application of organic and inorganic fertilizers [4].
The highest potassium (K) concentration in the treatments M100, M75D25, M25D75, and M50D50 can be explained by the greater availability of this nutrient in the soil solution, since in addition to applying KCl, also was applied as liquid digestate, which contains this nutrient. The lower K values in the D100 treatment are the result of competition with sodium; that is, the higher sodium concentration in the soil solu-tion caused a decrease in K uptake by the plants [32,33]
The higher potassium concentration in the M100, M75D25, M25D75, and M50D50 treatments can be explained by the greater availability of this nutrient in the soil solu-tion, as liquid digestate, which contains K, was applied in addition to KCl. The lower K values in the D100 treatment resulted from competition with sodium; that is, the high-er sodium concentration in the soil solution decreased K uptake by the plants [32,33].
Plant Ca and Mg concentrations further highlight the efficiency of the combined fertilization, particularly due to the digestate’s contribution in supplying Ca and Mg. Similar results were found in another study demonstrating that the application of 50% biofertilizer was sufficient to accumulate calcium in plant biomass compared to the unfertilized control [11].
Despite increasing the availability of some nutrients in the soil, D100 also pro-duced the highest EC, ESP, soil Na, and plant Na concentrations. These conditions may have reduced nutrient uptake through osmotic stress, Na toxicity, and ionic antago-nism, especially between Na and K, Ca, N and Mg. Thus, the exclusive application of digestate increased nutrient inputs to the soil but also created chemical constraints that limited plant absorption. In contrast, the combined treatments provided a more balanced nutrient supply and lower salinity stress, which favored plant nutrition and growth [25].
The significant increase in Na in the D100 treatment confirms the risk of its ac-cumulation in plant biomass, which can cause physiological imbalances. Toxic amounts of Na+ in cells can have harmful effects, such as inhibiting K+ uptake in both root and leaf cells and subsequently causing cellular homeostasis imbalance, oxidative stress, interference with Ca2+ and K functions, disruption of protein synthesis, stunted growth, and even plant death [23,34]. However, in most treatments, this assimilation did not translate into a severe reduction in maize plant growth [35,36].
4.3. Principal Component Analysis (PCA)
The principal component analysis confirmed the better performance resulting from the combined fertilization treatments, particularly M25D75 and M50D50, which were positively associated with soil fertility and plant growth variables [11,22]. The positioning of these treatments in the quadrant associated with pH, CEC, and nutri-ents indicates that reducing mineral fertilization, when compensated by the digestate, results in a more efficient and balanced system [16,22]. These treatments simultane-ously promoted the improvement of soil fertility, greater nutrient availability, and better physiological plant performance. On the other hand, the D100 treatment was strongly associated with EC and sodium, demonstrating that an excess of digestate can lead to soil salinization and compromise plant growth [23]. However, the other treat-ment levels confirmed that the digestate did not reduce plant biometric variables, in-dicating its viability for composing fertilizers.
From an agronomic perspective, the combined use of mineral fertilizers and food waste digestate has the potential to improve soil fertility, promote plant growth, and enhance the nutritional status of maize plants [37,38,39]. From an environmental per-spective, reducing the use of mineral fertilizers directly contributes to decreasing greenhouse gas emissions associated with synthetic fertilizer production, promotes the recycling of organic waste, mitigates environmental contamination, and increases soil organic matter and overall soil health [4,40,41,42].
The M25D75 treatment showed promising performance under the conditions of this study, demonstrating the potential to partially reduce mineral fertilization through the use of digestate. However, this result should not be interpreted as a defini-tive recommendation, as it requires further studies evaluating the complete crop cycle.
5. Conclusions
The application of the formulation containing 25% mineral fertilizer and 75% liq-uid digestate (M25D75) improved soil fertility. The formulation containing 25% min-eral fertilizer and 75% liquid digestate (M25D75) produced plant growth comparable to that achieved with 100% mineral fertilizer (M100), while enhancing plant nutri-tional status, indicating its potential as a partial substitute for mineral fertilization. The exclusive application of liquid digestate (D100) increased soil electrical conduc-tivity, exchangeable sodium percentage, soil sodium concentration, and plant sodium content, resulting in reduced plant growth. Multivariate analysis confirmed that the combined fertilizer formulation, particularly the treatment containing 25% mineral fertilizer and 75% liquid digestate (M25D75), provided the greatest improvements in soil fertility, plant growth, and plant nutritional status. The findings of this study are preliminary, as they were obtained under greenhouse conditions during the vegetative stage of maize plants. Further field experiments encompassing the entire crop cycle are needed to provide a more comprehensive understanding of the potential of food waste digestate as an agricultural fertilizer.
6. Patents
SOUSA, F.H.H.; STEFANUTTI, R.; SOUSA, B. E. L.; MOTA, J. C. A.; MAGALHAES, R. B.; COSTA, M. C. G.; MAIA, D. S. Formulação de fertilizantes organominerais ori-undos de digestato de resíduos orgânicos e fertilizantes minerais para adubação de so-los. 2025, Brasil.
Patente: Privilégio de Inovação. Número do registro: BR10202502529, título: “Formulação de fertilizantes organominerais oriundos de digestato de resíduos orgâ-nicos e fertilizantes minerais para adubação de solos”, Instituição de registro: INPI - Instituto Nacional da Propriedade Industrial. Depósito: 18/11/2025Instituição(ões) fi-nanciadora(s): INCTagris, Capes, Cnpq, Funcap.
Supplementary Materials
The following supporting information can be downloaded at the website of this paper posted on Preprints.org, Figure S1: title; Table S1: title; Video S1: title.
Acknowledgments
Coordenação de Aperfeiçoamento de Pessoal de Nível Superior (CAPES), Conse-lho Nacional de Desenvolvimento Científico e Tecnológico (CNPq) and Fundação Ce-arense de Apoio ao Desenvolvimento Científico e Tecnológico (FUNCAP).
References
- Al-Sheikh, M.; Abdulrazzak, O.; Al-Khalifa, T. Effect of Adding Potassium and Organic Fertilizers on some Physical and Chemical Soil Properties and Vegetative Growth of Maize (Zea mays L.). Agric. Eng. Int. CIGR J. 2025, 27(3). [Google Scholar]
- Dhillon, B.S.; Sohu, V.S. Climate change shocks and crop production: The foodgrain bowl of India as an example. Indian J. Agron. 2024, 69, 1–10. [Google Scholar] [CrossRef]
- Qaswar, M.; Jing, H.; Ahmed, W.; Dongchu, L.; Shujun, L.; Lu, Z.; et al. Yield sustainability, soil organic carbon sequestration and nutrients balance under long-term combined application of manure and inorganic fertilizers in acidic paddy soil. Soil Tillage Res. 2020, 198, 104569. [Google Scholar] [CrossRef]
- Liang, C.; Liu, X.; Lv, J.; Zhao, F.; Yu, Q. The Impact of Different Phosphorus Fertilizers Varieties on Yield under Wheat-Maize Rotation Conditions. Agronomy 2024, 14, 1317. [Google Scholar] [CrossRef]
- Kuunya, R.; Mustafa Ahmed Osman, M.; Ragán, P. Soil, nutrient, and fertiliser requirements for maize (Zea mays L.) production: A narrative review. Acta Agrar. Debr. 2025, 1, 85–97. [Google Scholar] [CrossRef] [PubMed]
- Artyszak, A.; Gozdowski, D.; Jonczak, J.; Pągowski, K.; Popielec, R.; Ahmad, Z. Yield and Quality of Maize Grain in Response to Soil Fertilization with Silicon, Calcium, Magnesium, and Manganese and the Foliar Application of Silicon and Calcium: Preliminary Results. Agronomy 2025, 15, 837. [Google Scholar] [CrossRef]
- Zoui, O.; Baroudi, M.; Drissi, S.; Abouabdillah, A.; Abd-Elkader, O.H.; Plavan, G.; et al. Utilization of Digestate as an Organic Manure in Corn Silage Culture: An In-Depth Investigation of Its Profound Influence on Soil’s Physicochemical Properties, Crop Growth Parameters, and Agronomic Performance. Agronomy 2023, 13, 1715. [Google Scholar] [CrossRef]
- Szwed, M.; Koszel, M.; Przywara, A.; Kachel-Górecka, M. Impact of Digestate Fertilization on Crop Production: A Comprehensive Review. Adv. Sci. Technol. Res. J. 2024, 18, 347–353. [Google Scholar] [CrossRef] [PubMed]
- Sharma, P.; Bano, A.; Verma, K.; Yadav, M.; Varjani, S.; Singh, S.P.; Tong, Y.W. Food waste digestate as biofertilizer and their direct applications in agriculture. Bioresour. Technol. Rep. 2023, 23, 101515. [Google Scholar] [CrossRef]
- Adekiya, A.O.; Ande, O.T.; Dahunsi, S.O.; Ogunwole, J.; Ibaba, A.L. Impact of bio-digestate and fertilization on the soil chemical properties, growth and yield of maize (Zea mays L.). Res. Crops 2024, 25, 33–42. [Google Scholar] [CrossRef]
- Buligon, E.L.; Costa, L.A.M.; de Lucas, J.; Santos, F.T.; Goufo, P.; Costa, M.S.S.M. Fertilizer Performance of a Digestate from Swine Wastewater as Synthetic Nitrogen Substitute in Maize Cultivation: Physiological Growth and Yield Responses. Agriculture 2023, 13, 565. [Google Scholar] [CrossRef]
- Aljoubory, S.K.H.; Al-Yasari, M.N.H. Response of growth, yield and quality of maize to the fertilizer combination of nitrogen and potassium and spraying with potassium humate. J. Kerbala Agric. Sci. 2023, 10, 110–126. [Google Scholar] [CrossRef]
- Kravchenko, A. The impact of mineral fertilisers on the physicochemical properties of soil in maize cultivation. Plant Soil Sci. 2024, 15, 44–53. [Google Scholar] [CrossRef]
- Chen, C.; Hu, Y.; Ge, Y.; Tao, J.; Yan, B.; Cheng, Z.; et al. Integrated learning framework for enhanced specific surface area, pore size, and pore volume prediction of biochar. Bioresour. Technol. 2025, 424, 132279. [Google Scholar] [CrossRef] [PubMed]
- Costa, D.B.; Freire, F.J.; Lemos, J.O.; Silva, S.R.V.; Bezerra, N.S.; Andrade, P.K.B.; et al. Phosphorous availability in Argisols and sufficiency range in sugarcane in the Northeast of Brazil. Rev. Cienc. Agron. 2024, 55, e20230063. [Google Scholar] [CrossRef]
- Li, W.; Gu, X.; Du, Y.; Zheng, X.; Lu, S.; Cheng, Z.; et al. Optimizing nitrogen, phosphorus, and potassium fertilization regimes to improve maize productivity under double ridge-furrow planting with full film mulching. Agric. Water Manag. 2023, 287, 108439. [Google Scholar] [CrossRef]
- Taj, A.; Bibi, H.; Akbar, W.A.; Rahim, H.U.; Iqbal, M.; Ullah, S. Effect of Poultry Manure and NPK Compound Fertilizer On Soil Physicochemical Parameters, NPK Availability, and Uptake by Spring Maize (Zea mays L.) in Alkaline-calcareous Soil. Gesunde Pflanz. 2023, 75, 393–403. [Google Scholar] [CrossRef]
- Teixeira, P.C.; Donagemma, G.K.; Fontana, A.; Teixeira, W.G. Manual de métodos de análise de solo, 3rd ed.; Embrapa: Brasília, 2017. [Google Scholar]
- van Raij, B.; de Andrade, J.C.; Cantarella, H.; Quaggio, J.A. Análise química para avaliação da fertilidade de solos tropicais; Instituto Agronômico: Campinas, 2001. [Google Scholar]
- da Silva, F.C. Manual de análises químicas de solos, plantas e fertilizantes, 2nd ed.; Embrapa Informação Tecnológica: Brasília; Embrapa Solos: Rio de Janeiro, 2009. [Google Scholar]
- Alzamel, N.M.; Taha, E.M.M.; Bakr, A.A.A.; Loutfy, N. Effect of Organic and Inorganic Fertilizers on Soil Properties, Growth Yield, and Physiochemical Properties of Sunflower Seeds and Oils. Sustainability 2022, 14, 12928. [Google Scholar] [CrossRef]
- Ragályi, P.; Szécsy, O.; Uzinger, N.; Magyar, M.; Szabó, A.; Rékási, M. Factors Influencing the Impact of Anaerobic Digestates on Soil Properties. Soil Syst. 2025, 9, 78. [Google Scholar] [CrossRef]
- Raddatz, N.; Morales de los Ríos, L.; Lindahl, M.; Quintero, F.J.; Pardo, J.M. Coordinated Transport of Nitrate, Potassium, and Sodium. Front. Plant Sci. 2020, 11, 247. [Google Scholar] [CrossRef] [PubMed]
- Pinheiro, R.C.; Pereira, J. de L.; Rezende, C.F.A. Adubação biológica associada a adubação química nos parâmetros de solo, nutricional e produtivo do milho. Rev. Bras. Agropecu. Sustent. 2019, 9, 9–20. [Google Scholar] [CrossRef]
- Prado, R.M. Nutrição de plantas, 2nd ed.; Editora UNESP: São Paulo, Brazil, 2020; 416p, ISBN 978-85-393-0824-8. [Google Scholar]
- Yuan, S.; Han, Y.; Cui, C.; Chen, P.; Tu, N.; Rang, Z.; et al. Silicon-calcium fertilizer increased rice yield and quality by improving soil health. Sci. Rep. 2024, 14, 13088. [Google Scholar] [CrossRef] [PubMed]
- Chen, X.; Li, Z.; Zhao, H.; Li, Y.; Wei, J.; Ma, L.; et al. Enhancing Maize Yield and Nutrient Utilization through Improved Soil Quality under Reduced Fertilizer Use: The Efficacy of Organic-Inorganic Compound Fertilizer. Agriculture 2024, 14, 1482. [Google Scholar] [CrossRef]
- Zhang, Z.; Liu, H.; Liu, X.; Chen, Y.; Lu, Y.; Shen, M.; et al. Organic fertilizer enhances rice growth in severe saline-alkali soil by increasing soil bacterial diversity. Soil Use Manag. 2022, 38, 964–977. [Google Scholar] [CrossRef]
- Uddin, M.K.; Yeasmin, S.; Mohiuddin, K.M.; Chowdhury, M.A.H.; Saha, B.K. Peat-Based Organo-Mineral Fertilizer Improves Nitrogen Use Efficiency, Soil Quality, and Yield of Baby Corn (Zea mays L.). Sustainability 2023, 15, 9086. [Google Scholar] [CrossRef]
- Zapałowska, A.; Jarecki, W. The Impact of Using Different Types of Compost on the Growth and Yield of Corn. Sustainability 2024, 16, 511. [Google Scholar] [CrossRef]
- Brito, T.T.; Viana, R.G.; de Araújo, J.R.; do Rego, J.A.R. Eficiência do uso de fertilizantes oriundos de fontes orgânicas na cultura da soja e milho: uma revisão sistemática. Rev. Bras. Gest. Ambient. Sustent. 2024, 11, 1543–1558. [Google Scholar]
- Taiz, L.; Zeiger, E.; Moller, I.M.; Murphy, A. Plant physiology and development, 6th ed.; Sinauer Associates: Sunderland, 2015. [Google Scholar]
- Barretti, P.B.; Souza, R.M.; Pozza, A.A.A.; Pozza, E.A.; Carvalho, J.G.; Souza, J.T. Aumento da eficiência nutricional de tomateiros inoculados com bactérias endofíticas promotoras de crescimento. Rev. Bras. Cienc. Solo 2008, 32, 1541–1548. [Google Scholar] [CrossRef]
- Zhao, S.; Zhang, Q.; Liu, M.; Zhou, H.; Ma, C.; Wang, P. Regulation of Plant Responses to Salt Stress. Int. J. Mol. Sci. 2021, 22, 4609. [Google Scholar] [CrossRef] [PubMed]
- Batista Granja, M.; Patriota Vitorino, P.J.; Sousa, V.F.O.; Rodrigues, M.H.B.S.; Diniz, G.L.; Andrade, F.H.A.; et al. Variedades de feijão-fava submetidas a níveis de salinidade e adubação orgânica. Colloq. Agrar. 2019, 15, 104–114. [Google Scholar] [CrossRef]
- Xiao, M.; Liu, G.; Jiang, S.; Guan, X.; Chen, J.; Yao, R.; et al. Bio-Organic Fertilizer Combined with Different Amendments Improves Nutrient Enhancement and Salt Leaching in Saline Soil: A Soil Column Experiment. Water 2022, 14, 4084. [Google Scholar] [CrossRef]
- Khosravinejad, A.; Mostashari, M.M.; Golchin, A.; Babaakbari Sari, M.; Alikhani-Koupaei, M. Optimizing Olive (Olea europaea L.) Yield and Oil Quality Through Integrated Biofertilizer and Chemical Fertilizer Application: A Sustainable Approach for Calcareous Soils. Commun. Soil Sci. Plant Anal. 2026, 57, 571–591. [Google Scholar] [CrossRef]
- Singh, S.; Devi, N.B.; D, D.; Kumar, A.; Singh, S.; Tyagi, G.; et al. Soil fertility management: Role of organic amendments and bio-fertilizers: A review. Int. J. Res. Agron. 2024, 7, 766–772. [Google Scholar] [CrossRef]
- Yu, Z.; Guo, B.; Sun, T.; Li, R.; Zhao, Z.; Yao, L. Effects of Organic Fertilizer Substitution for Mineral Fertilizer on Soil Fertility, Yield, and Quality of Muskmelons. Agronomy 2025, 15, 639. [Google Scholar] [CrossRef]
- Gong, H.; Li, J.; Liu, Z.; Zhang, Y.; Hou, R.; Ouyang, Z. Mitigated Greenhouse Gas Emissions in Cropping Systems by Organic Fertilizer and Tillage Management. Land 2022, 11, 1026. [Google Scholar] [CrossRef]
- Han, Z.; Hou, H.; Yao, X.; Qian, X.; Zhou, M. Substituting Partial Chemical Fertilizers with Bio-Organic Fertilizers to Reduce Greenhouse Gas Emissions in Water-Saving Irrigated Rice Fields. Agronomy 2024, 14, 544. [Google Scholar] [CrossRef]
- Hu, Y.; Li, D.; Wu, Y.; Liu, S.; Li, L.; Chen, W.; et al. Mitigating greenhouse gas emissions by replacing inorganic fertilizer with organic fertilizer in wheat-maize rotation systems in China. J. Environ. Manag. 2023, 344, 118494. [Google Scholar] [CrossRef] [PubMed]
Figure 1.
Geographic location of the greenhouse experiment evaluating food waste digestate.
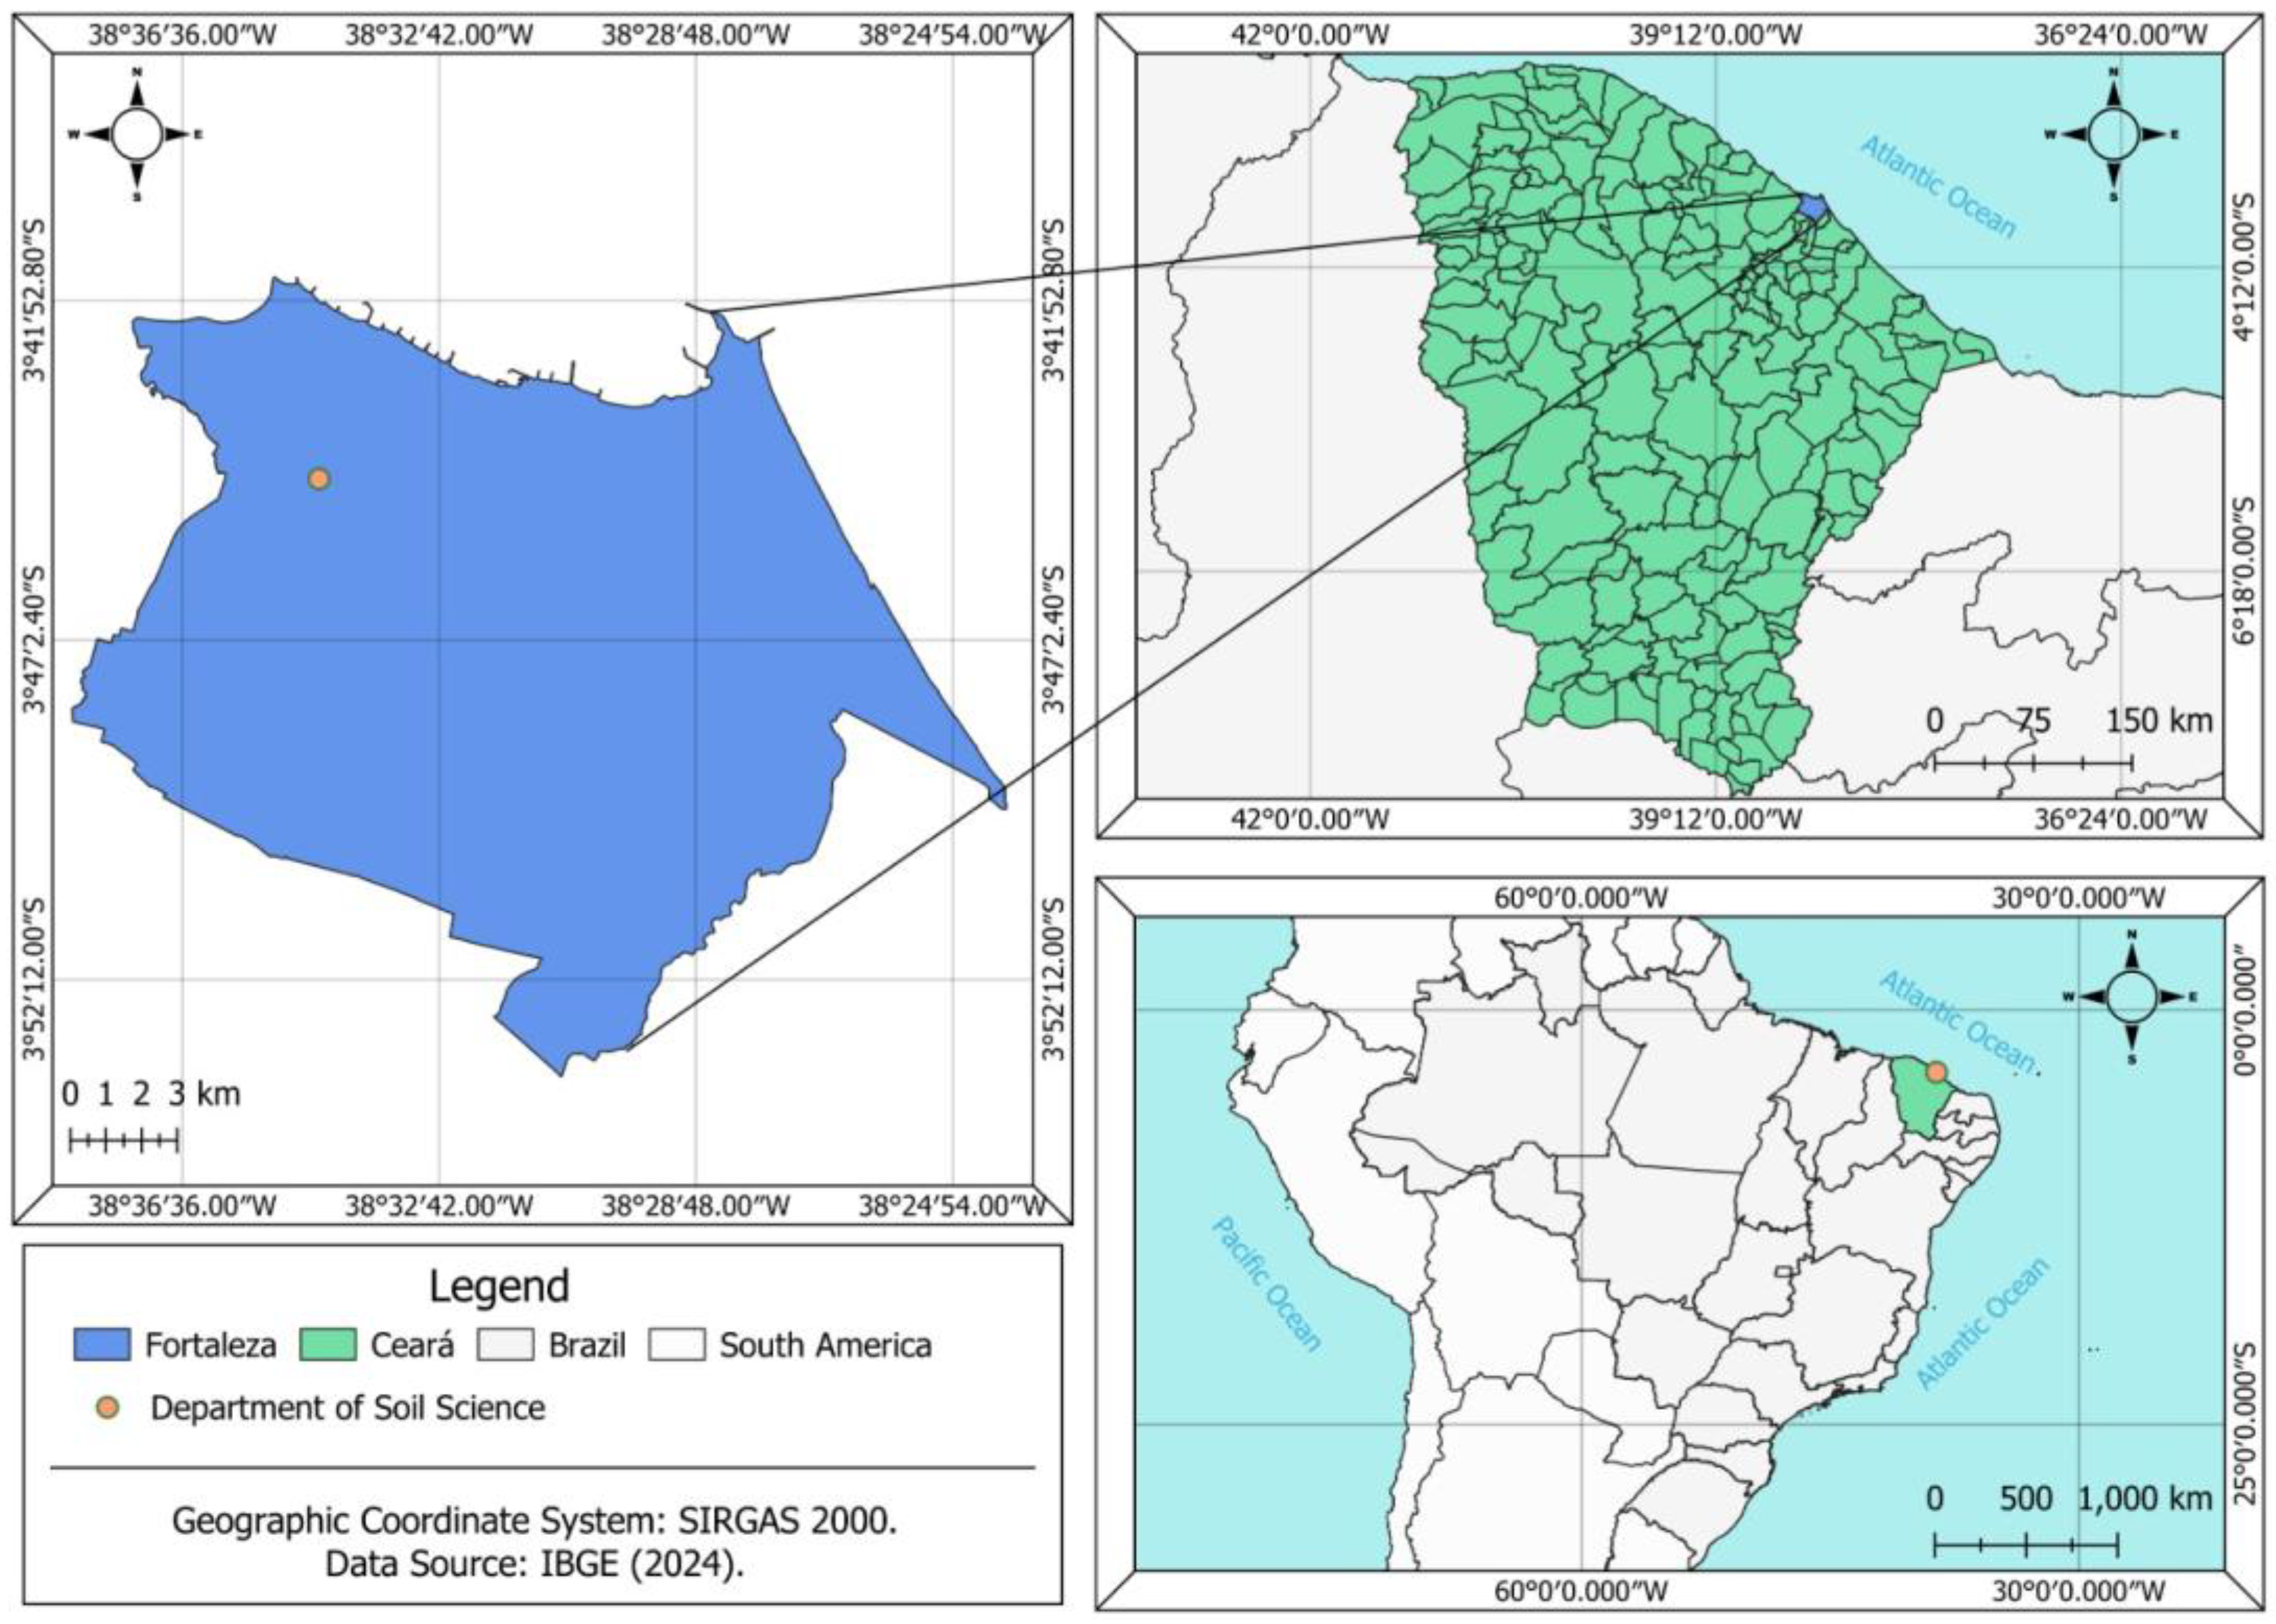
Figure 2.
Visual development of maize plants at 48 days after sowing under different mineral fertilizer and digestate proportions. C0, unfertilized control; M100, 100% mineral fertilizer; M75D25, 75% mineral fertilizer + 25% liquid digestate; M50D50, 50% mineral fertilizer + 50% liquid digestate; M25D75, 25% mineral fertilizer + 75% liquid digestate; D100, 100% liquid digestate.
Figure 2.
Visual development of maize plants at 48 days after sowing under different mineral fertilizer and digestate proportions. C0, unfertilized control; M100, 100% mineral fertilizer; M75D25, 75% mineral fertilizer + 25% liquid digestate; M50D50, 50% mineral fertilizer + 50% liquid digestate; M25D75, 25% mineral fertilizer + 75% liquid digestate; D100, 100% liquid digestate.
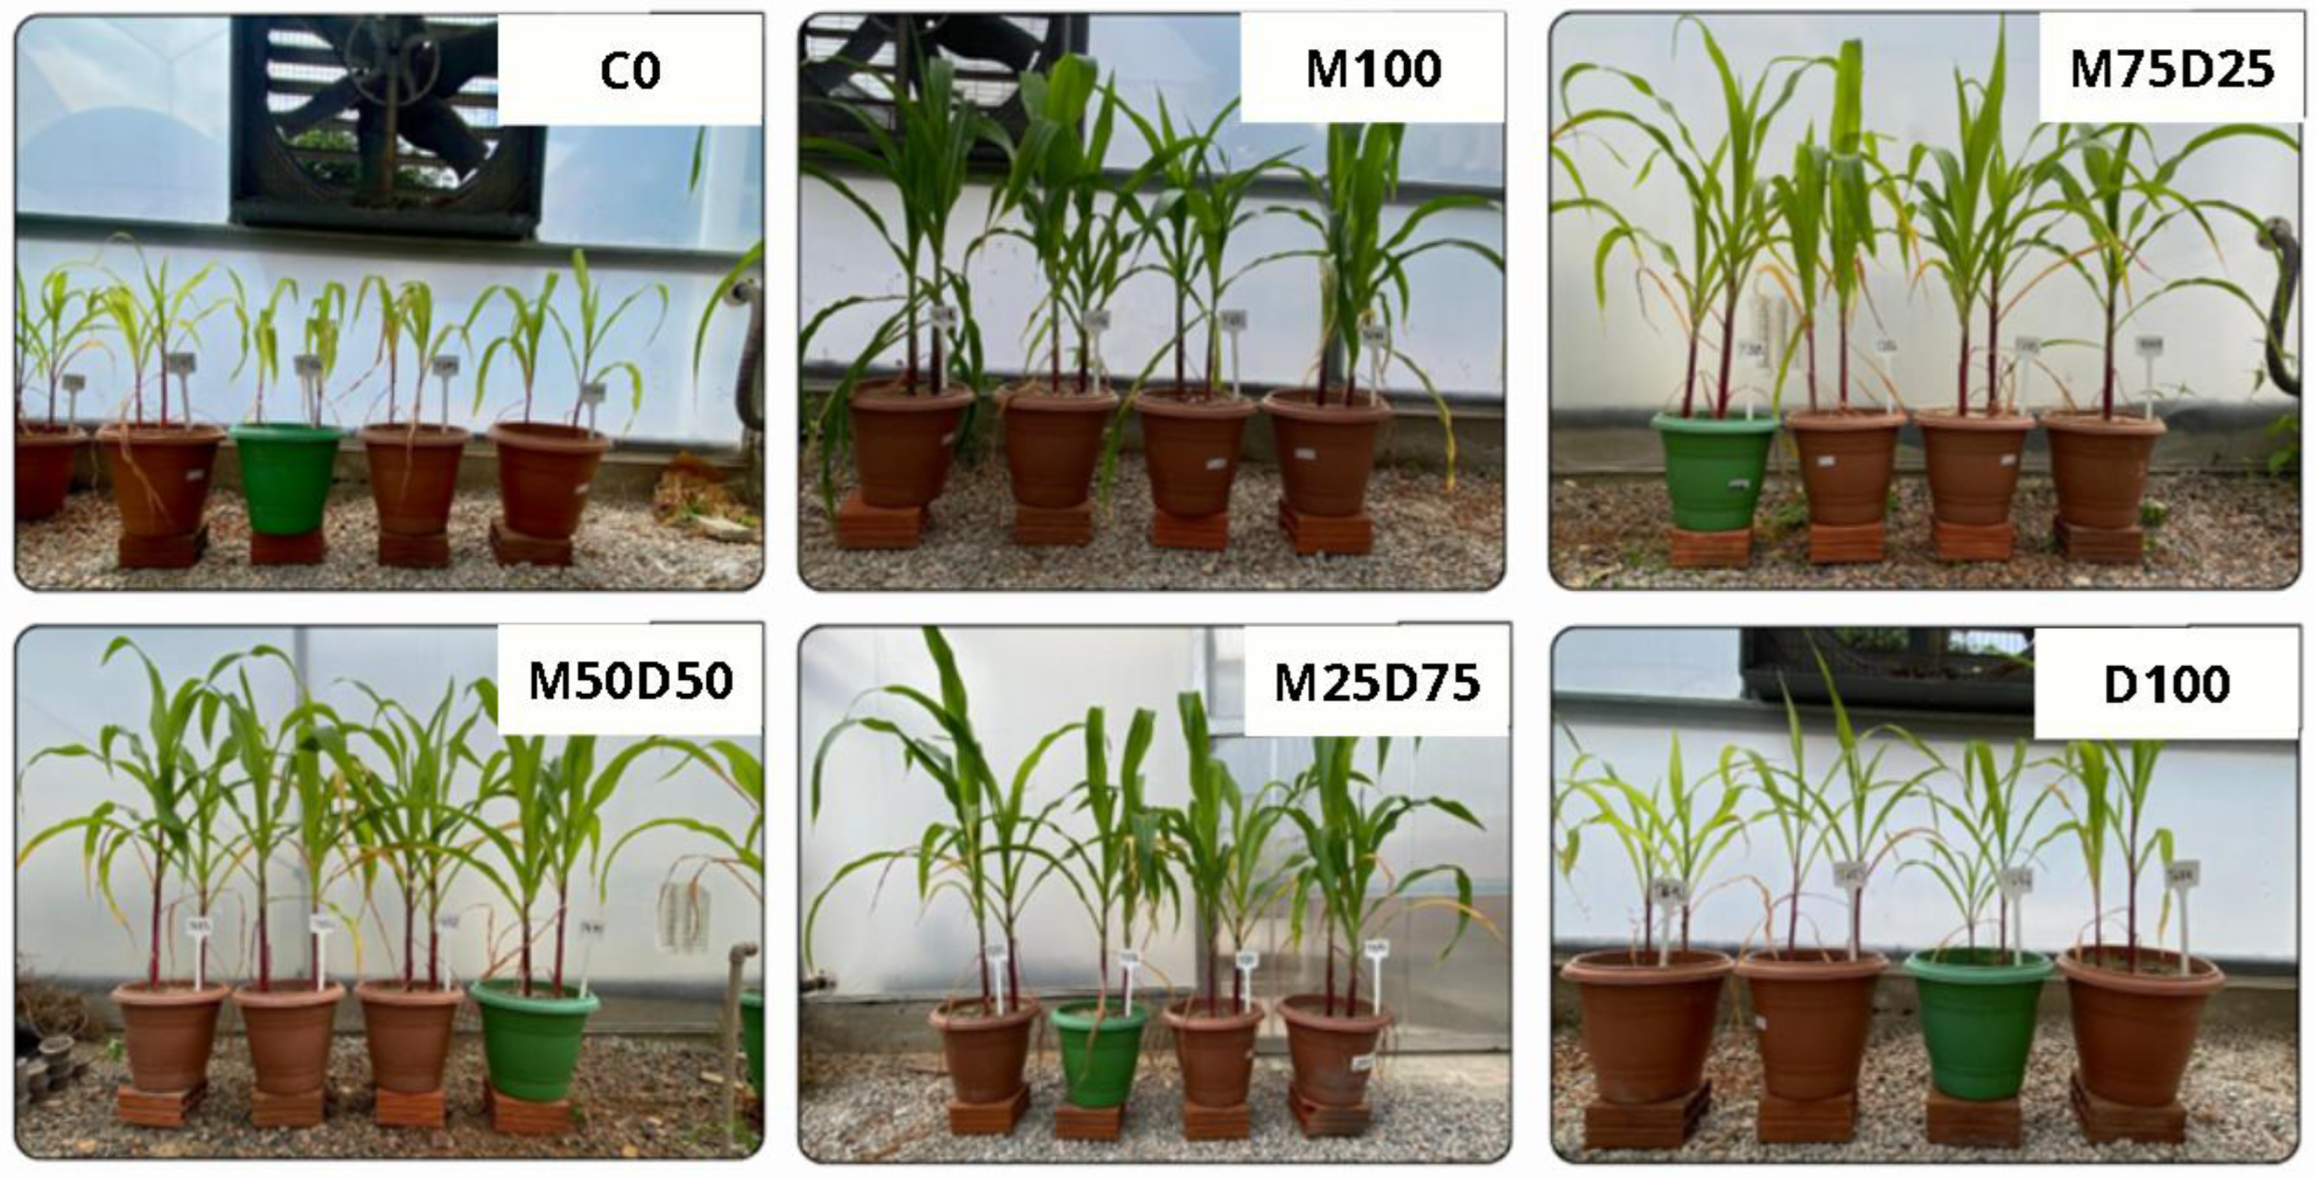
Figure 3.
Effects of mineral fertilizer replacement with food waste digestate on soil chemical fertility and sodicity indicators. Mean values of electrical conductivity (EC) (A), exchangeable sodium percentage (ESP) (B), cation exchange capacity (CEC) (C), base saturation (V%) (D), soil pH (E), and sodium (Na) concentra-tion (F) in the soil following the application of fertilizer formulations. Treatments corresponded to different pro-portions of mineral fertilizer and liquid digestate: unfertilized control (C0), 100% mineral fertilizer (M100), 75% mineral fertilizer + 25% liquid digestate (M75D25), 50% mineral fertilizer + 50% liquid digestate (M50D50), 25% mineral fertilizer + 75% liquid digestate (M25D75), and 100% liquid digestate (D100). Means followed by differ-ent letters indicate significant differences according to Tukey’s test at the 5% probability level. Vertical lines rep-resent the standard error of the mean.
Figure 3.
Effects of mineral fertilizer replacement with food waste digestate on soil chemical fertility and sodicity indicators. Mean values of electrical conductivity (EC) (A), exchangeable sodium percentage (ESP) (B), cation exchange capacity (CEC) (C), base saturation (V%) (D), soil pH (E), and sodium (Na) concentra-tion (F) in the soil following the application of fertilizer formulations. Treatments corresponded to different pro-portions of mineral fertilizer and liquid digestate: unfertilized control (C0), 100% mineral fertilizer (M100), 75% mineral fertilizer + 25% liquid digestate (M75D25), 50% mineral fertilizer + 50% liquid digestate (M50D50), 25% mineral fertilizer + 75% liquid digestate (M25D75), and 100% liquid digestate (D100). Means followed by differ-ent letters indicate significant differences according to Tukey’s test at the 5% probability level. Vertical lines rep-resent the standard error of the mean.
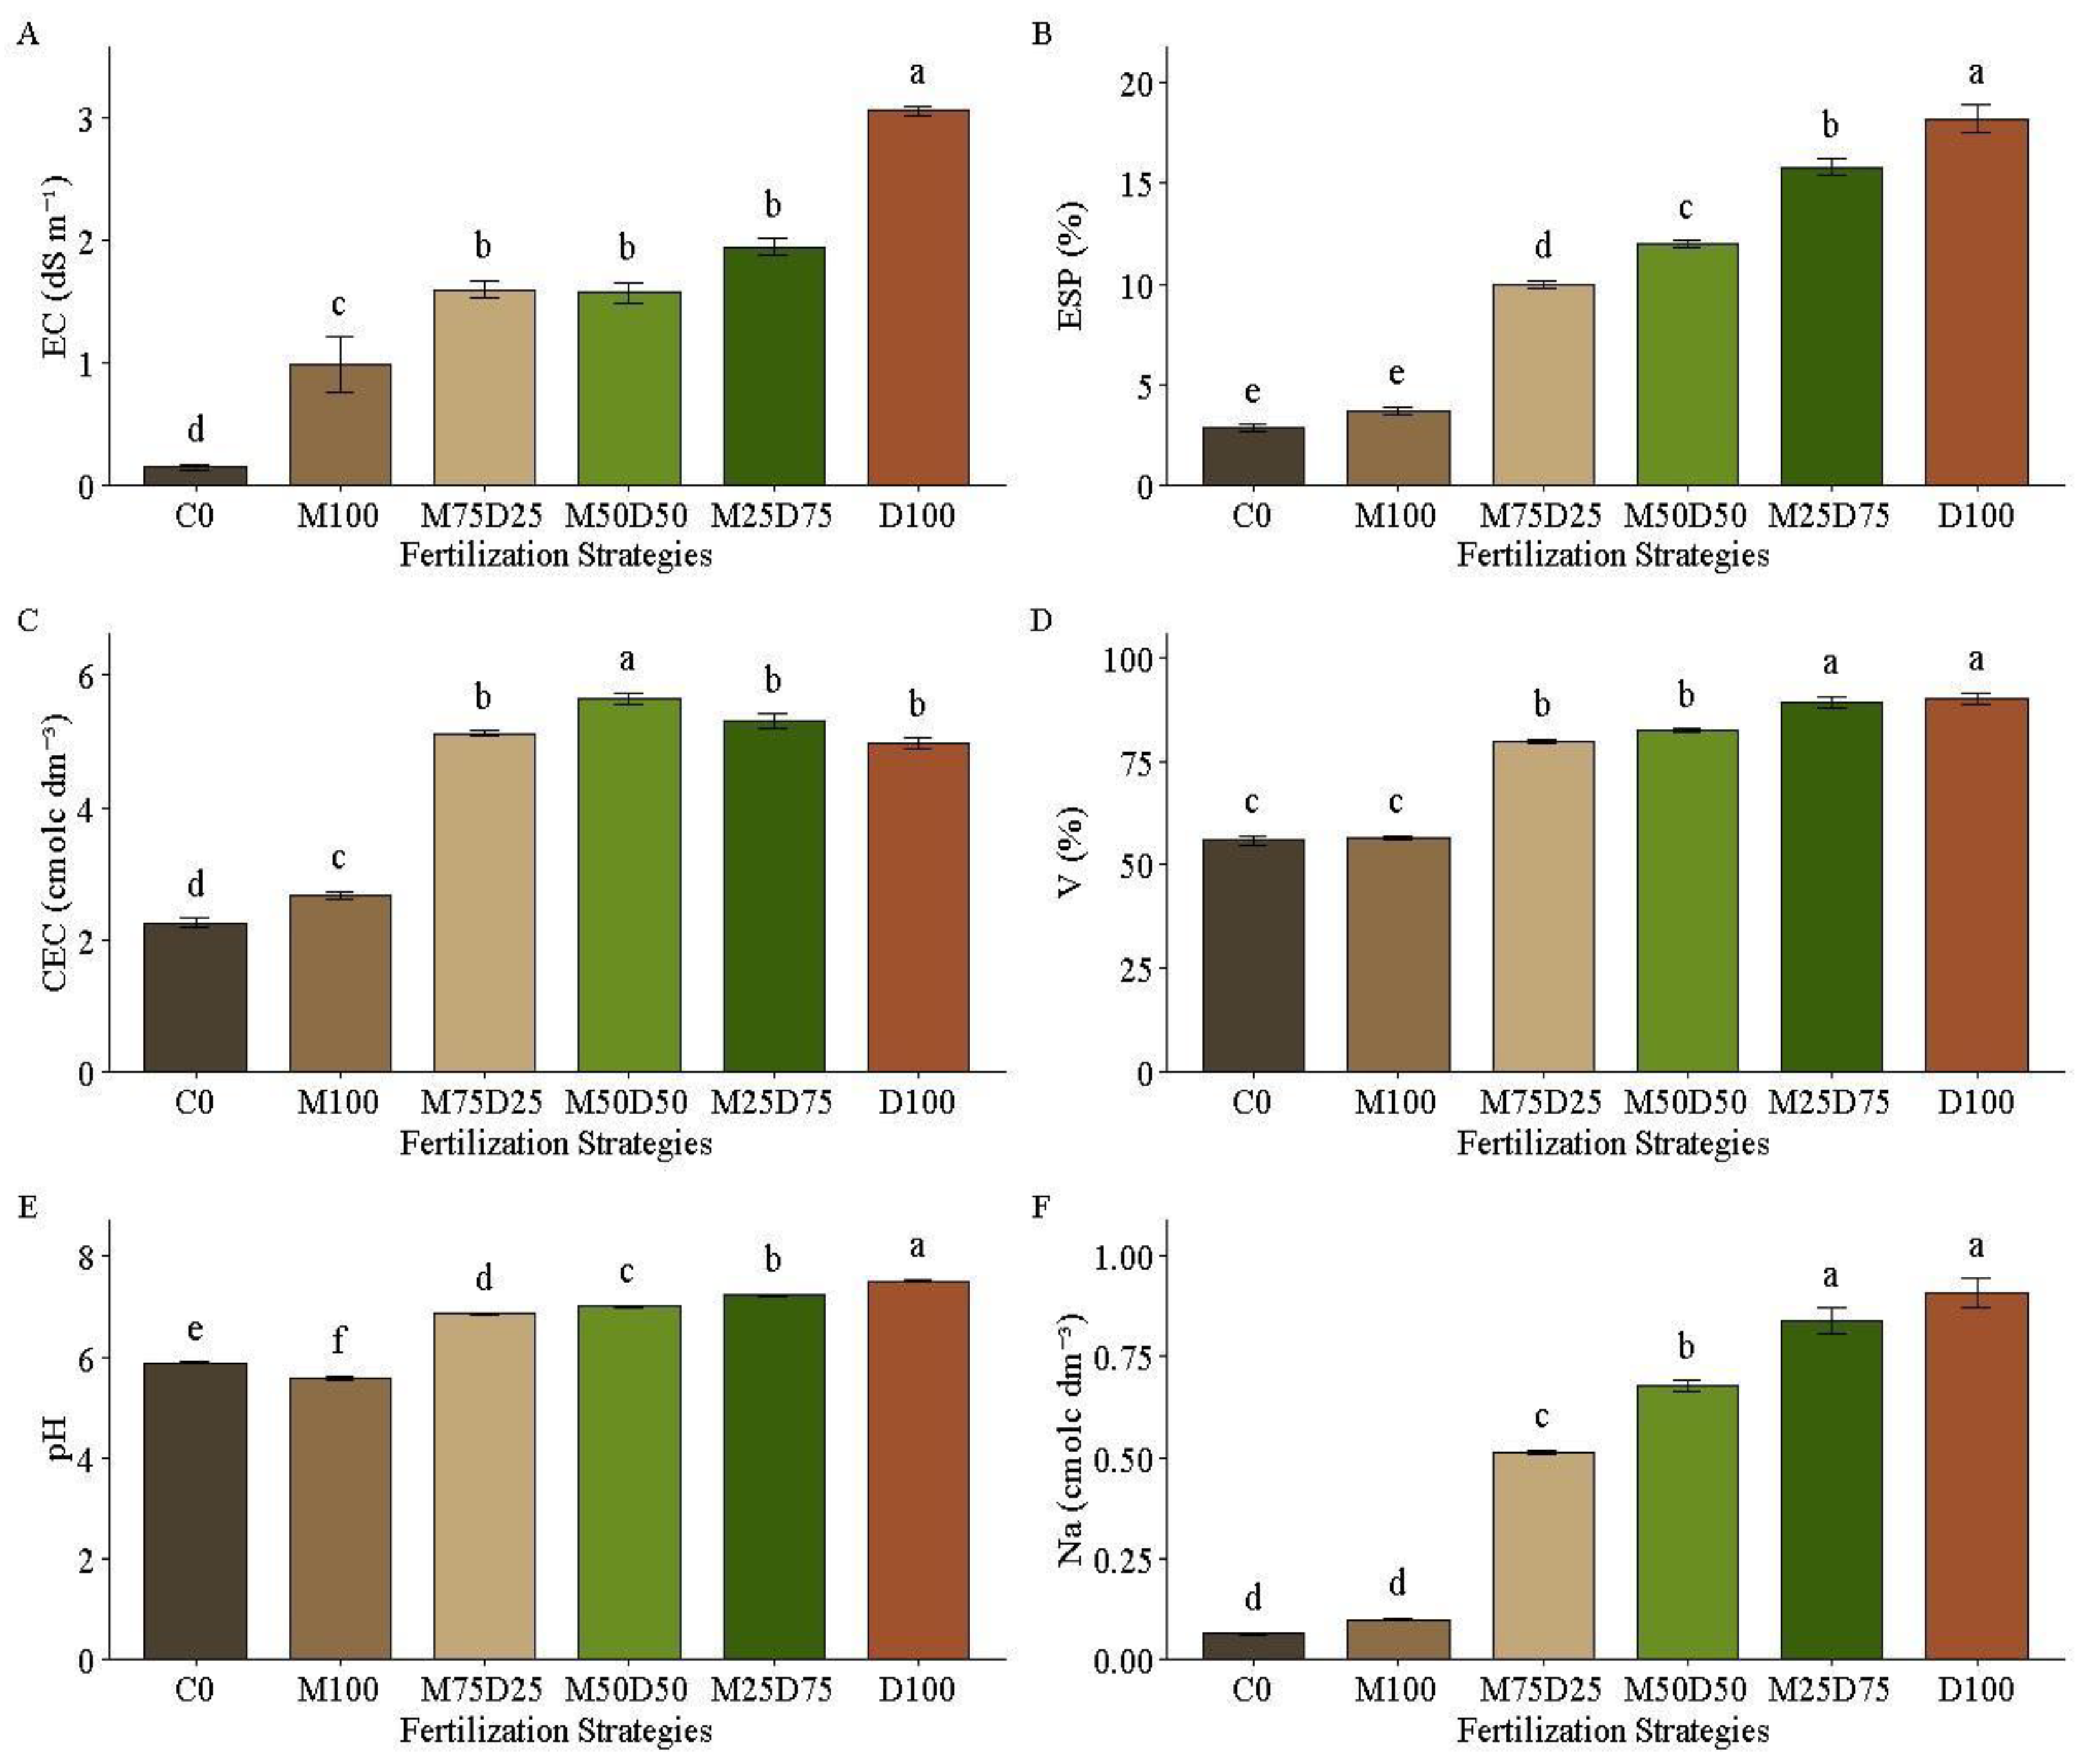
Figure 5.
Vegetative growth and biomass accumulation of maize under mineral fertilizer replace-ment with food waste digestate. Mean values of chlorophyll index (A), stem diameter (B), leaf number (C), plant height (D), and shoot dry matter (E) of maize plants following the application of fertilizer formulations. Treatments corresponded to different proportions of mineral fertilizer and liquid digestate: unfertilized control (C0), 100% mineral fertilizer (M100), 75% mineral fertilizer + 25% liquid digestate (M75D25), 50% mineral ferti-lizer + 50% liquid digestate (M50D50), 25% mineral fertilizer + 75% liquid digestate (M25D75), and 100% liquid digestate (D100). Means followed by different letters indicate significant differences according to Tukey’s test at the 5% probability level. Vertical lines represent the standard error of the mean.
Figure 5.
Vegetative growth and biomass accumulation of maize under mineral fertilizer replace-ment with food waste digestate. Mean values of chlorophyll index (A), stem diameter (B), leaf number (C), plant height (D), and shoot dry matter (E) of maize plants following the application of fertilizer formulations. Treatments corresponded to different proportions of mineral fertilizer and liquid digestate: unfertilized control (C0), 100% mineral fertilizer (M100), 75% mineral fertilizer + 25% liquid digestate (M75D25), 50% mineral ferti-lizer + 50% liquid digestate (M50D50), 25% mineral fertilizer + 75% liquid digestate (M25D75), and 100% liquid digestate (D100). Means followed by different letters indicate significant differences according to Tukey’s test at the 5% probability level. Vertical lines represent the standard error of the mean.
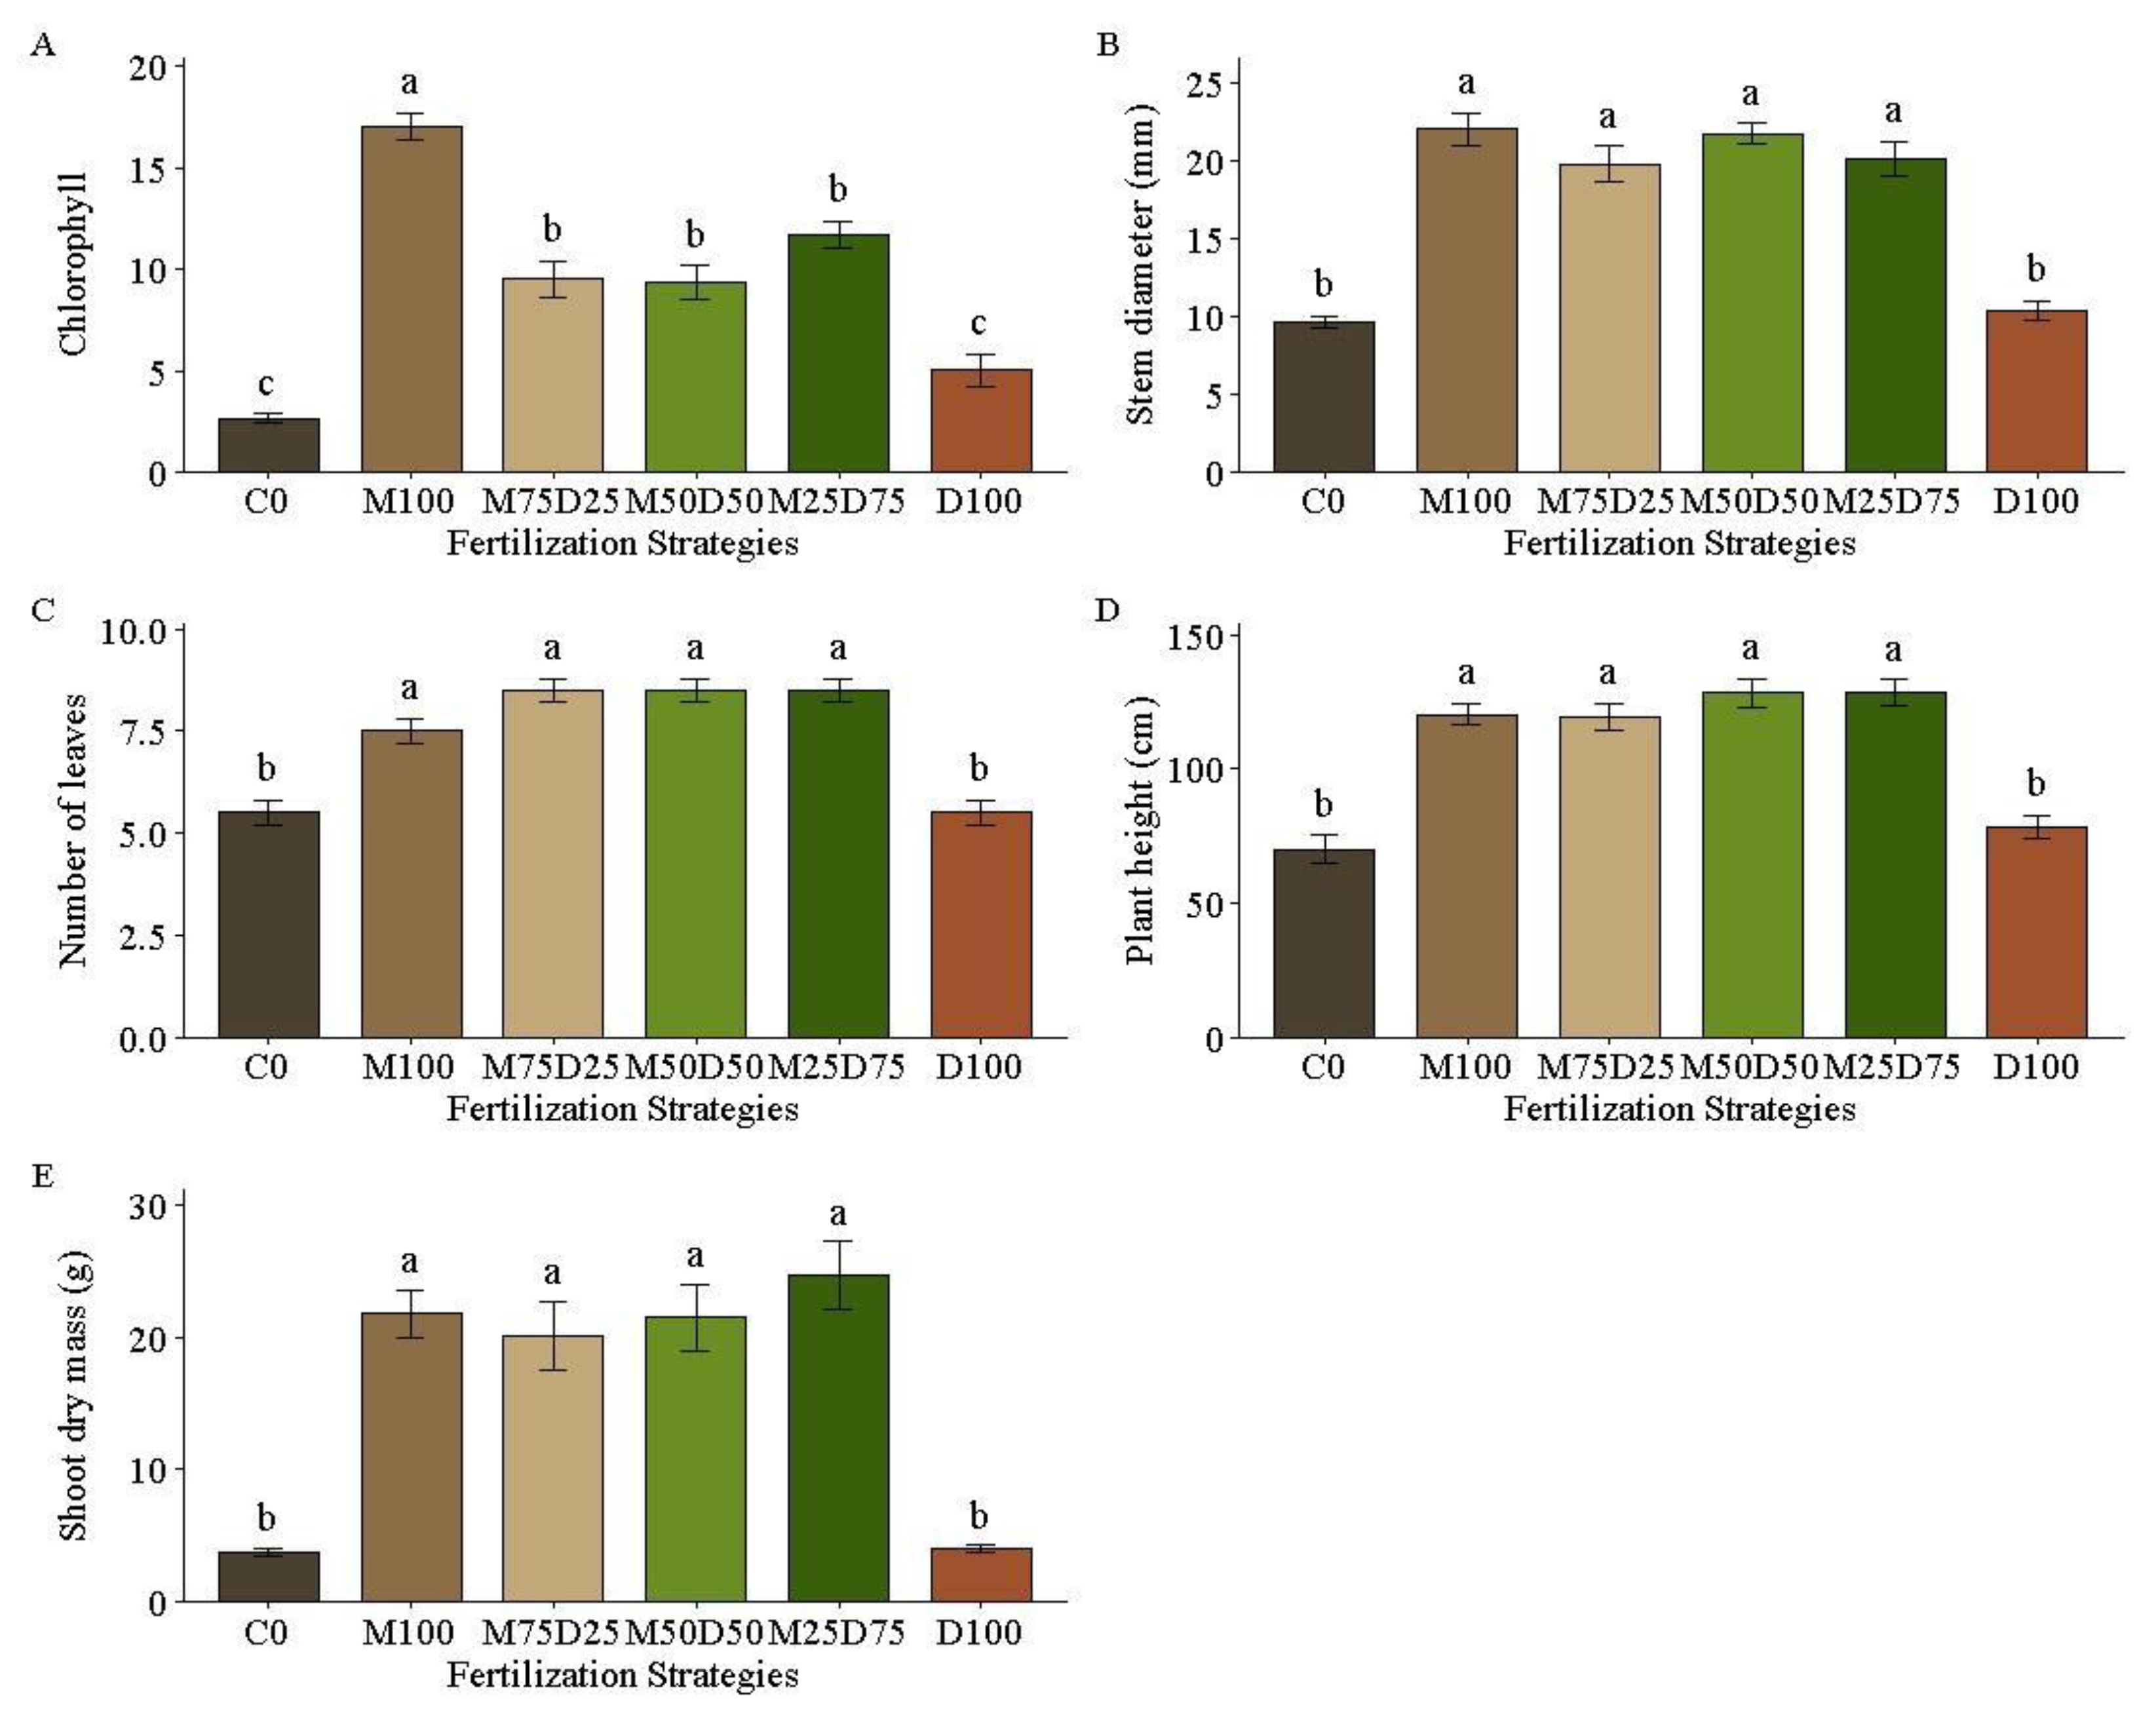
Figure 6.
Nutritional status of maize plants fertilized with different proportions of mineral fertilizer and food waste digestate. Mean concentrations of nitrogen (N) (A), phosphorus (P) (B), potassium (K) (C), calcium (Ca) (D), magnesium (Mg) (E), and sodium (Na) (F) in maize plants following the application of fertilizer formulations. Treatments corresponded to different proportions of mineral fertilizer and liquid digestate: unferti-lized control (C0), 100% mineral fertilizer (M100), 75% mineral fertilizer + 25% liquid digestate (M75D25), 50% mineral fertilizer + 50% liquid digestate (M50D50), 25% mineral fertilizer + 75% liquid digestate (M25D75), and 100% liquid digestate (D100). Means followed by different letters indicate significant differences according to Tukey’s test at the 5% probability level. Vertical lines represent the standard error of the mean.
Figure 6.
Nutritional status of maize plants fertilized with different proportions of mineral fertilizer and food waste digestate. Mean concentrations of nitrogen (N) (A), phosphorus (P) (B), potassium (K) (C), calcium (Ca) (D), magnesium (Mg) (E), and sodium (Na) (F) in maize plants following the application of fertilizer formulations. Treatments corresponded to different proportions of mineral fertilizer and liquid digestate: unferti-lized control (C0), 100% mineral fertilizer (M100), 75% mineral fertilizer + 25% liquid digestate (M75D25), 50% mineral fertilizer + 50% liquid digestate (M50D50), 25% mineral fertilizer + 75% liquid digestate (M25D75), and 100% liquid digestate (D100). Means followed by different letters indicate significant differences according to Tukey’s test at the 5% probability level. Vertical lines represent the standard error of the mean.
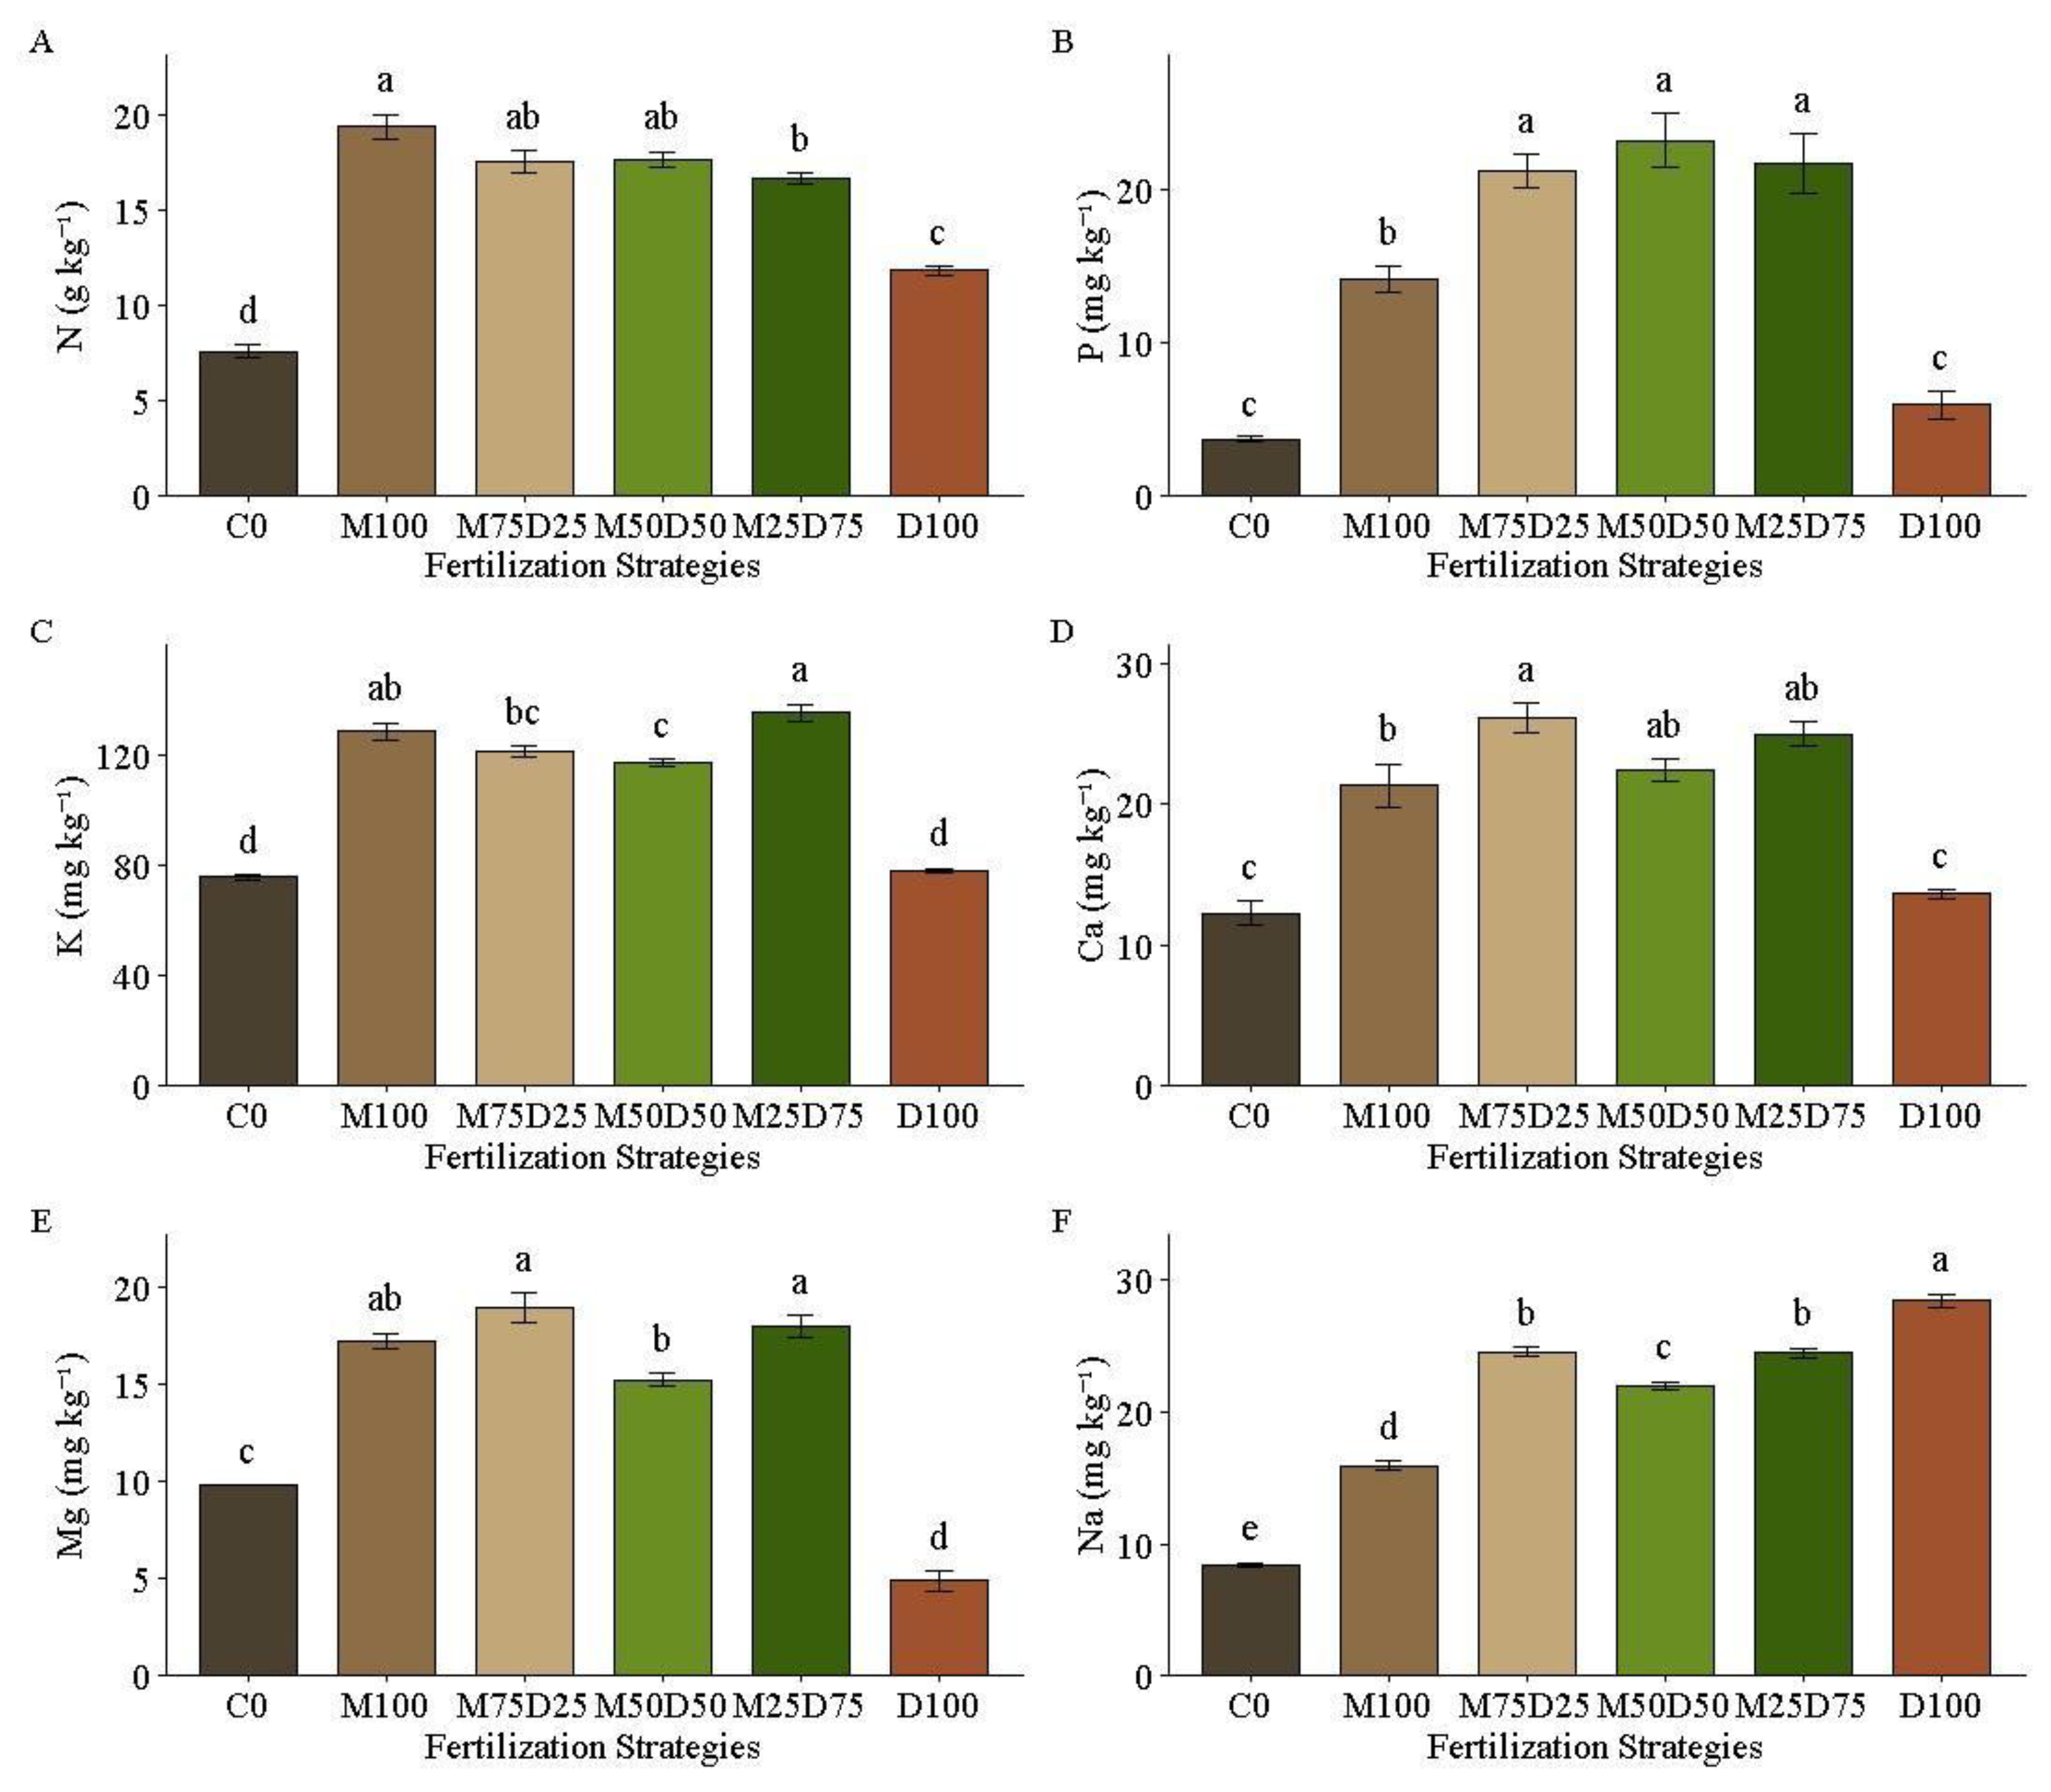
Figure 7.
Multivariate relationships among fertilization strategies, soil fertility, maize growth, and plant nutritional status. Principal component analysis PC1 vs PC2, with soil fertility variables (EC, ESP, CEC, pH, P, K, Ca, Mg) (A), chlorophyll (CH), growth (SD, LN, PH), shoot dry mass (DM) and leaf nutrient contents (N, P, K, Ca, Mg, and Na) (B) in maize plants subjected to fertilizer formulations.
Figure 7.
Multivariate relationships among fertilization strategies, soil fertility, maize growth, and plant nutritional status. Principal component analysis PC1 vs PC2, with soil fertility variables (EC, ESP, CEC, pH, P, K, Ca, Mg) (A), chlorophyll (CH), growth (SD, LN, PH), shoot dry mass (DM) and leaf nutrient contents (N, P, K, Ca, Mg, and Na) (B) in maize plants subjected to fertilizer formulations.
Disclaimer/Publisher’s Note: The statements, opinions and data contained in all publications are solely those of the individual author(s) and contributor(s) and not of MDPI and/or the editor(s). MDPI and/or the editor(s) disclaim responsibility for any injury to people or property resulting from any ideas, methods, instructions or products referred to in the content. |
© 2026 by the authors. Licensee MDPI, Basel, Switzerland. This article is an open access article distributed under the terms and conditions of the Creative Commons Attribution (CC BY) license.
Copyright: This open access article is published under a Creative Commons CC BY 4.0 license, which permit the free download, distribution, and reuse, provided that the author and preprint are cited in any reuse.