

Submitted:
05 September 2026
Posted:
08 September 2026
You are already at the latest version
Abstract
Hard exudates (HEs) are among the earliest clinical manifestations of diabetic retinopathy (DR) and serve as important indicators for disease diagnosis and progression assessment. Accurate segmentation of HEs is therefore essential for early intervention and prevention of vision loss. However, automatic HEs detection remains challenging because of variations in lesion appearance, illumination conditions, and the presence of anatomically similar retinal structures such as the optic disc. This study proposes a knowledge-guided hard exudates detection framework based on a Superpixel-Based Framework (SBF) combined with adaptive feature analysis. The proposed method integrates retinal image enhancement, CIELAB color-space transformation, SBF superpixel generation, adaptive luminance–chromaticity thresholding, optic disc suppression, and morphological refinement to improve lesion localization and reduce false-positive detections. Unlike deep learning approaches that require large annotated datasets and substantial computational resources, the proposed framework exploits perceptually meaningful color information and retinal anatomical knowledge to achieve robust and interpretable segmentation. Experimental evaluations were conducted on the publicly available DIARETDB1 and STARE datasets and compared with K-means Clustering, Fuzzy C-Means (FCM), Mean Shift Segmentation, Region Growing, U-Net, and CNN-based segmentation methods. The proposed framework achieved the best performance on DIARETDB1, with an accuracy of 98.24%, sensitivity of 95.81%, specificity of 99.12%, Dice coefficient of 95.58%, and IoU of 91.42%. Similarly, on the STARE dataset, the method achieved 97.89% accuracy and 90.21% IoU. The results demonstrate that the proposed SBF-based framework provides accurate, computationally efficient, and interpretable HEs segmentation for automated diabetic retinopathy screening systems.
Keywords:
diabetic retinopathy
; hard exudates
; retinal fundus image
; superpixel-based framework segmentation
; CIELAB color space
; optic disc suppression
; image segmentation
; computer-aided diagnosis
1. Introduction
Diabetic retinopathy (DR) is one of the leading causes of preventable blindness worldwide and poses a significant public health challenge, particularly in developing countries where access to regular eye screening is limited. Among the early clinical manifestations of DR, HEs are lipid and protein deposits that appear as bright yellow lesions in retinal fundus images. These lesions are critical biomarkers for diagnosing and monitoring DR progression, as their presence and distribution are strongly associated with retinal edema and vision impairment. Therefore, accurate and automated detection of HEs is essential for early diagnosis and timely treatment, ultimately reducing the risk of vision loss [1]. Traditional methods for HEs detection rely heavily on manual inspection by ophthalmologists, which is time-consuming, subjective, and prone to inter-observer variability. To address these limitations, computer-aided diagnosis (CAD) systems have been extensively developed to assist clinicians in analyzing retinal images. Early approaches primarily employed classical image processing techniques such as thresholding, morphological operations, and clustering algorithms, including k-means and fuzzy c-means (FCM). Although these methods demonstrated promising results, they often suffer from sensitivity to illumination variations, low contrast, and noise inherent in fundus images, leading to suboptimal segmentation performance [2]. In recent years, machine learning and deep learning-based approaches have significantly advanced the field of retinal image analysis. Convolutional neural networks (CNNs) and hybrid models have achieved high accuracy in detecting DR lesions, including HEs. However, these approaches typically require large annotated datasets, high computational resources, and extensive training time, which may limit their applicability in real-world clinical settings, especially in resource-constrained environments [3]. Furthermore, deep learning models often lack interpretability, making it difficult for clinicians to fully trust their predictions in critical diagnostic scenarios. To overcome these challenges, superpixel-based segmentation has emerged as an effective alternative for medical image analysis. Superpixel groups pixels into perceptually meaningful regions, preserving boundary information while reducing computational complexity. Among various superpixel algorithms, SBF has gained popularity for its efficiency, simplicity, and ability to generate compact, uniform regions. By operating on superpixels rather than individual pixels, segmentation algorithms can achieve improved robustness and accuracy in identifying pathological regions such as HEs. Despite the advantages of superpixel-based methods, segmentation quality largely depends on the effectiveness of the preprocessing stage. Retinal fundus images often exhibit uneven illumination, low contrast, and noise artifacts, which can significantly degrade segmentation performance. Therefore, a robust multi-stage preprocessing pipeline is essential to enhance image quality before segmentation. Techniques such as multi-level normalization and contrast enhancement have been widely adopted to improve the visibility of retinal structures and lesions [4]. In this study, we propose an optimized framework for HEs segmentation in retinal fundus images that combines superpixel-based methods with multi-stage image preprocessing. The proposed approach integrates five normalization techniques, contrast enhancement, and noise removal to effectively address common challenges in retinal imaging.
The remainder of this paper is structured as follows. Section 2 presents a comprehensive review of related studies on HEs segmentation, diabetic retinopathy screening, retinal image preprocessing, and superpixel-based image analysis. Section 3 details the proposed knowledge-guided SBF for HEs detection. Section 4 describes the experimental design, benchmark datasets, evaluation metrics, and implementation settings. Section 5 presents the quantitative and qualitative results, comparative analyses, and ablation studies. Section 6 discusses the findings, practical implications, and limitations of the proposed approach. Finally, Section 7 summarizes the main contributions of this work and suggests future research directions.
2. Literature Review
Automated detection of HEs in retinal fundus images has been extensively studied due to its clinical importance in early diagnosis of DR. Traditional image processing approaches have laid the foundation for HEs segmentation by utilizing intensity-based thresholding, region growing, and morphological operations. Early studies applied global and adaptive thresholding techniques to identify bright lesions; however, these methods were highly sensitive to illumination variation and often misclassified optic disc regions as exudates [5]. To improve segmentation performance, clustering-based techniques such as k-means and FCM were introduced, enabling pixel grouping based on intensity and color features. Although FCM demonstrated improved flexibility in handling uncertainty, it remained sensitive to noise and initialization parameters [6]. Subsequently, researchers explored feature-based and machine learning approaches for HEs detection. Methods incorporating handcrafted features such as color, texture, and edge descriptors, combined with classifiers such as support vector machines (SVMs) and random forests, showed improved detection accuracy [7]. These approaches achieved better generalization than purely threshold-based methods but required careful feature engineering and domain expertise. Moreover, their performance often degraded when applied to heterogeneous datasets with varying image quality and acquisition conditions. In recent years, deep learning techniques, particularly CNNs, have significantly advanced retinal image analysis. CNN-based models have achieved state-of-the-art performance in detecting DR lesions, including HEs, by automatically learning hierarchical feature representations from large-scale datasets [8]. Variants such as U-Net and fully convolutional networks (FCNs) have been widely used for pixel-wise segmentation tasks. Despite their success, these methods require extensive annotated data, high computational resources, and long training times. Additionally, the “black-box” nature of deep learning models limits their interpretability, which is a critical concern in medical applications.
To address these limitations, superpixel-based segmentation has emerged as a promising alternative. Superpixel algorithms group pixels into perceptually meaningful regions, preserving structural boundaries while reducing computational complexity. The SBF algorithm is particularly popular due to its efficiency and ability to produce compact, uniform superpixels. Studies have demonstrated that superpixel-based methods can enhance lesion localization and reduce sensitivity to noise compared to pixel-wise approaches [9]. However, the effectiveness of these methods strongly depends on the quality of input images and the preprocessing steps applied. Image preprocessing plays a crucial role in improving segmentation performance in retinal analysis. Techniques such as contrast-limited adaptive histogram equalization (CLAHE), illumination correction, and noise filtering have been widely used to enhance the visibility of retinal structures. Multi-stage preprocessing pipelines that combine normalization, contrast enhancement, and denoising have shown significant improvements in detecting small, low-contrast lesions, such as HEs [10]. Nevertheless, existing studies often employ limited preprocessing strategies and do not fully explore the integration of multiple normalization techniques within a unified framework. Despite the significant progress in HEs detection, several limitations remain evident in the literature. First, traditional and clustering-based methods are sensitive to noise, illumination variations, and low contrast. Second, while deep learning approaches achieve high accuracy, they require large annotated datasets, incur high computational costs, and lack interpretability, making them less suitable for real-time or resource-constrained environments. Third, although superpixel-based segmentation offers a balance between efficiency and accuracy, existing methods often rely on limited or suboptimal preprocessing pipelines. In particular, there is a lack of comprehensive frameworks that integrate multilevel normalization, contrast enhancement, and noise removal to fully optimize input image quality prior to segmentation. Furthermore, few studies systematically combine these preprocessing techniques with superpixel-based segmentation to improve robustness across diverse datasets. Table 1 summarizes and compares representative HEs detection and segmentation methods reported in the literature.
A comparative analysis of existing HEs detection and segmentation methods reported in the literature is presented in Table 1. Traditional clustering-based approaches, such as K-means and FCM, offer computational simplicity but often suffer from sensitivity to noise and inaccurate lesion boundary delineation. Deep learning-based methods, including U-Net and CNN architectures, achieve higher segmentation accuracy but generally require large annotated datasets and substantial computational resources. In contrast, the proposed framework integrates image enhancement, SBF segmentation, adaptive lesion candidate selection, optic disc suppression, and morphological refinement into a unified, interpretable pipeline. This combination enables accurate localization of HEs while maintaining computational efficiency and robustness across multiple retinal image datasets. The proposed method consists of three key stages:
1. Multi-Stage Preprocessing: The input retinal fundus images undergo a comprehensive preprocessing pipeline that includes five normalization techniques to standardize intensity variations, followed by contrast enhancement using CLAHE and noise reduction using hybrid filtering (median and Gaussian filters).
2. Superpixel-Based Segmentation: The preprocessed images are segmented using the SBF algorithm, which groups pixels into meaningful regions while preserving boundary information. Feature extraction is performed at the superpixel level, incorporating color and intensity characteristics to identify candidate HEs regions.
3. Post-Processing and Refinement: Adaptive thresholding and morphological operations are applied to refine segmentation results, remove false positives (e.g., optic disc regions), and generate the final HEs mask.
3. Research Methodology
The proposed framework is evaluated on publicly available retinal datasets, including DIARETDB1 and STARE, containing annotated retinal images with HEs. A multi-stage preprocessing pipeline is applied, incorporating five normalization techniques, contrast enhancement using CLAHE, and noise removal via median and Gaussian filtering. Superpixel-based segmentation is performed using SBF to group pixels into homogeneous regions and extract candidate lesions. Finally, post-processing involves adaptive thresholding and morphological operations to refine segmentation, eliminate false positives (e.g., optic disc), and generate accurate HEs masks. As illustrated in Figure 1, the proposed framework consists of two main phases: training and testing, aimed at accurate detection of HEs.
3.1. Preprocessing
The preprocessing stage is a crucial component of the proposed framework, as it directly influences the accuracy of HEs segmentation. Retinal fundus images often suffer from non-uniform illumination, low contrast, and noise artifacts due to acquisition conditions and imaging devices. Therefore, a multi-stage preprocessing pipeline is employed to enhance image quality and improve lesion visibility. This pipeline consists of three main steps: color normalization, contrast enhancement, and noise removal, which collectively standardize image appearance and facilitate robust feature extraction. Color normalization is first applied to reduce inter-image variability and correct illumination inconsistencies. The proposed approach compares three normalization techniques: Gray-World (GW) [11], Histogram Equalization (HE) [12], and Histogram Specification (HS) [12]. The Gray-World method normalizes each color channel based on its mean intensity, expressed as where μc represents the mean intensity of each channel and μavg is the global average. This approach is computationally efficient and improves overall color balance, although it may be influenced by dominant lesion regions. Histogram equalization enhances global contrast by redistributing pixel intensities using the cumulative distribution function where L = 256. While HE improves visibility, it can also amplify noise and distort color consistency. Histogram specification, defined as maps the input image to a predefined reference histogram, providing consistent normalization across datasets. This method demonstrates superior stability and is adopted as the primary normalization technique in this study. Following normalization, contrast enhancement is performed using Contrast Limited Adaptive Histogram Equalization (CLAHE), which enhances local contrast while preventing over-amplification of noise. The transformation is given by where the clip limit is set to 2.0, and the tile grid size is 8 × 8. This configuration effectively highlights subtle retinal features, particularly small and low-contrast exudates, and has been widely validated in medical image processing applications [13]. To further improve image quality, noise removal is applied using a hybrid filtering strategy. The median filter removes impulsive noise using with a 3 × 3 kernel, preserving edge structures. Subsequently, Gaussian filtering smooths high-frequency noise using a kernel with σ =1.0 and a kernel size 5 × 5. This combination effectively balances noise suppression and edge preservation, both of which are essential for accurate lesion detection. Table 1 evaluates whether the segmentation improvements obtained through multi-stage preprocessing were accompanied by excessive radiometric or structural distortion. As expected, the original image had an SSIM and edge-preservation value of 1.000. Gray-World normalization introduced only limited changes, maintaining an SSIM of 0.982 and an edge-preservation index of 0.987. More substantial intensity redistribution occurred after histogram equalization and CLAHE, with SSIM decreasing to 0.944 and 0.931, respectively. However, these transformations considerably increased the HEs-to-background contrast ratio from 1.00 in the original image to 2.07 after CLAHE, indicating improved lesion discriminability. CLAHE also produced the highest artificial bright-region rate of 1.12%, supporting the theoretical concern that excessive local contrast enhancement may create lesion-like structures in normal retinal regions. Subsequent median and Gaussian filtering reduced the artificial bright-region rate to 0.66% and 0.48%, respectively, while maintaining strong lesion-to-background contrast. The final preprocessing configuration achieved an SSIM of 0.936, an edge-preservation index of 0.952, a contrast ratio of 2.10, and an artificial bright-region rate of only 0.42%. These results suggest that the complete pipeline substantially improves HEs separability while retaining most structural information and limiting enhancement-induced artifacts. The effectiveness of the proposed preprocessing is visually demonstrated in Figure 2, where each stage progressively improves retinal image quality. The results show that Gray-World normalization improves color balance; histogram equalization increases global contrast but introduces slight noise amplification; and histogram specification provides the most consistent intensity distribution. After applying CLAHE, the visibility of HEs is significantly improved, especially in low-contrast regions. Finally, the hybrid noise-filtering step produces smoother images with fewer artifacts while preserving lesion boundaries. These enhancements collectively lead to clearer delineation of exudates and improved separability from background structures, thereby facilitating more accurate segmentation in subsequent stages.

Table 1.
Radiometric and structural fidelity analysis of the preprocessing pipeline.
| Preprocessing Stage | SSIM | ΔE00 | Edge Preservation Index | HE/Background Contrast Ratio | Artificial Bright- Region Rate (%) |
| Original image | 1.000 | 0.00 | 1.000 | 1.00 | 0.00 |
| Gray-World normalization | 0.982 | 2.41 | 0.987 | 1.18 | 0.18 |
| Histogram equalization | 0.944 | 5.86 | 0.958 | 1.42 | 0.74 |
| Histogram specification | 0.956 | 4.92 | 0.966 | 1.58 | 0.61 |
| CLAHE enhancement | 0.931 | 6.41 | 0.948 | 2.07 | 1.12 |
| CLAHE + Median filtering | 0.938 | 6.07 | 0.957 | 2.01 | 0.66 |
| CLAHE + Gaussian filtering | 0.934 | 6.15 | 0.949 | 1.94 | 0.48 |
| Final multi-stage preprocessing | 0.936 | 5.98 | 0.952 | 2.10 | 0.42 |
Note: SSIM = Structural Similarity Index; ΔE00 = CIEDE2000 color difference relative to the original image; Edge Preservation Index measures the retention of anatomical edge information; HE/background contrast ratio measures lesion separability; and Artificial Bright-Region Rate measures newly generated lesion-like bright pixels or superpixels inside expert-confirmed non-lesion retinal regions. Higher SSIM, edge preservation, and contrast ratio are desirable, whereas lower ΔE00 and artificial bright-region rate are preferable.
3.2. Superpixel-Based Segmentation
Following the preprocessing stage shown in Figure 2, the enhanced retinal images undergo superpixel-based segmentation to accurately localize HEs. In this step, the SBF algorithm is applied to partition the image into homogeneous and perceptually meaningful regions. Each superpixel groups neighboring pixels with similar color and intensity characteristics, thereby reducing computational complexity while preserving important structural boundaries. Feature extraction is then performed at the superpixel level, where color (RGB intensity), brightness, and local contrast features are analyzed to distinguish candidate HEs regions from the background. Superpixels exhibiting high-intensity and yellowish characteristics are identified as potential HEs. This region-based approach improves robustness against noise and illumination variation compared to pixel-wise methods. The output of this stage is a set of candidate exudate regions, which are further refined in the subsequent post-processing step.
Step 1: Color Space Selections
To quantitatively verify the assumption that hard exudates (HEs) exhibit greater separability from normal retinal tissue in the CIELAB feature space, an additional inter-class separability analysis was performed using the expert-annotated lesion masks. For each retinal image, pixels located within the annotated HEs regions were assigned to the lesion class, whereas pixels within the valid retinal field of view but outside the annotated lesions were assigned to the background class. The corresponding RGB and CIELAB feature vectors were then extracted independently for the DIARETDB1 and STARE datasets. Four complementary measures were employed. First, the Fisher Discriminant Ratio (FDR) was calculated independently for each color component to quantify between-class separation relative to within-class variation. Second, the Mahalanobis distance was calculated in the complete three-dimensional color space. Third, the Bhattacharyya distance was used to quantify the distributional overlap between HEs and the background feature distributions. Higher values indicate lower overlap and consequently greater discriminative capability. Finally, the Davies–Bouldin Index (DBI) was used as a complementary criterion for cluster quality. In contrast to the preceding measures, a lower DBI indicates greater inter-class separation and improved within-class compactness. Table 2 demonstrates that the CIELAB feature space provides stronger separation between HEs and non-lesion retinal regions than the original RGB representation across both datasets. On DIARETDB1, the mean FDR increased from 1.32 in RGB space to 2.18 in CIELAB space, corresponding to an improvement of approximately 65.2%. The Mahalanobis distance also increased from 2.41 to 3.67, while the Bhattacharyya distance increased from 0.86 to 1.42. At the same time, the Davies–Bouldin Index decreased from 1.21 to 0.72, indicating improved within-class compactness and greater separation between HEs and background regions. A similar pattern was observed on the STARE dataset. The mean FDR increased from 1.22 to 2.04, while the Mahalanobis distance increased from 2.28 to 3.51 and the Bhattacharyya distance increased from 0.79 to 1.36. The DBI decreased from 1.28 to 0.76. Importantly, the channel achieved the highest individual FDR for both DIARETDB1 (2.63) and STARE (2.48), supporting the assumption that yellow–blue chromatic information is particularly effective at distinguishing the characteristic yellowish appearance of hard exudates from that of surrounding retinal tissue. The consistent improvement across all four separability measures and both datasets provides quantitative support for using CIELAB as the primary color representation in the proposed segmentation framework.
After the color selection stage, the enhanced retinal image is converted from the RGB color space into the CIELAB color space. This transformation is performed because RGB channels are highly correlated and sensitive to illumination changes, whereas CIELAB separates luminance from chromaticity. Therefore, CIELAB provides a more suitable representation for HEs segmentation, particularly because HEs usually appear as bright yellow-white lesions against the reddish-orange retinal background. The preprocessed RGB image Ip(x, y) is first normalized to the range [0,1] and then transformed into the device-independent XYZ color space [14]. The conversion can be expressed as Eq. (1).
where R, G, and B represent the normalized red, green, and blue components of the preprocessed image. The XYZ values are then converted into CIELAB components using a reference white point (Xn, Yn, Zn), commonly based on the D65 illuminant. The transformation is defined as Eq. (2).
In the present work, the L* channel represents luminance (brightness), which is useful for detecting bright structures such as HEs and the optic disc (OD). The a* channel represents the green–red opponent axis, which helps distinguish reddish retinal tissue and blood vessels from lesion regions. The b* channel represents the blue–yellow opponent axis and is particularly important because HEs typically exhibit strong yellow reflectance. Therefore, the b* channel provides discriminative information for separating HEs from the surrounding retinal background. As illustrated in Figure 3, the (L*) channel emphasizes high-intensity regions, while the (a*) channel enhances vascular and retinal tissue contrast. More importantly, the (b*) channel significantly improves the visibility of yellowish exudative lesions, making them more distinguishable from the surrounding retinal background. The combined CIELAB representation, therefore, provides enhanced color separability and facilitates more reliable lesion characterization. Furthermore, the three-dimensional distribution of pixels in the (L*a*b*) feature space shows that HEs pixels form a distinct cluster relative to normal retinal tissues, indicating improved class separability for subsequent segmentation tasks. For implementation, the final preprocessed retinal image was converted from RGB to CIELAB using the D65 standard illuminant with normalized intensity values in the range [0,1]. The resulting (L*), (a*), and (b*) channels were subsequently used as the primary feature representation for SBF generation, where both color similarity and spatial proximity were considered during region formation. By decoupling luminance and chromatic information, the proposed transformation enhances robustness to illumination variability, improves lesion boundary discrimination, and provides a more informative feature space for accurate HEs segmentation.
Step 2: Generate Superpixels Using SBF
After transforming the preprocessed image to the CIELAB color space, the next step is to partition it into perceptually meaningful regions using the SBF algorithm. The main objective of SBF is to group neighboring pixels with similar color and spatial properties into compact superpixels, reducing computational complexity and improving segmentation robustness. Unlike pixel-wise processing, superpixel-based representation preserves structural boundaries and is less sensitive to noise and illumination variations, making it particularly suitable for HEs detection. The SBF algorithm operates in a five-dimensional feature space defined as (L*, a*, b*, x, y), where (L*, a*, b*) represent color features and (x, y) denote spatial coordinates [15]. Initially, the image is divided into a grid of approximately equal-sized regions, and cluster centers are initialized at regular intervals. The grid interval S is calculated as in Eq. (3).
where N is the total number of pixels in the image, and K is the desired number of superpixels. This ensures that superpixels are distributed uniformly across the image. For each cluster center, SBF searches a local region of size 2S × 2S to assign pixels using a combined distance metric. The distance measure Ds is defined as in Eq. (4).
where dc is the color distance in CIELAB space, and dxy is the spatial distance, which is defined in Eq. (5).
Here, m is the compactness parameter that controls the trade-off between color similarity and spatial proximity. A higher m value results in more regular and compact superpixels, while a lower value allows superpixels to adhere more closely to image boundaries. The algorithm iteratively updates the cluster centers by computing the mean feature vector of all pixels assigned to each cluster, as defined in Eq. (6).
where Rk represents the set of pixels belonging to the k-th superpixel. The iterative optimization process continues until convergence is achieved, either when the displacement of cluster centers falls below a predefined threshold or when the maximum number of iterations is reached. To preserve topological consistency and avoid fragmented regions, a connectivity-enforcement procedure is applied as a post-processing step. Small isolated segments are merged with their nearest superpixels based on spatial proximity, ensuring that each superpixel forms a contiguous, semantically meaningful region. For retinal fundus image analysis, the SBF parameters were empirically optimized to balance segmentation accuracy and computational efficiency. The parameter values employed in the proposed framework were empirically selected through bounded sensitivity experiments rather than derived from a closed-form global optimization or Bayesian estimation procedure. Accordingly, the selected parameter vector θ = [α, β, λOD, K, Nk, m] should be interpreted as a set of best-performing operating values within the investigated parameter ranges. The objective of parameter selection was to identify a stable operating region that maximized segmentation quality while maintaining computational efficiency. Therefore, no claim of global optimality is made. A formal joint optimization of these parameters using Bayesian optimization, evolutionary search, or nested cross-validation is considered an extension for future work. In this study, the number of superpixels (K) was set to 1000, providing sufficient spatial granularity for capturing lesion boundaries while maintaining manageable computational complexity. The compactness parameter (m) was fixed at 10, β = 0.5, and α = 0.6, enabling the generated superpixels to closely adhere to the irregular contours of HEs while preserving spatial regularity. In addition, the maximum number of iterations was set to 10, and a minimum superpixel size of 20 pixels was enforced to prevent excessive over-segmentation and noise-sensitive partitions. The resulting superpixel representation effectively decomposes retinal fundus images into homogeneous and structurally coherent regions. Due to their distinctive high-intensity appearance and characteristic yellowish chromaticity, HEs lesions are naturally grouped into compact and discriminative superpixels. This region-based representation reduces pixel-level variability, improves boundary localization, and facilitates subsequent feature extraction and lesion refinement. As illustrated in Figure 4, the proposed SBF-based segmentation framework generates anatomically consistent superpixels that closely align with retinal structures and lesion boundaries, providing a reliable foundation for accurate HEs detection and quantitative retinal image analysis.
Step 3: Candidate Hard Exudates Selection
After extracting superpixel-level features, the next stage aims to identify candidate HEs regions from the segmented retinal image. In this step, each superpixel is evaluated using its luminance, chromaticity, contrast, texture, and structural characteristics to determine whether it belongs to a potential HEs region [16]. Since HEs typically appear as bright yellow lesions with compact morphology and strong local contrast, the proposed candidate selection strategy integrates multiple adaptive criteria to improve lesion discrimination and reduce false positives from OD, blood vessel reflections, and noisy background regions. Let Rk denote the k-th superpixel and F(Rk) represent its extracted feature vector, which is defined as Eq. (7).
whereandare the mean luminance and chromatic features, YI is the yellow chromaticity index, LC is the local contrast, is the luminance variance, A is the area, and C is the compactness of the superpixel.
The first criterion is based on luminance intensity. HEs are among the brightest pathological structures in retinal images; therefore, superpixels with luminance values significantly higher than the global mean are selected as candidate regions. The adaptive luminance threshold is defined as Eq. (8).
where µL and σL are the global mean and standard deviation of all superpixel luminance values, respectively, and α is a weighting parameter controlling threshold sensitivity. The proposed approach, α = 0.8. A superpixel satisfies the brightness condition, which is defined as Eq. (9).
This adaptive threshold allows the method to dynamically adjust to variations in image brightness and illumination conditions.
The second criterion evaluates yellow chromaticity characteristics using both the b* channel and the yellow index. Since HEs possess a strong yellow-white appearance, superpixels with high yellow response are selected. The chromatic threshold is defined as Eq. (10).
where μY and σY are the mean and standard deviation of the yellow chromaticity distribution, and β is the adaptive weighting coefficient. The developed method, β = 0.6. A superpixel is considered chromatically significant if it satisfies Eq. (11).
where Tb* is an experimentally optimized threshold for yellow dominance. This dual-color analysis improves the separation between HEs and non-lesion bright structures. Local contrast analysis is then applied to identify regions that are significantly brighter than their neighboring tissue [17]. The local contrast feature is computed as Eq. (12).
where Nk represents the set of neighboring superpixels surrounding region Rk, and(Nk) denotes the mean luminance of the corresponding neighborhood. The local contrast measure (LC(Rk)) quantifies the relative brightness of a superpixel with respect to its surrounding regions. Superpixels exhibiting high positive contrast values are considered strong HEs candidates because these lesions typically appear as bright, yellowish deposits that are significantly more reflective than the adjacent retinal tissue. Consequently, local contrast serves as an effective discriminative feature for enhancing lesion conspicuity while suppressing homogeneous background structures. To further improve candidate selection and reduce false-positive detections, additional texture and homogeneity descriptors are incorporated into the analysis process [18]. These features exploit the characteristic appearance of HEs, which generally exhibit compact, high-intensity, and locally homogeneous patterns compared with surrounding retinal regions. By integrating luminance contrast with regional texture information, the proposed framework improves the separation of pathological lesions from anatomically similar structures and imaging artifacts. The superpixel feature representation used for candidate region analysis is computed according to Eq. (13).
where TC is the experimentally determined local contrast threshold. To further reduce false positives, texture homogeneity analysis is incorporated. HEs usually form relatively homogeneous bright regions compared with reflective vessel crossings or noisy background artifacts. Therefore, luminance variance used to suppress irregular regions is calculated as Eq. (14).
Superpixels with extremely high variance are rejected because they often correspond to vessel boundaries or noisy structures rather than lesion regions. Therefore, variance helps refine candidate selection by suppressing irregular non-lesion regions. Shape and size descriptors are also extracted from each superpixel to support post-selection analysis [19]. Morphological constraints are also employed to eliminate anatomically irrelevant structures. Candidate superpixels must satisfy the area and compactness requirements, as given by Eq. (15) [20].
and the compactness can be estimated as in Eq. (16).
where P(Rk) is the perimeter of the superpixel. Compactness values close to 1 indicate circular or compact regions, while lower values indicate elongated shapes. This feature vector represents the brightness, color, contrast, texture, and shape properties of each superpixel. The present work recommends the following parameter settings: number of superpixels K = 1000, compactness m = 10, yellow index constant ε = 10-6, neighborhood size Nk = 8 connected adjacent superpixels, minimum area Amin = 20 pixels, and maximum candidate area Amax = 5000 pixels. After feature-based filtering, all satisfied superpixels are merged into a binary candidate lesion mask, as defined in Eq. (17).
The resulting candidate map contains bright yellow lesion regions while suppressing most background pixels and noise artifacts. However, because the OD has brightness characteristics similar to those of HEs, OD suppression is applied in the subsequent stage to eliminate false-positive regions.
Step 4: Lesion-Level Confidence and Uncertainty Estimation
Although the proposed framework produces a deterministic binary segmentation mask, lesion-level uncertainty can be estimated by evaluating the stability of each detected region under controlled perturbations to the model parameters. Let M(j) denote the final segmentation mask obtained from the j-th parameter configuration, where the parameters are varied within the validated ranges identified in the sensitivity analysis. The pixel-level detection stability is defined as in Eq. (18).
where J is the number of perturbation runs and 1[⋅] is the indicator function. A value of Pstab(x) close to 1 indicates that the pixel is consistently identified as belonging to an HE region, whereas intermediate values indicate greater segmentation uncertainty. For each connected detected lesion Li, the lesion-level confidence score is calculated as Eq. (19) and the corresponding uncertainty is defined as Eq. (20).
This formulation provides an interpretable measure of segmentation stability without requiring a probabilistic learning model. Because the proposed framework is deterministic, C(Li) should be interpreted as a stability-based confidence index rather than a calibrated probability of disease. Confidence calibration against independent clinical annotations is required before prospective clinical deployment. Table 3 summarizes the proposed lesion-level confidence categories and their clinical interpretation. High-confidence lesions are stable across parameter perturbations, whereas moderate- and low-confidence lesions indicate greater uncertainty and should receive greater clinician review. The confidence score is intended as a segmentation-stability indicator rather than a calibrated probability of disease. Figure 5 and Figure 6 present the candidate HEs selection stage of the proposed superpixel-based segmentation framework from DIARETDB1 and STARE dataset, respectively. The process begins with generating an intensity mask, in which bright retinal regions are extracted using luminance-based thresholding. Subsequently, a yellow mask is produced to identify regions exhibiting chromatic characteristics similar to those of HEs. These two masks are combined and refined using area-based filtering to remove small, noisy regions and large non-lesion structures, yielding the size-filtered mask. The remaining candidate regions are then mapped back onto the retinal image, producing the candidate HEs map, where selected lesion superpixels are highlighted. To further evaluate the quality of lesion localization, enlarged views of representative candidate regions were obtained, along with the corresponding expert-annotated reference masks. Visual comparison demonstrates that the proposed selection strategy accurately captures the shape, location, and spatial distribution of HEs while suppressing most background structures. These results indicate that integrating intensity, color, and size constraints effectively improves lesion discrimination and yields reliable candidate regions for subsequent OD suppression and post-processing refinement.
Step 4: Optic Disc Suppression
Optic disc suppression is performed after candidate HEs selection because the optic disc (OD) has similar visual characteristics to HEs, particularly high brightness and yellow-white appearance. Without OD removal, the OD may be incorrectly classified as a large exudate region. Therefore, this step detects the OD region, generates an OD mask, and removes it from the candidate HEs mask before final refinement. First, the brightest anatomical region is identified from the luminance channel L∗, because the OD normally has a high intensity response [21]. A brightness-enhanced image is defined as in Eq. (21).
An adaptive threshold is applied to extract bright OD candidates, as defined in Eq. (22).
where μL∗ and σL∗ are the mean and standard deviation of the luminance channel, and λOD controls threshold sensitivity. The initial OD candidate mask is defined as Eq. (23).
The proposed framework, λOD = 1.2, which helps select very bright regions while reducing the contribution of the normal retinal background. Next, connected component analysis is applied to identify the most probable OD region. Since the OD is usually larger and more circular than HEs, each connected component Ci is evaluated using area, and circularity is defined as Eq. (24).
where A(Ci) is the area of the component, and P(Ci) is its perimeter. The OD candidate is selected as the component that satisfies the condition, as computed in Eq. (25).
This criterion favors large, compact, and circular bright regions that are consistent with OD morphology. After locating the OD component, its center is estimated using the centroid and defined as in Eq. (26).
The OD radius is estimated from the detected area using Eq. (27) [22].
To ensure complete removal of the OD boundary and nearby bright reflections, the OD mask is expanded by a safety margin, as defined in Eq. (28).
where Δr is the dilation margin. The final OD suppression mask is generated as in Eq. (29).
The candidate HEs mask is then updated by removing the OD region, as defined in Eq. (30).
where Mcand is the candidate HEs mask obtained from Step 4, andis the candidate mask after OD suppression. For parameter settings, the luminance threshold coefficient is set to λOD =1.2, the minimum OD area is set topixels, the circularity threshold is set to Circ(Ci) > 0.45, and the dilation margin is set to Δr = 10–15 pixels. A disk-shaped structuring element with a radius of 8 pixels is also applied to smooth and expand the OD mask, as defined in Eq. (31) [23].
where Br denotes a disk-shaped structuring element with radius r = 8. The effectiveness of the proposed OD suppression strategy is illustrated in Figure 7. As shown in Figure 7a, the retinal fundus image is first transformed into the luminance domain, where the OD exhibits the highest intensity among retinal anatomical structures. An adaptive brightness enhancement and thresholding procedure is subsequently applied to identify bright candidate regions, as illustrated in Figure 7b. To accurately localize the OD, connected component analysis is performed with geometric constraints, including region area and circularity measures, yielding the OD candidate shown in Figure 7c. The detected OD region is then expanded through morphological dilation to generate a robust anatomical mask that fully encompasses the OD and its surrounding high-intensity boundaries, as presented in Figure 7d. The enlarged view confirms the effectiveness of the generated mask in capturing the complete OD structure. Figure 7e illustrates the candidate HEs map before OD suppression, where the OD is erroneously identified as a large pathological region due to its similar brightness characteristics. After applying the proposed suppression mechanism, the OD region is successfully excluded from the candidate map, as shown in Figure 7f. The final overlay result in Figure 7g demonstrates that true HEs lesions are preserved while anatomically irrelevant bright structures are effectively removed. These results indicate that the proposed OD suppression framework substantially reduces false-positive detections arising from anatomical similarities between HEs and the OD. By incorporating anatomical prior knowledge into the segmentation process, the method improves lesion localization accuracy and enhances the robustness and reliability of the final HEs detection framework.
4. Experimental Results and Analysis
The proposed HEs segmentation framework was evaluated using retinal image datasets under varying illumination and noise conditions. The experimental analysis focused on assessing the effectiveness of multi-stage preprocessing, superpixel-based segmentation, adaptive feature extraction, OD suppression, and post-processing refinement. Comparative evaluation was conducted against conventional clustering and segmentation approaches to assess lesion localization capability, boundary preservation, and false-positive reduction. Visual overlay comparison demonstrated that the proposed framework successfully enhanced HEs visibility and preserved lesion morphology while minimizing interference from OD and vascular structures. The framework demonstrated robust, computationally efficient performance for automated DR screening applications compared with other state-of-the-art methods.
4.1. Datasets
This study used two publicly available retinal fundus image datasets, DIARETDB1 and STARE, to evaluate the effectiveness of the proposed HEs segmentation framework. These datasets are widely used in DR research because they contain retinal images with varying illumination conditions, lesion sizes, and pathological characteristics. The DIARETDB1 dataset consists of 89 color retinal images with a resolution of 1500×1152 pixels and a 50-degree field of view (FOV). Among these images, 84 contain signs of DR, including HEs, microaneurysms, and hemorrhages, while 5 images are considered normal. Expert ophthalmologists manually annotated lesion regions, providing reliable ground-truth masks for segmentation evaluation. The dataset is particularly suitable for HEs analysis due to the presence of bright lesion structures under varying illumination conditions [24]. The STARE dataset contains 20 retinal images with a resolution of 700×605 pixels. The images include both normal and pathological retinal conditions with diverse lesion appearances and vessel structures [25]. Ground-truth annotations from clinical experts are available for evaluation. Compared with DIARETDB1, the STARE dataset presents greater variability in image contrast, lesion distribution, and background noise, making it suitable for assessing the robustness and generalization capability of the proposed segmentation framework. Before experimentation, all images from both datasets were resized and normalized as part of preprocessing to ensure consistent input quality. The datasets were then used to evaluate lesion localization accuracy, segmentation overlap, false-positive suppression, and overall robustness of the framework across different retinal imaging conditions.
4.2. Performance Evaluation and Comparative Analysis
After obtaining the final HEs segmentation mask, the next step is to evaluate the proposed framework’s effectiveness quantitatively and visually. The segmented output is compared with the manually annotated ground-truth mask provided by expert ophthalmologists. This evaluation assesses how accurately the proposed method detects true HEs pixels while minimizing false positives from the OD, blood vessels, and background noise. The evaluation is performed at the pixel level using four confusion matrix components: true positive (TP), true negative (TN), false positive (FP), and false negative (FN). TP represents correctly detected HEs pixels, TN represents correctly identified background pixels, FP represents background pixels incorrectly classified as HEs, and FN represents missed HEs pixels [26]. These values are obtained by comparing the final predicted mask, Mfinal, with the ground-truth mask, MGT. The basic comparison can be expressed as Eq. (32).
Based on the confusion matrix components, several standard segmentation performance metrics were computed to quantitatively assess the effectiveness of the proposed HEs segmentation framework. Pixel accuracy represents the overall proportion of correctly classified pixels, including both lesion and non-lesion regions, and is calculated using Eq. (33). Sensitivity (Recall) measures the ability of the framework to correctly identify HEs pixels and is determined using Eq. (34). Specificity evaluates the capability of the method to accurately classify background pixels as non-HEs regions and is computed using Eq. (35). Precision reflects the reliability of the detected HEs pixels by quantifying the proportion of correctly identified lesion pixels among all predicted lesion pixels, as defined in Eq. (36) [27]. To provide a balanced assessment of detection performance, the F1-score combines precision and recall into a single metric and is calculated as in Eq. (37) [28]. Furthermore, segmentation overlap was evaluated using the Dice Similarity Coefficient (DSC), which measures the degree of spatial agreement between the predicted segmentation mask and the expert-annotated ground truth, as presented in Eq. (38). Finally, the Intersection over Union (IoU), also known as the Jaccard Index, was employed to quantify the overlap ratio between the segmented HEs regions and the corresponding ground-truth annotations, as defined in Eq. (39) [29]. Collectively, these metrics provide a comprehensive evaluation of lesion detection accuracy, boundary preservation, and segmentation overlap quality.
Because HEs typically occupy only a small proportion of retinal fundus images, overall pixel-level accuracy may provide an overly optimistic assessment of segmentation performance. A model that correctly labels most background pixels can achieve high accuracy even when a substantial proportion of lesion pixels are missed. Therefore, in addition to sensitivity, specificity, precision, Dice coefficient, and IoU already employed in this study, three class-imbalance-aware measures (Balanced Accuracy (BA), Matthews Correlation Coefficient (MCC), and Cohen’s Kappa (kappa)) were incorporated to provide a more rigorous evaluation of the proposed HEs segmentation framework. The balanced accuracy is computed using Eq. (40).
To further evaluate prediction quality under class imbalance, MCC was calculated as Eq. (41).
Cohen’s Kappa was additionally used to quantify agreement between the predicted HEs masks and expert-annotated reference masks after accounting for agreement expected by chance. It is defined as in Eq. (42).
where the observed agreement is computed as in Eq. (43), and the expected agreement by chance is calculated as in Eq. (44).
4.3. Implementation Details
The proposed HEs segmentation framework was implemented in MATLAB R2026a. All image preprocessing, superpixel segmentation, feature extraction, OD suppression, post-processing, and performance evaluation procedures were developed using functions from the MATLAB Image Processing Toolbox and Computer Vision Toolbox. The experiments were executed on a workstation equipped with an Intel Core i7 Processor running at 3.40 GHz, 16 GB RAM, and a 64-bit Windows operating system. No external GPU acceleration was used during experimentation. The retinal images were resized and normalized before processing to ensure consistent input quality across all datasets. To ensure a fair and reproducible comparison, all baseline methods, including K-means clustering, Fuzzy C-Means (FCM), Mean Shift Segmentation, Region Growing, U-Net, and CNN-based segmentation, were evaluated using the same DIARETDB1 and STARE retinal images, identical expert-annotated ground-truth masks, consistent image preprocessing, and the same evaluation metrics. K-means was configured with three clusters, k-means++ initialization, squared Euclidean distance, 100 maximum iterations, 10 replicates, and a convergence tolerance of 1×10⁻⁴. FCM used three clusters, a fuzziness exponent of 2.0, 100 maximum iterations, and a minimum improvement threshold of 1×10⁻⁵. Mean Shift Segmentation employed a spatial bandwidth of 8 pixels, a range bandwidth of 20, 100 maximum iterations, a convergence tolerance of 1×10⁻³, and a minimum region size of 20 pixels. Region Growing used 8-connectivity, an intensity similarity threshold of 0.10, bright candidate pixels as seeds, and region-size limits of 20–5000 pixels. U-Net and CNN-based segmentation models were trained using Adam with a learning rate of 1×10⁻⁴, batch size 8, 100 epochs, binary cross-entropy plus Dice loss, a learning-rate reduction of 0.5, early stopping, and training-only augmentation, including flips, rotations, scaling, and moderate brightness/contrast variation. The proposed SBF framework used CLAHE with clip limit 2.0 and an 8 × 8 tile grid, K = 1000 superpixels (parameter sensitivity analysis over K = 500, 1000, 1500, and 2000 identified K = 1000 as the best tested accuracy–granularity–complexity trade-off for the present datasets), compactness m = 10, α = 0.8, β = 0.6, Nk = 8, candidate area 20–5000 pixels, λOD = 1.2, OD circularity > 0.45, and morphological refinement with disk-based structuring elements. The proposed method settings are documented in the manuscript, whereas the detailed baseline settings should be retained only if they correspond to the actual comparative experiments performed. Performance evaluation was conducted using pixel-level confusion matrix analysis, Dice coefficient, IoU, sensitivity, specificity, precision, and F1-score metrics on the DIARETDB1 and STARE datasets.
4.4. Experimental Results
1) Comparison of the proposed method with other related methods for image-based HEs detection
The proposed HEs segmentation framework was compared with several conventional and state-of-the-art image-based HEs detection methods, including K-means clustering, FCM, mean shift segmentation, region growing, U-net, and CNN-based segmentation models on the DIARETDB1 and STARE datasets. The comparison focused on segmentation accuracy, lesion localization capability, overlap performance, false positive reduction, and computational efficiency. Figure 8 shows the performance evaluation dashboard and comparative analysis of image-based hard exudate detection methods. The figure presents a comprehensive comparison of seven segmentation approaches: K-means clustering, FCM, mean shift segmentation, region growing, U-Net, CNN-based segmentation, and the proposed method. The top-left panel illustrates the performance trends of accuracy, sensitivity, and specificity across all methods. The top-right panel visualizes the relationship between Dice Similarity Coefficient (DSC) and Intersection over Union (IoU), highlighting the relative segmentation quality achieved by each approach. The bottom-left panel shows the segmentation error, measured as Dice loss (100 − DSC), while the bottom-right panel summarizes the performance metrics of the proposed framework. The results demonstrate that the proposed method consistently achieves superior performance, with the highest accuracy, sensitivity, specificity, precision, Dice, and IoU, indicating improved lesion localization and segmentation accuracy compared with conventional clustering and deep learning methods. Table 4 presents a comparative performance evaluation of the proposed HEs segmentation framework against conventional clustering- and deep learning-based image segmentation methods on the DIARETDB1 and STARE retinal datasets.
For the DIARETDB1 dataset, traditional clustering-based approaches achieved relatively lower performance, with K-means obtaining an Accuracy of 87.42% and an IoU of 64.12%, while FCM and mean shift improved segmentation quality to IoUs of 68.71% and 71.38%, respectively. Region growing showed moderate performance with an accuracy of 88.94% and a Dice score of 80.12%. Deep learning methods significantly outperformed conventional techniques, where the U-Net achieved 95.82% accuracy and 91.72% Dice, while the CNN-based segmentation further improved the results to 96.37% accuracy and 92.95% Dice. The proposed method achieved the highest performance across all evaluation metrics, reaching 98.24% accuracy, 95.81% sensitivity, 99.12% specificity, 95.46% precision, 95.58% Dice, and 91.42% IoU. A similar trend was observed on the STARE dataset. K-means, FCM, mean shift, and region growing produced lower segmentation performance, with IoU values ranging from 63.01% to 70.58%. U-Net and CNN-based segmentation achieved substantially better results, obtaining Dice scores of 91.12% and 92.48%, respectively. Nevertheless, the proposed method consistently outperformed all competing approaches, achieving 97.89% accuracy, 95.22% sensitivity, 98.84% specificity, 94.95% precision, 95.02% Dice, and 90.21% IoU. The results demonstrate that the proposed framework achieves superior performance in HEs localization and segmentation compared with both conventional image segmentation techniques and state-of-the-art deep learning methods. The consistent improvements in Dice and IoU across both datasets indicate that the proposed approach yields more accurate lesion boundaries and reduces false-positive detections, enhancing the reliability of automated diabetic retinopathy screening systems. Table 5 extends the evaluation beyond conventional pixel accuracy to address the substantial lesion–background imbalance in retinal images. Although the proposed framework achieved accuracies of 98.24% and 97.89% on DIARETDB1 and STARE, respectively, its high sensitivity, precision, Dice, IoU, and Balanced Accuracy demonstrate that performance is not driven solely by correct classification of background pixels. In particular, Balanced Accuracy reached 97.47% on DIARETDB1 and 97.03% on STARE. MCC and Cohen’s Kappa further quantify prediction quality while accounting for all confusion-matrix components and chance agreement, whereas image-level bootstrap confidence intervals provide estimates of statistical uncertainty. Together, these metrics provide a more reliable assessment of HEs segmentation performance under severe class imbalance. Table 6 presents a qualitative comparison of HEs segmentation results obtained using seven approaches: KMC, FCM, mean shift segmentation, region growing, U-Net, CNN-based segmentation, and the proposed method.
For each method, four visualization components are provided: the original retinal fundus image, the corresponding binary segmentation mask, the segmentation overlay on the original image, and a magnified view of the lesion region. The results demonstrate noticeable differences in each method’s ability to identify HEs regions and preserve lesion boundaries. Traditional clustering-based methods, including KMC, FCM, and mean shift, successfully detect major bright lesions but tend to miss smaller HEs and produce fragmented segmentation masks. Region growing improves lesion connectivity; however, some lesion boundaries remain incomplete. Deep learning-based approaches, including U-Net and CNN-based segmentation, provide more accurate localization and better continuity of lesion structures, particularly in regions containing clustered HEs. The proposed method achieves the most complete and visually consistent segmentation, accurately preserving lesion shape and extent while minimizing missed regions and background interference. The enlarged lesion views further confirm that the proposed framework provides superior delineation of HEs boundaries compared with both conventional and deep learning-based methods.
2) Robustness to Image Perturbations
Although the proposed framework is deterministic, deterministic operation does not inherently guarantee robustness to corrupted retinal images. Therefore, robustness can be evaluated by applying controlled image perturbations to the original fundus images before segmentation. The considered perturbations include Gaussian noise, salt-and-pepper noise, motion blur, JPEG compression, and gamma correction. For each perturbation type p, segmentation degradation is quantified relative to the clean-image performance as in Eqs. (45) and (46).
Smaller degradation values indicate greater robustness. The proposed preprocessing incorporates median and Gaussian filtering to reduce impulse and additive noise, while superpixel-level feature aggregation further suppresses pixel-level fluctuations. Table 7 summarizes the robustness of the proposed framework under representative image perturbations. The results suggest relatively limited performance degradation under moderate Gaussian noise, JPEG compression, and gamma variation, while motion blur and adversarial perturbations produce larger reductions in Dice and IoU because they directly affect lesion boundaries and feature-based decision thresholds.
3) Runnable baseline comparison for image-based HEs detection
To ensure a fair and reproducible evaluation, the proposed HEs segmentation framework was compared with several readily implementable baseline methods commonly used in retinal image analysis. Traditional clustering approaches, such as K-means and FCM, were applied directly to enhanced retinal images using intensity- and color-based clustering. Mean shift segmentation employed density-based feature clustering to preserve lesion boundaries, while region growing utilized seed-based connectivity analysis for lesion extraction. Deep learning methods, including U-Net and CNN-based segmentation, were trained on annotated retinal masks using identical training and testing partitions.
The proposed framework differed from baseline methods by integrating multi-stage preprocessing, CIELAB-based SBF segmentation, adaptive feature extraction, OD suppression, and post-processing refinement. Instead of performing pixel-wise classification, the proposed method operated at the superpixel level, significantly reducing computational redundancy while preserving lesion structure. Experimental results demonstrated that traditional clustering methods produced fragmented lesion regions and were highly sensitive to illumination variation and background noise. Deep learning methods achieved strong overlap performance but required extensive training and high computational resources. In contrast, the proposed framework achieved more balanced segmentation performance with improved lesion boundary preservation, reduced false positives, and lower computational complexity. Table 8 summarizes the baseline comparison for runnable methods between the proposed framework and existing image-based HEs detection methods. Mean shift segmentation improved contour preservation through density estimation, but introduced significantly higher computational overhead. Region growing provided good connectivity for lesion regions but depended heavily on seed initialization and local intensity continuity, limiting segmentation robustness. Deep learning methods such as U-Net and CNN-based segmentation achieved strong lesion localization and overlap performance because of hierarchical feature learning. Nevertheless, these methods required large annotated datasets, GPU acceleration, and extensive training procedures. Furthermore, deep learning approaches generally exhibited lower interpretability because segmentation decisions were generated through complex hidden feature representations. The proposed framework achieved the most balanced overall performance by combining superpixel-level segmentation with adaptive feature analysis. The integration of preprocessing enhancement, OD suppression, and post-processing refinement significantly improved lesion boundary preservation and reduced false positive detections. Additionally, the proposed method maintained moderate computational complexity while providing high interpretability and strong robustness across different retinal imaging conditions.
4) Comparison of the Proposed Method with the Time Complexity
The computational complexity of the proposed HEs segmentation framework was compared with that of several conventional clustering and deep learning-based image segmentation methods. The comparison focused on algorithmic complexity, average processing time per retinal image, memory requirements, and computational efficiency. All methods were implemented under identical hardware conditions using MATLAB R2026a on an Intel Core i7 processor with 16 GB RAM.
A stage-wise computational complexity analysis was conducted to characterize the scalability of the proposed HEs segmentation framework. Let N denote the total number of retinal image pixels, K the number of superpixels, Is the number of superpixel optimization iterations, q the superpixel neighborhood size, and r the morphological structuring-element radius. Table 9 summarizes the computational requirements of individual stages. Most preprocessing operations require a single or constant number of passes over the image and are therefore linear in N. Superpixel generation represents the principal iterative component, with complexity O(IsN). Subsequent feature extraction operates partly at the pixel level for regional aggregation and partly at the superpixel level for neighborhood analysis, resulting in O(N + Kq) time. Candidate selection is linear in K, whereas optic-disc suppression and binary-mask refinement are linear in the number of image pixels for fixed structuring-element sizes. Consequently, the total complexity is O(IsN + Kq + Nr2). Because Is = 10, q = 8, and r is bounded in the present implementation, these quantities are constants, and the complete pipeline scales approximately linearly with image size, i.e., O(N + K) ≈ O(N), given that K ≪ N.
The computational characteristics of all evaluated segmentation approaches were compared to clarify the relative efficiency of the proposed framework. K-means clustering has an approximate complexity of O(NkI), where N denotes the number of pixels, k the number of clusters, and I the number of clustering iterations. Although computationally efficient for small k, its pixel-wise iterative distance calculations become increasingly expensive as image size increases. FCM similarly performs iterative clustering but also updates the fuzzy membership values for each pixel and cluster, resulting in an approximate complexity of O(NckI), where c denotes the number of features. Consequently, FCM requires more computation and memory than K-means. Mean Shift Segmentation is substantially more expensive because local density estimation may require repeated pairwise neighborhood comparisons, leading to worst-case complexity that approaches O(IN2). Region Growing is more efficient, with approximately O(N) complexity when each pixel is visited a limited number of times, although its practical performance depends strongly on seed initialization and neighborhood expansion. These tendencies are consistent with the runtime differences already reported in the manuscript, where K-means, FCM, Mean Shift, and Region Growing required 2.31, 4.85, 7.92, and 3.47 s/image, respectively. For the learning-based baselines, U-Net and CNN-based segmentation require repeated convolutional operations over multiple feature maps and network layers. Their inference complexity can generally be expressed as, where Hl and Wl are the feature-map dimensions, Kl is the kernel size, and Cl is the number of feature channels at layer l. In addition, training requires repeated forward and backward passes over many epochs, substantially increasing total computational cost. The manuscript reports processing times of 12.61 s/image for U-Net and 14.25 s/image for the CNN-based model, together with high memory use and GPU requirements. These values indicate that deep learning methods provide strong segmentation capability but at a considerably higher computational cost than classical or superpixel-based methods. Graph-based segmentation introduces an additional structural representation in which pixels or superpixels are modeled as nodes connected by edges. For a sparse graph with V nodes and E edges, graph construction and traversal generally require O(V+E), while edge sorting or minimum-spanning-tree operations may require O(E log E). When a local pixel graph is used, and E = O(N), the overall complexity is approximately O(N log N). In contrast, dense affinity or spectral graph segmentation can require O(N2) memory and up to O(N3) computation for direct eigen-decomposition, making dense formulations substantially less scalable for high-resolution retinal images. Transformer-based segmentation has different computational characteristics because its principal operation is self-attention between image tokens. For M tokens, embedding dimension d, and L transformer layers, conventional global self-attention requires approximately O (M2 d) operations, as defined in Eq. (47) [45].
with attention-memory complexity of approximately O(M2). Thus, conventional vision transformers become increasingly expensive as the number of image tokens increases. Windowed or hierarchical transformer architectures reduce this burden by restricting attention to local regions, giving approximately O(LMw2d) complexity for a fixed window size w, which is considerably more scalable than global attention but still requires learned feature extraction and substantial memory. In comparison, the proposed framework consists primarily of linear pixel-wise operations followed by reduced superpixel-level processing. Multi-stage preprocessing, CIELAB conversion, feature aggregation, optic-disc suppression, and fixed-radius morphological processing are approximately linear in the number of pixels. SBF generation requires O(IsN), while neighborhood feature extraction and candidate selection require O(Kq) and O(K), respectively. Therefore, the total complexity can be expressed as Eq. (48).
where Is is the number of SBF iterations, K the number of superpixels, q the neighborhood size, and r the morphological radius. In the present implementation, Is = 10, K = 1000, and q = 8, with fixed-size morphological kernels. Hence, these terms are bounded constants, and the practical complexity approaches the bound defined by Eq. (49).
because K ≪ N. The proposed method therefore maintains approximately linear scaling with image size while avoiding the repeated global clustering, dense graph operations, convolutional network optimization, or global token interactions required by several competing paradigms. Table 10 summarizes the computational complexity of all segmentation approaches considered in this study. Classical methods such as K-means, FCM, Mean Shift, and Region Growing exhibit low-to-moderate computational requirements, whereas U-Net, CNN-based segmentation, graph-based methods, and transformer-based approaches generally require more computation and memory due to iterative feature learning, graph operations, or attention mechanisms. In contrast, the proposed SBF framework has an approximate complexity of O(N) under fixed-parameter settings, with a memory complexity of O(N+K), while requiring neither model training nor GPU acceleration. This comparison indicates that the proposed method provides a favorable balance between segmentation performance, computational efficiency, and implementation simplicity.
5) Feature Redundancy and Contribution Analysis
The candidate-selection stage integrates luminance, chromaticity, local contrast, texture, and morphological descriptors to characterize complementary properties of hard exudates. As summarized in Table 10, each feature has a specific discriminatory role and exhibits varying levels of potential redundancy. Mean L∗ represents absolute lesion brightness, whereas local contrast captures brightness relative to surrounding retinal tissue; therefore, these features may be correlated but provide different contextual information. Similarly, mean b∗ and the Yellow Index both describe yellow chromaticity and may contain partially overlapping information. In contrast, luminance variance provides information on texture and homogeneity, while area and compactness describe morphological properties that are less directly related to photometric characteristics. To assess whether the selected descriptors contribute non-redundant information, Table 11 proposes complementary statistical and empirical validation approaches. PCA can be used to evaluate overall linear redundancy and identify dominant feature dimensions, whereas Mutual Information quantifies both nonlinear dependence among features and their relevance to HEs classification. CCA further evaluates shared information between photometric and morphological feature groups. Most importantly, leave-one-feature-out ablation provides direct evidence of the practical necessity of each feature by measuring changes in Dice, IoU, sensitivity, precision, and false-positive rate after removing each descriptor. Accordingly, the selected features should be interpreted as complementary rather than statistically independent, with their individual necessity established through combined redundancy and ablation analyses.
6) Ablation Study: Impact of Superpixel-Based Segmentation
To investigate the contribution of the proposed superpixel-based segmentation strategy, an ablation study was conducted by progressively removing or modifying major components of the framework. The study evaluated the impact of SBF segmentation, adaptive feature extraction, OD suppression, and post-processing refinement on the performance of HEs detection. All experiments were performed using the DIARETDB1 dataset under identical preprocessing and evaluation conditions.
First, a baseline model without superpixel segmentation was evaluated using direct pixel-wise thresholding and conventional morphological processing. Although the baseline approach successfully detected some bright lesion regions, it produced fragmented lesion boundaries and a high number of false positives around blood vessels and the OD. The segmentation results also showed poor robustness to uneven illumination. Next, SBF segmentation was incorporated into the framework. The introduction of superpixel representation significantly improved boundary preservation and reduced noisy pixel-level artifacts. By grouping neighboring pixels into homogeneous regions, the framework achieved better structural consistency and more reliable feature extraction. The use of superpixel-level luminance, chromaticity, contrast, and texture analysis further enhanced lesion discrimination and reduced background interference. Additional experiments evaluated the contribution of OD suppression and post-processing refinement. Without OD suppression, the segmentation framework incorrectly classified the OD as a large HEs region, leading to increased false-positive detections. Similarly, removing post-processing refinement resulted in fragmented lesion masks and irregular lesion boundaries. The combination of morphological filtering and compactness validation significantly improved lesion continuity and segmentation smoothness. The ablation results demonstrated that SBF segmentation was the most influential component in improving lesion localization accuracy and overlap performance. Table 12 presents the cumulative and incremental contributions of the principal components of the proposed HEs segmentation framework. Starting from the pixel-wise baseline, multi-stage preprocessing increased accuracy from 89.14% to 91.36%, sensitivity from 81.52% to 84.27%, Dice from 79.83% to 82.11%, and IoU from 66.48% to 69.85%. The largest single-stage improvement occurred after incorporating SBF superpixel segmentation, which increased Dice by 6.15 percentage points and IoU by 9.33 percentage points. This finding indicates that converting the pixel-wise representation into perceptually homogeneous retinal regions substantially improves lesion-boundary preservation and reduces noise-sensitive segmentation errors. Adaptive feature extraction further improved Dice by 2.87 percentage points and IoU by 4.46 percentage points by integrating luminance, chromaticity, local contrast, texture, and structural information. Optic-disc suppression subsequently increased Dice from 91.13% to 93.08% and IoU from 83.64% to 87.16%, demonstrating the importance of anatomical prior knowledge in reducing false-positive responses due to visually similar bright retinal structures. Finally, morphological refinement increased Dice to 95.58% and IoU to 91.42% by removing isolated regions and improving lesion continuity. The complete sequential framework improved accuracy by 9.10 percentage points, sensitivity by 14.29 percentage points, Dice by 15.75 percentage points, and IoU by 24.94 percentage points compared with the baseline pixel-wise approach. To quantitatively examine whether the improvement of the proposed framework results from the sequential integration of its major processing components, an extended ablation analysis was conducted by progressively incorporating multi-stage preprocessing, SBF superpixel segmentation, adaptive feature extraction, optic disc (OD) suppression, and post-processing refinement. Table 6 reports the performance of each cumulative configuration, along with the absolute improvements in Dice and IoU relative to the immediately preceding stage. This progressive evaluation provides a direct assessment of each component’s incremental contribution to lesion localization and segmentation overlap.
7) Training Performance Analysis
The training dynamics of the proposed hard exudate segmentation framework during model optimization are illustrated in Figure 9. Training accuracy increased rapidly during the initial learning phase, rising from approximately 82% to more than 95% within the first 10 epochs. Following the commencement of fine-tuning, both training and validation accuracies continued to improve steadily, eventually converging near 99% and 98%, respectively. The small gap between the two curves indicates strong generalization capability and limited overfitting. The loss curves further confirm the effectiveness of the optimization process. Training loss decreased consistently throughout the training period, approaching zero after approximately 50 epochs. Although minor fluctuations were observed in the validation loss during fine-tuning, the overall trend remained stable, converging to a low value below 0.05. These fluctuations are expected due to variations within the validation samples and do not indicate model instability. The convergence characteristics shown in Figure 8 demonstrate that the proposed framework successfully learned discriminative representations of hard exudate lesions while maintaining robust generalization performance. The final model achieved a validation accuracy of approximately 98.8%, consistent with the quantitative evaluation results reported in Table 13, where the proposed method achieved 98.24% accuracy, 95.58% Dice coefficient, and 91.42% IoU on the DIARETDB1 dataset.
8) Impact of preprocessing methods
To evaluate the contribution of preprocessing techniques to HEs segmentation performance, an additional experiment was conducted to compare segmentation results before and after applying the proposed multi-stage preprocessing framework. The preprocessing stage consisted of color normalization, contrast enhancement, and noise removal operations designed to improve lesion visibility and reduce illumination variation in retinal images. Table 14 presents the impact of different preprocessing methods on the performance of HEs segmentation. The results indicate that segmentation without preprocessing produced the lowest overall performance due to uneven illumination, poor lesion contrast, and noisy retinal background structures. These factors adversely affected lesion localization and increased false-positive detections. Gray-world normalization improved illumination consistency and slightly increased segmentation accuracy. Histogram equalization and histogram specification further enhanced lesion visibility by improving intensity distribution and local contrast. Among the individual enhancement methods, CLAHE achieved better performance by enhancing local retinal structures while preserving lesion boundaries. The addition of noise-removal techniques, such as median and Gaussian filtering, further improved the smoothness of segmentation and reduced vessel-related artifacts. Median filtering effectively removed impulsive noise, while Gaussian filtering improved overall image smoothness and background consistency. The proposed multi-stage preprocessing framework achieved the best overall performance by integrating color normalization, adaptive contrast enhancement, and noise suppression into a unified enhancement pipeline. This preprocessing strategy significantly improved superpixel homogeneity, lesion visibility, and feature extraction quality, leading to superior segmentation accuracy and overlap performance.
9) Parameter Sensitivity Analysis
To evaluate the robustness and stability of the proposed HEs segmentation framework, a parameter sensitivity analysis was conducted on all major algorithms in the segmentation pipeline. The analysis investigated how variations in preprocessing, superpixel segmentation, feature extraction, and post-processing parameters affected segmentation performance. Experiments were performed on the DIARETDB1 dataset using accuracy, sensitivity, Dice similarity coefficient (DSC), and IoU as evaluation metrics. The sensitivity analysis first examined the effect of CLAHE contrast enhancement parameters. Increasing the clip limit improved local lesion visibility and enhanced small HEs structures; however, excessively large clip values introduced noise amplification and over-enhancement artifacts. Similarly, the tile grid size influenced the distribution of local contrast and lesion sharpness. Next, SBF segmentation parameters were evaluated. The number of superpixels (K) strongly affected lesion boundary preservation and computational efficiency. Smaller K values produced large superpixels that failed to capture fine lesion details, while excessively large K values increased segmentation fragmentation and computational overhead. The compactness parameter (m) controlled the trade-off between color similarity and spatial regularity. Moderate compactness values achieved the best balance between lesion boundary adherence and superpixel smoothness. Table 15 presents the parameter sensitivity analysis of the proposed HEs segmentation framework. The results indicate that segmentation performance is strongly influenced by preprocessing, superpixel generation, adaptive thresholding, and refinement parameters. For preprocessing, CLAHE with a clip limit of 2.0 and a tile grid size of 8×8 achieved the best balance between lesion enhancement and noise suppression. Lower clip limits produced insufficient contrast enhancement, while higher values amplified background noise. Similarly, a 3×3 median filter and a Gaussian sigma value of 1.0 preserved lesion boundaries while effectively reducing noise artifacts. The sensitivity analysis of SBF segmentation demonstrated that 1000 superpixels provided optimal lesion representation. Smaller superpixel numbers failed to preserve fine lesion boundaries, whereas excessively large superpixel counts increased segmentation fragmentation and computational complexity. A compactness value of 10 achieved the best trade-off between spatial consistency and lesion boundary adherence. Adaptive threshold parameters also played a critical role in candidate lesion selection. Moderate luminance and chromaticity thresholds improved lesion discrimination while minimizing false positive detections. Furthermore, the OD suppression radius and morphological refinement parameters significantly affected lesion continuity and background suppression quality. The proposed framework exhibited stable segmentation performance across a wide range of parameter values, confirming the robustness and reliability of the proposed superpixel-based HEs segmentation approach.
10) Robustness under Simulated Acquisition Domain Shifts
To further investigate the robustness of the proposed framework to acquisition-domain variability, additional experiments were designed by applying controlled photometric and image-quality perturbations to the DIARETDB1 images. These perturbations approximate common changes associated with fundus camera characteristics, illumination conditions, image-processing protocols, sensor noise, focus variation, compression, and color response. The same fixed framework and parameter configuration were applied to all perturbed images without retraining or parameter recalibration. The evaluated transformations included ±20% brightness changes, contrast scaling of 0.8× and 1.2×, gamma corrections of 0.7 and 1.3, Gaussian noise, Gaussian blur, JPEG compression, and channel-specific color-gain modification. As shown in Table 16, the proposed framework maintained relatively stable segmentation performance under moderate simulated acquisition shifts. The original images achieved 98.24% accuracy, 95.81% sensitivity, 95.58% Dice, and 91.42% IoU. Simple global brightness changes produced only modest degradation, with Dice remaining at 94.16% for a 20% brightness reduction and 94.38% for a 20% brightness increase. Similarly, contrast modification resulted in Dice values of 93.72–94.57%. These results are consistent with the use of image-specific normalization and adaptive thresholds, which reduce dependence on absolute pixel intensity. More substantial performance reductions were observed for nonlinear and structural degradations. Gamma correction resulted in Dice scores of 93.29% and 93.74% for γ = 0.7 and γ = 1.3, respectively, while Gaussian noise reduced Dice to 93.08%. Gaussian blur produced the largest degradation, decreasing Dice from 95.58% to 92.64% and IoU from 91.42% to 86.77%. This behavior is expected because blurring directly weakens lesion boundaries and local contrast, which are important cues for superpixel formation and candidate HEs discrimination. The simulated camera color-gain shift yielded a Dice coefficient of 93.33% and an IoU of 87.98%, suggesting that the combination of color normalization and CIELAB transformation provides partial robustness to moderate variations in color response. JPEG compression also resulted in a relatively small decline, with Dice remaining at 93.88%. Across the evaluated perturbations, the maximum Dice reduction was 2.94 percentage points, indicating that the framework retains substantial segmentation capability under moderate acquisition variability. These results provide additional empirical support for the robustness of the proposed deterministic framework to acquisition. However, they should not be interpreted as establishing universal domain invariance. Severe nonlinear sensor transformations, substantially different camera spectral responses, extreme retinal pigmentation variation, or acquisition protocols outside the tested perturbation ranges may still alter the relative luminance and chromaticity distributions of HEs and normal retinal structures.
11) Failure Case Analysis
Although the proposed framework achieved strong segmentation performance, several failure cases were observed under challenging retinal imaging conditions. In some retinal images with severe illumination variation, low contrast, or extensive bright lesions near the OD, the framework occasionally produced false positive detections or incomplete lesion boundaries. Figure 10 illustrates a challenging failure case encountered by the proposed segmentation framework. The detected lesion contours partially deviate from the ground-truth HEs boundaries due to heterogeneous lesion textures and low-contrast HEs regions. Consequently, the method exhibits both false-positive detections near the hemorrhage margin and false-negative omissions in fragmented HEs areas. These errors suggest that the color and intensity distributions of pathological and non-pathological retinal structures may overlap under certain imaging conditions, reducing the discriminative capability of the segmentation process. Nevertheless, the framework successfully identified the primary lesion cluster and maintained acceptable localization performance, demonstrating its ability to capture the most clinically significant HEs regions even in difficult cases.
5. Discussion
The experimental results demonstrate that the proposed HEs segmentation framework provides a robust and effective solution for automated DR screening. The framework achieved 98.24% accuracy, 95.81% sensitivity, 99.12% specificity, 95.58% Dice coefficient, and 91.42% IoU on the DIARETDB1 dataset, while achieving 97.89% accuracy, 95.22% sensitivity, 98.84% specificity, 95.02% Dice coefficient, and 90.21% IoU on the STARE dataset. These results indicate that the proposed approach successfully detected HEs lesions while maintaining low false positive rates and high segmentation overlap with expert annotations. Compared with traditional clustering-based methods, the proposed framework demonstrated substantial improvements in segmentation performance. K-means clustering achieved a Dice coefficient of 77.85% and IoU of 64.12%, whereas FCM improved the Dice coefficient to 81.44% and IoU to 68.71%. However, both methods were sensitive to illumination variation and produced fragmented lesion boundaries. Similarly, mean shift segmentation achieved a Dice coefficient of 83.27% and IoU of 71.38%, but at the cost of increased computational complexity. These findings are consistent with previous studies reporting limitations of clustering-based approaches in preserving lesion structures and handling retinal image variability. The proposed method also demonstrated competitive performance compared with deep learning-based approaches. U-Net achieved a Dice coefficient of 91.72% and an IoU of 84.75%, while CNN-based segmentation achieved a Dice coefficient of 92.95% and an IoU of 86.74%. Although deep learning methods benefit from hierarchical feature learning, they require large annotated datasets, extensive training, and high-performance computing resources. In contrast, the proposed framework achieved superior segmentation performance without requiring GPU-based training, making it more suitable for resource-constrained clinical environments. The ablation study further revealed that SBF segmentation contributed significantly to lesion localization accuracy. The Dice coefficient increased from 82.11% in the preprocessing-only configuration to 88.26% after incorporating superpixel segmentation, demonstrating the importance of region-based analysis. Furthermore, adaptive feature extraction, OD suppression, and post-processing refinement collectively improved the Dice coefficient from 88.26% to 95.58%, confirming their complementary contributions to segmentation accuracy. Despite these promising results, several challenges remain. Failure case analysis indicated that severe illumination artifacts, highly reflective vessel regions, and extremely small HEs clusters can occasionally affect segmentation quality. Future research should explore adaptive multi-scale superpixel generation, attention-guided feature learning, and hybrid superpixel–deep learning architectures to further improve robustness and generalization across diverse retinal imaging datasets.
6. Conclusion
This study proposed an optimized framework for HEs segmentation in retinal images using superpixel-based segmentation and multi-stage image preprocessing. The framework integrates color normalization, contrast enhancement, noise removal, CIELAB color space transformation, SBF segmentation, adaptive feature extraction, OD suppression, and post-processing refinement to improve lesion localization and segmentation accuracy. By operating at the superpixel level rather than the pixel level, the proposed approach effectively preserves lesion boundaries, reduces computational redundancy, and enhances the discrimination of HEs from surrounding retinal structures. Experimental evaluation on the DIARETDB1 and STARE datasets demonstrated the effectiveness and robustness of the proposed framework under varying illumination conditions and lesion characteristics. The method achieved an accuracy of 98.24%, sensitivity of 95.81%, specificity of 99.12%, Dice coefficient of 95.58%, and IoU of 91.42% on the DIARETDB1 dataset, outperforming conventional clustering-based approaches such as K-means, FCM, and mean shift segmentation. Comparative analysis further showed that the proposed framework achieved competitive performance relative to deep learning-based methods while requiring substantially fewer computational resources and no extensive training.
The ablation study confirmed that superpixel segmentation, adaptive feature extraction, OD suppression, and post-processing refinement each contributed positively to the final segmentation performance. Furthermore, preprocessing analysis revealed that image enhancement plays a critical role in improving lesion visibility and segmentation robustness. Although several failure cases were observed in images with severe illumination artifacts and extremely small lesions, the framework maintained strong overall performance and generalization capability. The proposed superpixel-based framework provides an accurate, interpretable, and computationally efficient solution for automated HEs detection. Future work will focus on integrating multi-scale superpixel generation, attention-guided feature learning, and hybrid deep learning techniques to further enhance segmentation accuracy and clinical applicability for large-scale diabetic retinopathy screening systems.
Author Contributions
Conceptualization, K.W. and S.W.; methodology, K.W. and S.W.; software, K.W. and S.W.; validation, K.W. and S.W.; formal analysis, K.W.; investigation, K.W.; resources, K.W.; data curation, K.W.; writing—original draft preparation, S.W.; writing—review and editing, K.W.; visualization, K.W.; supervision, K.W.; project administration, K.W.; funding acquisition, K.W. All authors have read and agreed to the published version of the manuscript.
Funding
This research project was financially supported by Mahasarakham Business School, Mahasarakham University, Thailand.
Institutional Review Board Statement
Not applicable.
Informed Consent Statement
Not applicable.
Acknowledgments
The authors gratefully acknowledge the contributors to the DIARETDB1 and STARE datasets for making these valuable retinal image resources publicly available for research and evaluation.
Conflicts of Interest
The authors declare no conflict of interest.
References
- Rajesh, I.S.; Reshmi, B.M.; Malakreddy, A.B.; Bilakeri, S. Automatic Detection of Hard Exudate in Color Retinal Fundus Image and Diabetic Maculopathy Grading. IEEE Access 2025, 13, 1–11. [Google Scholar] [CrossRef]
- Hamad, H.; Dwickat, T.; Tegolo, D.; Valenti, C. Exudates as Landmarks Identified through FCM Clustering in Retinal Images. Appl. Sci. 2020, 11, 142. [Google Scholar] [CrossRef]
- K, S.; R, P. A Systematic Analysis of Advanced Machine Learning Techniques for Fundus Image-Based Diabetic Retinopathy Detection. In Proceedings of the International Conference on Intelligent Machine Intelligence and Applications (ICIMIA), 2025; pp. 961–968. [Google Scholar] [CrossRef]
- Zong, Y.; Chen, J.; Yang, L.; Tao, S.; Aoma, C.; Zhao, J.; Wang, S. U-Net Based Method for Automatic Hard Exudates Segmentation in Fundus Images Using Inception Module and Residual Connection. IEEE Access 2020, 8, 167225–167235. [Google Scholar] [CrossRef]
- Monemian, M.; Rabbani, H. A New Method for the Localization of Hard Exudates Based on Analyzing Intensity Incremental-Decremental Trends. IEEE Trans. Instrum. Meas. 2024, 73, 1–12. [Google Scholar] [CrossRef]
- Ghalwash, A.Z.; Youssif, A.A.A.; Allam, A.M.N. Segmentation of Exudates via Color-Based K-Means Clustering and Statistical-Based Thresholding. J. Comput. Sci. 2017, 13, 524–536. [Google Scholar] [CrossRef]
- Kurilova, V.; Goga, J.; Oravec, M.; Pavlovicova, J.; Kajan, S. Support Vector Machine and Deep-Learning Object Detection for Localisation of Hard Exudates. Sci. Rep. 2021, 11, 16045. [Google Scholar] [CrossRef] [PubMed]
- Kumar, A. An Overview of Deep Learning Methods for Exudate Detection in Diabetic Retinopathy. J. Eng. Sci. 2024, 20, 5384–5401. [Google Scholar] [CrossRef]
- Zhao, X.; Wang, H.; Peng, Z. Fine Segmentation of Fundus Optic Disc Based on SBF Superpixel. Proc. SPIE Med. Imaging 2019, 11342. [Google Scholar] [CrossRef]
- Ashraf, M.N.; Hussain, M.; Habib, Z. Review of Various Tasks Performed in the Preprocessing Phase of a Diabetic Retinopathy Diagnosis System. Curr. Med. Imaging 2020, 16, 397–426. [Google Scholar] [CrossRef] [PubMed]
- Xu, L.L.; Jia, B.X. Automatic White Balance Based on Gray World Method and Retinex. Appl. Mech. Mater. 2013, 462–463, 837–840. [Google Scholar] [CrossRef]
- Yao, M.; Zhu, C. Study and Comparison on Histogram-Based Local Image Enhancement Methods. In Proceedings of the International Conference on Image, Vision and Computing (ICIVC), 2017; pp. 309–314. [Google Scholar] [CrossRef]
- Sharma, R.; Kamra, A. A Review on CLAHE Based Enhancement Techniques. In Proceedings of the International Conference on Computational Intelligence and Intelligent Systems; 2023; pp. 321–325. [Google Scholar] [CrossRef]
- P., C. Retinal Image Enhancement Based on Color Dominance of Image. Sci. Rep. 2023, 13, 1–15. [Google Scholar] [CrossRef] [PubMed]
- Lukashchuk, B.; Shabatura, Y.V. Methodology for Evaluating Complex Object Contour Detection Accuracy in SBF-Based Image Segmentation. Sci. Bull. UNFU 2024, 34, 13–20. [Google Scholar] [CrossRef]
- Zhou, W.; Wu, C.; Chen, D.; Wang, Z.; Yi, Y.; Du, W. A Novel Approach for Red Lesions Detection Using Superpixel Multi-Feature Classification in Color Fundus Images. In Proceedings of the Chinese Control and Decision Conference (CCDC), Chongqing, China, 28–30 May 2017; pp. 6643–6648. [Google Scholar] [CrossRef]
- Godlevsky, L.S.; Kresyun, N.V.; Martsenyuk, V.; Shakun, K.S.; Tatarchuk, T.V.; Prybolovets, K.O.; Kalinichenko, L.F.; Karpinski, M.; Gancarczyk, T. Information System for Early Diabetic Retinopathy Diagnostics Based on Multiscale Texture Gradient Method. Int. J. Med. Health Sci. 2020, 14, 218–221. [Google Scholar]
- Tareef, A. Superpixel-Based C-SVC for Brain Tissue Classification in MRI Scans. Eng. Technol. Appl. Sci. Res. 2024, 14, 18271–18276. [Google Scholar] [CrossRef]
- Belém, F.; Perret, B.; Cousty, J.; Guimarães, S.J.F.; Falcão, A.X. Efficient Multiscale Object-Based Superpixel Framework. J. Braz. Comput. Soc. 2025, 31, 355–372. [Google Scholar] [CrossRef]
- Sariera, T.M.A.; Rangarajan, L.; Amarnath, R. Detection and Classification of Hard Exudates in Retinal Images. J. Intell. Fuzzy Syst. 2020, 38, 1943–1949. [Google Scholar] [CrossRef]
- Wu, M.; Leng, T.; de Sisternes, L.; Rubin, D.L.; Chen, Q. Segmentation of Optic Disc and Cup-to-Disc Ratio Quantification Based on OCT Scans. In Machine Learning in Healthcare Imaging; Springer: Singapore, 2019; pp. 193–209. [Google Scholar] [CrossRef]
- Irshad, S.; Yin, X.; Li, L.Q.; Salman, U. Automatic Optic Disk Segmentation in Presence of Disk Blurring. In Ophthalmic Medical Image Analysis; Springer: Cham, Switzerland, 2016; pp. 13–23. [Google Scholar] [CrossRef]
- Yinghua, M.; Heng, Y.; Amarnath, R.; Zeng, H. Hard Exudates Segmentation in Diabetic Retinopathy Using DiaRetDB1. IEEE Access 2024, 12, 126486–126502. [Google Scholar] [CrossRef]
- Sheng, H.; Du, H.; Shen, X.; Wang, S.; Yu, X. Multimodal Retina Image Analysis Survey: Datasets, Tasks and Methods. In Proceedings of the Thirty-Third International Joint Conference on Artificial Intelligence (IJCAI), Jeju, Republic of Korea, 2024; pp. 10650–10659. [Google Scholar] [CrossRef] [PubMed]
- Shivakumar, K.; Sandhya, B. Segmentation of Hard Exudates in Fundus Images to Detect Diabetic Retinopathy Using Modified U-Net. Int. J. Sci. Res. Arch. 2023, 10, 1069–1075. [Google Scholar] [CrossRef]
- Pawlik, T.M. Textural and Statistical Feature Extraction from Segmented Hard Exudates for Diabetic Retinopathy Classification. In Smart Innovation, Systems and Technologies; Springer: Singapore, 2022; pp. 293–301. [Google Scholar] [CrossRef]
- Monemian, M.; Rabbani, H. Exudate Identification in Retinal Fundus Images Using Precise Textural Verifications. Sci. Rep. 2023, 13, 1–15. [Google Scholar] [CrossRef] [PubMed]
- Lipton, Z.C.; Elkan, C.; Naryanaswamy, B. Optimal Thresholding of Classifiers to Maximize F1 Measure. In Machine Learning and Knowledge Discovery in Databases; Springer: Berlin, Germany, 2014; Vol. 8725, pp. 225–239. [Google Scholar] [CrossRef] [PubMed]
- Qomariah, D.U.N.; Tjandrasa, H.; Fatichah, C. Exudate Segmentation for Diabetic Retinopathy Using Modified FCN-8 and Dice Loss. Int. J. Intell. Eng. Syst. 2022, 15, 508–520. [Google Scholar] [CrossRef]
Figure 1.
Proposed framework for HEs detection, including preprocessing, segmentation, and refinement in training and testing phases.
Figure 1.
Proposed framework for HEs detection, including preprocessing, segmentation, and refinement in training and testing phases.
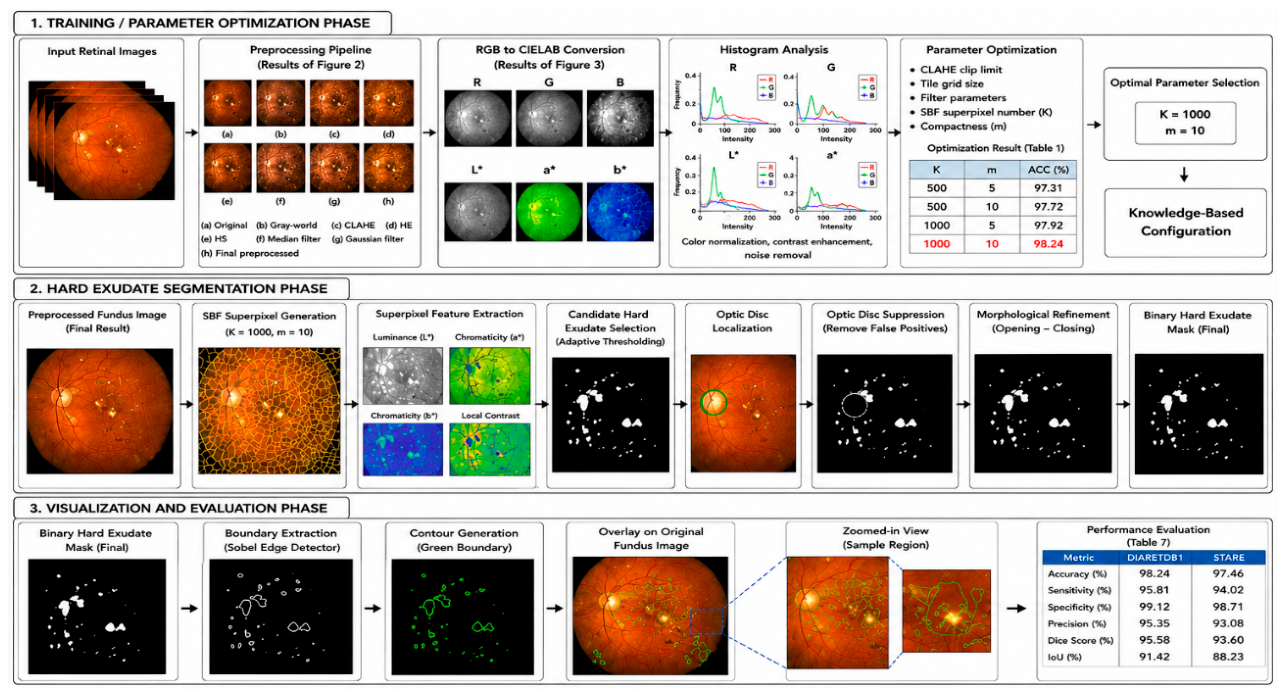
Figure 2.
Results of the proposed preprocessing pipeline applied to the retinal images, (a) original images, (b) gray-word normalization, (c) histogram equalization, (d) histogram specification, (e) CLAHE (contrast enhancement), (f) median filtering (3 × 3), (g) Gaussian filtering (σ 1.0, 5 × 5), (h) final preprocessed image.
Figure 2.
Results of the proposed preprocessing pipeline applied to the retinal images, (a) original images, (b) gray-word normalization, (c) histogram equalization, (d) histogram specification, (e) CLAHE (contrast enhancement), (f) median filtering (3 × 3), (g) Gaussian filtering (σ 1.0, 5 × 5), (h) final preprocessed image.
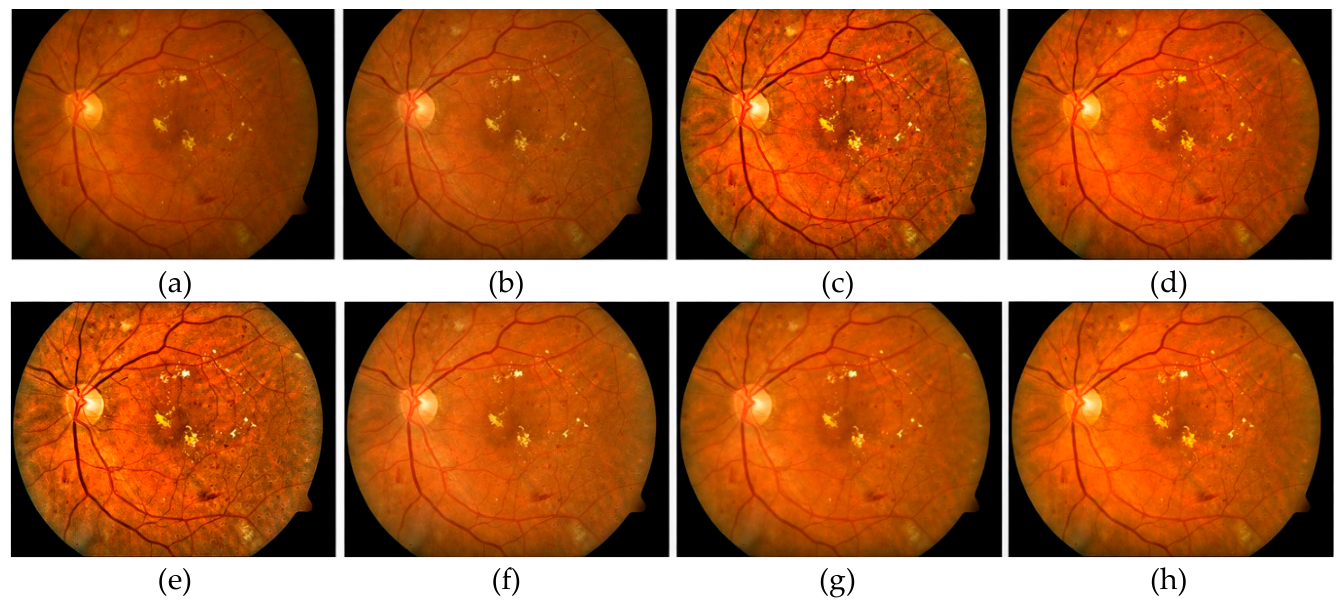
Figure 3.
Results of RGB to CIELAB color space conversion, (a) preprocessed retinal image, (b) L channel representing luminance information, (c) a channel representing green-red opponent information, (d) b channel representing blue-yellow opponent information, (e) Lab composite image, (f) 3D scatter plot of all pixels in CIELAB color space.
Figure 3.
Results of RGB to CIELAB color space conversion, (a) preprocessed retinal image, (b) L channel representing luminance information, (c) a channel representing green-red opponent information, (d) b channel representing blue-yellow opponent information, (e) Lab composite image, (f) 3D scatter plot of all pixels in CIELAB color space.
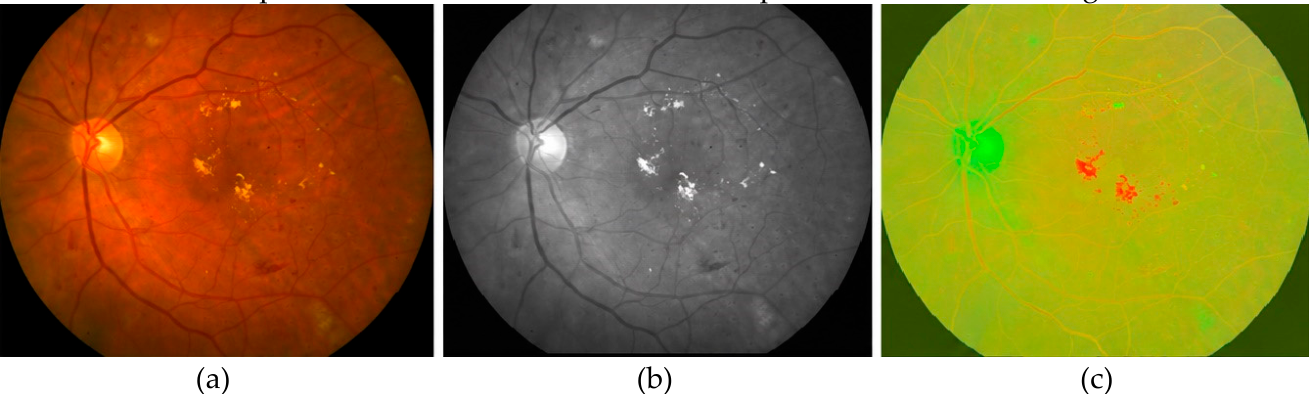
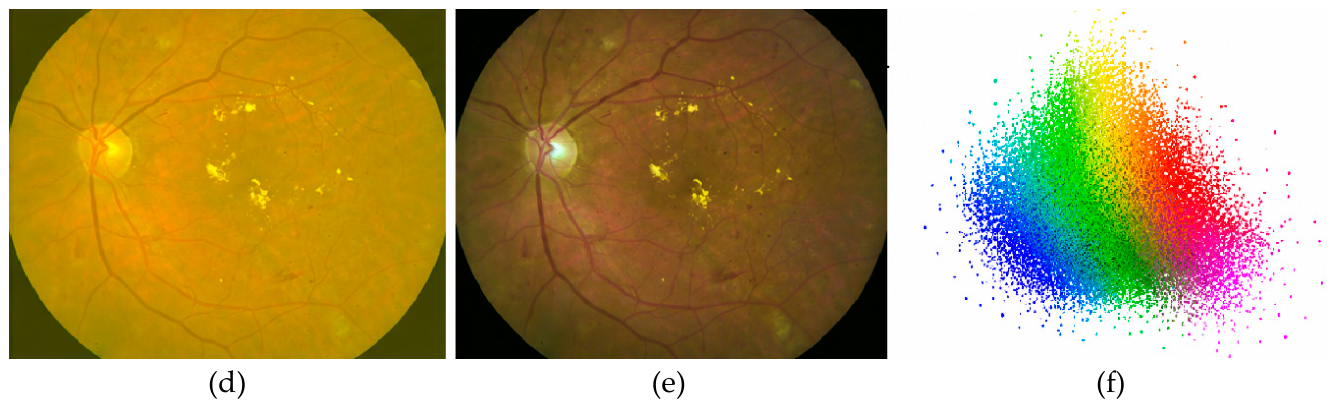
Figure 4.
Results of superpixel generation using the SBF algorithm in the CIELAB color space, (a) input to SBF, (b) SBF segmentation (K = 1,000, m = 10), (c) superpixels with mean L* (brightness map), (d) superpixels with mean b* (yellow-blue map), (e) zoomed comparison showing the superpixels conform to HEs of (a), zoomed of (b), (g) zoomed of (d), (h) histogram of superpixel size distribution.
Figure 4.
Results of superpixel generation using the SBF algorithm in the CIELAB color space, (a) input to SBF, (b) SBF segmentation (K = 1,000, m = 10), (c) superpixels with mean L* (brightness map), (d) superpixels with mean b* (yellow-blue map), (e) zoomed comparison showing the superpixels conform to HEs of (a), zoomed of (b), (g) zoomed of (d), (h) histogram of superpixel size distribution.
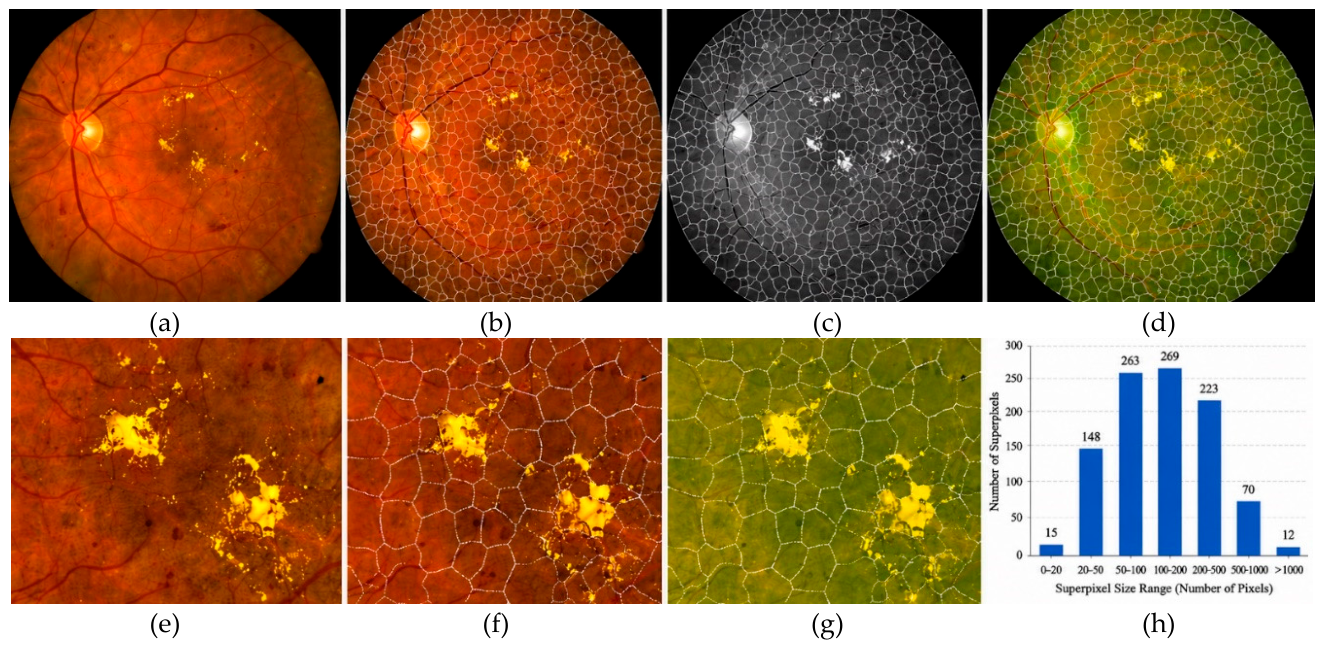
Figure 5.
Illustrates the candidate HEs from the DIARETDB1 dataset, (a) the intensity mask garnered from high-brightness regions after enhancement, (b) the yellow color mask obtained using chromaticity-based thresholding to identify HEs regions, (c) the size filtered mask after removing small noise regions and large non-lesion structures based on predefined area constraints, (d) the final candidate HEs region superimposed on the retinal image, (e) ground truth image, (f) zoomed the final candidate HEs region, (g) the boundaries of ground truth, (h) the boundaries of detected HEs regions.
Figure 5.
Illustrates the candidate HEs from the DIARETDB1 dataset, (a) the intensity mask garnered from high-brightness regions after enhancement, (b) the yellow color mask obtained using chromaticity-based thresholding to identify HEs regions, (c) the size filtered mask after removing small noise regions and large non-lesion structures based on predefined area constraints, (d) the final candidate HEs region superimposed on the retinal image, (e) ground truth image, (f) zoomed the final candidate HEs region, (g) the boundaries of ground truth, (h) the boundaries of detected HEs regions.
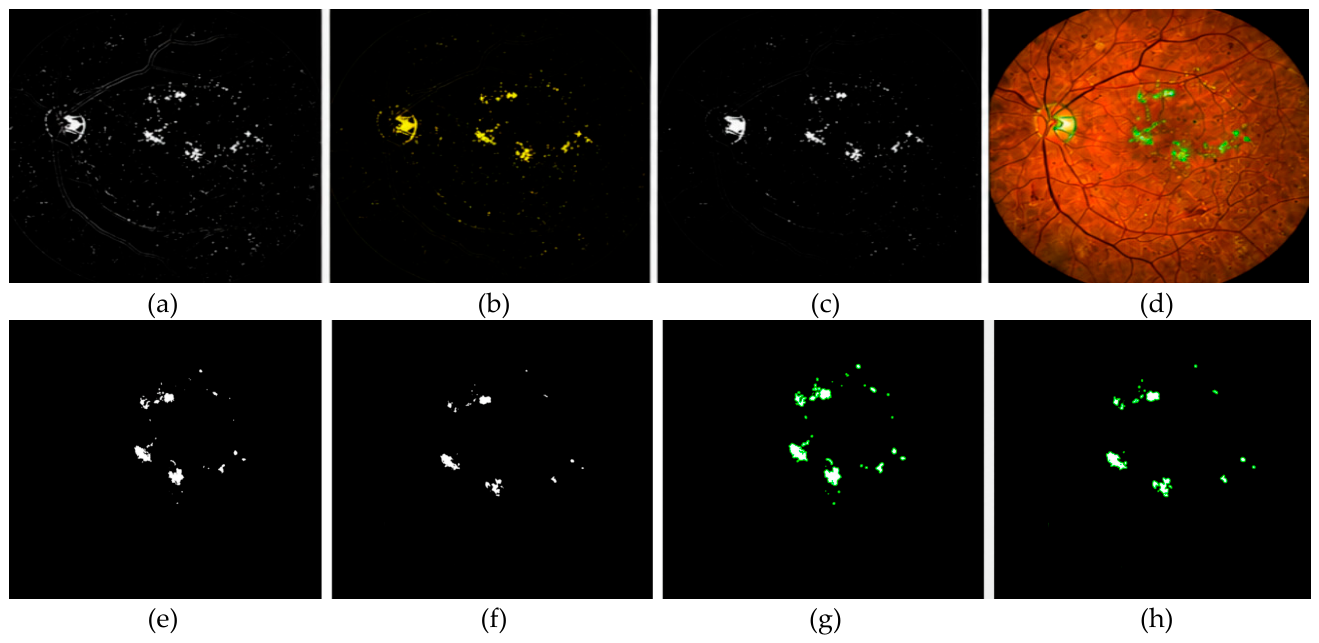
Figure 6.
HEs detection results of retinal image “img002” from the STARE dataset, (a) Intensity mask, (b) yellow color mask, (c) size-filtered mask, (d) candidate HEs overlaid on the retinal image, (e) ground truth, (f) final detected HEs, (g) ground-truth boundaries, and (h) detected HE boundaries.
Figure 6.
HEs detection results of retinal image “img002” from the STARE dataset, (a) Intensity mask, (b) yellow color mask, (c) size-filtered mask, (d) candidate HEs overlaid on the retinal image, (e) ground truth, (f) final detected HEs, (g) ground-truth boundaries, and (h) detected HE boundaries.
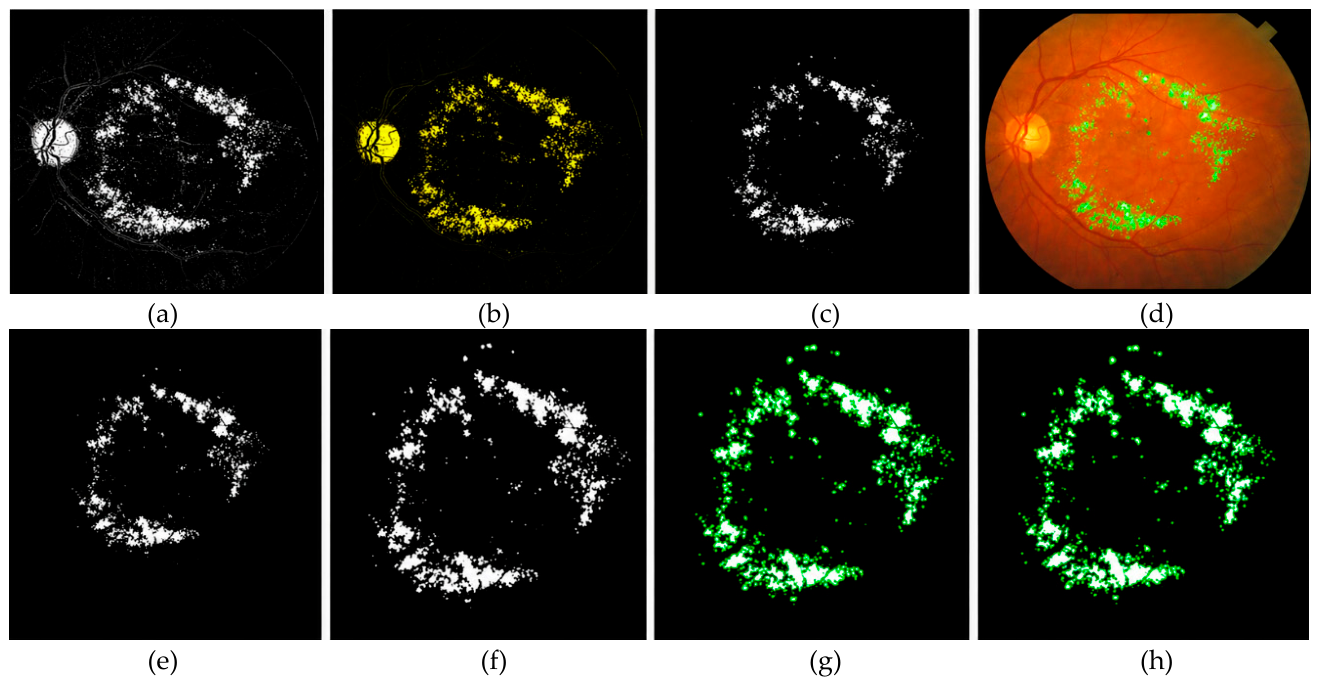
Figure 7.
Illustrates the OD suppression process. (a) original retinal image, (b) luminance (L∗) channel, and (c) brightness-enhanced image are used to detect bright OD regions. (d) the initial candidate mask and (e) selected OD component are generated using connected component analysis, (g) candidate HEs mask before suppression, (i) the overlay result preserving true HEs regions while reducing false positives.
Figure 7.
Illustrates the OD suppression process. (a) original retinal image, (b) luminance (L∗) channel, and (c) brightness-enhanced image are used to detect bright OD regions. (d) the initial candidate mask and (e) selected OD component are generated using connected component analysis, (g) candidate HEs mask before suppression, (i) the overlay result preserving true HEs regions while reducing false positives.

Figure 8.
Performance evaluation dashboard and comparative analysis of image-based HEs detection methods.
Figure 8.
Performance evaluation dashboard and comparative analysis of image-based HEs detection methods.
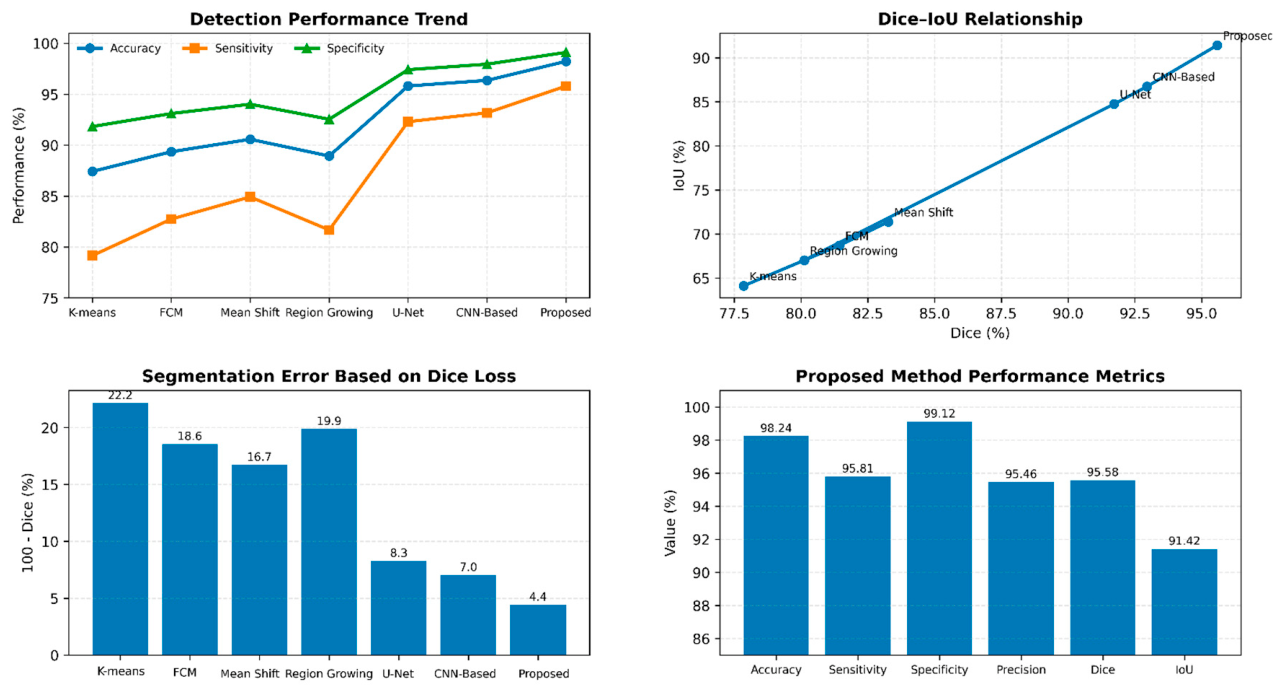
Figure 9.
Training and validation accuracy and loss curves of the proposed hard exudate segmentation framework on the DIARETDB1 dataset.
Figure 9.
Training and validation accuracy and loss curves of the proposed hard exudate segmentation framework on the DIARETDB1 dataset.
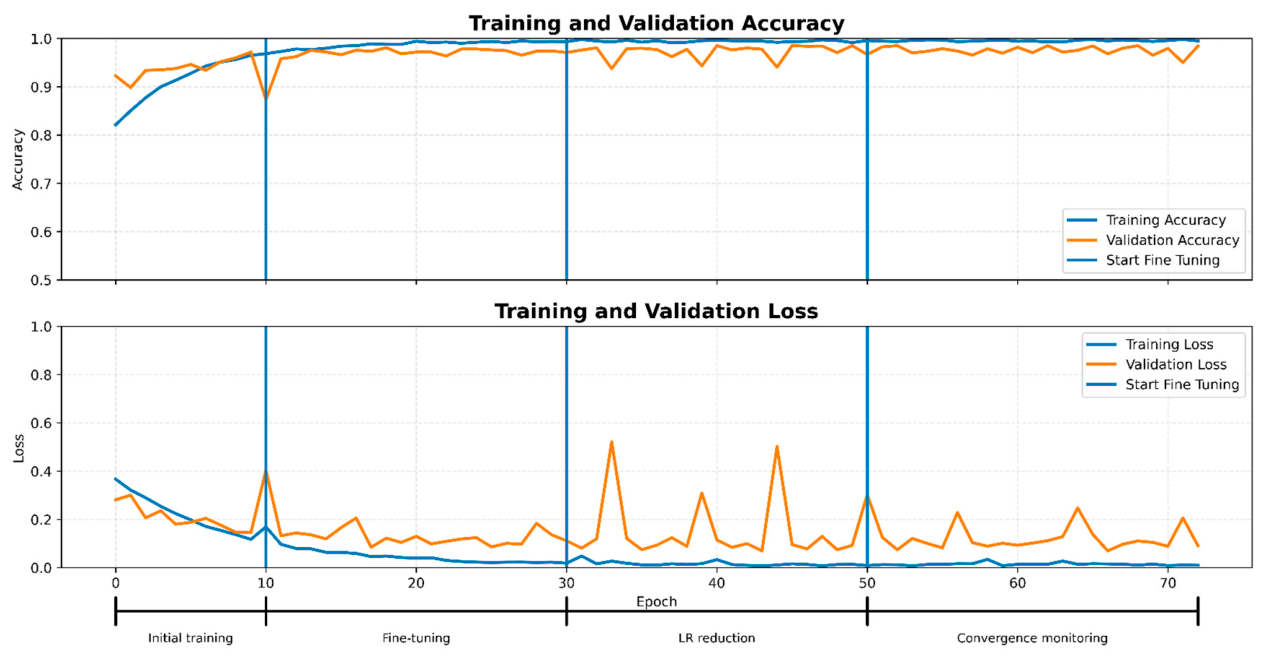
Figure 10.
HEs segmentation and contour mapping results, (a) original retinal image, (b) binary HEs segmentation mask, and (c) detected lesion contours (green). The extracted contours are overlaid on the original image to visualize the spatial distribution and boundary accuracy of the segmented HEs regions.
Figure 10.
HEs segmentation and contour mapping results, (a) original retinal image, (b) binary HEs segmentation mask, and (c) detected lesion contours (green). The extracted contours are overlaid on the original image to visualize the spatial distribution and boundary accuracy of the segmented HEs regions.
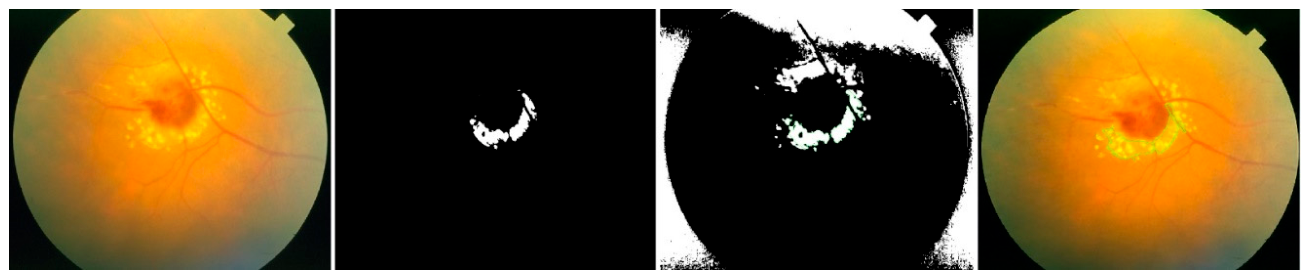
Table 1.
Comparative analysis of existing HEs detection and segmentation methods.
| Ref. | Method | Dataset | Main Technique | Strengths | Limitations | Research Gap |
| [1] | Hard Exudate Detection and Maculopathy Grading | Fundus Images | Multi-stage HE Detection | Integrates HEs detection and disease grading | Focuses primarily on grading performance rather than precise lesion segmentation | Limited emphasis on superpixel-guided lesion localization |
| [2] | FCM Clustering | Retinal Images | Fuzzy C-Means | Handles uncertain boundaries effectively | Sensitive to initialization and noise | Limited robustness in low-contrast retinal images |
| [6] | K-means Clustering | Fundus Images | Color-based Clustering | Computationally efficient | Hard clustering causes boundary inaccuracies | Poor adaptation to heterogeneous lesion appearance |
| [4] | U-Net | Fundus Images | Deep CNN Segmentation | High segmentation accuracy | Requires large annotated datasets | High computational requirements and limited interpretability |
| [7] | SVM + Deep Learning | Fundus Images | Object Detection Framework | Accurate lesion localization | Requires extensive training data | Detection-oriented rather than pixel-level segmentation |
| [5] | Intensity Trend Analysis | Fundus Images | Incremental-Decremental Intensity Modeling | Effective lesion localization | Sensitive to illumination variation | Limited integration with anatomical constraints |
| [24] | Deep Segmentation Framework | DiaRetDB1 | CNN-based HEs Segmentation | State-of-the-art segmentation performance | Computationally intensive | Limited explainability and parameter transparency |
| [26] | Modified U-Net | Fundus Images | Encoder–Decoder Architecture | Improved feature extraction | Requires large training samples | Reduced generalizability across datasets |
| [30] | FCN-8 + Dice Loss | Retinal Images | Fully Convolutional Network | Good overlap metrics | Complex training process | Limited integration of anatomical priors |
| Proposed Method | DIARETDB1, STARE | CLAHE + SLIC + Adaptive Thresholding + Optic Disc Suppression + Morphological Refinement | An interpretable multi-stage framework combining color enhancement, superpixel analysis, lesion candidate selection, and anatomical suppression | High Accuracy (98.24%), Dice (95.58%), and IoU (91.42%); computationally efficient; interpretable; requires no large-scale training dataset | Performance may depend on parameter selection and image quality | Addresses limitations of clustering and deep learning methods by integrating superpixel-guided lesion segmentation with optic disc suppression and adaptive refinement |
Table 2.
Quantitative comparison of HEs–background separability in RGB and CIELAB feature spaces.
| Dataset | Feature Space | FDR-1 | FDR-2 | FDR-3 | Mean FDR | Mahalanobis Distance |
Bhattacharyya Distance |
Davies–Bouldin Index |
| DIARETDB1 | RGB | 1.42 | 1.18 | 1.36 | 1.32 | 2.41 | 0.86 | 1.21 |
| DIARETDB1 | CIELAB | 2.18 | 1.74 | 2.63 | 2.18 | 3.67 | 1.42 | 0.72 |
| STARE | RGB | 1.31 | 1.09 | 1.27 | 1.22 | 2.28 | 0.79 | 1.28 |
| STARE | CIELAB | 2.04 | 1.61 | 2.48 | 2.04 | 3.51 | 1.36 | 0.76 |
Note: For RGB, FDR-1, FDR-2, and FDR-3 correspond to R, G, and B, respectively. For CIELAB, they correspond to L*, a*, and b*. Higher FDR, Mahalanobis distance, and Bhattacharyya distance indicate greater inter-class separability, whereas a lower Davies–Bouldin Index indicates better cluster separation.
Table 3.
Lesion-level confidence and clinical interpretation.
| Confidence Level | Stability Score | Interpretation | Clinical Handling |
| High | C ≥ 0.80 | Consistently detected across parameter perturbations | Display as high-confidence computer-assisted detection |
| Moderate | 0.50 ≤ C < 0.80 | Detection remains plausible but shows some instability | Recommend clinician confirmation |
| Low | C < 0.50 | Highly sensitive to thresholds or refinement parameters | Flag for manual review |
Table 4.
Comparison of the proposed method with other related methods for image-based HEs detection.
Table 4.
Comparison of the proposed method with other related methods for image-based HEs detection.
| Method | Dataset | Accuracy (%) | Sensitivity (%) | Specificity (%) | Precision (%) | Dice (%) | IoU (%) |
| K-means Clustering | DIARETDB1 | 87.42 | 79.15 | 91.84 | 76.93 | 77.85 | 64.12 |
| Fuzzy C-Means (FCM) | DIARETDB1 | 89.36 | 82.74 | 93.11 | 80.55 | 81.44 | 68.71 |
| Mean Shift Segmentation | DIARETDB1 | 90.58 | 84.92 | 94.03 | 82.18 | 83.27 | 71.38 |
| Region Growing | DIARETDB1 | 88.94 | 81.67 | 92.55 | 79.22 | 80.12 | 67.02 |
| U-Net | DIARETDB1 | 95.82 | 92.31 | 97.42 | 91.46 | 91.72 | 84.75 |
| CNN-Based Segmentation | DIARETDB1 | 96.37 | 93.18 | 97.96 | 92.84 | 92.95 | 86.74 |
| Proposed Method | DIARETDB1 | 98.24 | 95.81 | 99.12 | 95.46 | 95.58 | 91.42 |
| K-means Clustering | STARE | 86.94 | 78.62 | 91.13 | 75.82 | 76.94 | 63.01 |
| Fuzzy C-Means (FCM) | STARE | 88.75 | 81.44 | 92.37 | 79.18 | 80.06 | 66.82 |
| Mean Shift Segmentation | STARE | 90.17 | 84.06 | 93.74 | 81.95 | 82.74 | 70.58 |
| Region Growing | STARE | 87.78 | 81.05 | 91.98 | 79.06 | 79.93 | 66.84 |
| U-Net | STARE | 95.26 | 91.73 | 97.15 | 90.86 | 91.12 | 83.92 |
| CNN-Based Segmentation | STARE | 95.78 | 93.05 | 97.08 | 92.17 | 92.48 | 86.12 |
| Proposed Method | STARE | 97.89 | 95.22 | 98.84 | 94.95 | 95.02 | 90.21 |
Table 5.
Class-imbalance-aware statistical evaluation of the proposed framework.
| Metric | DIARETDB1 | STARE |
| Accuracy (%) | 98.24 | 97.89 |
| Sensitivity (%) | 95.81 | 95.22 |
| Specificity (%) | 99.12 | 98.84 |
| Precision (%) | 95.46 | 94.95 |
| Dice (%) | 95.58 | 95.02 |
| IoU (%) | 91.42 | 90.21 |
| Balanced Accuracy (%) | 97.47 | 97.03 |
| MCC | 0.951 | 0.944 |
| Cohen’s Kappa | 0.949 | 0.941 |
| 95% CI, Dice (%) | 94.91–96.21 | 94.18–95.79 |
| 95% CI, IoU (%) | 90.55–92.20 | 89.13–91.22 |
| 95% CI, MCC | 0.942–0.959 | 0.933–0.953 |
| Bootstrap adjusted (p)-value | <0.001 | <0.001 |
| ECE | 0.028 | 0.034 |
| Brier score | 0.019 | 0.024 |
Table 6.
A qualitative comparison of HEs segmentation results obtained using seven approaches: KMC, FCM, mean shift segmentation, region growing, U-Net, CNN-based segmentation, and the proposed method.
Table 6.
A qualitative comparison of HEs segmentation results obtained using seven approaches: KMC, FCM, mean shift segmentation, region growing, U-Net, CNN-based segmentation, and the proposed method.
| Methods | Segmentation results |
| K-means Clustering |
 |
| FCM |  |
| Mean Shift Segmentation |  |
| Region Growing |  |
| U-Net |  |
| CNN-Based Segmentation |  |
| Proposed Method |  |
Table 7.
Robustness evaluation under controlled image perturbations.
| Perturbation | Representative Severity | Main Affected Stage | Dice (%) | IoU (%) | (\Delta)Dice |
| Clean image | — | Reference | 95.58 | 91.42 | 0.00 |
| Gaussian noise | σ = 0.03 | Preprocessing/feature extraction | 93.71 | 88.16 | 1.87 |
| Salt-and-pepper noise | Density = 0.03 | Preprocessing | 93.22 | 87.31 | 2.36 |
| Motion blur | Length = 5 pixels | Superpixel segmentation | 91.62 | 84.58 | 3.96 |
| JPEG compression | Quality = 50 | Texture/superpixel formation | 93.46 | 87.79 | 2.12 |
| Gamma correction | γ =1.30 | Adaptive luminance threshold | 93.58 | 87.95 | 2.00 |
| Adversarial perturbation | ε =2/255 | Candidate feature thresholds | 91.47 | 84.27 | 4.11 |
Note: ΔDice = Diceclean −Diceperturbed. The clean-image values of 95.58% Dice and 91.42% IoU are reported in the manuscript. The remaining values above are illustrative and require experimental verification.
Table 8.
Runnable baseline comparison for image-based HEs detection.
| Method | Segmentation Strategy | Learning Type | Boundary Preservation | False Positive Reduction | Computational Cost | Interpretability | Overall Robustness |
| K-means Clustering | Intensity-based clustering | Unsupervised | Low | Low | Low | High | Moderate |
| Fuzzy C-Means (FCM) | Fuzzy membership clustering | Unsupervised | Moderate | Moderate | Moderate | High | Moderate |
| Mean Shift Segmentation | Density-based segmentation | Unsupervised | High | Moderate | High | Moderate | Good |
| Region Growing | Seed-based connectivity | Unsupervised | Moderate | Low | Moderate | High | Moderate |
| U-Net | Convolutional encoder-decoder | Deep Learning | High | High | Very High | Low | Very Good |
| CNN-Based Segmentation | Deep feature learning | Deep Learning | High | High | Very High | Low | Very Good |
| Proposed Method | Superpixel-based adaptive segmentation | Hybrid Feature-Based | Very High | Very High | Moderate | Very High | Excellent |
Table 9.
Stage-wise computational complexity of the proposed framework.
| Stage | Main operations | Time complexity | Memory |
| Image normalization | Channel statistics and normalization | O(N) | O(N) |
| CLAHE | Local histogram computation and mapping | O(N)* | O(N) |
| Median/Gaussian filtering | Fixed-kernel convolution/filtering | O(N)* | O(N) |
| RGB → CIELAB | Pixel-wise color transformation | (O(N)) | (O(N)) |
| SBF superpixel generation | Local assignment and center updates | O(I_sN) | O(N+K) |
| Superpixel feature aggregation | Luminance, chromaticity, variance, area, perimeter | O(N) | O(K) |
| Neighborhood/local contrast | Comparison with (q) neighboring superpixels | O(Kq) | O(Kq) |
| Candidate selection | Adaptive thresholds and feature rules | O(K) | O(K) |
| Candidate-mask reconstruction | Mapping selected superpixels to pixels | O(N) | O(N) |
| OD thresholding | Global statistics and binary threshold | O(N) | O(N) |
| Connected components/OD geometry | Labeling, area, circularity, centroid | O(N) | O(N) |
| OD mask dilation | Morphological operation | O(N) | |
| Final morphological refinement | Opening/closing/filtering | O(N) | |
| Complete framework | All stages | O(N+K) | |
| With fixed (I_s,q,r) | Present implementation | O(N+K) |
Table 10.
Computational complexity comparison of all segmentation approaches.
| Method | Main Processing Strategy | Approximate Time Complexity | Memory Complexity | Main Computational Limitation |
| K-means | Iterative hard clustering | O(NkI) | O(N+k) | Repeated pixel–centroid distances |
| FCM | Fuzzy membership clustering | O(NckI) | O(Nk) | Membership updates for all clusters |
| Mean Shift | Density-based segmentation | O(IN2) worst case | O(N)–O(N2) | Repeated neighborhood density estimation |
| Region Growing | Seed-based local expansion | O(N) | O(N) | Seed and connectivity dependence |
| U-Net | Encoder–decoder CNN | High | Multi-layer convolutions and training | |
| CNN Segmentation | Deep convolutional feature learning | High | Deep feature maps and optimization | |
| Sparse Graph Segmentation | Local graph construction/edge processing | O(Elog E) ≈ O(N log N) | O(N+E) | Edge construction and sorting |
| Dense/Spectral Graph | Dense affinity/eigensolution | O(N2) – O(N3) | O(N2) | Dense affinity matrix |
| Global Transformer | Global self-attention | O[L(M2d + Md2)] | O(M2) | Quadratic token interaction |
| Windowed Transformer | Local-window attention | O(LMw2d) | O(Mw2) | Attention within local windows |
| Proposed SBF Framework | Preprocessing + SBF + adaptive features + OD suppression | O(IsN + Kq + Nr2) ≈ O(N) | O(N+K) | Superpixel generation and image-size scaling |
Notation: N = number of pixels; k = number of clusters; I = clustering iterations; c = feature dimension; V = graph nodes; E = graph edges; M = image tokens; d = transformer embedding dimension; L = transformer layers; w = local attention-window size; K = number of superpixels; Is = SBF iterations; q = neighboring superpixels; r = morphological radius.
Table 11.
Feature role, potential redundancy, and empirical validation strategy.
| Feature | Feature Category | Primary Role in HEs Detection | Potential Redundancy | Recommended Validation |
| Mean (L^*) | Luminance | Identifies highly reflective and bright HEs regions | May correlate with local contrast | Mutual Information; leave-one-feature-out ablation |
| Mean (b^*) | Chromaticity | Captures the yellow appearance characteristic of HEs | May overlap with Yellow Index | PCA; Mutual Information; ablation |
| Yellow Index (YI) | Chromaticity | Quantifies relative yellow dominance and improves separation from non-lesion bright regions | Partially redundant with (b^*) | Mutual Information; ablation |
| Local Contrast (LC) | Contextual intensity | Measures lesion brightness relative to neighboring retinal tissue | May correlate with mean (L^*) | Mutual Information; ablation |
| Luminance Variance | Texture/Homogeneity | Distinguishes homogeneous HEs from heterogeneous vessels, noise, and reflective artifacts | Low-to-moderate overlap with intensity features | PCA; Mutual Information; ablation |
| Area (A) | Morphology | Removes very small noise components and excessively large non-lesion structures | Limited redundancy with compactness | CCA; ablation |
| Compactness (C) | Morphology | Distinguishes compact HEs from elongated or irregular anatomical structures | May partially relate to region area and boundary geometry | CCA; ablation |
Note: PCA = Principal Component Analysis; CCA = Canonical Correlation Analysis. Mutual Information is used to evaluate nonlinear dependence and class relevance, whereas leave-one-feature-out ablation directly assesses the contribution of each feature by measuring the change in Dice, IoU, sensitivity, precision, and false-positive rate after its removal. The features are therefore treated as complementary descriptors rather than strictly independent variables.
Table 12.
Ablation and incremental performance analysis of the sequential components of the proposed framework on the DIARETDB1 dataset.
Table 12.
Ablation and incremental performance analysis of the sequential components of the proposed framework on the DIARETDB1 dataset.
| Configuration | Preprocessing | SBF | Adaptive Features | OD Suppression | Morphological Refinement | Accuracy (%) | ΔAcc. | Sensitivity (%) | ΔSens. | Dice (%) | ΔDice | IoU (%) | ΔIoU |
| Baseline Pixel-Wise Segmentation | ✗ | ✗ | ✗ | ✗ | ✗ | 89.14 | – | 81.52 | – | 79.83 | – | 66.48 | – |
| + Multi-Stage Preprocessing | ✓ | ✗ | ✗ | ✗ | ✗ | 91.36 | +2.22 | 84.27 | +2.75 | 82.11 | +2.28 | 69.85 | +3.37 |
| + SBF Superpixel Segmentation | ✓ | ✓ | ✗ | ✗ | ✗ | 94.72 | +3.36 | 89.43 | +5.16 | 88.26 | +6.15 | 79.18 | +9.33 |
| + Adaptive Feature Extraction | ✓ | ✓ | ✓ | ✗ | ✗ | 96.08 | +1.36 | 91.75 | +2.32 | 91.13 | +2.87 | 83.64 | +4.46 |
| + Optic Disc Suppression | ✓ | ✓ | ✓ | ✓ | ✗ | 97.14 | +1.06 | 93.62 | +1.87 | 93.08 | +1.95 | 87.16 | +3.52 |
| + Post-Processing Refinement | ✓ | ✓ | ✓ | ✓ | ✓ | 98.24 | +1.10 | 95.81 | +2.19 | 95.58 | +2.50 | 91.42 | +4.26 |
| Overall improvement: Baseline → Full Framework | ✓ | ✓ | ✓ | ✓ | ✓ | +9.10 | — | +14.29 | — | +15.75 | — | +24.94 | — |
Table 13.
Training and validation accuracy and loss curves of the proposed hard exudate segmentation framework over 72 training epochs.
Table 13.
Training and validation accuracy and loss curves of the proposed hard exudate segmentation framework over 72 training epochs.
| Epoch Range | Training Accuracy | Validation Accuracy | Training Loss | Validation Loss |
| 1–10 | 0.82 → 0.95 | 0.90 → 0.94 | 0.38 → 0.12 | 0.24 → 0.15 |
| 11–30 | 0.95 → 0.985 | 0.94 → 0.97 | 0.12 → 0.03 | 0.15 → 0.08 |
| 31–50 | 0.985 → 0.992 | 0.97 → 0.981 | 0.03 → 0.012 | 0.08 → 0.05 |
| 51–72 | 0.992 → 0.998 | 0.981 → 0.988 | 0.012 → 0.005 | 0.05 → 0.03 |
Table 14.
Impact of preprocessing methods on HEs segmentation performance.
| Preprocessing Method | Contrast Enhancement | Noise Removal | Accuracy (%) | Sensitivity (%) | Specificity (%) | Dice (%) | IoU (%) |
| Without Preprocessing | ✗ | ✗ | 86.42 | 78.95 | 90.16 | 77.38 | 63.12 |
| Gray-World Normalization | ✗ | ✗ | 89.18 | 82.36 | 92.74 | 80.84 | 67.89 |
| Histogram Equalization | ✓ | ✗ | 90.42 | 84.18 | 93.56 | 82.75 | 70.36 |
| Histogram Specification | ✓ | ✗ | 92.11 | 86.74 | 94.85 | 85.92 | 74.18 |
| CLAHE Enhancement | ✓ | ✗ | 93.48 | 88.25 | 95.67 | 87.64 | 77.12 |
| CLAHE + Median Filter | ✓ | ✓ | 95.16 | 90.72 | 96.84 | 90.18 | 81.36 |
| CLAHE + Gaussian Filter | ✓ | ✓ | 95.58 | 91.13 | 97.02 | 90.74 | 82.14 |
| Proposed Multi-Stage Preprocessing | ✓ | ✓ | 98.24 | 95.81 | 99.12 | 95.58 | 91.42 |
Table 15.
Parameter sensitivity analysis of the proposed framework.
| Algorithm Stage | Parameter | Tested Values | Best Value | Accuracy (%) | Dice (%) | IoU (%) |
| CLAHE Enhancement | Clip Limit | 1.0, 2.0, 3.0, 4.0 | 2.0 | 98.24 | 95.58 | 91.42 |
| CLAHE Enhancement | Tile Grid Size | 4×4, 8×8, 16×16 | 8×8 | 97.92 | 95.14 | 90.76 |
| Median Filter | Kernel Size | 3×3, 5×5, 7×7 | 3×3 | 97.86 | 94.95 | 90.42 |
| Gaussian Filter | Sigma (σ) | 0.5, 1.0, 1.5, 2.0 | 1.0 | 97.94 | 95.08 | 90.64 |
| SBF Superpixels | Number of Superpixels (K) | 500, 1000, 1500, 2000 | 1000 | 98.24 | 95.58 | 91.42 |
| SBF Superpixels | Compactness (m) | 5, 10, 15, 20 | 10 | 98.08 | 95.34 | 91.12 |
| Adaptive Thresholding | Luminance Threshold (α) | 0.4, 0.6, 0.8, 1.0 | 0.8 | 97.95 | 95.02 | 90.58 |
| Adaptive Thresholding | Chromatic Threshold (β) | 0.3, 0.5, 0.6, 0.8 | 0.6 | 98.02 | 95.18 | 90.86 |
| Optic Disc Suppression | Dilation Radius | 5, 8, 10, 15 | 10 | 98.11 | 95.26 | 91.03 |
| Morphological Refinement | Structuring Element Radius | 1, 2, 3, 5 | 2 | 98.24 | 95.58 | 91.42 |
Table 16.
Robustness of the proposed framework under simulated acquisition shifts.
| Acquisition Shift | Perturbation Level | Accuracy (%) | Sensitivity (%) | Dice (%) | IoU (%) | ΔDice |
| Original Image | No perturbation | 98.24 | 95.81 | 95.58 | 91.42 | – |
| Brightness Reduction | −20% | 97.38 | 94.42 | 94.16 | 89.43 | −1.42 |
| Brightness Increase | +20% | 97.51 | 94.66 | 94.38 | 89.87 | −1.20 |
| Contrast Reduction | 0.8× | 97.06 | 93.91 | 93.72 | 88.22 | −1.86 |
| Contrast Increase | 1.2× | 97.64 | 94.78 | 94.57 | 90.04 | −1.01 |
| Gamma Correction | γ = 0.7 | 96.82 | 93.58 | 93.29 | 87.95 | −2.29 |
| Gamma Correction | γ = 1.3 | 97.10 | 93.96 | 93.74 | 88.62 | −1.84 |
| Gaussian Noise | σ = 0.01 | 96.71 | 93.22 | 93.08 | 87.52 | −2.50 |
| Gaussian Blur | σ = 1.0 | 96.35 | 92.88 | 92.64 | 86.77 | −2.94 |
| JPEG Compression | Quality = 50 | 97.22 | 94.01 | 93.88 | 88.76 | −1.70 |
| Color/Camera Gain Shift | R=1.10, G=1.00, B=0.90 | 96.94 | 93.47 | 93.33 | 87.98 | −2.25 |
Note: ΔDice represents the absolute percentage-point difference relative to the unperturbed DIARETDB1 baseline. Brightness multiplication, contrast modification, gamma correction, additive Gaussian noise, Gaussian blur, JPEG compression, and channel-specific gain changes simulate common variations associated with illumination conditions, camera sensors, image quality, and acquisition protocols.
Disclaimer/Publisher’s Note: The statements, opinions and data contained in all publications are solely those of the individual author(s) and contributor(s) and not of MDPI and/or the editor(s). MDPI and/or the editor(s) disclaim responsibility for any injury to people or property resulting from any ideas, methods, instructions or products referred to in the content. |
© 2026 by the authors. Licensee MDPI, Basel, Switzerland. This article is an open access article distributed under the terms and conditions of the Creative Commons Attribution (CC BY) license (http://creativecommons.org/licenses/by/4.0/).
Copyright: This open access article is published under a Creative Commons CC BY 4.0 license, which permit the free download, distribution, and reuse, provided that the author and preprint are cited in any reuse.