

Submitted:
04 September 2026
Posted:
08 September 2026
You are already at the latest version
Abstract
A patient whose average performance clears a fixed absolute criterion while individual performances fall below it is at risk on those occasions, and this paper proposes that the frequency of those crossings is the clinical meaning of dispersion in serial functional measurement. Serial functional measurement currently yields two statistics: the level of performance and its trajectory. This paper argues that a third — the dispersion of performance across serial identical challenges — carries clinical information that the first two are constructed to discard, and predicts that the three are separably estimable, with dispersion adding predictive value once level and trajectory are both in the model. The argument rests on a threshold logic: functional risk is realized not at the mean but in the trough, because falls, decompensations, and failed activities of daily living occur on bad days. High dispersion therefore means two things at once: that any single measurement is an unreliable estimate of the patient, and that the patient is nearer the threshold than any single measurement can show. A published precedent exists in a different variable: visit-to-visit blood pressure variability predicts stroke independently of mean pressure, with predictive strength increasing with the number of measurements, and treatments that improved the mean while worsening the dispersion produced worse outcomes. The structure transfers to functional reserve with one inversion — for blood pressure the danger is the peak; for reserve it is the trough. Estimating the quantity requires the task criterion to be held fixed in absolute terms across serial challenge; a criterion that moves with the patient absorbs the dispersion it is supposed to reveal. The construct is proposed, not validated; the conditions that would defeat it are stated.
Keywords:
functional reserve
; variability
; dispersion
; serial measurement
; challenge testing
; threshold
What This Paper Claims
Established background, not claimed here. Within-person variability of physiological and performance measures is a documented phenomenon with its own literatures. Visit-to-visit blood pressure variability predicts cerebrovascular outcomes independently of mean pressure (Rothwell et al., 2010), and antihypertensive drug classes differ in their effects on that variability, with consequences for outcomes independent of their effects on the mean (Webb et al., 2010). Loss of physiological complexity — reduced fine-grained fluctuation in continuous signals such as heart rate and gait dynamics — is an established framework for aging (Lipsitz & Goldberger, 1992). Frailty operationalizations built on performance levels exist and are widely used (Fried et al., 2001). Sit-to-stand reserve has been derived as the difference between laboratory capacity and free-living maximal performance from thigh-worn accelerometry (Löppönen et al., 2023); the day-to-day variability of free-living sit-to-stand intensity is itself measurable and reproducible (Löppönen et al., 2021); and free-living sit-to-stand characteristics have predicted four-year decline in lower-extremity function (Löppönen et al., 2024). None of this originates here.
Where dispersion is already read, and where it is not. In cognitive aging, intraindividual variability is already established as signal rather than noise and as a predictor that adds to mean performance (Hultsch et al., 2002; Lin & Kelley-Moore, 2017; Haynes et al., 2017; Blumberg et al., 2024). Two clinical measures already act on dispersion directly: visit-to-visit blood pressure variability and stride-to-stride gait variability. What has not been carried across is the reading of dispersion in serial physical performance under identical challenge, where it sets the frequency with which a single performance falls below a fixed absolute criterion that the person’s mean clears. Outside blood pressure and gait, serial functional assessment records the level and, when it is repeated often enough, the trend, and discards the spread; so that crossing frequency is not currently estimated.
What this paper proposes. A measurement interpretation, stated as a prediction and not as a property. First, that the clinical meaning of dispersion across serial identical challenges is realized against a fixed absolute criterion, as the frequency with which individual performances fall below a threshold that the person’s mean clears. Second, that dispersion, level and trajectory are separably estimable in serial identical-challenge data, and that dispersion adds predictive information once level and trajectory are both in the model. Neither has been demonstrated. Both are stated in Section VII in the form that would falsify them.
What this paper does not claim. It does not claim that variability is undiscovered — the blood pressure literature is cited precisely because it is mature, and the cognitive literature has established dispersion as a predictor for twenty-five years. It does not claim that separability from level and trajectory is an established property; it is the paper’s prediction and it is untested. It does not claim that all functional variability is signal; measurement error, learning effects, and day-level confounders are real and are addressed. It does not claim that a dispersion statistic should replace level or trajectory; the three axes are complements. It does not coin or claim a clinical phenotype; naming a phenotype is earned by operationalization and validation, and neither is performed here.
I — Two Statistics and a Remainder
A patient measured once yields a point. A patient measured serially yields, in current practice, exactly two derived quantities: a level — the mean, or the most recent value — and, less often, a trajectory — the slope across visits. Everything else in the series is treated as noise and discarded, usually before anyone looks at it, by the act of averaging.
The point answers: where is the patient? The slope answers: where is the patient going? A companion framework has argued that the slope carries information the point cannot, and specified when trajectory judgments are warranted (O’Leary, 2026b). This paper concerns what remains after both are extracted.
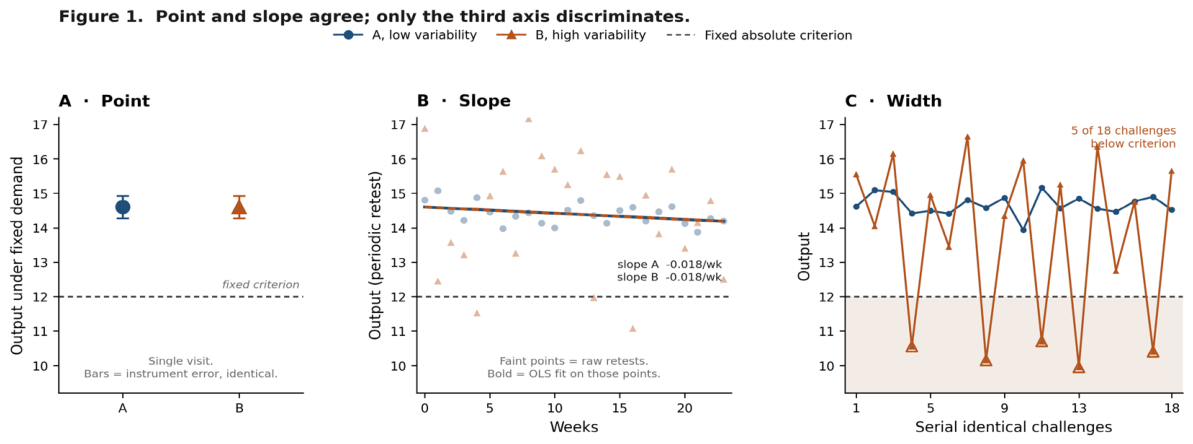
What remains is the scatter. Figure 1 shows two patients constructed to be indistinguishable on both existing statistics. In Panel A, a single visit with identical instrument error: both clear the criterion, and nothing in the visit distinguishes them. In Panel B, twenty-four weeks of periodic retest: the fitted trajectories are identical to the third decimal. Every statistic that serial functional measurement currently reports has now been extracted, and the two patients are the same patient.
They are not the same patient. Panel C shows the same series against the same fixed criterion, read for the axis the first two panels discard. Patient A’s performances cluster; patient B’s swing. On five of eighteen serial identical challenges, patient B’s performance falls below the criterion that his mean, his most recent value, and his fitted slope all comfortably clear.
The claim of this paper is that Panel C is not a statistical curiosity about Panel B’s residuals. It is the panel on which the adverse events will occur.
II — The Third Axis
Level, direction, steadiness. Point, slope, width. Each is a distinct statistic of the same series; each can move while the other two are held; each answers a different clinical question. The first two have instruments, literatures, and reimbursement codes. The third has none of these in serial functional assessment, and — the sharper observation — it has no word there, although every experienced clinician has seen it. The patient who is “good on his good days.” The family that says it depends on the day. The therapist who charts inconsistent effort when the effort is consistent and the capacity is not.
Three conditions must hold before the width of a series can be read as a property of the patient rather than of the measurement.
A fixed absolute criterion. The task is specified in external, absolute units and does not change across the series. This condition is inherited from the measurement rule developed elsewhere in this program (O’Leary, 2026a), and it does double work here. First, dispersion is only estimable across challenges that are actually identical; a task that is adjusted to the patient — lightened on bad days, normalized to current maximum — absorbs the dispersion into the adjustment and returns a series flatter than the patient. Second, the criterion is what converts dispersion from a statistic into a consequence. Variance around a mean is arithmetic. Variance across a threshold is a count of failures.
Serial identical challenge, with the count reported. One measurement estimates no width. A handful estimates it badly. The blood pressure precedent is direct on this point and it is a finding, not a caveat: the predictive strength of visit-to-visit variability for stroke increased with the number of visits over which it was computed (Rothwell et al., 2010). More measurements did not merely narrow the confidence interval; they strengthened the association. Measurement count is a dose, and any report of a dispersion statistic without its n is uninterpretable.
A noise model. Instrument error, learning and practice effects across early administrations, and identifiable day-level states — acute illness, poor sleep, a medication change — must be separable from the residual dispersion, or the axis measures the protocol rather than the patient. This is an operational burden, it is real, and Section V takes it up rather than waving at it.
Given the three conditions, the quantity is unglamorous: the dispersion of performance across serial identical challenges at a fixed absolute criterion, reported with its measurement count — and, as the clinically legible summary, the criterion-failure fraction: the proportion of challenges on which performance fell below the fixed criterion. Figure 1C reports it as a count, five of eighteen, because a count is what a family understands and what a chart can carry.
III — Risk Lives in the Trough
Why should the width matter, once the level and the slope are known? Because the events that functional assessment exists to predict do not occur at the mean.
A fall does not occur at a patient’s average postural control. It occurs at the intersection of a bad day and a demand. A failed transfer, a near-syncope on the stairs, the morning the caregiver could not get him up — each occurs in the lower tail of the patient’s distribution, on an occasion when the demand arrived and the capacity available that day was below it. The mean is where the patient lives; the trough is where the patient fails.
This gives high dispersion a double meaning, and the two halves should be stated separately because they have different consequences.
First, the epistemic half. If the patient’s performances are widely dispersed, then any single measurement — the annual visit, the pre-operative assessment, the one gait speed in the chart — is an unreliable estimate of that patient, and unreliable in a specific direction of harm: a single measurement drawn from a wide distribution will usually be drawn from its bulk, above the threshold, and will therefore usually reassure. The width degrades the very measurement practice that fails to detect the width. Current practice is not neutral about this patient; it is systematically optimistic about him.
Second, the physiological half. Independent of measurement, a patient whose distribution is wide is nearer the threshold than his mean suggests, because a fixed fraction of his days already lie below it. Panel C’s two patients have the same mean distance from the criterion; only one of them has already crossed it five times. The distance that matters is not mean-to-threshold. It is trough-to-threshold, and for patient B it is negative.
A companion construct in this program named a phenotype that hides in time — decline invisible between measurement points (O’Leary, 2026b). The present observation is its sibling: a risk that hides in variance. Both are invisible to the point. The first is at least visible to the slope. The second is invisible to both, which is why it is the last to be found.
IV — Precedent in Another Variable
The strongest reason to take the third axis seriously is that it has already been validated, thoroughly and at scale, in a variable nobody expected it in.
Blood pressure was, for decades, a mean. Visit-to-visit fluctuation around the mean was treated as noise — measurement error, white-coat artifact, a reason to average more readings. Then Rothwell and colleagues read the discarded axis directly: in cohorts followed with repeated visits, visit-to-visit variability in systolic pressure predicted stroke strongly and independently of mean pressure, with hazard in the top decile of variability several-fold that of the bottom (Rothwell et al., 2010). Three internal findings carry directly to the present argument. The association strengthened as the number of visits used to compute variability increased — the dose–response of measurement count already imported into Section II. Maximum systolic pressure reached was more predictive than mean pressure — the extreme, not the average, carried the risk. And episodic hypertension carried a worse prognosis than stable hypertension at similar means — steadiness itself was protective.
The companion finding is the one with teeth. In a meta-analysis of antihypertensive trials, drug classes differed systematically in their effect on visit-to-visit variability: beta blockers increased it dose-dependently and were least effective at preventing stroke, while calcium-channel blockers and diuretics reduced it and prevented stroke best — effects independent of the drugs’ effects on mean pressure (Webb et al., 2010). A treatment that improved the measured point while degrading the dispersion produced worse outcomes. The objective function was misspecified: the target was the mean, and the mean was not where the risk lived.
One inversion, and it should be stated rather than left for a reviewer to find. For blood pressure, the dangerous extreme is the peak — the surge that injures the vessel. For functional reserve, the dangerous extreme is the trough — the day the capacity is below the demand. The structure transfers; the sign flips. What transfers unchanged is the lesson: in both variables, the extreme carries the risk, the mean hides it, and an instrument or an intervention judged only on the mean can be worse than uninformative. It can be selecting for the failure it does not measure.
The same shape appears in glycemic control. Short-term glycemic variability explains hypoglycemia more than mean glucose does at the clinically dangerous threshold (Monnier et al., 2020) — another trough event, another mean that reassures, another discarded axis that is where the harm occurs. The precedent is not unique to pressure. It is unique to any quantity that was allowed to become a mean.
V — The Measurement Asymmetry
The transfer from blood pressure to reserve faces one honest objection, and it should be put at full strength because a reviewer will find it in minutes.
A cuff is passive. Blood pressure variability was measurable across decades of routine visits because measuring pressure costs the patient nothing and changes nothing. Reading the variability of a margin is different in kind: a margin is revealed under challenge, serial dispersion estimation therefore implies repeated loading toward the limit, and repeated near-maximal loading is itself a stimulus — a training dose, a fatigue dose, or in a frail patient a risk. The instrument perturbs the quantity. The blood pressure precedent validates the axis; it does not supply the instrument.
Two answers, one available now and one requiring work.
The available answer is passive derivation. Thigh-worn accelerometry already separates laboratory sit-to-stand capacity from free-living maximal performance; the 2023 paper names the difference an STS reserve, larger in younger and higher-functioning adults and smaller where everyday transfers consume more of what the patient has left (Löppönen et al., 2023). The same instrument class already records day-to-day variability in free-living sit-to-stand intensity, with reproducibility across days and across a year (Löppönen et al., 2021). That year-to-year reproducibility is preliminary evidence against a pure-occasion reading of the axis: a version of falsifier 3 has already partly survived in free-living data. In a prospective cohort of 340 community-dwelling older adults, free-living sit-to-stand characteristics predicted four-year decline in lower-extremity function — and in that cohort the number of transitions and the mean velocity predicted nothing; the peak did (Löppönen et al., 2024). The instrument already shows the paper’s central claim inside its own outcome data: the extreme carried the information. Whether the series’ dispersion carries independent risk remains the open question. The instrument class exists. The axis is not unmeasurable in principle.
The answer requiring work is dose-aware protocol design: serial submaximal fixed-criterion challenges spaced beyond the recovery interval of the governing domain, so that the series samples the patient’s state rather than the protocol’s fatigue. That design burden is real, it is shared with all serial challenge testing, and it is specified rather than solved here.
VI — Relation to Complexity Loss
One neighboring framework must be addressed directly, because at first reading it appears to make the opposite claim.
The complexity-loss framework holds that healthy physiology is rich in fine-grained fluctuation — the beat-to-beat, stride-to-stride variability of continuous regulatory signals — and that aging and disease flatten it, so that loss of variability marks loss of adaptive capacity (Lipsitz & Goldberger, 1992). Here, gain of variability is proposed as a risk marker. Variability cannot be both health and disease unless the two claims concern different quantities, and they do. The distinction is timescale and object. Complexity is read from the fluctuation structure of a continuous signal at rest, on scales of milliseconds to minutes, within a single recording. Reserve variability is read from the dispersion of task performance under challenge, across days to weeks, across recordings. One is the texture of regulation; the other is the steadiness of output.
Stated as a hypothesis, and marked as one: the two may be ends of a single relationship. A system rich in fast regulatory variability can absorb perturbation and deliver steady output; a system whose fast dynamics have simplified delivers its instability at the output, where the task is. On that reading, variability does not disappear with aging — it migrates, from the fine-grained interior where it is adaptive to the task level where it is dangerous. The discriminating prediction, which keeps this a hypothesis rather than a rhyme: within persons measured on both instruments, loss of fine-grained complexity in continuous signals should precede or accompany gain of task-level performance dispersion, and the two should be inversely related across aging. If instead the two variabilities rise and fall together, the migration reading is wrong and the frameworks are merely adjacent.
If the migration reading survives, the two frameworks describe one variable in two locations, and the clinical question in every case is not how much variability but where it lives. That sentence is speculation. It is not the claim of this paper.
VII — What Would Count as Evidence
The construct is falsified, or shown to be redundant, under any of the following, measured under the conditions of Section II:
- • Dispersion across serial fixed-criterion challenges adds no predictive value for falls, hospitalization, or functional decline beyond level and trajectory. The axis is then real arithmetic and empty clinic, and the paper’s claim fails.
- • Dispersion, level and trajectory are not separably estimable in serial identical-challenge data — dispersion is recoverable from the level, the slope, or both, once measurement error is accounted for. The third axis is then not a third axis, and the paper’s second proposal fails outright.
- • The criterion-failure fraction predicts no better than the mean’s distance to the criterion. The trough logic is then decoration on a level statistic.
- • Within-person dispersion is unstable across repeated equivalent series — a property of occasions rather than of persons. A dispersion that does not travel with the patient is not a patient characteristic.
- • Dispersion reduces to identifiable day-level confounders — illness, sleep, medication timing — with nothing residual. The axis is then a symptom diary in disguise, useful but not new.
- • The Section VI prediction fails in the specific direction of covariation: fine-grained complexity and task-level dispersion rise and fall together within persons. The migration hypothesis is then wrong, though the axis itself may survive on the tests above.
The positive program is equally stateable: existing serial-measurement cohorts with repeated performance testing could be re-read for the third axis tomorrow, without new data collection, by computing within-person dispersion and criterion-failure fractions against fixed absolute thresholds and testing them against recorded outcomes. The variable has been collected for decades. It has been collected, averaged, and thrown away.
VIII — Limitations
The construct is untested; every clinical claim above is a prediction. Separability from level and trajectory is asserted nowhere in this paper as an established property, and the decomposition it would require has not been performed on serial functional data by anyone; it is stated as the paper’s own prediction and listed among the falsifiers. Figure 1 is illustrative, constructed to hold point and slope while varying width; it is an argument, not data. The measurement asymmetry of Section V is answered in architecture but not in validated protocol; the free-living sit-to-stand work supplies an instrument class, a named reserve, year-to-year stability of intensity, and prospective prediction from peak velocity — not a test of dispersion against outcomes. Learning effects contaminate the early portion of any serial challenge series and must be modeled or discarded by a rule stated before data collection. No dispersion statistic is nominated as primary — standard deviation, coefficient of variation, and criterion-failure fraction have different properties near a threshold, and the choice is empirical work this paper has not done. The blood pressure precedent is a structural analogy from a passively measured variable; nothing here assumes its effect sizes transfer. And the prior-art position of this specific proposal — dispersion of challenge performance against a fixed absolute criterion in functional assessment — rests on a defined search of the neighboring literatures, not on a universal absence claim.
Acknowledgements
Use of artificial intelligence. AI tools were used for background research, citation retrieval, and output formatting. All content and conclusions were created by the author, who is solely responsible for the work.
Funding
None reported.
Conflict of interest
The author declares no competing interests.
Data availability
Not applicable; no new data were generated or analysed. All values in Figure 1 are illustrative.
Ethics
Not applicable; conceptual article.
References
- Blumberg MJ, Petersson AM, Jones PW, et al. Differential sensitivity of intraindividual variability dispersion and global cognition in the prediction of functional outcomes and mortality in precariously housed and homeless adults. Clin Neuropsychol. 2024. PMID 38444068. [CrossRef]
- Fried LP, Tangen CM, Walston J, et al. Frailty in older adults: evidence for a phenotype. J Gerontol A Biol Sci Med Sci. 2001;56(3):M146–M156.
- Haynes BI, Bauermeister S, Bunce D. A systematic review of longitudinal associations between reaction time intraindividual variability and age-related cognitive decline or impairment, dementia, and mortality. J Int Neuropsychol Soc. 2017;23(5):431–445. PMID 28462758. [CrossRef]
- Hultsch DF, MacDonald SWS, Dixon RA. Variability in reaction time performance of younger and older adults. J Gerontol B Psychol Sci Soc Sci. 2002;57(2):P101–P115. PMID 11867658. [CrossRef]
- Lin J, Kelley-Moore JA. From noise to signal: the age and social patterning of intra-individual variability in late-life health. J Gerontol B Psychol Sci Soc Sci. 2017;72(1):168–179. PMID 26320123. [CrossRef]
- Lipsitz LA, Goldberger AL. Loss of ‘complexity’ and aging: potential applications of fractals and chaos theory to senescence. JAMA. 1992;267(13):1806–1809.
- Löppönen A, Karavirta L, Portegijs E, et al. Day-to-day variability and year-to-year reproducibility of accelerometer-measured free-living sit-to-stand transitions volume and intensity among community-dwelling older adults. Sensors. 2021;21(18):6068. [CrossRef]
- Löppönen A, Delecluse C, Suorsa K, et al. Association of sit-to-stand capacity and free-living performance using thigh-worn accelerometers among 60- to 90-yr-old adults. Med Sci Sports Exerc. 2023;55(9):1525–1532. [CrossRef]
- Löppönen A, Karavirta L, Finni T, et al. Free-living sit-to-stand characteristics as predictors of lower extremity functional decline among older adults. Med Sci Sports Exerc. 2024;56(9):1672–1677. [CrossRef]
- Monnier L, Wojtusciszyn A, Molinari N, et al. Respective contributions of glycemic variability and mean daily glucose as predictors of hypoglycemia in type 1 diabetes: are they equivalent? Diabetes Care. 2020;43(4):821–827. [CrossRef]
- O’Leary RT. The preservation of functional reserve: a control-systems framework for human aging. Life. 2026a;16(9):1457. [CrossRef]
- O’Leary RT. When trajectory judgments are warranted: the point–trajectory framework for serial functional performance. Submitted for publication. 2026b.
- Rothwell PM, Howard SC, Dolan E, et al. Prognostic significance of visit-to-visit variability, maximum systolic blood pressure, and episodic hypertension. Lancet. 2010;375(9718):895–905.
- Webb AJS, Fischer U, Mehta Z, Rothwell PM. Effects of antihypertensive-drug class on interindividual variation in blood pressure and risk of stroke: a systematic review and meta-analysis. Lancet. 2010;375(9718):906–915.
Figure 1.
Point and slope agree; only the third axis discriminates. Two illustrative patients, A (low variability, circles) and B (high variability, triangles), measured against a fixed absolute criterion (dashed line). (A) Point. A single visit; error bars show identical instrument error. Both patients clear the criterion and are indistinguishable. (B) Slope. Twenty-four weeks of periodic retest; faint points are raw values, bold lines are ordinary least-squares fits. The fitted slopes are identical (−0.018 per week for both); trajectory does not discriminate. (C) Width. Eighteen serial identical challenges against the unchanged criterion. Patient A’s performances cluster above it; patient B, with the same mean and the same slope, falls below the criterion on five of eighteen challenges (open markers, shaded region). The fitted trajectories are indistinguishable; the raw dispersion that distinguishes the patients becomes consequential only against the fixed criterion. All values illustrative.
Figure 1.
Point and slope agree; only the third axis discriminates. Two illustrative patients, A (low variability, circles) and B (high variability, triangles), measured against a fixed absolute criterion (dashed line). (A) Point. A single visit; error bars show identical instrument error. Both patients clear the criterion and are indistinguishable. (B) Slope. Twenty-four weeks of periodic retest; faint points are raw values, bold lines are ordinary least-squares fits. The fitted slopes are identical (−0.018 per week for both); trajectory does not discriminate. (C) Width. Eighteen serial identical challenges against the unchanged criterion. Patient A’s performances cluster above it; patient B, with the same mean and the same slope, falls below the criterion on five of eighteen challenges (open markers, shaded region). The fitted trajectories are indistinguishable; the raw dispersion that distinguishes the patients becomes consequential only against the fixed criterion. All values illustrative.
Disclaimer/Publisher’s Note: The statements, opinions and data contained in all publications are solely those of the individual author(s) and contributor(s) and not of MDPI and/or the editor(s). MDPI and/or the editor(s) disclaim responsibility for any injury to people or property resulting from any ideas, methods, instructions or products referred to in the content. |
© 2026 by the authors. Licensee MDPI, Basel, Switzerland. This article is an open access article distributed under the terms and conditions of the Creative Commons Attribution (CC BY) license (http://creativecommons.org/licenses/by/4.0/).
Copyright: This open access article is published under a Creative Commons CC BY 4.0 license, which permit the free download, distribution, and reuse, provided that the author and preprint are cited in any reuse.