

Submitted:
05 September 2026
Posted:
08 September 2026
You are already at the latest version
Abstract
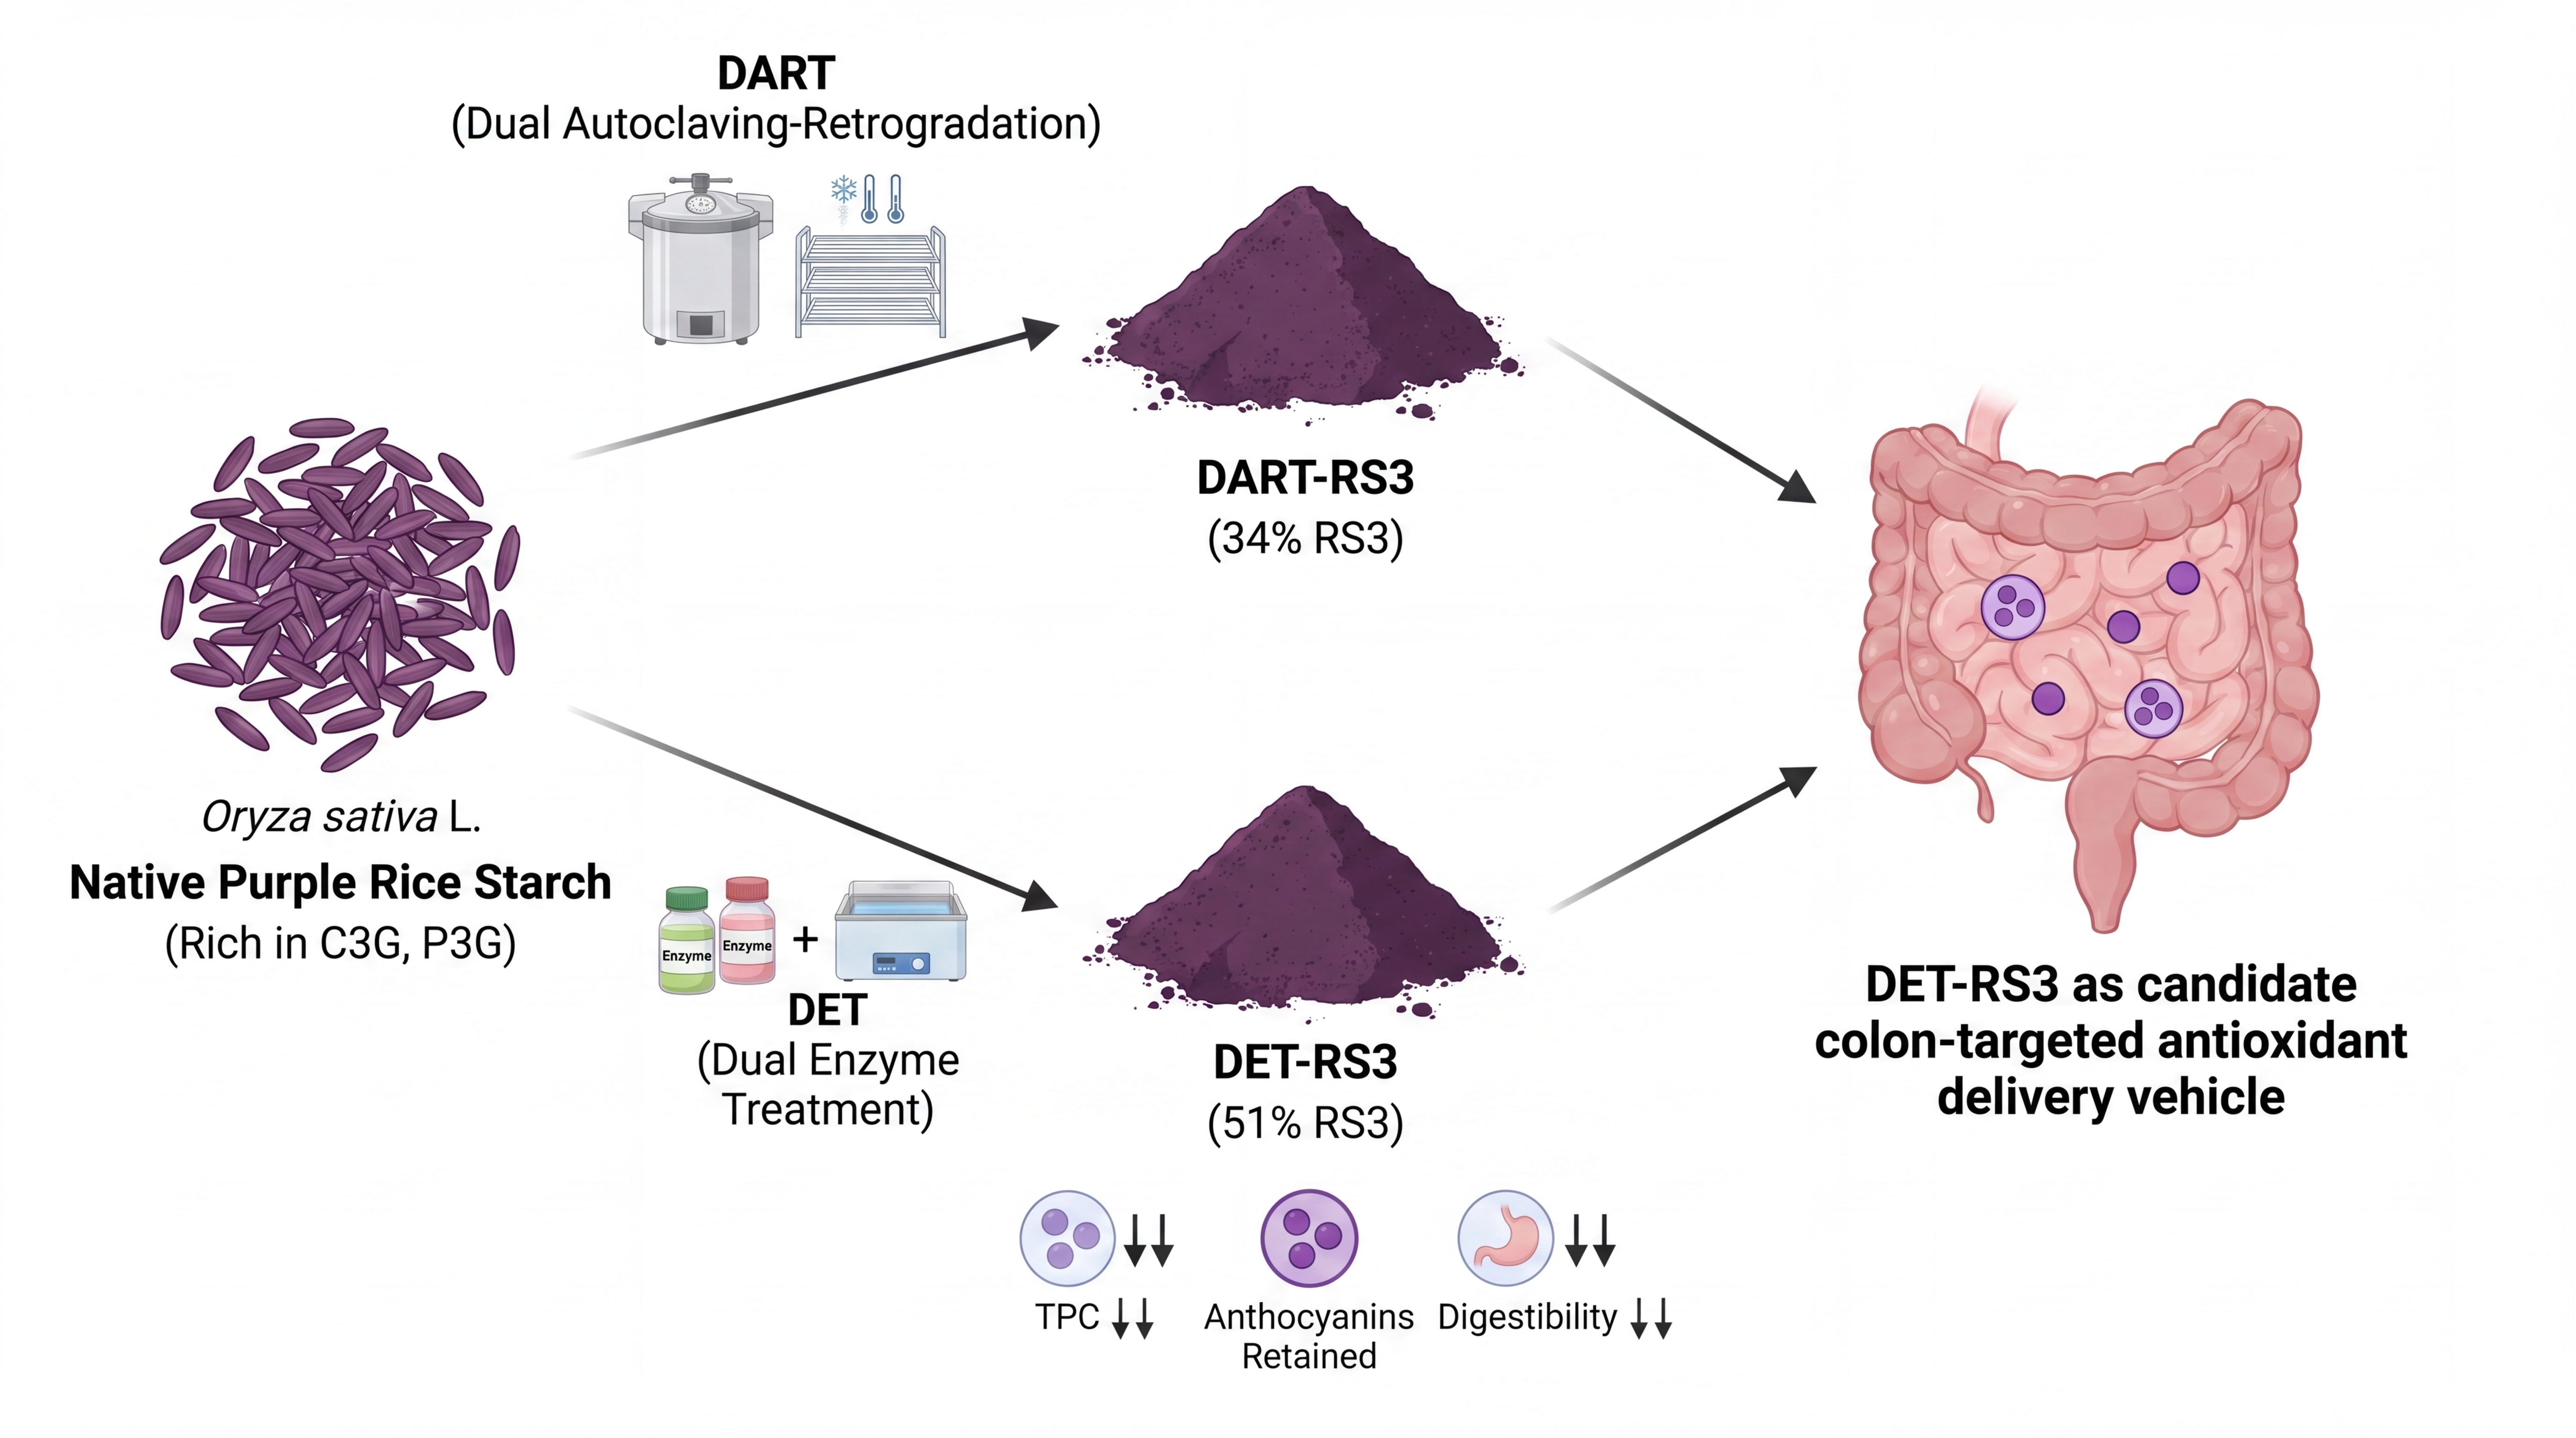
Purple rice (Oryza sativa L.) is a pigmented plant-based food whose starch is rich in the anthocyanins cyanidin-3-glucoside (C3G) and peonidin-3-glucoside (P3G), yet is largely rapidly digestible and confers a high glycemic index that limits its dietary use. Converting native starch into resistant starch type III (RS3) via dual autoclav-ing-retrogradation treatment (DART) or dual enzyme treatment (DET) lowers digesti-bility, but the conditions required compromise anthocyanin stability. This study tracked how these two food-processing routes govern phenolic and anthocyanin fate, structure and digestibility. RS3 content rose from 5.35% (native) to 34.13% (DART) and 51.34% (DET), while total phenolic content fell by 76.1% and 71.4% and the starch darkened (L* 68.27 to 43.49 and 28.25); free C3G became undetectable after DART but was partly retained (11.86 mg/100 g) after DET. X-ray diffraction showed A-type to B-type conversion after DART, whereas DET gave a mixed B+V-type pattern with a diagnostic peak near 2θ ≈ 19°, coinciding with greater phenolic retention. Both RS3 products resisted simulated digestion, with DET-RS3 limiting intestinal hydrolysis to 12.72% versus 30.71% for native starch. Processing thus entails a nutritional trade-off, partly offset in DET by amylose-phenolic complexation, positioning purple-rice RS3 as a candidate colon-targeted antioxidant delivery vehicle.
Keywords:
plant-based food
; food processing
; phenolic stability
; antioxidant activity
; purple rice
; resistant starch type III
; anthocyanins
; amylose-phenolic complex
; V-type crystallinity
; in vitro digestibility
1. Introduction
Among the staple cereal grains consumed worldwide, purple rice (Oryza sativa L.) is increasingly recognized by health-conscious consumers as a rich source of phytochemicals concentrated in the bran and pericarp layers [1]. The purple rice pericarp and aleurone layers accumulate substantial concentrations of anthocyanins, principally cyanidin-3-glucoside (C3G) and peonidin-3-glucoside (P3G) [2], together with phenolic acids such as ferulic, protocatechuic, p-coumaric and vanillic acid [3]. These compounds display potent free-radical-scavenging capacity and have been associated with a reduced risk of hyperlipidemia, insulin resistance, cardiovascular disease and cellular inflammation [4,5,6].
However, a significant nutritional paradox underlies these functional benefits. Rice starch, which constitutes more than 80% of the grain by weight, is classified predominantly as rapidly digestible starch (RDS) [7]. On ingestion, salivary and pancreatic α-amylases hydrolyze this fraction rapidly to glucose, producing a high glycemic index (GI); habitual consumption of high-GI staples is a recognized dietary risk factor for hyperglycemia and type 2 diabetes [8]. This paradox constrains the application of purple rice as a functional or therapeutic food for individuals with metabolic syndrome, since the benefits conferred by its anthocyanins may be offset by the glycemic burden of its carbohydrate matrix. Viewed from an ingredient perspective, the consequence is that the starch fraction—by far the most abundant component of the pigmented grain—remains underexploited, valued chiefly as a source of digestible calories, while the phytochemical interest attached to the crop is concentrated almost entirely in its minor bran fraction. Upgrading this dominant fraction into a low-glycemic, phenolic-bearing material would therefore recover considerably more nutritional value from a pigmented cereal that is presently used well below its functional potential.
Converting native starch into resistant starch type III (RS3) is a well-established strategy for lowering the glycemic impact of starchy foods. RS3 forms when gelatinized amylose and amylopectin chains retrograde into densely packed double-helical crystallites that resist amylolytic attack in the upper gastrointestinal tract [9,10]. Two complementary approaches are commonly used to promote RS3 formation: physical modification by dual autoclaving-retrogradation treatment (DART), and biological modification by dual enzyme treatment (DET). In DART, repeated cycles of autoclaving and cooling promote amylose leaching and re-association into ordered double helices [11]. In DET, thermostable α-amylase first shortens glucan chains, after which the debranching enzyme pullulanase hydrolyzes the α-1,6 linkages of amylopectin to release short, linear glucan chains; these chains possess greater mobility and align more readily into compact double helices than their branched precursors, typically yielding a higher RS3 content than DART alone [12].
Both DART and DET are food-processing operations, and they carry with them a problem general to the processing of plant-based foods: a unit operation that improves one nutritional attribute frequently degrades another. Effective though these two routes are for producing low-GI starch ingredients, both impose conditions that are intrinsically hostile to anthocyanin stability. DART requires autoclaving at 121 °C under saturated steam pressure, while DET involves prolonged enzymatic incubation at 50–90 °C for up to 16 h. Anthocyanins are notably heat-labile flavonoid pigments: thermal energy promotes hydration of the flavylium cation, ring-opening of the pyrylium (C-) ring, and subsequent degradation into colorless chalcones and smaller phenolic acid fragments [13,14].
Although anthocyanin extraction and thermal stability from purple rice bran have been studied extensively [15,16,17], and recent work has begun to characterize how starch-rich matrices modulate anthocyanin accessibility and digestibility in pigmented rice systems [18], no study has yet tracked, within a single RS3-forming process, both the magnitude of bioactive-compound loss and the structural fate of the surviving fraction. In particular, it remains unresolved whether phenolic compounds that survive DART/DET processing remain freely extractable or become physically sequestered within the newly formed crystalline starch network, and, if the latter, what functional consequence this sequestration has for digestive resistance.
Recent evidence from other pigmented-starch systems supports the plausibility of such sequestration: purple/red rice bran anthocyanins have been shown to reduce rice starch digestibility by forming V-type inclusion complexes with amylose [19], and amylose content has been shown to govern V-type complex formation and digestibility in maize starch–polyphenol systems more generally, with downstream effects on human gut microbiota composition [20]. Whether an analogous amylose–phenolic architecture forms during RS3 production from purple rice starch itself, and whether its formation correlates with the degree of RS3 enhancement, has not been established.
We hypothesized that phenolic and anthocyanin fragments surviving DART/DET processing are not simply degraded and lost, but are partly retained within the retrograded starch matrix through non-covalent inclusion complexation with amylose helices, contributing a synergistic, enzyme-inhibitory component to the digestive resistance of RS3. Accordingly, the objectives of this study were to: (i) quantify the trade-off between RS3 yield and the retention of total phenolics, anthocyanins (C3G, P3G) and antioxidant capacity (DPPH, ABTS, FRAP) during DART and DET processing of purple rice starch; (ii) examine, by surface colorimetry and X-ray diffraction (XRD), whether the accompanying color change and crystalline reorganization are consistent with pigment degradation and amylose–phenolic complexation; and (iii) evaluate the physiological relevance of these structural changes by profiling in vitro digestibility of native starch and RS3 across simulated oral, gastric and intestinal phases.
2. Materials and Methods
2.1. Plant Materials and Chemicals
Purple rice (Oryza sativa L.) grain was obtained from cultivation plots in Mae Chaem District, Chiang Mai Province, northern Thailand, harvested in June 2022. Grains were dehulled and stored at 4 °C in sealed containers until further processing.
All chemicals and reagents used in this study were of analytical grade unless otherwise stated. Heat-stable α-amylase and pullulanase (both food-grade) were purchased from Reach Biotechnology (Bangkok, Thailand), and resistant starch content was determined using the Resistant Starch Assay Kit (Rapid) from Megazyme (Bray, Ireland). Reference standards of cyanidin-3-glucoside and peonidin-3-glucoside were obtained from Extrasynthese (Genay, France). Folin–Ciocalteu reagent, gallic acid, and sodium hydroxide were purchased from Merck (Darmstadt, Germany). 1,1-Diphenyl-2-picrylhydrazyl (DPPH), 2,2′-azino-bis(3-ethylbenzothiazoline-6-sulfonic acid) diammonium salt (ABTS), 6-hydroxy-2,5,7,8-tetramethylchroman-2-carboxylic acid (Trolox), 3,5-dinitrosalicylic acid (DNS), maleic acid, ammonium carbonate, phosphoric acid, and pancreatin from porcine pancreas were purchased from Sigma-Aldrich (St. Louis, MO, USA). 2,4,6-Tripyridyl-s-triazine (TPTZ) was obtained from Fluka Chemika (Buchs, Switzerland), while ferric chloride hexahydrate, phenol, sodium hydrogen carbonate, sodium chloride, and magnesium chloride hexahydrate were obtained from Loba Chemie (Mumbai, India). Potassium chloride and potassium dihydrogen phosphate were purchased from KemAus (Cherrybrook, NSW, Australia); ethanol, sodium acetate trihydrate, and calcium chloride dihydrate were obtained from RCI Labscan (Bangkok, Thailand); and acetic acid, potassium persulfate, and sulfuric acid were obtained from QReC (New Zealand).
2.2. Native Starch Extraction
Native starch was isolated from dehulled purple rice grains by alkaline steeping, adapted from Ju et al. [21]. Briefly, grains were steeped in distilled water at 4 °C for 24 h, wet-milled, and passed through a 100 μm sieve. The resulting slurry was held at 4 °C for 48 h, and the sedimented starch cake was resuspended in 0.35% (w/v) sodium hydroxide solution at 4 °C for 48 h to solubilize residual protein. The starch was washed repeatedly with distilled water, neutralized to pH 7.0 with 0.1 M hydrochloric acid, allowed to settle at 4 °C for 24 h, and finally dried in a convection oven at 40 °C for 24 h. The resulting powder was designated “native purple rice starch.”
2.3. Preparation of RS3 by DART and DET
Two independent modification routes were used to convert native starch into RS3.
2.3.1. Dual Autoclaving-Retrogradation Treatment (DART)
Native starch was suspended in distilled water at a 1:4 (w/v) starch-to-water ratio and autoclaved at 121 °C for 30 min to ensure complete gelatinization. The gelatinized paste was cooled to ambient temperature and stored at 4 °C for 24 h to induce amylose retrogradation; the autoclaving–retrogradation cycle was then repeated once more (two cycles total), after which the sample was dried at 45 °C and milled to a fine powder [11].
2.3.2. Dual Enzyme Treatment (DET)
The optimal enzymatic parameters (temperature, pH, reaction time, enzyme loading and substrate concentration for both the α-amylase and pullulanase steps) were established in preliminary single-factor optimization experiments and are summarized here. Native starch (25%, w/v) was pre-gelatinized in distilled water at 80 °C for 20 min (pH 6.0), then treated with heat-stable α-amylase (4 U/g) at 90 °C for 15 min (pH 5.5) to reduce glucan chain length. The mixture was then cooled to 50 °C, adjusted to pH 4.5, and treated with pullulanase (10 U/g) for 16 h to debranch amylopectin. The hydrolyzed slurry was cooled at 4 °C for 24 h to allow retrogradation. The retrograded material then underwent a purification and isolation step to concentrate the resistant fraction: it was treated with a further dose of thermostable α-amylase (1%, w/w) in a boiling water bath (95 °C) for 45 min, which hydrolyzed the remaining rapidly and slowly digestible starch fractions, and the insoluble residue enriched in RS3 was then recovered by centrifugation (4000× g, 15 min). The recovered pellet was washed with 95% (v/v) ethanol under shaking, collected by a second centrifugation (4000× g, 15 min), dried at 40 °C, and sieved (100 μm) [12].
2.4. Determination of RS Content
RS content of native starch and both RS3 preparations was determined according to AOAC Method 2002.02, using the Megazyme Resistant Starch Assay Kit (Rapid) [22,23]. Briefly, samples were incubated with pancreatic α-amylase and amyloglucosidase in sodium maleate buffer (pH 6.0) at 37 °C for 4 h in a shaking water bath to simulate small-intestinal digestion. The non-hydrolyzed (resistant) pellet was solubilized in ice-cold 1.7 M sodium hydroxide, fully hydrolyzed to glucose with amyloglucosidase, and the glucose released was quantified spectrophotometrically at 510 nm using the glucose oxidase/peroxidase (GOPOD) reagent. Results are expressed as g RS/100 g sample on a dry-weight basis (dwb).
2.5. Determination of Total Phenolic Content, Anthocyanin Composition, and Antioxidant Capacity
Samples were extracted with 80% (v/v) ethanol (1:10, w/v) for 3 h at room temperature and centrifuged (4000× g, 10 min); the clarified supernatant was used for the following analyses.
2.5.1. Total Phenolic Content
Total phenolic content (TPC) was determined by the Folin–Ciocalteu method [24], with absorbance read at 765 nm and results expressed as mg gallic acid equivalents (GAE)/100 g dwb.
2.5.2. Anthocyanin Analysis by HPLC
Anthocyanins were quantified by reverse-phase HPLC (Agilent 1200, Agilent Technologies, Santa Clara, CA, USA) fitted with a Symmetry RP18 column (4.6 × 250 mm, 5 μm) and a multiwavelength detector set at 520 nm, focusing on C3G and P3G [25]. The mobile phase comprised 3% (v/v) phosphoric acid in acetonitrile and 3% (v/v) phosphoric acid in water, eluted as a linear gradient (10–20% acetonitrile) over 40 min at 1.0 mL/min.
2.5.3. Antioxidant Capacity Assays
Antioxidant capacity was assessed by DPPH and ABTS radical-scavenging assays (results expressed as % inhibition) and by the ferric-reducing antioxidant power (FRAP) assay (results expressed as μmol Fe(II)/g dwb) [24,26]. For the two radical assays, extracts were tested across a series of dilutions and the resulting dose-response curves were used to derive the concentration required to scavenge 50% of the radical (IC50, mg/mL); activity was additionally expressed as Trolox equivalents (mg TE/100 g dwb) against a Trolox calibration curve. FRAP results are expressed as μmol Fe(II)/100 g dwb.
2.6. Appearance, Color and Structural Reorganization Analysis
The appearance of the dried preparations was recorded photographically under diffuse illumination against a neutral background. Surface color was measured with a chroma meter (CR-400, Konica Minolta Sensing Inc., Osaka, Japan) and expressed in the CIELAB color space as L* (lightness, 0 = black to 100 = white), a* (green to red) and b* (blue to yellow); measurements were made in triplicate on the dried, milled powders. Crystalline structure was analyzed by X-ray diffraction (XRD; MiniFlex II, Rigaku Corp., Tokyo, Japan) using CuKα radiation (λ = 0.154 nm, 40 kV, 30 mA) over a 2θ range of 5–40° at a scan rate of 2°/min [27]. Relative crystallinity was estimated from the diffractograms following the method of Nara and Komiya [28].
2.7. In Vitro Gastrointestinal Digestibility
The susceptibility of native purple rice starch and both RS3 preparations to enzymatic hydrolysis was evaluated using a sequential, three-phase static in vitro digestion model reproducing oral, gastric and small-intestinal conditions, adapted from Aisara et al. [29]. Each phase was conducted at 37 °C over 120 min, with aliquots withdrawn at 0, 30, 60, 90 and 120 min for quantification of liberated reducing sugars. All determinations were performed in triplicate.
2.7.1. Simulated Oral Phase
An aliquot (50 μL) of sample suspension at an initial concentration of 100 mg/mL was combined with 375 μL of simulated salivary fluid (SSF; 15.1 mM KCl, 3.7 mM KH2PO4, 13.6 mM NaHCO3, 0.15 mM MgCl2, 0.06 mM (NH4)2CO3, 1.5 mM CaCl2; pH 7.0), 25 μL of salivary α-amylase (100 U/mL, dissolved in SSF), 1.25 μL of 0.3 M CaCl2 and 48.75 μL of distilled water. The reaction mixture was incubated at 37 °C for 120 min and sampled at 30 min intervals. Enzymatic activity in each withdrawn aliquot was terminated by immersion in a boiling water bath (100 °C) for 10 min prior to analysis.
2.7.2. Simulated Gastric Phase
Samples standardized to an initial total carbohydrate concentration of 10 g/L were adjusted to pH 2.5 with 0.2 M HCl to reproduce gastric acidity and subsequently incubated at 37 °C. Aliquots withdrawn at 0, 30, 60, 90 and 120 min were immediately neutralized with 0.2 M sodium bicarbonate to arrest acid hydrolysis before quantification.
2.7.3. Simulated Intestinal Phase
An aliquot (50 μL) of sample suspension at an initial concentration of 100 mg/mL was mixed with 375 μL of simulated intestinal fluid (SIF; 6.8 mM KCl, 0.8 mM KH2PO4, 85 mM NaHCO3, 38.4 mM NaCl, 0.33 mM MgCl2, 0.6 mM CaCl2) containing 25 μL of 0.3% (w/v) pancreatin solution, together with 31.25 μL of SSF, 1.25 μL of 0.3 M CaCl2 and 48.75 μL of distilled water. The reaction mixture was incubated at 37 °C for 120 min, and enzymatic activity was terminated in a boiling water bath (100 °C) for 10 min.
2.7.4. Quantification of Starch Hydrolysis
For each digestive phase, reducing sugars liberated into the digesta were quantified by the 3,5-dinitrosalicylic acid (DNS) method [30], and the total sugar content of the corresponding sample was determined by the phenol–sulfuric acid method [31]. The extent of starch hydrolysis at each sampling interval was expressed as a percentage of the hydrolysable carbohydrate pool, calculated according to Korakli et al. [32] as given in Equation (1):
where RSrel is the concentration of reducing sugars released at the sampling time, TS is the total sugar content of the sample, and RS0 is the initial reducing sugar content prior to digestion.
Hydrolysis (%) = [RSrel / (TS − RS0)] × 100
2.8. Statistical Analysis
All analyses were performed in triplicate, and results are expressed as mean ± standard deviation. Data were evaluated by one-way analysis of variance (ANOVA) followed by Duncan’s multiple range test, or by independent-samples t-test where appropriate, using SPSS Statistics (version 22.0; IBM Corp., Armonk, NY, USA). Differences were considered statistically significant at p < 0.05.
3. Results
3.1. Structural Transitions and RS3 Enhancement
Both DART and DET markedly increased the RS content of purple rice starch relative to the native substrate (Table 1). Native purple rice starch contained only 5.35 ± 0.14 g RS/100 g dwb, consistent with its classification as a predominantly rapidly digestible starch. DART increased RS content 6.37-fold, to 34.13 ± 0.65 g/100 g dwb, while DET achieved a substantially greater, 9.60-fold increase, to 51.34 ± 0.35 g/100 g dwb.
The three preparations were also readily distinguishable by eye (Figure 1). Native purple rice starch was a fine, uniformly pale purple powder (Figure 1a). The DART product was a deeper, more saturated red-purple powder in which brittle aggregates of the retrograded cake persisted after milling (Figure 1b), whereas DET gave a fine, uniform brown powder in which no purple hue remained (Figure 1c). The instrumental color values (Table 1) quantify this change: lightness fell from L* = 68.27 ± 0.18 in the native starch to 43.49 ± 0.25 after DART and 28.25 ± 0.50 after DET, while redness rose from a* = 4.83 ± 0.06 to 13.16 ± 0.10 (DART) and 10.25 ± 0.32 (DET). Yellowness increased after DART (b* = 7.14 ± 0.06) but decreased after DET (3.24 ± 0.19) relative to the native starch (4.33 ± 0.38). All three color coordinates differed significantly among the samples (p < 0.05).
3.2. Total Phenolic Content, Anthocyanin Composition and Antioxidant Capacity
The gains in RS3 content were accompanied by a measurable reduction in the phenolic and anthocyanin content of the starch (Table 2). Native purple rice starch contained 115.50 ± 1.08 mg GAE/100 g TPC and 36.98 ± 0.10 mg/100 g C3G, its dominant anthocyanin, alongside 4.57 ± 0.06 mg/100 g P3G. After DART, TPC fell to 27.59 ± 0.49 mg GAE/100 g (a 76.1% reduction) and free C3G became non-detectable (ND), while P3G was reduced to 2.95 ± 0.08 mg/100 g. DET produced a comparatively smaller decline in TPC, to 33.09 ± 0.65 mg GAE/100 g (a 71.4% reduction), and retained a measurable fraction of free C3G (11.86 ± 0.12 mg/100 g), although P3G fell below the detection limit. Antioxidant capacity declined in parallel. In the DPPH assay the concentration required for half-maximal radical scavenging rose from 37.20 ± 0.66 mg/mL in the native starch to 92.10 ± 1.12 mg/mL after DART and 114.83 ± 5.56 mg/mL after DET, with Trolox-equivalent activity falling from 13.59 ± 0.24 to 5.27 ± 0.04 and 4.82 ± 0.08 mg TE/100 g dwb, respectively. The ABTS assay recorded a comparable overall loss but ranked the two treatments in the opposite order, with IC₅₀ values of 26.36 ± 0.11 (native), 56.37 ± 0.33 (DART) and 45.12 ± 0.38 mg/mL (DET) and Trolox-equivalent activities of 17.29 ± 0.12, 7.56 ± 0.08 and 10.36 ± 0.09 mg TE/100 g dwb, respectively. Ferric-reducing power followed the ABTS ranking, falling from 4362.94 ± 118.22 to 2822.54 ± 111.16 (DART) and 2921.51 ± 227.83 μmol Fe(II)/100 g dwb (DET).
The chromatographic basis of these anthocyanin determinations is shown in Figure 2. In the mixed reference standard (Figure 2a), C3G, P3G, cyanidin and peonidin eluted at 13.01, 19.92, 25.61 and 37.09 min, respectively. Native purple rice starch (Figure 2b) exhibited both anthocyanin glycosides, with an intense C3G peak at 13.03 min and a smaller P3G peak at 20.00 min, consistent with C3G being the dominant pigment of the grain, and no aglycone peak was recorded. After DART (Figure 2c), no peak was detected at the C3G retention time, whereas P3G remained detectable, eluting at 18.49 min; a further peak corresponding to the aglycone peonidin was recorded at 37.60 min. After DET (Figure 2d), the pattern was reversed: a prominent C3G peak was retained at 12.97 min while P3G fell below the detection limit, and a peak corresponding to the aglycone cyanidin appeared at 24.60 min. These profiles corroborate the quantitative values reported in Table 2.
3.3. Crystalline Structure of Native Starch and RS3
Native purple rice starch displayed a typical A-type crystalline pattern, with diffraction peaks at 2θ ≈ 15.0°, 17.0°, 18.1° and 23.1° (Figure 3), consistent with cereal starches generally [33]. After DART, the pattern shifted to a B-type pattern, with peaks at 2θ ≈ 17.0°, 22.0° and 24.0° and no discernible peak near 19°; relative crystallinity fell from 30.52 ± 0.46% (native) to 7.14 ± 0.97% (DART). After DET, the pattern likewise moved away from the native A-type toward a B-dominant pattern, but retained a distinct additional peak at 2θ ≈ 19.3°, alongside peaks at 17.1°, 22.0° and 24.2° — a combination classified as a mixed B+V-type pattern [34,35]; relative crystallinity for DET was 11.06 ± 0.74%.
3.4. In Vitro Gastrointestinal Digestibility
Native starch and both RS3 preparations were subjected to a continuous, three-phase in vitro digestion model (Table 3, Figure 4). Native purple rice starch was hydrolyzed steadily across all three phases, reaching 11.47% hydrolysis after the oral phase, 7.96% after the gastric phase, and 30.71% after 120 min of pancreatic digestion. Both RS3 preparations showed substantially greater resistance across all three phases. In the oral phase, hydrolysis was reduced to 7.50% (DART) and 5.13% (DET); in the gastric phase, to 5.96% (DART) and 4.32% (DET). The most pronounced differences emerged in the intestinal phase, where pancreatin hydrolyzed only 20.42% of DART-RS3 and 12.72% of DET-RS3, compared with 30.71% for native starch — meaning that more than 87% of DET-RS3 remained intact after simulated upper gastrointestinal transit.
4. Discussion
The superior performance of DET relative to DART in enhancing RS3 content (Table 1) is consistent with the established mechanistic role of pullulanase, which specifically hydrolyzes the α-1,6-glycosidic branch points of amylopectin, releasing a high concentration of low-molecular-weight, linear glucan chains [36,37]. Because these linear chains possess considerably lower steric hindrance than their branched parent polymers, they exhibit greater mobility and align more readily in a parallel, ordered fashion, forming robust inter-chain hydrogen bonds and tightly packed double helices that recrystallize efficiently on cooling [38,39,40]. DART relies solely on physical gelatinization and retrogradation of the native amylose/amylopectin population without prior chain shortening, which limits the extent of ordered re-assembly attainable within two autoclaving–cooling cycles. This mechanistic contrast is reflected in the granule-level reorganization observed by SEM (Figure 1): the loss of native granular architecture after DART is consistent with disruption of the native granule and re-aggregation of leached amylose during retrogradation [11], whereas the denser, more angular network formed after DET is consistent with the formation of a compact, highly ordered network built from short, linearized glucan chains [41]. As discussed below, this densely packed matrix constitutes a plausible physical barrier that reduces the surface area accessible to digestive enzymes.
The structural gains in RS3 content came at a measurable cost to the phenolic and anthocyanin content of the starch (Table 2), confirming an unavoidable degradation of free-form anthocyanins under both treatments, consistent with the well-documented heat lability of these pigments [13,14]. Under the saturated-steam conditions of DART (121 °C, 30 min × 2 cycles), the flavylium cation of C3G and P3G is expected to undergo hydration at C-2 to form an unstable carbinol pseudobase, which subsequently opens at the pyrylium (C-) ring to yield a colorless chalcone; continued thermal exposure cleaves the chalcone further into smaller phenolic acid fragments, such as protocatechuic acid and phloroglucinaldehyde, derived from the B- and A-rings of C3G, respectively [13]. This cascade is consistent with the complete loss of extractable free C3G after DART. The chromatographic profiles provide independent support for it: aglycone peaks were recorded in both processed samples — peonidin in DART-RS3 and cyanidin in DET-RS3 (Figure 2c,d) — but in neither the reference standard blank nor the native starch. Their emergence indicates that hydrolysis of the glycosidic bond accompanies, and probably precedes, opening of the pyrylium ring: loss of the stabilizing sugar moiety yields the corresponding aglycone, which is considerably less stable than its glycoside and is itself degraded rapidly to phenolic acid fragments. The aglycones are therefore best regarded as transient intermediates along the degradation pathway rather than as retained bioactive end products, and for this reason they were not included in the quantitative determinations. It should also be noted that the residual P3G peak in DART-RS3 eluted approximately 1.4 min earlier than the corresponding peak in the reference standard (Figure 2a,c); this displacement is attributable to the substantially different sample matrix of the processed starch extract relative to the pure standard solution, and to the reduced peak intensity available for retention-time assignment at concentrations close to the limit of quantification. DET, by contrast, operates at markedly lower peak temperatures (50–90 °C); although its 16-h enzymatic incubation is not thermally inert and is expected to promote oxidative degradation of free-form phenolics over time [15,16,17], the milder thermal regime allows a larger fraction of C3G to survive in extractable form. The comparatively modest reduction in TPC after DET (71.4%) relative to the near-total loss of extractable C3G after DART is in line with reports that phenolic-content loss and anthocyanin (pigment) loss do not necessarily proceed at identical rates under processing [16,42]. The two radical assays did not rank the treatments identically. DET-RS3 retained the higher Trolox-equivalent activity in the ABTS assay and the higher ferric-reducing power, in line with its higher residual TPC and its retention of free C3G, whereas the DPPH assay placed DART-RS3 marginally ahead of DET-RS3. Discordance between these two assays is well documented and is generally attributed to differences in reaction medium and in the steric accessibility of the two radicals: DPPH is a bulky, sterically hindered radical assayed in alcoholic solution, whereas the ABTS radical cation is assayed in aqueous buffer and reacts with a broader range of hydrophilic and matrix-associated antioxidants [43]. Within the interpretation developed below, a phenolic fraction physically sequestered within the starch matrix would be expected to register more weakly against the sterically demanding DPPH radical than its measured phenolic content implies, which is the pattern observed here. A related caveat applies to the absolute values rather than to the ranking. The Folin–Ciocalteu and FRAP assays both report bulk reducing capacity rather than phenolic identity, and the Folin reagent is known to respond to reducing sugars and other non-phenolic reductants as well as to phenolics [44]; in a starch matrix this contribution is not negligible. That the two reducing assays track one another closely here, while the radical-scavenging assays return systematically lower equivalent values, is consistent with such a contribution. The Folin- and FRAP-derived figures are therefore best read as upper bounds on the phenolic pool rather than as absolute phenolic concentrations, a limitation that applies equally to all three samples and so does not affect the comparisons drawn above.
A central question raised by these findings is whether the phenolics unaccounted for in the ethanol-extractable fraction were destroyed outright or retained within the starch matrix in a non-extractable, bound form. The XRD data (Figure 2) provide evidence consistent with the latter. The peak near 2θ ≈ 19–20°, observed only in the DET diffractogram, is widely recognized as the diagnostic signature of V-type (single-helical) amylose crystallinity, distinct from the double-helical packing that produces A- and B-type patterns [45]. In the V-type conformation, amylose chains coil into a single helix whose exterior hydroxyl groups are hydrophilic, while the interior forms a hydrophobic channel capable of accommodating small aromatic guest molecules, including polyphenols [19,20]. The appearance of this V-type signature specifically in the DET-treated sample, and not in the DART-treated sample, forms a coherent pattern with the compositional data above: DET was the only treatment to retain a quantifiable fraction of free C3G (118.56 mg/100 g), and also the only treatment whose diffractogram carried the V-type peak. We interpret this correspondence as evidence that a portion of the phenolic acids and anthocyanin fragments surviving DET processing became physically entrapped within the hydrophobic cavity of coiling amylose single helices during retrogradation, forming an amylose–phenolic inclusion complex analogous to those reported for purple/red rice bran anthocyanin–starch systems [19] and polyphenol–maize starch systems more broadly [20]. Such complexes are thought to be stabilized primarily through hydrophobic interactions between the planar aromatic rings of the phenolic guest and the interior of the amylose helix, reinforced by hydrogen bonding [20]. Because complexed phenolics would be physically shielded from the 80% ethanol solvent used for TPC/HPLC extraction (Section 2.5), they would not be captured by conventional TPC or HPLC quantification — an interpretation consistent with, though not independently confirmed by, the apparent “missing” phenolic fraction not recovered as free, extractable compound in this study.
By contrast, the harsher thermal regime of DART (autoclaving at 121 °C) appears to have driven phenolic degradation to completion before an ordered inclusion architecture could stabilize, consistent with the total loss of extractable C3G and the absence of a V-type peak in the DART diffractogram. This distinction suggests that the milder, enzyme-mediated DET route may be structurally and nutritionally preferable when the objective is to preserve bioactive-compound functionality alongside resistant-starch enhancement, an interpretation that should be confirmed by direct quantification of the bound-phenolic fraction (e.g., by alkaline or acid hydrolysis of the RS3 residue) in future work.
The markedly greater digestive resistance of both RS3 preparations relative to native starch (Table 3, Figure 3) is likely to arise from at least two complementary mechanisms. First, steric hindrance: the dense, reorganized crystalline lamellae observed by XRD and SEM are expected to restrict the accessible surface area and physically impede enzyme–substrate contact, a mechanism well established for RS3 generally [10,39]. Second, and specific to DET-RS3, the bound phenolic compounds putatively entrapped within the V-type amylose complex may provide an additional, biochemical layer of resistance: aromatic phenolic acids are known to interact with aromatic residues in the catalytic pockets of α-amylase, competitively or non-competitively inhibiting enzyme–substrate binding [20,46]. The lower intestinal-phase hydrolysis of DET-RS3 (12.72%) relative to DART-RS3 (20.42%), despite DET’s markedly higher retained TPC and C3G, is consistent with — though does not by itself prove — a synergistic contribution from this bound-phenolic mechanism, which would not be expected to operate to the same degree in DART-RS3 given its near-complete loss of extractable, and (by inference from the absence of a V-type XRD peak) complexed, phenolics alike.
Physiologically, the resistance of both RS3 preparations, and especially DET-RS3, implies that the majority of the ingested carbohydrate — together with any complexed phenolic cargo — would escape digestion in the small intestine and reach the colon largely intact, where RS3 is fermented by colonic microbiota to short-chain fatty acids that support colonocyte metabolism, lower luminal pH, and are associated with prebiotic and anti-inflammatory benefits [47,48,49]. The present study was designed to characterize the digestive resistance of the starch matrix itself, using total-carbohydrate hydrolysis as the primary endpoint at each simulated digestive phase; the release of anthocyanins and other phenolics into the oral, gastric and intestinal digesta was not directly quantified here, so the extent to which complexed phenolics remain matrix-bound through the upper gastrointestinal tract, rather than being co-released with digested carbohydrate, remains a hypothesis to be tested directly. Should the amylose–phenolic complex proposed above survive upper gastrointestinal transit and colonic fermentation intact, or be progressively released as the starch matrix is degraded by colonic bacteria, purple rice RS3, and DET-RS3 in particular, could function as a targeted delivery system that couples low-glycemic carbohydrate functionality with sustained local antioxidant supply, a possibility supported by parallel findings in structurally analogous starch–anthocyanin and starch–polyphenol complexes [19,20]. Direct profiling of phenolic and antioxidant release across the simulated digestive phases is accordingly identified as a priority for future work.
Taken together, these attributes define a specific ingredient profile for DET-derived RS3: a dry, poorly digestible starch fraction that contributes carbohydrate bulk at a reduced glycemic cost while carrying a residual, partly matrix-associated phenolic load beyond the small intestine. Ingredients of this description are of interest for functional-food and nutraceutical formulation, where resistant starch is used both as a low-glycemic bulking agent and as a fermentable substrate, and where the co-delivery of a plant-derived antioxidant fraction within the same particle would remove the need for a separate carrier system. It should be emphasized, however, that the present work characterized composition, structure and in vitro digestibility only; the technological performance of DET-RS3 in real food matrices—its water-binding, pasting, thermal and sensory behavior, and the stability of the retained pigments during storage—was outside the scope of this study and must be established before formulation claims can be made.
5. Conclusions
This study demonstrates that converting purple rice starch into resistant starch type III via DART and DET substantially increases RS3 content (up to 51.34% for DET, a 9.60-fold increase over native starch), but does so at the cost of a substantial, process-dependent loss of free anthocyanins and phenolics, consistent with thermally driven pyrylium-ring opening and chalcone formation. Notably, the milder DET process not only achieved the highest RS3 yield but also retained the greatest fraction of extractable C3G and was the only treatment whose XRD pattern displayed a diagnostic V-type peak near 2θ ≈ 19°, providing converging structural and compositional evidence that a portion of the surviving phenolic fraction becomes sequestered within amylose single-helical inclusion complexes during retrogradation. This amylose–phenolic architecture is associated with markedly enhanced resistance to simulated oral, gastric and, most notably, intestinal digestion (12.72% hydrolysis for DET-RS3 versus 30.71% for native starch), consistent with a synergistic contribution of physical steric hindrance and phenolic-mediated enzyme inhibition. Collectively, these findings position DET-derived RS3 from purple rice not merely as a low-glycemic carbohydrate ingredient, but as a candidate colon-targeted delivery system capable of transporting a protected antioxidant cargo to the large intestine. On this basis, DET offers a route to a value-added functional-food and nutraceutical ingredient derived from the starch fraction of a pigmented cereal that is at present exploited well below its nutritional potential. More generally, these results illustrate a principle that applies wherever plant-based foods are processed: the processing route determines not only how much of the antioxidant fraction survives, but the physical state in which it survives, and it is that state, rather than the surviving quantity alone, that governs how the fraction behaves during digestion. Future work should directly quantify the bound (complexed) phenolic fraction released upon acid or alkaline hydrolysis of the RS3 residue, corroborate complex formation using complementary techniques (e.g., FTIR, differential scanning calorimetry, or molecular docking), and evaluate the fermentability and bioactivity of this fraction using in vitro colonic fermentation or animal models.
Author Contributions
Conceptualization, N.C. and N.R.; methodology, M.C., J.T. and A.K.; validation, C.S. and K.B.; formal analysis, M.C.; investigation, M.C. and P.S.; resources, N.C.; data curation, M.C.; writing—original draft preparation, M.C. and N.C.; writing—review and editing, N.R., J.T., C.S., P.S., K.B. and A.K.; supervision, N.C. and N.R.; project administration, N.C. All authors have read and agreed to the published version of the manuscript.
Funding
This research received no external funding.
Institutional Review Board Statement
Not applicable. This study did not involve humans or animals.
Informed Consent Statement
Not applicable.
Data Availability Statement
The data presented in this study are contained within the article.
Acknowledgments
The authors thank the Graduate School, Chiang Mai University, and the Research Institute for Health Sciences, Chiang Mai University, for institutional and technical support. During the preparation of this manuscript, the author(s) used Claude (Anthropic PBC, San Francisco, CA, USA) for the purposes of organizing and drafting narrative text from the authors’ original experimental data, laboratory notes and thesis chapters. The tool was not used to generate, alter or interpret any experimental data. The authors have reviewed and edited the output and take full responsibility for the content of this publication.
Conflicts of Interest
The authors declare no conflicts of interest.
Abbreviations
The following abbreviations are used in this manuscript:
| RS3 | Resistant starch type III |
| DART | Dual autoclaving-retrogradation treatment |
| DET | Dual enzyme treatment |
| C3G | Cyanidin-3-glucoside |
| P3G | Peonidin-3-glucoside |
| TPC | Total phenolic content |
| GAE | Gallic acid equivalents |
| GI | Glycemic index |
| RDS | Rapidly digestible starch |
| DPPH | 2,2-Diphenyl-1-picrylhydrazyl |
| ABTS | 2,2′-Azino-bis(3-ethylbenzothiazoline-6-sulfonic acid) |
| FRAP | Ferric reducing antioxidant power |
| XRD | X-ray diffraction |
| SEM | Scanning electron microscopy |
| dwb | Dry weight basis |
| SSF | Simulated salivary fluid |
| SIF | Simulated intestinal fluid |
| DNS | 3,5-Dinitrosalicylic acid |
| SCFA | Short-chain fatty acid(s) |
| ND | Not detected |
References
- Yamuangmorn, S.; Prom-u-thai, C. The Potential of High-Anthocyanin Purple Rice as a Functional Ingredient in Human Health. Antioxidants 2021, 10, 833. [Google Scholar] [CrossRef]
- Jang, S.; Xu, Z. Lipophilic and Hydrophilic Antioxidants and Their Antioxidant Activities in Purple Rice Bran. J. Agric. Food Chem. 2009, 57, 858–862. [Google Scholar] [CrossRef]
- Shao, Y.; Hu, Z.; Yu, Y.; Mou, R.; Zhu, Z.; Beta, T. Phenolic Acids, Anthocyanins, Proanthocyanidins, Antioxidant Activity, Minerals and Their Correlations in Non-Pigmented, Red, and Black Rice. Food Chem. 2018, 239, 733–741. [Google Scholar] [CrossRef]
- Abdel-Aal, E.-S.M.; Young, J.C.; Rabalski, I. Anthocyanin Composition in Black, Blue, Pink, Purple, and Red Cereal Grains. J. Agric. Food Chem. 2006, 54, 4696–4704. [Google Scholar] [CrossRef]
- Guo, H.Q.; Liu, W.C.; Xia, Y.M. Effect of Anthocyanin-Rich Extract from Black Rice (Oryza sativa L. indica) on Hyperlipidemia and Insulin Resistance in Fructose-Fed Rats. Plant Foods Hum. Nutr. 2007, 62, 1–6. [Google Scholar] [CrossRef]
- Hiemori, M.; Koh, E.; Mitchell, A.E. Influence of Cooking on Anthocyanins in Black Rice (Oryza sativa L. japonica var. SBR). J. Agric. Food Chem. 2009, 57, 1908–1914. [Google Scholar] [CrossRef]
- Englyst, H.N.; Kingman, S.M.; Cummings, J.H. Classification and Measurement of Nutritionally Important Starch Fractions. Eur. J. Clin. Nutr. 1992, 46, 33–50. [Google Scholar]
- Brennan, C.S. Dietary Fibre, Glycaemic Response, and Diabetes. Mol. Nutr. Food Res. 2005, 49, 560–570. [Google Scholar] [CrossRef]
- Eerlingen, R.C.; Delcour, J.A. Formation, Analysis, Structure and Properties of Type III Enzyme Resistant Starch. J. Cereal Sci. 1995, 22, 129–138. [Google Scholar] [CrossRef]
- Sajilata, M.G.; Singhal, R.S.; Kulkarni, P.R. Resistant Starch–A Review. Compr. Rev. Food Sci. Food Saf. 2006, 5, 1–17. [Google Scholar] [CrossRef]
- Ashwar, B.A.; Gani, A.; Wani, I.A.; Shah, A.S.; Masoodi, F.A.; Saxena, D.C. Production of Resistant Starch from Rice by Dual Autoclaving-Retrogradation Treatment: In vitro Digestibility, Thermal and Structural Characterization. Food Hydrocoll. 2016, 56, 108–117. [Google Scholar] [CrossRef]
- Zhang, H.; Jin, Z. Preparation of Products Rich in Resistant Starch from Maize Starch by an Enzymatic Method. Carbohydr. Polym. 2011, 86, 1610–1614. [Google Scholar] [CrossRef]
- Patras, A.; Brunton, N.P.; O’Donnell, C.; Tiwari, B.K. Effect of Thermal Processing on Anthocyanin Stability in Foods; Mechanisms and Kinetics of Degradation. Trends Food Sci. Technol. 2010, 21, 3–11. [Google Scholar] [CrossRef]
- Oancea, S. A Review of the Current Knowledge of Thermal Stability of Anthocyanins and Approaches to Their Stabilization to Heat. Antioxidants 2021, 10, 1337. [Google Scholar] [CrossRef]
- Yamuangmorn, S.; Dell, B.; Prom-u-thai, C. Effects of Cooking on Anthocyanin Concentration and Bioactive Antioxidant Capacity in Glutinous and Non-Glutinous Purple Rice. Rice Sci. 2018, 25, 270–278. [Google Scholar] [CrossRef]
- Surh, J.; Koh, E. Effects of Four Different Cooking Methods on Anthocyanins, Total Phenolics and Antioxidant Activity of Black Rice. J. Sci. Food Agric. 2014, 94, 3296–3304. [Google Scholar] [CrossRef]
- Thuengtung, S.; Ogawa, Y. Comparative Study of Conventional Steam Cooking and Microwave Cooking on Cooked Pigmented Rice Texture and Their Phenolic Antioxidant. Food Sci. Nutr. 2020, 8, 965–972. [Google Scholar] [CrossRef]
- Ou, S.J.L.; Fu, A.S.; Liu, M.H. Impact of Starch-Rich Food Matrices on Black Rice Anthocyanin Accessibility and Carbohydrate Digestibility. Foods 2023, 12, 880. [Google Scholar] [CrossRef]
- Zhang, W.; Zhu, H.; Rong, L.; Chen, Y.; Yu, Q.; Shen, M.; Xie, J. Purple Red Rice Bran Anthocyanins Reduce the Digestibility of Rice Starch by Forming V-Type Inclusion Complexes. Food Res. Int. 2023, 166, 112578. [Google Scholar] [CrossRef]
- Yang, D.; Guo, Q.; Li, R.; Chen, L.; Zheng, B. Amylose Content Controls the V-Type Structural Formation and In vitro Digestibility of Maize Starch–Resveratrol Complexes and Their Effect on Human Gut Microbiota. Carbohydr. Polym. 2024, 327, 121702. [Google Scholar] [CrossRef]
- Ju, Z.Y.; Hettiarachchy, N.S.; Rath, N. Extraction, Denaturation and Hydrophobic Properties of Rice Flour Proteins. J. Food Sci. 2001, 66, 229–232. [Google Scholar] [CrossRef]
- McCleary, B.V.; McNally, M.; Rossiter, P. Measurement of Resistant Starch by Enzymatic Digestion in Starch and Selected Plant Materials: Collaborative Study. J. AOAC Int. 2002, 85, 1103–1111. [Google Scholar] [CrossRef]
- Megazyme. Measurement of Available RS in Food Ingredients and Products, 2017. Available online: https://www.megazyme.com/resistant-starch-assay-kit-rapid (accessed on 1 August 2026).
- Lemos, M.A.; Aliyu, M.M.; Hungerford, G. Influence of Cooking on the Levels of Bioactive Compounds in Purple Majesty Potato Observed via Chemical and Spectroscopic Means. Food Chem. 2015, 173, 462–467. [Google Scholar] [CrossRef]
- Pengkumsri, N.; Chaiyasut, C.; Saenjum, C.; Sirilun, S.; Peerajan, S.; Suwannalert, P.; Sirisattha, S.; Sivamaruthi, B.S. Physicochemical and Antioxidative Properties of Black, Brown and Red Rice Varieties of Northern Thailand. Food Sci. Technol. Int. 2015, 35, 331–338. [Google Scholar] [CrossRef]
- Burgos, G.; Amoros, W.; Muñoa, L.; Sosa, P.; Cayhualla, E.; Sanchez, C.; Díaz, C.L.; Bonierbale, M. Total Phenolic, Total Anthocyanin and Phenolic Acid Concentrations and Antioxidant Activity of Purple-Fleshed Potatoes as Affected by Boiling. J. Food Compos. Anal. 2013, 30, 6–12. [Google Scholar] [CrossRef]
- Babu, A.S.; Parimalavalli, R. Effect of Pullulanase Debranching and Storage Temperatures on Structural Characteristics and Digestibility of Sweet Potato Starch. J. Saudi Soc. Agric. Sci. 2016, 17, 208–216. [Google Scholar]
- Nara, S.; Komiya, T. Studies on the Relationship between Water-Saturated State and Crystallinity by the Diffraction Method for Moistened Potato Starch. Starch/Stärke 1983, 35, 407–410. [Google Scholar] [CrossRef]
- Aisara, J.; Wongputtisin, P.; Deejing, S.; Maneewong, C.; Unban, K.; Khanongnuch, C.; Kosma, P.; Blaukopf, M.; Kanpiengjai, A. Potential of Inulin-Fructooligosaccharides Extract Produced from Red Onion (Allium cepa var. viviparum (Metz) Mansf.) as an Alternative Prebiotic Product. Plants 2021, 10, 2401. [Google Scholar] [CrossRef]
- Miller, G.L. Use of Dinitrosalicylic Acid Reagent for Determination of Reducing Sugar. Anal. Chem. 1959, 31, 426–428. [Google Scholar] [CrossRef]
- Dubois, M.; Gilles, K.A.; Hamilton, J.K.; Rebers, P.A.; Smith, F. Colorimetric Method for Determination of Sugars and Related Substances. Anal. Chem. 1956, 28, 350–356. [Google Scholar] [CrossRef]
- Korakli, M.; Gänzle, M.G.; Vogel, R.F. Metabolism by Bifidobacteria and Lactic Acid Bacteria of Polysaccharides from Wheat and Rye, and Exopolysaccharides Produced by Lactobacillus sanfranciscensis. J. Appl. Microbiol. 2002, 92, 958–965. [Google Scholar] [CrossRef]
- Du, J.; Yang, Z.; Xu, X.; Wang, X.; Du, X. Effects of Tea Polyphenols on the Structural and Physicochemical Properties of High Hydrostatic Pressure Gelatinized Rice Starch. Food Hydrocoll. 2019, 91, 256–262. [Google Scholar] [CrossRef]
- Sievert, D.; Czuchajowska, Z.; Pomeranz, Y. Enzyme-Resistant Starch. III. X-Ray Diffraction of Autoclaved Amylomaize VII Starch and Enzyme-Resistant Starch Residues. Cereal Chem. 1991, 68, 86–91. [Google Scholar]
- Shamai, K.; Bianco-Peled, H.; Shimoni, E. Polymorphism of Resistant Starch Type III. Carbohydr. Polym. 2003, 54, 363–369. [Google Scholar] [CrossRef]
- Kim, B.K.; Kim, H.; Moon, T.W.; Choi, S.J. Branch Chain Elongation by Amylosucrase: Production of Waxy Corn Starch with a Slow Digestion Property. Food Chem. 2014, 152, 113–120. [Google Scholar] [CrossRef]
- Miao, M.; Jiang, B.; Cui, S.W.; Zhang, T.; Jin, Z. Slowly Digestible Starch—A Review. Crit. Rev. Food Sci. Nutr. 2015, 55, 1642–1657. [Google Scholar] [CrossRef]
- Liu, G.; Gu, Z.; Hong, Y.; Cheng, L.; Li, C. Structure, Functionality and Applications of Debranched Starch: A Review. Trends Food Sci. Technol. 2017, 63, 70–79. [Google Scholar] [CrossRef]
- Ozturk, S.; Köksel, H.; Ng, P.K. Characterization of Resistant Starch Samples Prepared from Two High-Amylose Maize Starches through Debranching and Heat Treatments. Cereal Chem. 2009, 86, 503–510. [Google Scholar] [CrossRef]
- Gidley, M.J.; Bulpin, P.V. Crystallisation of Malto-Oligosaccharides as Models of the Crystalline Forms of Starch: Minimum Chain-Length Requirement for the Formation of Double Helices. Carbohydr. Res. 1987, 161, 291–300. [Google Scholar] [CrossRef]
- Miao, M.; Xiong, S.; Jiang, B.; Jiang, H.; Cui, S.W.; Zhang, T. Dual-Enzymatic Modification of Maize Starch for Increasing Slow Digestion Property. Food Hydrocoll. 2014, 38, 180–185. [Google Scholar] [CrossRef]
- Gong, E.; Luo, S.; Li, T.; Liu, C.; Zhang, G.; Chen, J.; Zeng, Z.; Liu, R.H. Phytochemical Profiles and Antioxidant Activity of Processed Brown Rice Products. Food Chem. 2017, 232, 67–78. [Google Scholar] [CrossRef]
- Floegel, A.; Kim, D.-O.; Chung, S.-J.; Koo, S.I.; Chun, O.K. Comparison of ABTS/DPPH Assays to Measure Antioxidant Capacity in Popular Antioxidant-Rich US Foods. J. Food Compos. Anal. 2011, 24, 1043–1048. [Google Scholar] [CrossRef]
- Everette, J.D.; Bryant, Q.M.; Green, A.M.; Abbey, Y.A.; Wangila, G.W.; Walker, R.B. Thorough Study of Reactivity of Various Compound Classes toward the Folin–Ciocalteu Reagent. J. Agric. Food Chem. 2010, 58, 8139–8144. [Google Scholar] [CrossRef]
- Cui, R.; Oates, C.G. The Effect of Amylose-Lipid Complex Formation on Enzyme Susceptibility of Sago Starch. Food Chem. 1999, 65, 417–425. [Google Scholar] [CrossRef]
- Thompson, L.U.; Yoon, J.H. Starch Digestibility as Affected by Polyphenol and Phytic Acid. J. Food Sci. 1984, 49, 1268–1269. [Google Scholar] [CrossRef]
- Topping, D.L.; Clifton, P.M. Short-Chain Fatty Acids and Human Colonic Function: Roles of Resistant Starch and Nonstarch Polysaccharides. Physiol. Rev. 2001, 81, 1031–1064. [Google Scholar] [CrossRef]
- Zeng, H.; Huang, C.; Lin, S.; Zheng, M.; Chen, C.; Zheng, B.; Zhang, Y. Lotus Seed Resistant Starch Regulates Gut Microbiota and Increases Short-Chain Fatty Acids Production and Mineral Absorption in Mice. J. Agric. Food Chem. 2017, 65, 9217–9225. [Google Scholar] [CrossRef]
- Robertson, M.D.; Currie, J.M.; Morgan, L.M.; Jewell, D.; Frayn, K.N. Prior Short-Term Consumption of Resistant Starch Enhances Postprandial Insulin Sensitivity in Healthy Subjects. Diabetologia 2003, 46, 659–665. [Google Scholar] [CrossRef]
Figure 1.
Appearance of (a) native purple rice starch, (b) RS3 obtained by DART and (c) RS3 obtained by DET.
Figure 1.
Appearance of (a) native purple rice starch, (b) RS3 obtained by DART and (c) RS3 obtained by DET.
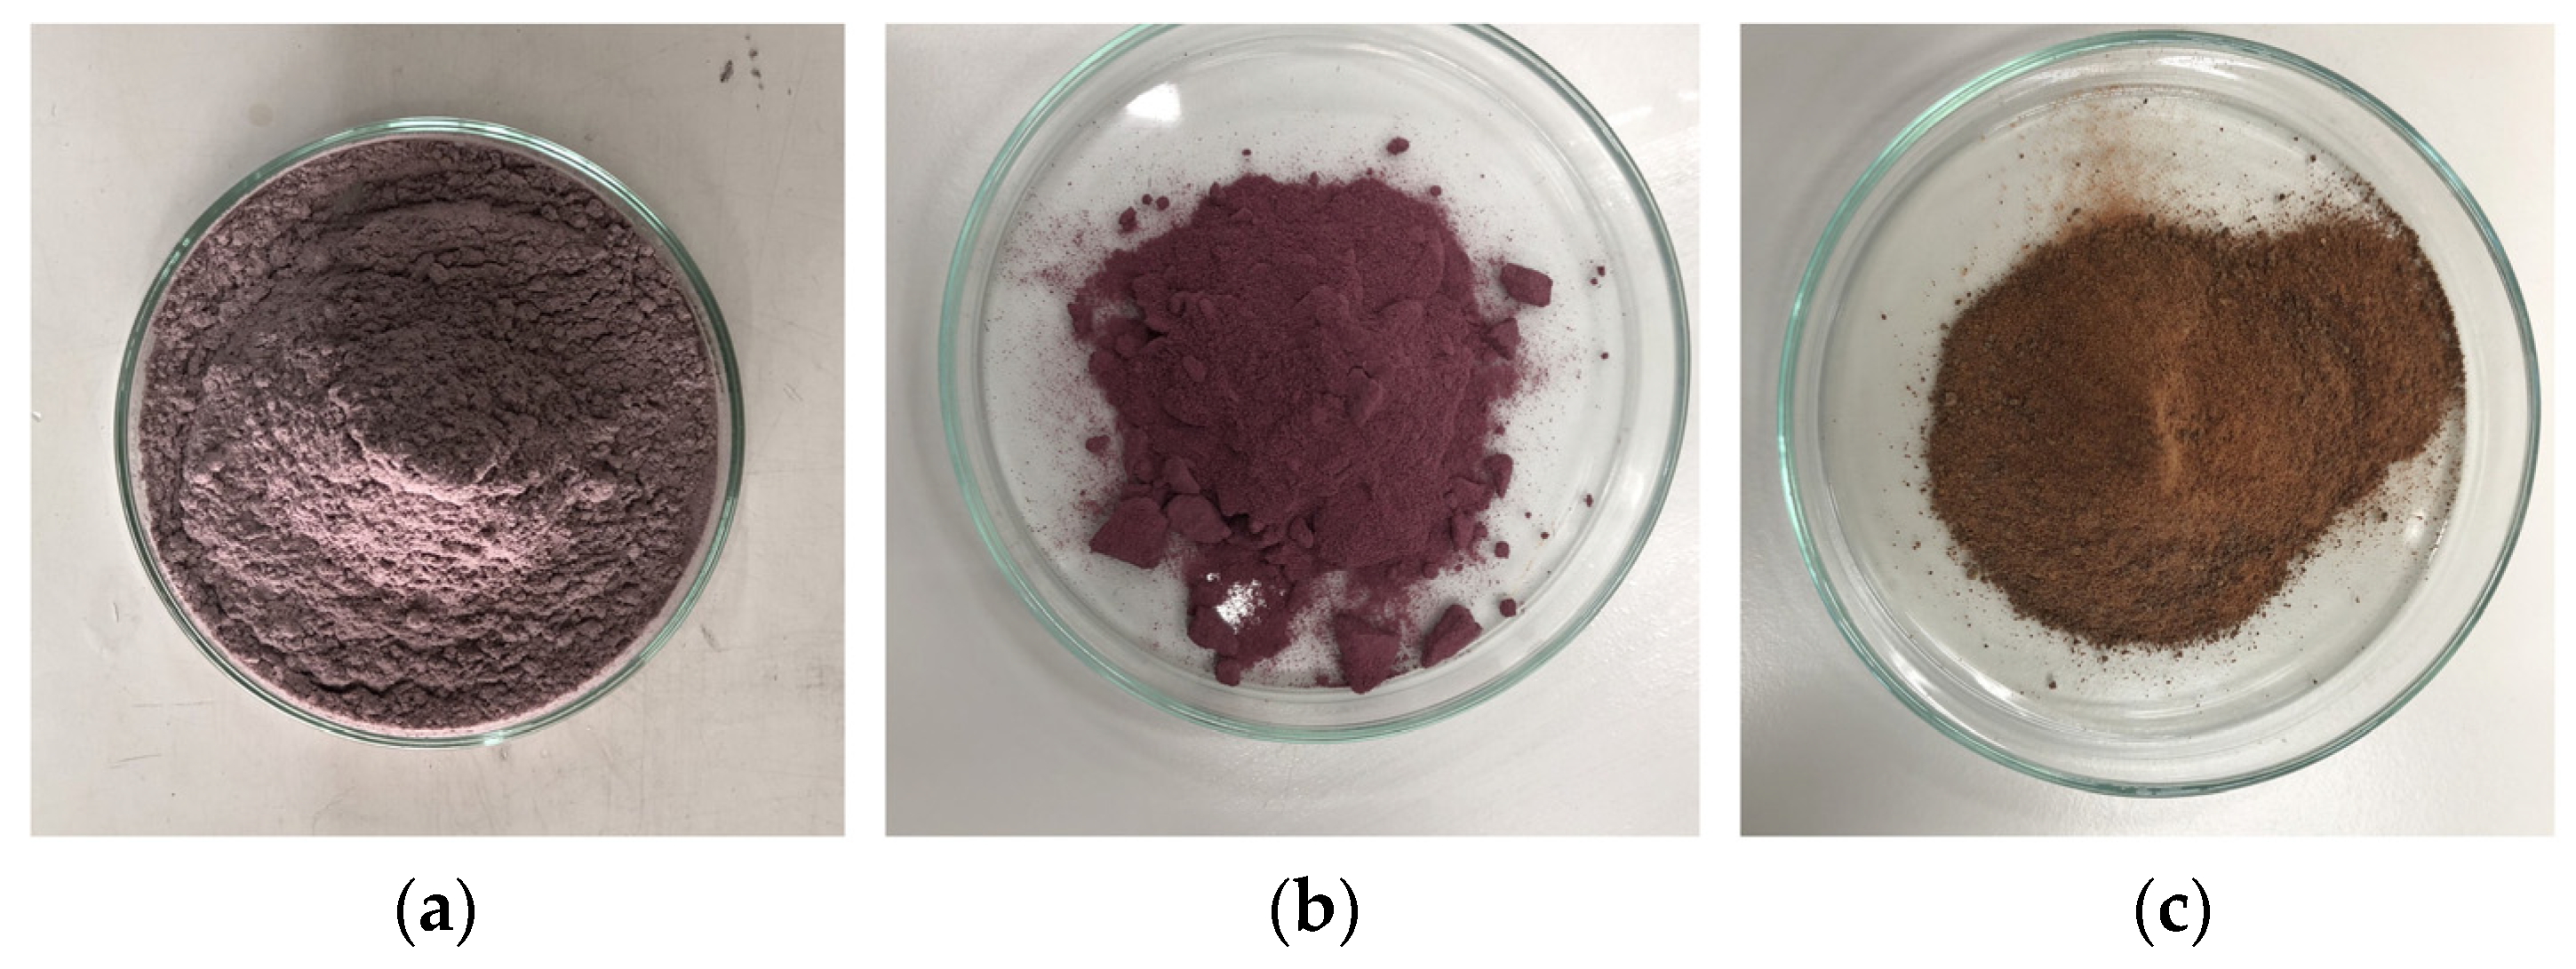
Figure 2.
HPLC chromatograms recorded at 520 nm for anthocyanin determination: (a) mixed reference standard of cyanidin-3-glucoside (C3G), peonidin-3-glucoside (P3G), cyanidin (Cya) and peonidin (Peo) at 25 μg/mL; (b) native purple rice starch; (c) RS3 obtained by DART; and (d) RS3 obtained by DET.
Figure 2.
HPLC chromatograms recorded at 520 nm for anthocyanin determination: (a) mixed reference standard of cyanidin-3-glucoside (C3G), peonidin-3-glucoside (P3G), cyanidin (Cya) and peonidin (Peo) at 25 μg/mL; (b) native purple rice starch; (c) RS3 obtained by DART; and (d) RS3 obtained by DET.
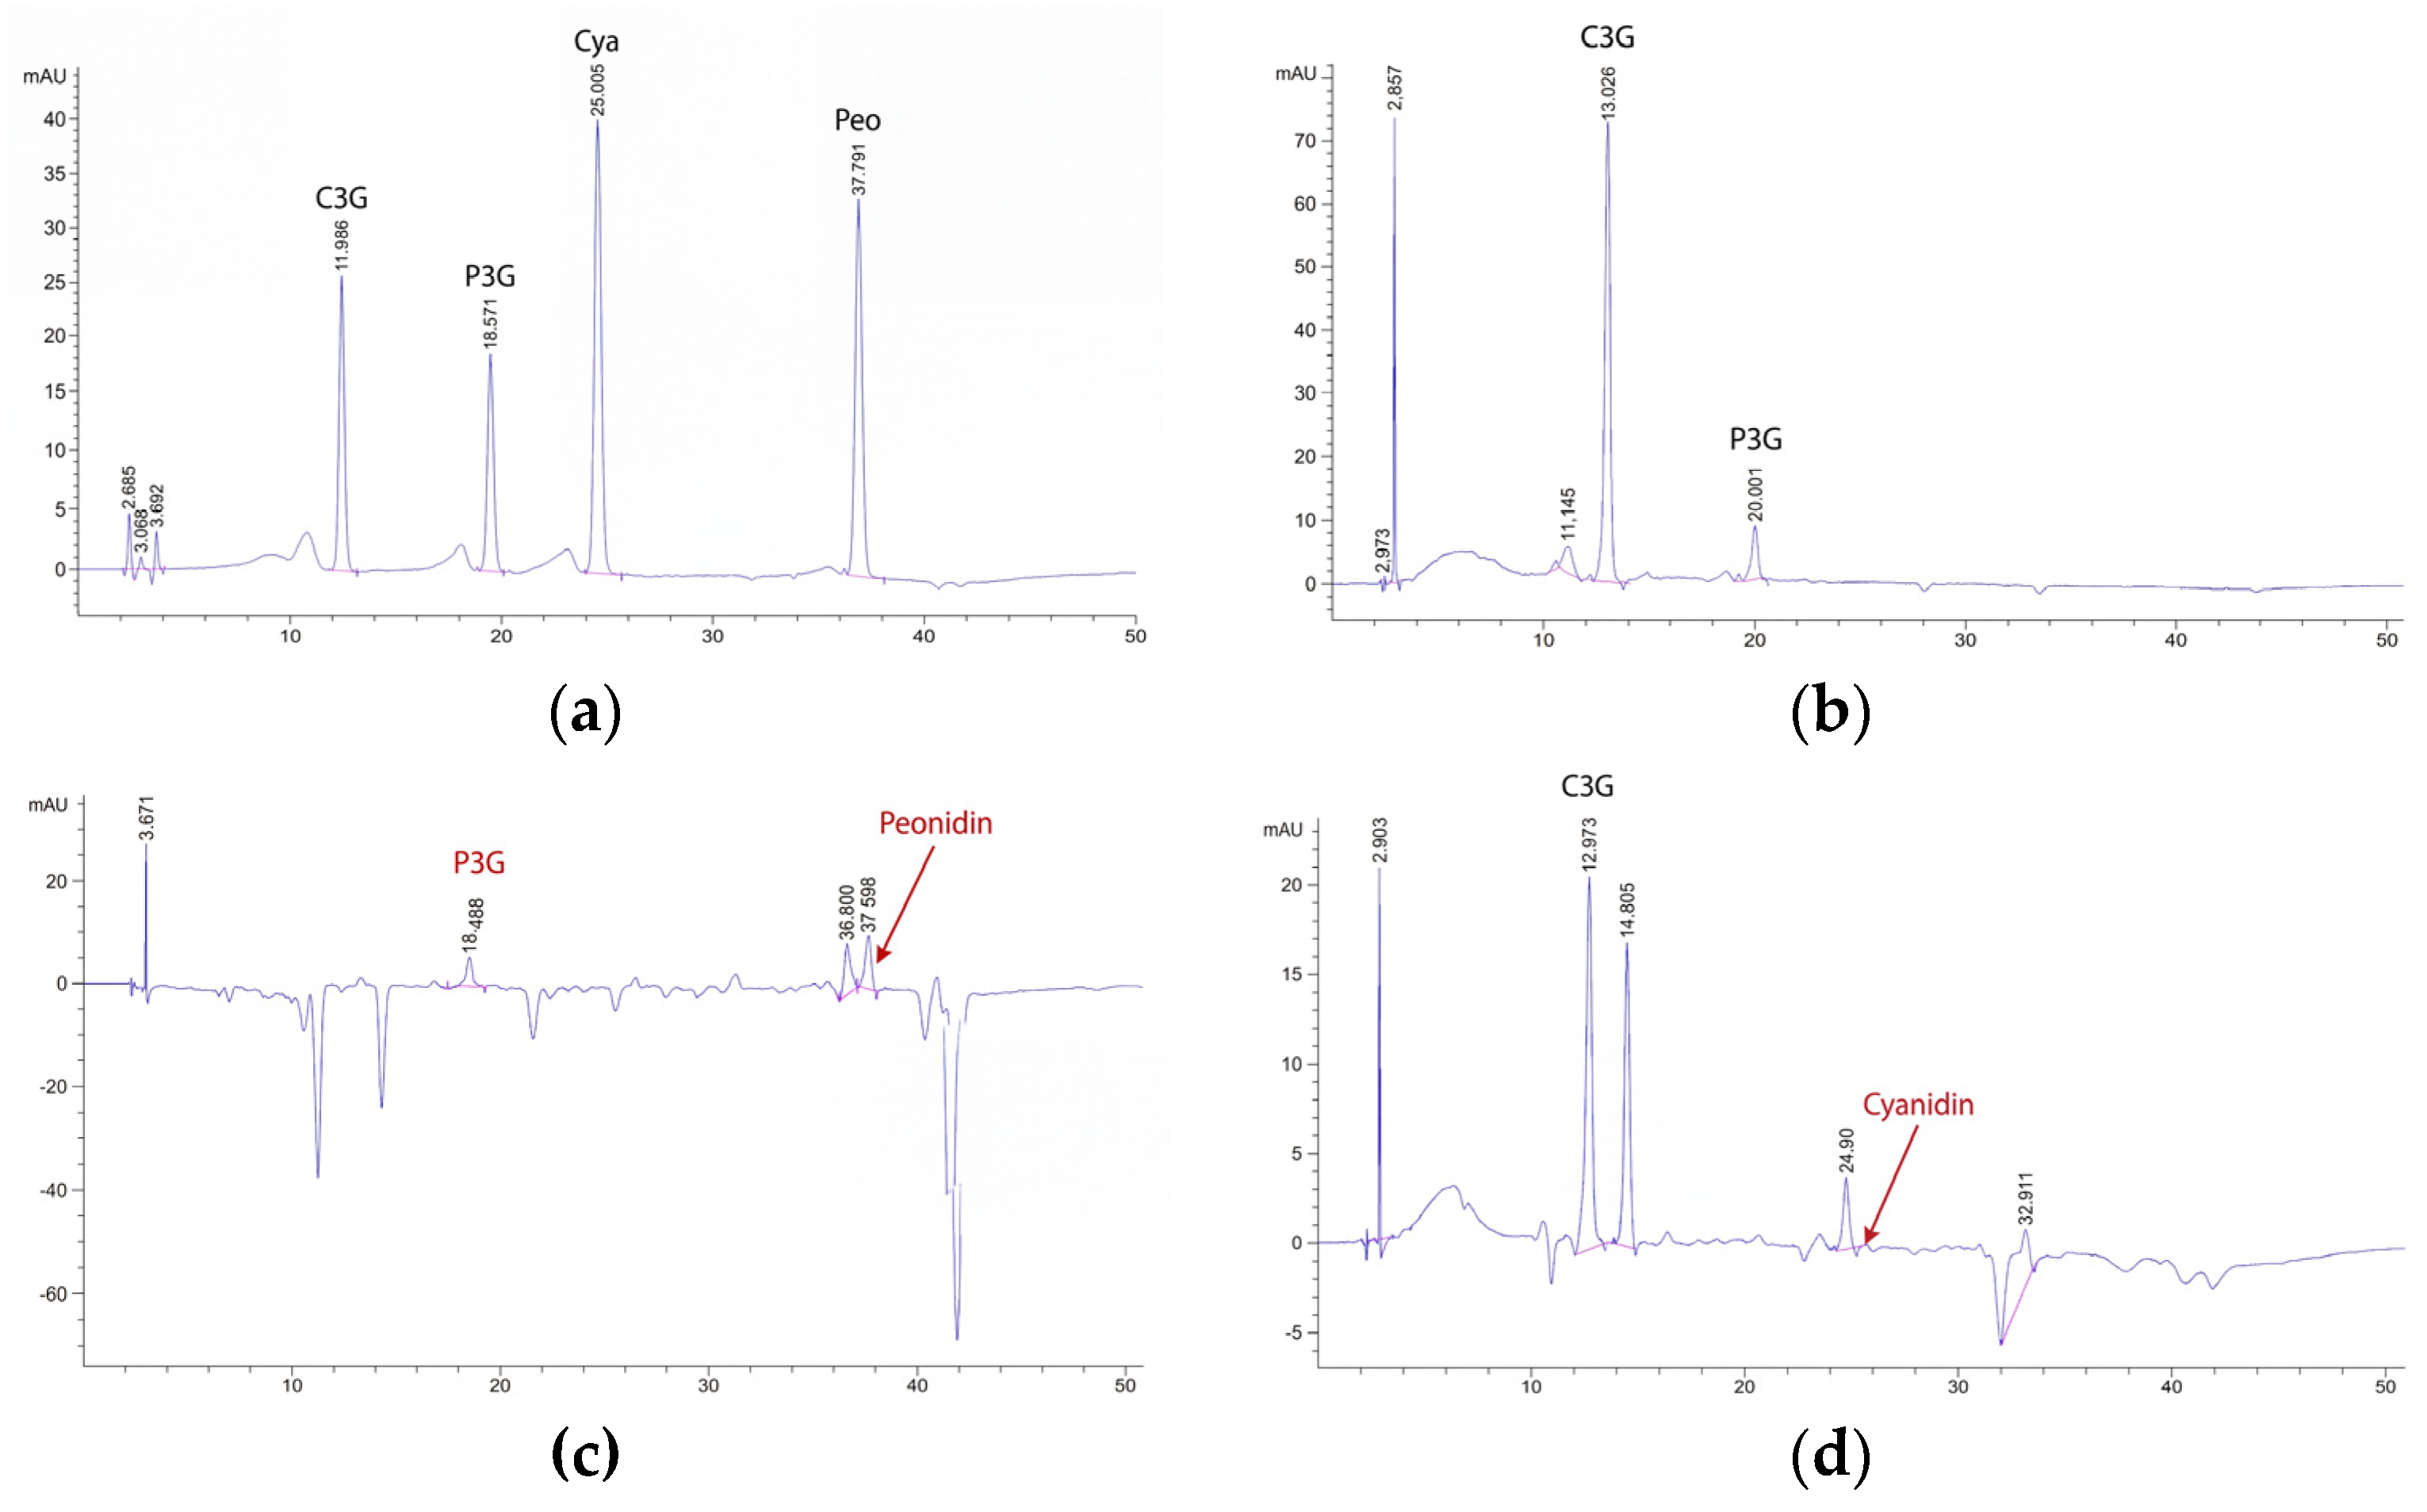
Figure 3.
X-ray diffraction patterns (2θ = 5–40°) of native, gelatinized, DART-treated and DET-treated purple rice starch.
Figure 3.
X-ray diffraction patterns (2θ = 5–40°) of native, gelatinized, DART-treated and DET-treated purple rice starch.
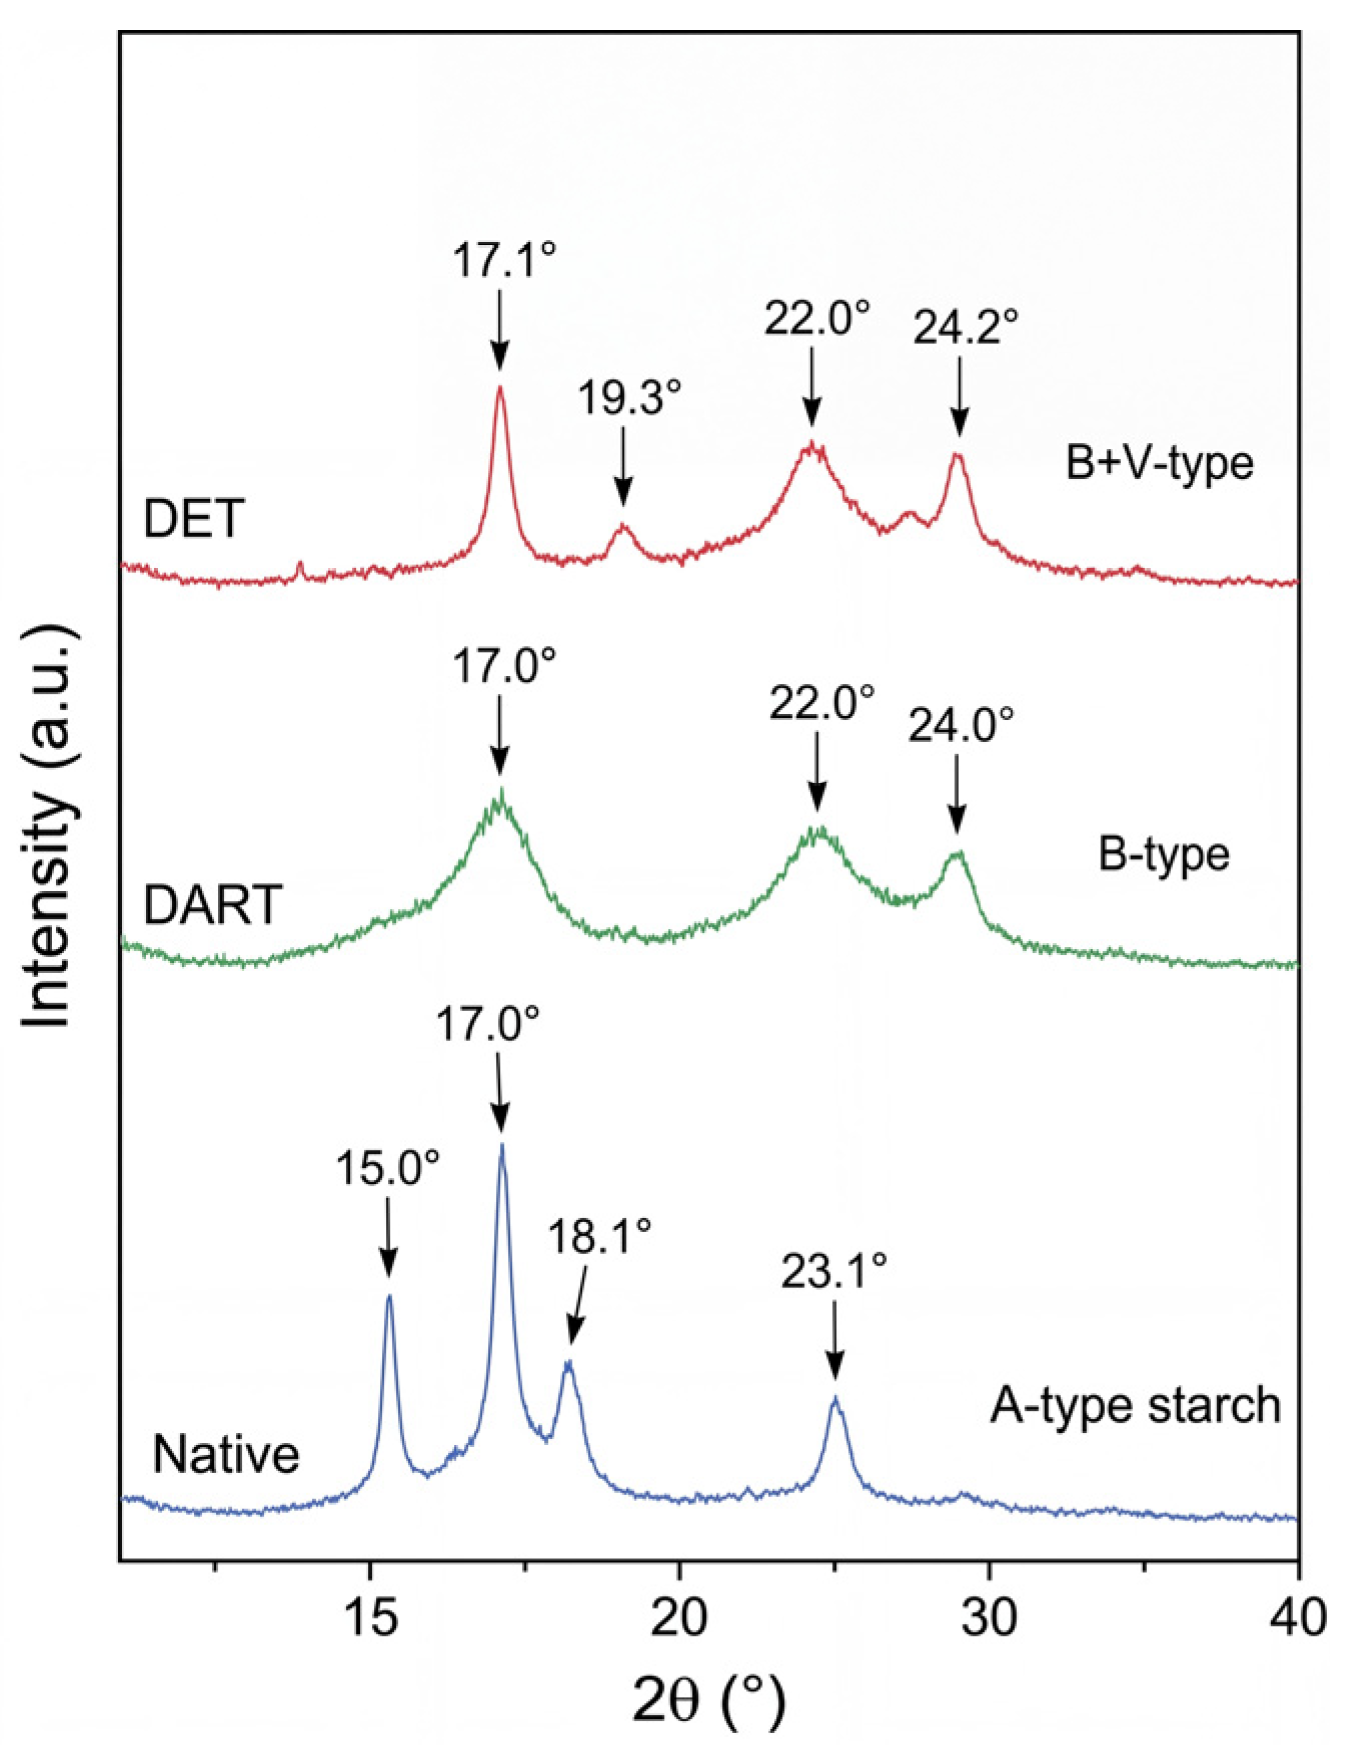
Figure 4.
In vitro hydrolysis profiles (0–120 min) of native, DART-treated and DET-treated purple rice starch under simulated (a) oral, (b) gastric and (c) intestinal digestion.
Figure 4.
In vitro hydrolysis profiles (0–120 min) of native, DART-treated and DET-treated purple rice starch under simulated (a) oral, (b) gastric and (c) intestinal digestion.
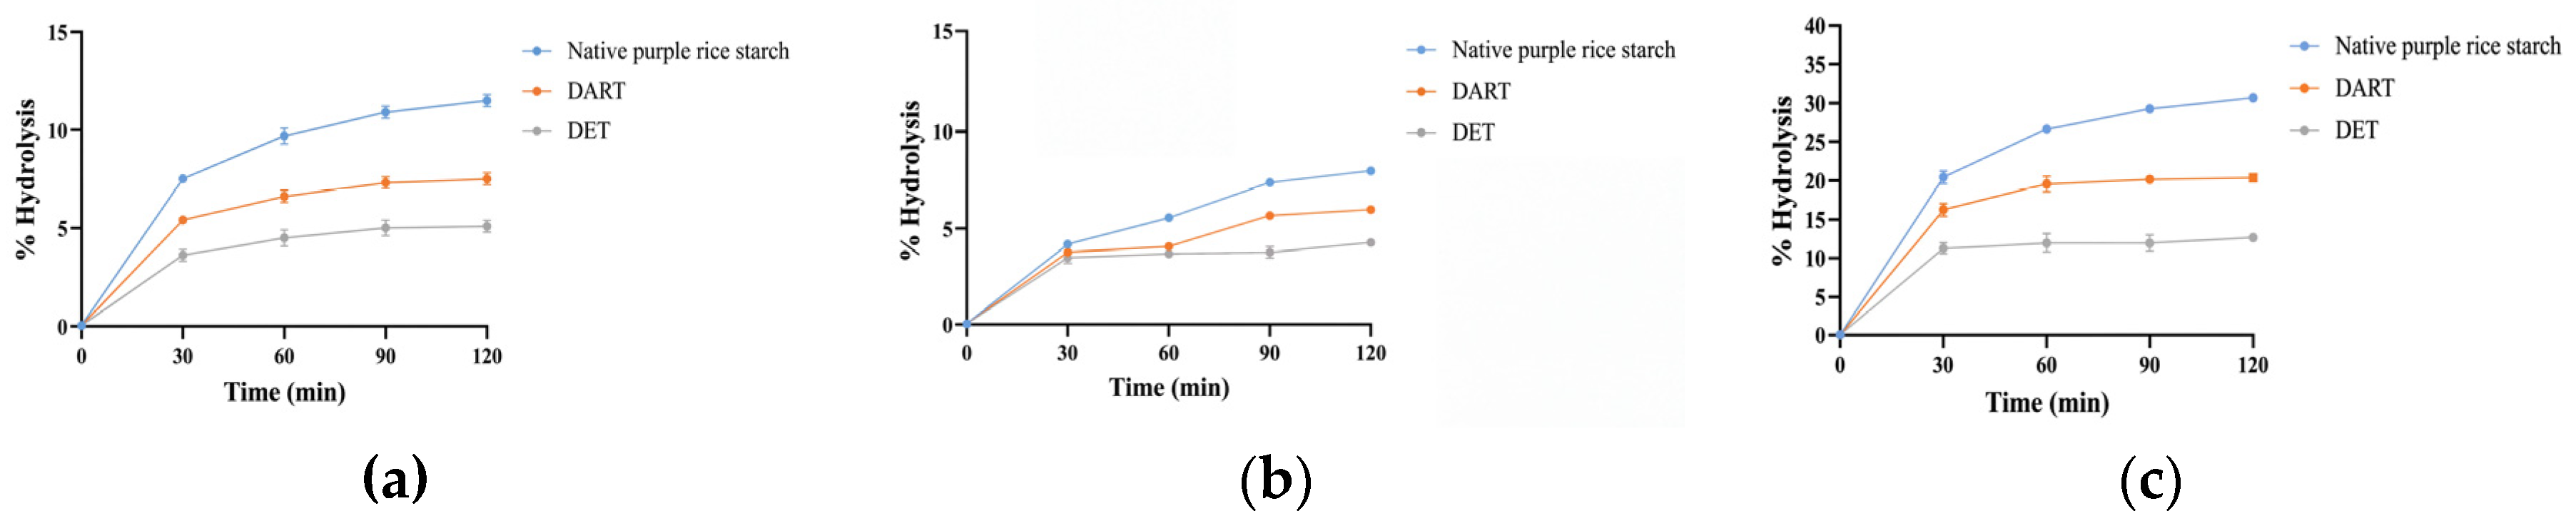

Table 1.
Resistant starch (RS) content and surface color values of native purple rice starch and RS3 produced by dual autoclaving-retrogradation treatment (DART) and dual enzyme treatment (DET).
Table 1.
Resistant starch (RS) content and surface color values of native purple rice starch and RS3 produced by dual autoclaving-retrogradation treatment (DART) and dual enzyme treatment (DET).
| Sample | RS Content (g/100 g dwb) | Fold Increase vs. Native | L* | a* | b* |
| Native starch | 5.35 ± 0.14 c | 1.00 | 68.27 ± 0.18 a | 4.83 ± 0.06 c | 4.33 ± 0.38 b |
| DART | 34.13 ± 0.65 b | 6.37 | 43.49 ± 0.25 b | 13.16 ± 0.10 a | 7.14 ± 0.06 a |
| DET | 51.34 ± 0.35 a | 9.60 | 28.25 ± 0.50 c | 10.25 ± 0.32 b | 3.24 ± 0.19 c |
Values are means ± SD of triplicate determinations. Different superscript letters within a column indicate significant differences (p < 0.05). L*, lightness; a*, green-to-red coordinate; b*, blue-to-yellow coordinate; dwb, dry weight basis.
Table 2.
Total phenolic content, anthocyanin composition and in vitro antioxidant capacity of native purple rice starch and RS3 produced by DART and DET.
Table 2.
Total phenolic content, anthocyanin composition and in vitro antioxidant capacity of native purple rice starch and RS3 produced by DART and DET.
| Parameter | Native | DART | DET | Unit |
| Total phenolic content | 115.50 ± 1.08 a | 27.59 ± 0.49 c | 33.09 ± 0.65 b | mg GAE/100 g dwb |
| Cyanidin-3-glucoside | 36.98 ± 0.10 | ND | 11.86 ± 0.12 | mg/100 g dwb |
| Peonidin-3-glucoside | 4.57 ± 0.06 | 2.95 ± 0.08 | ND | mg/100 g dwb |
| DPPH IC₅₀ | 37.20 ± 0.66 c | 92.10 ± 1.12 b | 114.83 ± 5.56 a | mg/mL |
| DPPH radical scavenging | 13.59 ± 0.24 a | 5.27 ± 0.04 b | 4.82 ± 0.08 c | mg TE/100 g dwb |
| ABTS IC₅₀ | 26.36 ± 0.11 c | 56.37 ± 0.33 a | 45.12 ± 0.38 b | mg/mL |
| ABTS radical scavenging | 17.29 ± 0.12 a | 7.56 ± 0.08 c | 10.36 ± 0.09 b | mg TE/100 g dwb |
| FRAP | 4362.94 ± 118.22 a | 2822.54 ± 111.16 c | 2921.51 ± 227.83 b | μmol Fe(II)/100 g dwb |
Values are means ± SD of triplicate determinations. Different superscript letters within a row indicate significant differences (p < 0.05). A higher IC₅₀ denotes lower radical-scavenging potency. GAE, gallic acid equivalents; TE, Trolox equivalents; ND, not detected; dwb, dry weight basis.
Table 3.
In vitro hydrolysis (%) of native purple rice starch and RS3 (DART, DET) after 120 min of simulated oral, gastric and intestinal digestion.
Table 3.
In vitro hydrolysis (%) of native purple rice starch and RS3 (DART, DET) after 120 min of simulated oral, gastric and intestinal digestion.
| Digestion Phase (120 min) | Native (%) | DART (%) | DET (%) |
| Oral (salivary α-amylase) | 11.47 | 7.50 | 5.13 |
| Gastric (pH 2.5, pepsin) | 7.96 | 5.96 | 4.32 |
| Intestinal (pancreatin) | 30.71 | 20.42 | 12.72 |
Values are means of triplicate determinations, expressed as percentage hydrolysis of total carbohydrate at 120 min of each simulated digestive phase.
Disclaimer/Publisher’s Note: The statements, opinions and data contained in all publications are solely those of the individual author(s) and contributor(s) and not of MDPI and/or the editor(s). MDPI and/or the editor(s) disclaim responsibility for any injury to people or property resulting from any ideas, methods, instructions or products referred to in the content. |
© 2026 by the authors. Licensee MDPI, Basel, Switzerland. This article is an open access article distributed under the terms and conditions of the Creative Commons Attribution (CC BY) license (http://creativecommons.org/licenses/by/4.0/).
Copyright: This open access article is published under a Creative Commons CC BY 4.0 license, which permit the free download, distribution, and reuse, provided that the author and preprint are cited in any reuse.