

Submitted:
05 September 2026
Posted:
07 September 2026
You are already at the latest version
Abstract
The curing state of polyolefin elastomer (POE) encapsulants affects the mechanical interaction between constituent layers of laminated photovoltaic (PV) structures and is therefore relevant to their manufacturing quality and long-term structural performance. Gel content (GC), commonly used as an indicator of encapsulant crosslinking, is conventionally determined using destructive laboratory procedures. This study investigates the feasibility of vibration-based modal characterization as a non-destructive approach for distinguishing different POE curing states in simplified glass–POE–glass laminate specimens relevant to photovoltaic module structures. Specimens with POE gel contents of 25%, 35%, 49%, 68%, and 75% were experimentally investigated. Modal parameters were identified from acceleration responses using Frequency Domain Decomposition (FDD) and Enhanced Frequency Domain Decomposition (EFDD), and the first six vibration modes were evaluated. The results revealed a measurable but non-monotonic dependence of natural frequency on gel content. For most modes, the frequencies decreased as GC increased from 25% to approximately 68%, followed by a partial recovery at 75% GC. Higher-order modes exhibited larger absolute frequency variations than the first global bending mode, indicating greater sensitivity to changes in the effective mechanical state of the POE interlayer. Finite element analysis supported the correspondence between the experimentally identified and numerically predicted modal characteristics, while a calibrated partial-composite-action model provided a structural interpretation of incomplete shear coupling between the glass layers. The results demonstrate the potential of modal characterization as a rapid and non-destructive screening approach for differentiating POE curing states, while quantitative prediction of unknown gel content requires further validation using larger independent datasets.
Keywords:
polyolefin elastomer
; photovoltaic encapsulant
; gel content
; crosslinking
; modal analysis
; frequency domain decomposition
; non-destructive evaluation
; interlayer shear coupling
1. Introduction
Photovoltaic (PV) modules are multilayer structures in which the encapsulant performs several functions simultaneously, including optical coupling, electrical insulation, mechanical protection, adhesion between adjacent layers, and resistance to moisture and environmental exposure. Consequently, the selection and processing of the encapsulant affect not only the electrical reliability and durability of a PV module but also the mechanical interaction between its constituent layers. This interaction is particularly relevant in glass–glass module architectures, where a relatively compliant polymeric interlayer transfers stresses between considerably stiffer glass layers [1,2,3,4].
Ethylene-vinyl acetate (EVA) has traditionally been one of the most widely used encapsulant materials in PV modules because of its optical transparency, processability, flexibility, and extensive industrial experience. However, increasing implementation of bifacial, glass–glass, and high-efficiency PV technologies has stimulated interest in alternative encapsulation materials. Polyolefin elastomers (POEs) have emerged as an important class of PV encapsulants because of their low polarity, favorable electrical insulation properties, reduced moisture permeability, and absence of acetate groups associated with acetic-acid formation in EVA-based systems. Recent research has consequently focused on the formulation, processing, crosslinking, mechanical performance, and long-term durability of POE encapsulants [5,6,7,8].
Commercial photovoltaic POE encapsulants are generally based on ethylene–α-olefin copolymers that undergo peroxide-initiated crosslinking during module lamination. The development of the polymer network depends on the molecular architecture of the encapsulant, crosslinking formulation, stabilizers and other additives, as well as on the thermal history imposed during lamination. Crosslinking restricts molecular-chain mobility and modifies rheological and mechanical characteristics of the material. Importantly, the curing behavior of POE cannot be assumed to be equivalent to that of EVA. Experimental dynamic mechanical analysis has demonstrated substantial differences between EVA and POE in crosslinking kinetics: for the investigated materials, POE exhibited slower gelation as well as lower storage modulus and complex viscosity in the rubbery state [9,10,11].
Gel content (GC) is commonly used as an operational indicator of the crosslinking state of photovoltaic encapsulants. It represents the polymer fraction remaining insoluble after solvent extraction and therefore provides a practical measure associated with polymer-network formation. However, GC should not be interpreted as a direct measurement of Young’s modulus, shear modulus, or crosslink density. The measured value and its relationship with other curing indicators depend on the material formulation and the adopted analytical procedure. Recent investigations of commercial POE encapsulants have demonstrated that material-specific relationships between gel content and curing characteristics are required and that extraction and lamination procedures developed for other encapsulants cannot necessarily be transferred directly to POE [12,13].
The relationship between curing state and the mechanical behavior of POE is further influenced by polymer formulation and morphology. Modification of POE formulations can affect adhesion, creep resistance, thermal behavior, and other mechanical characteristics without producing equivalent changes in all material properties. Experimental studies of POE-based photovoltaic encapsulants have demonstrated that changes in formulation and lamination affect their mechanical, rheological, and adhesive behavior. Consequently, gel content should be regarded as an indicator of curing state rather than as a universal surrogate for the mechanical properties of a POE interlayer [14,15,16,17].
This distinction becomes particularly important when POE forms the compliant interlayer of a glass–POE–glass laminate. From a structural-mechanics perspective, such a system consists of stiff glass layers coupled through a substantially softer polymeric interlayer. The effective bending response therefore depends not only on the elastic properties of the individual layers but also on the efficiency of shear transfer through the polymer. Studies of laminated glass structures have shown that viscoelastic polymer interlayers exhibit frequency- and temperature-dependent behavior and that this behavior directly influences modal characteristics of the laminate. Accordingly, the dynamic stiffness of a glass–polymer–glass structure can occupy an intermediate state between the limiting cases of essentially uncoupled glass layers and fully composite behavior [18,19,20].
Experimental modal investigations further demonstrate that the polymer interlayer can measurably influence the vibration behavior of laminated glass structures. Hála et al. experimentally investigated large laminated-glass panels containing EVA or PVB interlayers and showed that interlayer type affects their oscillatory response, including natural frequencies and damping characteristics. These observations support the hypothesis that changes in the effective mechanical state of a polymer interlayer may be reflected in the modal response of the complete laminate [21,22,23].
Conventional evaluation of photovoltaic encapsulant curing is predominantly based on material-level analytical methods. Solvent extraction is used to determine the insoluble gel fraction, whereas differential scanning calorimetry and dynamic mechanical or rheological techniques can provide complementary information on residual curing reactions and the development of viscoelastic properties. For POE in particular, recent research has demonstrated correlations between gel-content measurements and calorimetry-based curing indicators while emphasizing that these relationships remain material-specific [9,12].
Spectroscopic techniques represent another potential route for evaluating changes introduced during lamination. A recent study of EVA and POE photovoltaic encapsulants investigated changes in infrared absorption-band characteristics and reported relationships between selected spectral features, polymer transformations, and gel content after thermal lamination. Such approaches demonstrate growing interest in developing alternative methods for encapsulant-quality assessment. Nevertheless, spectroscopy primarily provides information about the polymer material itself, whereas vibration-based characterization can potentially evaluate the integrated mechanical response of the complete laminated structure [24].
Modal characterization provides a complementary structural-level perspective because natural frequencies, damping characteristics, and mode shapes are governed by the effective distribution of mass, stiffness, energy dissipation, boundary conditions, and internal mechanical coupling. The relevance of modal analysis to photovoltaic structures has recently been demonstrated by experimental and finite element investigations of conventional glass-based and lightweight composite PV modules. These studies showed that module construction and the stiffness contribution of individual layers substantially affect modal characteristics, supporting the use of vibration response as a sensitive indicator of changes in laminate mechanics [25].
Frequency Domain Decomposition (FDD) and Enhanced Frequency Domain Decomposition (EFDD) provide response-based approaches for identifying structural modal parameters from measured vibration signals. In the present study, repeated impact events are used to generate broadband structural excitation, while the measured excitation force is not included in the modal identification procedure. Natural frequencies and mode shapes are identified from acceleration responses using FDD, whereas EFDD is additionally applied to estimate damping characteristics. The procedure is therefore treated herein as output-only modal identification under broadband impact excitation.
Despite substantial research on POE formulation, crosslinking kinetics, lamination, durability, adhesion, and material-level characterization, the relationship between the curing state of a POE interlayer and the modal response of a glass–POE–glass laminate relevant to photovoltaic applications remains insufficiently investigated. Existing POE studies have primarily addressed chemical, thermal, rheological, spectroscopic, or durability-related indicators of encapsulant properties, whereas the possibility of assessing curing-induced changes through the integrated structural dynamic response of a laminated system has received considerably less attention [9,12,24].
Furthermore, because gel content does not uniquely define the mechanical and viscoelastic properties of POE, a simple monotonic relationship between GC and the modal characteristics of a laminated structure cannot be assumed a priori. The vibration response is expected to reflect the combined structural effect of the polymer interlayer and its ability to transfer shear between adjacent glass layers rather than gel content as an isolated material parameter [12,18].
The objective of the present study is therefore to investigate the sensitivity of the modal characteristics of glass–POE–glass laminate specimens with different POE curing states characterized by gel contents of 25%, 35%, 49%, 68%, and 75%. The first six vibration modes are identified experimentally using FDD and EFDD. The measured structural response is subsequently interpreted using finite element analysis and a calibrated partial-composite-action model representing incomplete shear interaction between the glass layers. Statistical relationships between GC and the identified natural frequencies are additionally examined to evaluate their relative sensitivity to changes in curing state. The principal contribution of this study is the evaluation of the integrated structural dynamic response of a glass–POE–glass laminate relevant to photovoltaic applications as a potential non-destructive indicator of encapsulant curing state. At the present stage, the proposed approach is considered a screening methodology for differentiating curing states rather than a fully validated method for quantitative prediction of unknown gel content.
2. Materials and Methods
2.1. Test Specimens and Sample Preparation
Glass–POE–glass laminated specimens without photovoltaic cells were manufactured to investigate the influence of the curing state of the polyolefin elastomer (POE) interlayer on the dynamic response of the laminate. Five curing conditions were considered, corresponding to experimentally determined POE gel-content levels of 25%, 35%, 49%, 68%, and 75%.
Silicon photovoltaic cells were intentionally excluded from the specimens in order to isolate the mechanical contribution of the encapsulant and the glass–POE–glass interaction. This simplified laminate configuration eliminates additional local stiffness and mass variations associated with silicon cells, metallization, interconnects, and cell-to-encapsulant interfaces, thereby allowing changes in modal characteristics to be related more directly to the mechanical state of the POE interlayer.
Each specimen consisted of two glass layers separated by a POE encapsulant layer. The nominal material properties and layer thicknesses adopted for structural characterization and numerical modelling are summarized in Table 1. The planar dimensions of the laminated specimens were approximately 415 × 297 mm.
Lamination was performed using an ICOLAM 18/11 laboratory laminator (Germany). The laminate stacks were manually assembled before being introduced into the preheated lamination chamber. The lamination temperature was maintained at 150 °C for all investigated specimens. After placement in the laminator, the chamber was evacuated to approximately 0.1 mbar. Following a vacuum stage of 340 s, a silicone membrane was applied at a pressure of approximately 800 mbar. Different curing states were produced by varying the duration of the crosslinking stage while maintaining the remaining lamination parameters unchanged.
Separate laminate preparations intended for gel-content determination incorporated thin polytetrafluoroethylene (PTFE) separation films between the POE and adjacent glass surfaces. The PTFE layers facilitated removal of the cured POE after lamination without mechanically damaging or contaminating the polymer material. These specimens were used exclusively for subsequent gel-content determination and were not used for modal testing.
The resulting curing conditions produced the five POE gel-content levels investigated in the present study. In the following analysis, GC is therefore used as an experimental descriptor of the POE curing state rather than as a direct measure of the elastic or shear modulus of the encapsulant.
2.2. Gel Content Determination
The curing state of the POE encapsulant was characterized by its gel content (GC), determined using solvent extraction. POE samples intended for GC analysis were separated from the glass surfaces after lamination using the PTFE release layers described above.
Approximately 1 g of POE material was collected for each determination and cut into pieces of approximately 10 × 10 mm2. The initial dry mass, m0, was measured using a precision balance before extraction. The polymer specimens were subsequently subjected to extraction in xylene (Reag. Ph. Eur., CARLO ERBA Reagents S.A.S., France) at 110±1 °C for at least 12 h.
Following extraction, the solvent was removed and the remaining insoluble polymer fraction was dried at 110±1 °C for at least 8 h to remove residual solvent. After drying, the specimens were weighed again to determine the mass of the insoluble fraction, mg.
Gel content was calculated as:
where m0 is the initial dry mass of the POE specimen before extraction and mg is the dry mass remaining after solvent extraction.
The measured gel content represents the solvent-insoluble fraction of the POE and is used in this study as an operational indicator of the curing state. It is not interpreted as a direct measurement of crosslink density or elastic modulus. The investigated laminates were classified according to five GC levels: 25%, 35%, 49%, 68%, and 75%.
2.3. Experimental Modal Testing
Vibration measurements were performed to characterize the dynamic response of the glass–POE–glass laminates at the investigated curing states. Five piezoelectric accelerometers were mounted at predefined measurement locations on each specimen and connected to a Brüel & Kjær LAN-XI data acquisition system. The same sensor configuration and measurement procedure were maintained for all specimens to ensure consistency between the investigated GC levels.
During testing, each specimen was placed horizontally on a compliant foam support in order to approximate free–free boundary conditions and minimize the influence of the supporting structure on the measured modal parameters.
Broadband structural excitation was generated by repeated impacts using an instrumented impact hammer. Although the excitation force was measured by the instrumented hammer, the force signal was not included in the subsequent modal identification. Only the acceleration responses measured by the five accelerometers were used for modal parameter estimation.
Data acquisition and signal processing were performed using Brüel & Kjær BK Connect software. The experimental configuration, including the specimen, accelerometer locations, impact excitation, LAN-XI acquisition system, and data-processing environment, is schematically presented in Figure 1, while the laboratory test arrangement is shown in Figure 2. Representative acceleration time histories measured at the five sensor locations for the GC = 68% specimen are presented in Figure 3.
2.4. Modal Parameter Identification Using FDD and EFDD
Modal parameters were identified from the measured acceleration responses using Frequency Domain Decomposition (FDD) and Enhanced Frequency Domain Decomposition (EFDD). The analysis was performed in an output-only framework; consequently, the measured impact-force signal was not included in the modal identification.
Let the vector of simultaneously measured acceleration responses be denoted by:
where m=5 is the number of measurement channels. In the frequency domain, the measured responses were represented by the spectral-density matrix:
containing the auto- and cross-spectral densities between the acceleration channels.
For each discrete frequency f, singular value decomposition of the response spectral-density matrix was performed as:
where U(f) contains the singular vectors, Σ(f) is the diagonal matrix of singular values, and the superscript H denotes the conjugate transpose.
Structural resonances were identified from peaks in the dominant singular-value spectra. At frequencies dominated by an individual structural mode, the corresponding singular vector provides an estimate of the mode-shape vector. Modal frequencies and mode shapes were consequently identified using FDD from the singular-value spectra of the measured acceleration responses.
EFDD was additionally employed to obtain refined estimates of the modal frequencies and damping ratios. For each identified mode, the spectral region associated with the corresponding singular-value peak was isolated and transformed into the time domain. The resulting modal correlation function was used to estimate the damped oscillation characteristics and modal damping.
The first six elastic vibration modes were retained for subsequent comparison between the investigated GC levels. Mode correspondence between specimens was established from the identified modal frequencies and deformation patterns so that equivalent structural modes were compared throughout the study.
The FDD frequencies were subsequently used as the primary modal indicators for evaluating the relationship between POE gel content and structural dynamic response. EFDD results were used to support modal identification and to characterize damping for the reference GC = 68% specimen.
2.5. Finite Element Model
A three-dimensional finite element (FE) model of the glass–POE–glass laminate was developed in COMSOL Multiphysics to support the interpretation of the experimentally identified vibration modes and to compare the measured and numerically predicted natural frequencies. The numerical analysis was performed for the reference laminate corresponding to GC = 68%. The FE model was not intended to reproduce the experimentally observed frequency–GC relationship; rather, it was used as a reference for evaluating modal-frequency and mode-shape correspondence.
The model reproduced the geometry of the experimental glass–POE–glass laminate. The material properties adopted in the numerical analysis are summarized in Table 1. The glass and POE layers were represented as homogeneous, isotropic, linear-elastic materials. For the reference GC = 68% specimen, an effective POE Young’s modulus of 11 MPa was adopted.
Perfect mechanical continuity was assumed between adjacent glass and POE layers. Accordingly, relative separation and sliding at the glass–POE interfaces were neglected. This assumption represents an idealized perfectly bonded interface and allows mechanical interaction between the glass layers through deformation of the comparatively compliant POE interlayer.
The FE discretization consisted of approximately 8800 finite elements connected through 10,332 nodes. The numerical representation of the laminate and its discretization are shown in Figure 4 and Figure 5, respectively.
The experimental support arrangement was approximated using free–free boundary conditions. The rigid-body modes associated with unconstrained motion were excluded from the comparison, and the first six elastic structural modes corresponding to the experimentally identified vibration modes were considered.
The natural frequencies and corresponding mode shapes were obtained from linear eigenfrequency analysis. For an undamped system, the governing eigenvalue problem can be expressed as:
where K and M denote the global stiffness and mass matrices, respectively, ωi is the angular natural frequency in rad/s of the i-th mode, and φi is the corresponding eigenvector. The natural frequency in Hz was calculated as:
The first six calculated elastic mode shapes and natural frequencies were subsequently compared with the experimentally identified FDD results for the GC = 68% reference specimen. Because only one gel-content level was represented in the FE analysis, the numerical model was not used to establish or validate a functional relationship between POE gel content and natural frequency.
The FE representation involves several simplifying assumptions, including homogeneous material properties, linear-elastic POE behavior and perfectly bonded glass–POE interfaces. Consequently, the model is used primarily to support the structural interpretation of the experimentally identified modal response rather than as a complete constitutive representation of the POE interlayer.
2.6. Calibrated Partial-Composite-Action Model
A simplified analytical model was employed to provide a complementary structural interpretation of the experimentally observed modal response. The glass–POE–glass specimen was represented as a laminated plate consisting of two stiff glass layers coupled through a comparatively compliant POE interlayer. Because the stiffness of the POE layer is substantially lower than that of glass, the structural response was assumed to lie between two limiting conditions: completely uncoupled glass layers and full composite action.
To represent this intermediate state, an effective bending stiffness was defined as:
where Deff is the effective bending stiffness of the laminate, Dunc is the bending stiffness corresponding to completely uncoupled glass layers, Dfull is the bending stiffness corresponding to full composite action, and η is a dimensionless partial-composite-action coefficient.
The coefficient η represents the effective structural interaction between the two glass layers provided by the POE interlayer. A value of η = 0 corresponds to the uncoupled limiting case, whereas η = 1 corresponds to full composite action. Intermediate values represent partial shear interaction. The coefficient is therefore treated as an effective structural calibration parameter and not as an intrinsic material property of POE.
The geometrical and material parameters adopted in the analytical model are summarized in Table 2.
The POE Young’s modulus range of 3–12 MPa was considered in the analytical representation, whereas the FE reference model employed the specific effective value of 11 MPa listed in Table 1.
The areal mass of the laminated specimen was calculated as:
For the completely uncoupled limiting case, in which the two glass layers deform independently and the POE interlayer transfers negligible shear forces, the bending stiffness was calculated as:
For the full-composite limiting case, perfect shear transfer through the POE interlayer was assumed such that both glass layers act as a single composite section. The distance from the neutral axis to the centroid of each glass layer was calculated as:
Calibrated effective bending stiffness. The partial-composite-action coefficient η was calibrated against the experimentally identified first natural frequency. Using Equation (7), the effective bending stiffness was subsequently evaluated from the calibrated value of η. The resulting analytical model was used to provide an effective-stiffness interpretation of the experimentally observed first-mode response rather than as an independently validated predictor of the complete modal spectrum.
In the present analytical formulation, a single calibrated η range was used to represent the average partial composite interaction under the investigated experimental conditions. Consequently, the model was not intended to reproduce the detailed variation of modal frequencies with gel content. Instead, it provides a baseline representation of the global dynamic stiffness of the glass–POE–glass laminate. An extended GC-dependent formulation would therefore be required to explicitly represent the experimentally observed non-monotonic frequency–GC relationship.
Rayleigh–Ritz formulation for a free–free rectangular plate. During the experimental modal analysis, the specimens were placed on soft foam without mechanical clamping. Therefore, the boundary conditions were approximated as free–free. The transverse displacement was represented by a Rayleigh–Ritz series expansion. The corresponding strain and kinetic energies were formulated for the equivalent plate, and the stationary condition of the total energy led to the generalized eigenvalue problem.
Because the plate is free in space, rigid-body translation and rotation modes have zero or near-zero frequencies and must be excluded from the set of elastic vibration modes.
The partial-composite-action coefficient introduced in the present study was not adopted directly from the literature. The underlying concept follows shear-coupled and effective-stiffness descriptions of laminated glass, whereas η was identified specifically from the experimentally measured modal response of the investigated glass–POE–glass laminate. Accordingly, η should be interpreted as an effective structural calibration parameter rather than as an intrinsic POE material property.
2.7. Statistical Analysis
The relationship between POE gel content and the experimentally identified natural frequencies was evaluated separately for each of the first six vibration modes. Because only five discrete GC levels (25%, 35%, 49%, 68%, and 75%) were investigated, the statistical analysis was treated as exploratory and was used primarily to characterize trends and compare the relative sensitivity of individual modes to changes in curing state.
Pearson’s correlation coefficient (r) was calculated for each vibration mode to quantify the strength and direction of the linear association between gel content and natural frequency. Because the experimentally observed frequency–GC relationship was not strictly monotonic, the linear correlation coefficient was not used as the sole measure of association.
To characterize the observed non-linear trend, a second-order polynomial regression was additionally fitted separately for each vibration mode:
where f is the experimentally identified natural frequency, GC is the gel content expressed in %, and a, b, and c are the fitted regression coefficients. The goodness of fit of each quadratic model was evaluated using the coefficient of determination (R2).
The absolute agreement between fitted and experimentally identified frequencies was additionally characterized using the root mean square error (RMSE) and mean absolute error (MAE):
where fexp,i and ffit,i are the experimentally identified and fitted natural frequencies, respectively, and n is the number of investigated GC levels.
Given the limited number of GC levels, no inferential significance testing was used to establish a statistically validated predictive relationship between gel content and natural frequency. Accordingly, Pearson’s r, R2, RMSE, and MAE were interpreted as descriptive measures of the observed frequency–GC trends rather than as evidence of a generalized predictive relationship.
3. Results
3.1. Experimental Modal Identification
The first six elastic vibration modes were consistently identified from the measured acceleration responses using FDD. EFDD was additionally applied to refine the modal-frequency estimates and to determine the corresponding damping ratios for the GC = 68% reference specimen. The modal parameters obtained for this specimen are summarized in Table 3.
The FDD analysis identified the first six natural frequencies at 148, 176, 284, 312, 376, and 472 Hz. The corresponding EFDD estimates were 146.584, 177.441, 286.282, 310.830, 375.802, and 474.049 Hz, respectively. The close correspondence between the FDD and EFDD frequency estimates supports consistent identification of the same six structural modes using both decomposition procedures. Representative FDD and EFDD identification results are presented in Figure 6.
The EFDD-derived damping ratios for Modes 1–6 were 3.051%, 2.722%, 2.558%, 1.924%, 1.744%, and 2.130%, respectively. Within this reference measurement, damping generally decreased from the first toward the higher-order modes, reaching its minimum for Mode 5 before increasing slightly for Mode 6. Because damping was evaluated only for the GC = 68% reference specimen, these values are reported as modal characteristics of the reference laminate and are not used to establish a relationship between damping and gel content.
The experimentally identified deformation patterns corresponding to the first six elastic modes are presented in Figure 7. These mode shapes were subsequently used together with the natural frequencies to establish modal correspondence with the FE results and to maintain consistent mode tracking across the investigated GC levels.
3.2. Effect of POE Gel Content on Natural Frequencies
The experimentally identified natural frequencies exhibited a measurable dependence on POE gel content, although the response was not monotonic over the investigated GC range. The FDD natural frequencies obtained for the first six vibration modes at the five GC levels are summarized in Table 4. Mode 1 showed only a small variation, with frequencies between 147 and 149 Hz. In contrast, progressively larger absolute frequency differences were observed for several of the higher-order modes.
The magnitude of the frequency variation depended strongly on the vibration mode. Across the investigated GC range, the peak-to-peak frequency variation was 2 Hz for Mode 1, 7 Hz for Mode 2, 9 Hz for Mode 3, 13 Hz for Mode 4, 17 Hz for Mode 5, and 15 Hz for Mode 6. Relative to the maximum frequency observed for each mode, these variations correspond to approximately 1.34%, 3.83%, 3.07%, 4.00%, 4.33%, and 3.09%, respectively. Thus, Mode 1 exhibited substantially lower sensitivity to changes in curing state than the higher-order modes, while the largest relative variation was observed for Mode 5.

Table 5.
Frequency variation of the first six vibration modes across the investigated POE gel-content range.
Table 5.
Frequency variation of the first six vibration modes across the investigated POE gel-content range.
| Mode | Maximum frequency, Hz | Minimum frequency, Hz | Frequency range, Hz | Relative range, % | GC at minimum frequency, % |
|---|---|---|---|---|---|
| 1 | 149 | 147 | 2 | 1.34 | 49 |
| 2 | 183 | 176 | 7 | 3.83 | 68 |
| 3 | 293 | 284 | 9 | 3.07 | 68 |
| 4 | 325 | 312 | 13 | 4.00 | 68 |
| 5 | 393 | 376 | 17 | 4.33 | 68 |
| 6 | 485 | 470 | 15 | 3.09 | 49 |
The frequency–GC relationship was not strictly monotonic. Modes 2–5 generally exhibited decreasing natural frequencies as GC increased from 25% toward 68%, followed by a partial frequency recovery at GC = 75%. For these modes, the minimum frequencies were observed at GC = 68%: 176 Hz for Mode 2, 284 Hz for Mode 3, 312 Hz for Mode 4, and 376 Hz for Mode 5. At GC = 75%, the corresponding frequencies increased to 179, 288, 317, and 383 Hz, respectively. Mode 6 exhibited a somewhat different pattern, reaching its minimum frequency of 470 Hz at GC = 49% before increasing to 472 Hz at GC = 68% and 479 Hz at GC = 75%. Mode 1 remained comparatively insensitive, varying only between 147 and 149 Hz, with its minimum also occurring at GC = 49%.
Figure 8.
Experimentally identified natural frequencies of the first six vibration modes as a function of POE gel content.
Figure 8.
Experimentally identified natural frequencies of the first six vibration modes as a function of POE gel content.
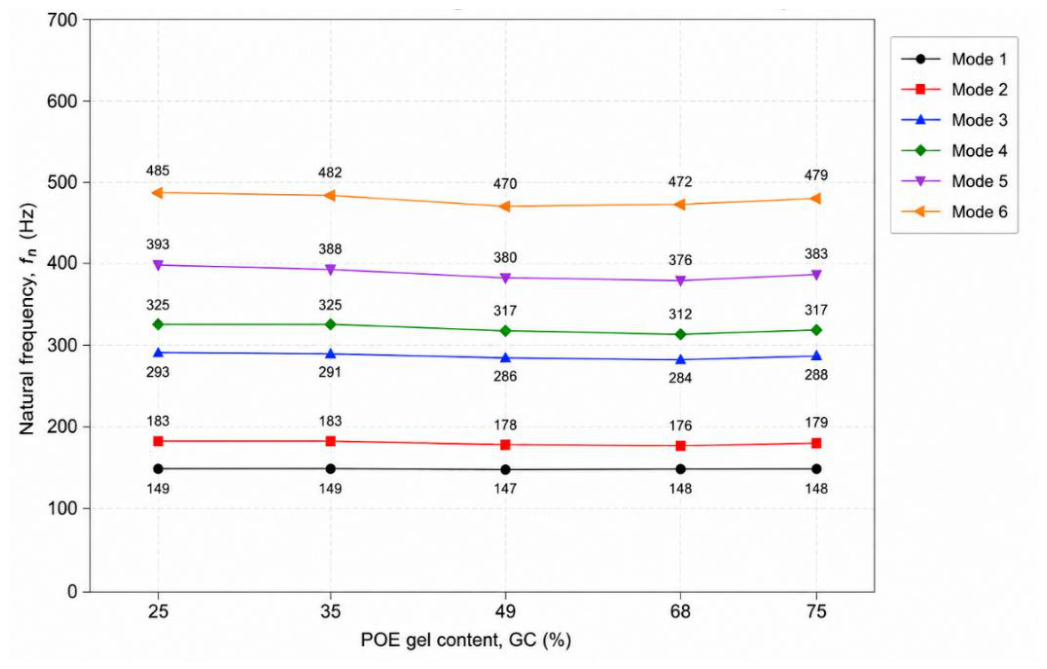
These results indicate that the sensitivity of the modal response to curing state is mode dependent. The first mode showed only a small frequency variation over the investigated GC range, whereas Modes 2–6 exhibited relative ranges of approximately 3–4%. Among the investigated modes, Mode 5 showed the largest relative frequency variation (4.33%). The larger frequency variations observed for several higher-order modes suggest that these modes may provide more informative indicators for distinguishing changes in the effective mechanical state of the laminate than the first global mode alone.
3.3. Finite Element Comparison for the Reference Laminate
The FE eigenfrequency analysis was compared with the experimentally identified FDD results for the GC = 68% reference specimen. The comparison was performed for the first six elastic vibration modes, with modal correspondence established on the basis of both natural frequencies and the associated deformation patterns. The FE analysis was used to assess whether the simplified numerical representation reproduced the principal modal characteristics of the laminate rather than to predict the experimentally observed dependence of natural frequency on gel content.
Table 6.
Comparison of experimentally identified and FE-predicted natural frequencies for the GC = 68% reference laminate.
Table 6.
Comparison of experimentally identified and FE-predicted natural frequencies for the GC = 68% reference laminate.
| Mode | Experimental FDD frequency, Hz | FE frequency, Hz | Relative error, % |
|---|---|---|---|
| 1 | 148 | 151.70 | 2.50 |
| 2 | 176 | 184.87 | 5.04 |
| 3 | 284 | 304.06 | 7.06 |
| 4 | 312 | 318.72 | 2.15 |
| 5 | 376 | 405.42 | 7.82 |
| 6 | 472 | 516.54 | 9.44 |
The FE-predicted natural frequencies showed generally satisfactory agreement with the experimentally identified FDD frequencies for the GC = 68% reference laminate. The relative differences between the numerical and experimental frequencies ranged from 2.15% to 9.44% across the first six elastic modes. The closest agreement was obtained for Mode 4, for which the experimental and FE frequencies were 312 and 318.72 Hz, respectively, corresponding to a relative difference of 2.15%. The largest difference was observed for Mode 6, with experimental and FE frequencies of 472 and 516.54 Hz, respectively, corresponding to 9.44%.
The FE model systematically overpredicted the experimentally identified natural frequencies for all six modes. The magnitude of the discrepancy generally increased for several higher-order modes, although this trend was not strictly monotonic, as demonstrated by the comparatively small difference obtained for Mode 4. Considering the simplifying assumptions of homogeneous and linear-elastic constituent properties, perfectly bonded glass–POE interfaces, and idealized free–free boundary conditions, the observed level of agreement indicates that the numerical model reproduces the principal global dynamic characteristics of the reference laminate.
The correspondence between the experimentally identified mode shapes shown in Figure 7 and the FE-predicted deformation patterns is further illustrated in Figure 9.
Overall, the FE deformation patterns reproduced the principal spatial characteristics of the experimentally identified modes, supporting the adopted modal correspondence between the numerical and experimental results. However, the systematic overprediction of the natural frequencies indicates that the simplified linear-elastic FE representation does not fully capture the effective dynamic compliance of the POE-coupled laminate.
3.4. Results of the Calibrated Partial-Composite-Action Model
The partial-composite-action model was calibrated using the experimentally identified first natural frequency, as described in Section 2.6. The calibration resulted in a partial-composite-action coefficient η of approximately 0.26–0.27. The corresponding effective bending stiffness, Deff, was approximately 1240–1275 N · m, yielding a calculated first natural frequency of approximately 147–149 Hz. This range is consistent with the experimentally identified first-mode frequencies of 147–149 Hz across the investigated GC levels.
The calibrated value of η indicates an intermediate structural state between the limiting cases of completely uncoupled glass layers and full composite action. Within the adopted effective-stiffness formulation, approximately 26–27% of the theoretically available increase in bending stiffness between these two limiting states is represented by the calibrated model. The result therefore indicates significant but incomplete mechanical coupling between the glass layers through the POE interlayer. Importantly, η should be interpreted as an effective structural calibration parameter rather than as a direct material property of POE.
Table 7.
Calibrated parameters and principal results of the partial-composite-action model.
| Parameter | Symbol | Calibrated/model value |
|---|---|---|
| Partial-composite-action coefficient | η | 0.26–0.27 |
| Effective bending stiffness | Deff | 1240–1275 N·m |
| Calculated first natural frequency | f1 | 147–149 Hz |
The calibrated model reproduces the experimentally observed first-mode frequency by construction because Mode 1 was used as the calibration target. Therefore, agreement for this mode should not be interpreted as independent model validation. In the present study, the analytical model is used primarily to provide an effective-stiffness interpretation of the first-mode response and the degree of partial mechanical coupling between the glass layers, rather than as an independently validated predictor of the complete modal spectrum.
The analytical formulation is intended to represent the global dynamic stiffness of the laminate rather than the detailed dependence of modal frequency on gel content. Accordingly, the calibrated η range should be regarded as representative of the average partial composite interaction under the investigated conditions. The experimentally observed non-monotonic frequency–GC relationship would require a more advanced formulation in which the effective interlayer interaction varies with curing state and, potentially, vibration frequency.
3.5. Statistical Analysis Results
The exploratory statistical analysis confirmed that the relationship between POE gel content and natural frequency differed among the investigated vibration modes. Pearson’s correlation coefficients were negative for all six modes, ranging from −0.555 for Mode 1 to −0.861 for Mode 4. Modes 2–5 exhibited comparatively stronger negative linear associations with gel content, whereas Modes 1 and 6 showed weaker linear correlations. These results are consistent with the experimentally observed overall decrease in frequency with increasing GC over much of the investigated range, while also reflecting the non-monotonic frequency recovery observed at the higher GC levels.
Because the experimental frequency–GC relationships were not strictly linear, second-order polynomial regressions were additionally fitted to the data. The quadratic models produced coefficients of determination (R2) ranging from 0.654 to 0.906. The highest R2 was obtained for Mode 5 (0.906), followed by Mode 3 (0.871) and Mode 6 (0.842). Mode 1 exhibited the lowest R2 (0.654), consistent with its comparatively small frequency variation across the investigated GC range. The quadratic fits therefore described the observed trends more closely for several higher-order modes than for the first global mode.
The absolute deviations between the quadratic fits and the experimentally identified frequencies were small relative to the modal-frequency magnitudes. RMSE values ranged from 0.440 Hz for Mode 1 to 2.288 Hz for Mode 6, while MAE values ranged from 0.386 to 2.115 Hz. The statistical results are summarized in Table 8.
Given that only five discrete GC levels were available for each mode, these statistical measures should be interpreted descriptively. In particular, the relatively high R2 values obtained for several quadratic fits do not establish a validated predictive relationship between gel content and natural frequency. Rather, they quantify the observed curvature of the present dataset and support the experimental observation that higher-order modal frequencies are generally more responsive to changes in POE curing state than the first mode.
4. Discussion
The experimental results demonstrate that the curing state of the POE interlayer produces measurable changes in the dynamic response of the glass–POE–glass laminate. However, the relationship between gel content and natural frequency was neither uniform across the investigated modes nor strictly monotonic. The first vibration mode varied by only 2 Hz across the complete GC range, whereas the higher-order modes exhibited substantially larger peak-to-peak variations of 7–17 Hz. Modes 2–5 generally decreased in frequency as GC increased from 25% to 68%, followed by a partial recovery at GC = 75%. Mode 6 exhibited a different response, with its minimum frequency occurring at GC = 49%. These observations indicate that gel content cannot be interpreted as a simple scalar parameter producing a proportional change in the global stiffness of the laminate.
This non-monotonic behavior is physically plausible because gel content characterizes the solvent-insoluble fraction of the crosslinked polymer network but does not directly quantify the elastic or shear modulus of the POE interlayer. The structural modal response is governed by the combined effects of the constituent properties and the mechanical interaction between the glass layers. Consequently, changes in curing state may alter the effective shear transfer through the POE interlayer without producing a directly proportional change in gel content and laminate bending stiffness. This interpretation is consistent with the distinction made in the present study between GC as an operational indicator of curing state and the effective mechanical properties governing the dynamic response of the laminate.
The greater frequency variation observed for the higher-order modes suggests that they provide greater sensitivity to curing-induced changes in the mechanical state of the interlayer than the first global mode. Higher-order deformation patterns can involve increased spatial variation of curvature and therefore provide multiple modal indicators of changes in the effective laminate stiffness. This finding is also supported by the exploratory statistical analysis, in which several higher-order modes exhibited stronger associations between GC and natural frequency than Mode 1. Nevertheless, the response was mode dependent, as demonstrated particularly by the different behavior of Mode 6. A multi-mode assessment is therefore preferable to reliance on a single natural frequency when modal characterization is considered for curing-state screening.
The FE analysis provided a complementary numerical reference for interpretation of the experimentally identified modal characteristics of the GC = 68% laminate. The calculated deformation patterns reproduced the principal spatial characteristics of the experimentally identified modes, supporting the adopted correspondence between the experimental and numerical modal sequences. The FE model nevertheless systematically overpredicted the measured natural frequencies, with relative differences ranging from 2.15% to 9.44%. This discrepancy is consistent with the simplifying assumptions adopted in the numerical representation, including homogeneous and linear-elastic constituent properties, perfectly bonded glass–POE interfaces, and idealized free–free boundary conditions. In particular, representation of the POE interlayer by a single effective elastic modulus cannot reproduce its potentially frequency-dependent and curing-dependent mechanical response. The FE results should therefore be interpreted primarily as support for modal identification and structural interpretation rather than as a validated constitutive model of the POE interlayer.
The calibrated partial-composite-action model provides a complementary mechanical interpretation of these observations. The identified coefficient η ≈ 0.26–0.27 places the laminate between the limiting conditions of completely uncoupled glass layers and full composite action, indicating substantial but incomplete mechanical interaction through the POE interlayer. The corresponding effective bending stiffness of approximately 1240–1275 N·m reproduces the experimentally observed first-mode frequency range of approximately 147–149 Hz. Because η was calibrated using the first-mode response, this agreement does not constitute independent model validation. Instead, the model demonstrates that the measured global dynamic response can be represented consistently by an intermediate effective-stiffness state, supporting the interpretation of the POE layer as a compliant mechanical coupling medium between the two glass layers.
From a practical perspective, the present results indicate that modal characterization may provide a useful non-destructive screening tool for assessing changes in the curing state of POE-containing laminated structures. Unlike solvent-extraction methods, vibration-based measurements do not require removal or destruction of the encapsulant and characterize the integrated mechanical response of the laminated specimen. The observed differences among the higher-order modal frequencies suggest that a multi-mode frequency signature could potentially be used to distinguish laminates with different curing states. However, because the frequency–GC relationship was non-monotonic, the present results do not support determination of an unknown gel-content value from a single measured natural frequency. The method should therefore presently be regarded as a comparative screening approach rather than as a quantitative replacement for conventional gel-content determination.
Several limitations of the present study should be considered when interpreting the results. First, only five discrete gel-content levels were investigated, which limits the statistical resolution of the observed frequency–GC relationships and precludes establishment of a generalized predictive model. Second, the investigated specimens represented a simplified glass–POE–glass configuration without photovoltaic cells. This configuration was intentionally selected to isolate the mechanical contribution of the POE interlayer, but the dynamic response of complete photovoltaic modules may additionally be affected by cells, metallization, interconnects, local interfaces, and other structural components. Third, damping was evaluated only for the GC = 68% reference specimen and therefore cannot presently be used to assess curing-state dependence. Finally, the FE and analytical models employ simplified representations of the POE interlayer and do not explicitly account for its complete viscoelastic, frequency-dependent, temperature-dependent, or curing-dependent constitutive behavior.
Future work should therefore focus on expanding the experimental dataset to include a larger number of specimens and additional curing states, with independent specimens used for calibration and validation. Particular attention should be given to the higher-order modes identified here as more sensitive to changes in curing state and to the development of multi-modal classification approaches rather than single-frequency correlations. Measurements on complete photovoltaic laminates containing cells will also be required to determine whether the observed modal indicators remain sufficiently sensitive under more representative structural conditions. In parallel, characterization of the curing-dependent and frequency-dependent mechanical properties of POE would enable development of more physically based numerical models linking polymer state, interlayer shear transfer, and laminate modal response. Such validation is necessary before vibration-based characterization can be used for quantitative estimation of unknown POE gel content or transferred to industrial quality-control applications.
5. Conclusions
This study investigated the feasibility of using vibration-based modal characterization as a non-destructive indicator of the curing state of POE interlayers in simplified glass–POE–glass laminate specimens relevant to photovoltaic module structures. Five experimentally determined gel-content levels, ranging from 25% to 75%, were investigated using FDD and EFDD, and the first six elastic vibration modes were identified. The results demonstrated that changes in POE curing state are reflected in the modal response of the laminated structure, although the relationship between gel content and natural frequency is not strictly monotonic.
The magnitude of the observed frequency variation was strongly mode dependent. Mode 1 varied by only 2 Hz across the investigated GC range, whereas Modes 2–6 exhibited peak-to-peak variations of 7–17 Hz, corresponding to relative ranges of approximately 3–4.3%. Modes 2–5 generally decreased in frequency as GC increased from 25% to 68%, followed by a partial recovery at 75% GC. Among the investigated modes, Mode 5 exhibited the largest relative frequency variation of 4.33%. These results indicate that a multi-mode frequency assessment, particularly including higher-order modes, provides more information on curing-induced changes than the first global mode alone.
The numerical and analytical models provided complementary structural interpretation of the experimental observations. The FE model reproduced the principal experimentally identified deformation patterns, while the calculated natural frequencies differed from the measured values by 2.15–9.44%. The calibrated partial-composite-action model yielded η ≈ 0.26–0.27 and an effective bending stiffness of approximately 1240–1275 N·m, indicating an intermediate structural condition between uncoupled glass layers and full composite action. These results support the interpretation that the POE interlayer provides significant but incomplete mechanical coupling between the glass layers.
The present findings support modal characterization as a potentially rapid and non-destructive screening approach for distinguishing changes in POE curing state. However, the limited number of investigated GC levels, the simplified glass–POE–glass specimens without photovoltaic cells, and the non-monotonic frequency–GC relationship currently preclude quantitative estimation of unknown gel content from modal frequencies alone. Validation using larger independent specimen sets, complete photovoltaic laminates, and curing- and frequency-dependent POE material characterization is required before the approach can be developed into a quantitative industrial quality-control method.
Author Contributions
Conceptualization, A.K., E.D. and V.M.; methodology, A.K., E.D. and V.M.; software, A.K., E.D. and V.M.; validation, A.K., E.D. and V.M.; formal analysis, A.K., A.C., E.D. and V.M.; investigation, A.K., E.D. and V.M.; resources, A.K.; data curation, A.K., A.C., E.D. and V.M.; writing—original draft preparation, A.K., A.C., E.D., P.D. and V.M.; writing—review and editing, A.K., A.C., E.D. and V.M.; visualization, A.K., A.C., E.D., A.G. and V.M.; supervision, A.K.; project administration, A.K.; funding acquisition, A.K. All authors have read and agreed to the published version of the manuscript.
Funding
This research received no external funding.
Data Availability Statement
The raw data supporting the conclusions of this article will be made available by the authors on request.
Acknowledgments
This project was funded by the Research Council of Lithuania (LMTLT), under agreement No. S-PD-24-129.
Conflicts of Interest
The authors declare no conflicts of interest.
References
- Baiamonte, M.; Colletti, C.; Ragonesi, A.; Gerardi, C.; Dintcheva, N.T. Durability and Performance of Encapsulant Films for Bifacial Heterojunction Photovoltaic Modules. Polymers 2022, 14, 1052. [Google Scholar] [CrossRef] [PubMed]
- Oreski, G.; Omazic, A.; Eder, G.C.; Voronko, Y.; Neumaier, L.; Mühleisen, W.; Hirschl, C.; Ujvari, G.; Ebner, R.; Edler, M. Properties and Degradation Behaviour of Polyolefin Encapsulants for Photovoltaic Modules. Prog. Photovolt. Res. Appl. 2020, 28, 1277–1288. [Google Scholar] [CrossRef]
- Kim, D.; Lim, H.; Kim, S.H.; Lee, K.N.; You, J.; Ryu, D.Y.; Kim, J. Recent Developments of Polymer-Based Encapsulants and Backsheets for Stable and High-Performance Silicon Photovoltaic Modules: Materials Nanoarchitectonics and Mechanisms. J. Mater. Chem. A 2024, 12, 7452–7469. [Google Scholar] [CrossRef]
- Dintcheva, N.T.; Morici, E.; Colletti, C. Encapsulant Materials and Their Adoption in Photovoltaic Modules: A Brief Review. Sustainability 2023, 15, 9453. [Google Scholar] [CrossRef]
- Barretta, C.; Oreski, G.; Feldbacher, S.; Resch-Fauster, K.; Pantani, R. Comparison of Degradation Behavior of Newly Developed Encapsulation Materials for Photovoltaic Applications under Different Artificial Ageing Tests. Polymers 2021, 13, 271. [Google Scholar] [CrossRef] [PubMed]
- Uličná, S.; Sinha, A.; Miller, D.C.; Habersberger, B.M.; Schelhas, L.T.; Owen-Bellini, M. PV Encapsulant Formulations and Stress Test Conditions Influence Dominant Degradation Mechanisms. Sol. Energy Mater. Sol. Cells 2023, 255, 112319. [Google Scholar] [CrossRef]
- Fiandra, V.; Sannino, L.; Andreozzi, C.; Flaminio, G.; Pellegrino, M. New PV Encapsulants: Assessment of Change in Optical and Thermal Properties and Chemical Degradation after UV Aging. Polym. Degrad. Stab. 2024, 220, 110643. [Google Scholar] [CrossRef]
- Oreski, G.; Barretta, C.; Christöfl, P.; Gebhardt, P.; Weiß, K.-A.; Miller, D.C.; Uličná, S.; Kempe, M.; Bruckman, L.S.; Virtuani, A.; et al. What Is a Polyolefin? A Critical Overview of Ethylene Copolymers Used as Solar Photovoltaic Module Encapsulants. Prog. Photovolt. Res. Appl. 2026, 34, 367–395. [Google Scholar] [CrossRef]
- Wallner, G.M.; Adothu, B.; Pugstaller, R.; Costa, F.R.; Mallick, S. Comparison of Crosslinking Kinetics of UV-Transparent Ethylene-Vinyl Acetate Copolymer and Polyolefin Elastomer Encapsulants. Polymers 2022, 14, 1441. [Google Scholar] [CrossRef] [PubMed]
- Liu, Z.; Liu, Z.; Zhu, E.; Luo, P.; Zhao, S. Influence of Crystallization on the Crosslinking Behavior of Polyolefin Elastomer and Its Mechanism. Polymer 2025, 335, 128821. [Google Scholar] [CrossRef]
- Liu, Z.; Cui, W.; Luo, P.; Zhao, S. A Novel Reactive Hindered Amine Light Stabilizer for In Situ Grafting in POE Photovoltaic Encapsulation Films during Cross-Linking. Ind. Eng. Chem. Res. 2026, 65, 17224–17234. [Google Scholar] [CrossRef]
- Landa - Pliquet, M.; Béjat, T.; Serasset, M.; Descormes, A.; Mofakhami, E.; Voroshazi, E. Enhancing Photovoltaic Modules Encapsulation: Optimizing Lamination Processes for Polyolefin Elastomers (POE) through Crosslinking Behavior Analysis. Sol. Energy Mater. Sol. Cells 2024, 267, 112725. [Google Scholar] [CrossRef]
- Nair, J.R.; Pradhan, N.; Schenk, P.; Pander, M.; Bornemann, S.; Gottschalg, R.; Mordvinkin, A. Polyolefin Elastomer Encapsulants with Varied Adhesion Promoter Content: Adhesion-Crosslinking Tradeoffs and Molecular Insights. Sol. Energy Mater. Sol. Cells 2026, 307, 114566. [Google Scholar] [CrossRef]
- Park, J.H.; Hwang, S.-H. Construction and Characterization of Polyolefin Elastomer Blends with Chemically Modified Hydrocarbon Resin as a Photovoltaic Module Encapsulant. Polymers 2022, 14, 4620. [Google Scholar] [CrossRef] [PubMed]
- Tiefenthaler, M.; Wallner, G.M.; Pugstaller, R. Effect of Global Damp Heat Ageing on Debonding of Crosslinked EVA- and POE-Glass Laminates. Sol. Energy Mater. Sol. Cells 2024, 264, 112602. [Google Scholar] [CrossRef]
- Park, J.H.; Hwang, S.-H. A Polyolefin Elastomer Encapsulant Modified by an Ethylene–Propylene–Diene Terpolymer for Photovoltaic Applications. ACS Omega 2024, 9, 3858–3865. [Google Scholar] [CrossRef] [PubMed]
- Park, J.H.; Kim, O.Y.; Bae, S.-H.; Hwang, S.-H. Effect of Silane-Functionalized Acrylate-Based Copolymer Additive on the Adhesion Properties of Polyolefin Elastomers for Photovoltaic Modules. ACS Appl. Energy Mater. 2025, 8, 13421–13429. [Google Scholar] [CrossRef]
- Zemanová, A.; Zeman, J.; Janda, T.; Schmidt, J.; Šejnoha, M. On Modal Analysis of Laminated Glass: Usability of Simplified Methods and Enhanced Effective Thickness. Compos. Part B Eng. 2018, 151, 92–105. [Google Scholar] [CrossRef]
- Hána, T.; Janda, T.; Schmidt, J.; Zemanová, A.; Šejnoha, M.; Eliášová, M.; Vokáč, M. Experimental and Numerical Study of Viscoelastic Properties of Polymeric Interlayers Used for Laminated Glass: Determination of Material Parameters. Materials 2019, 12, 2241. [Google Scholar] [CrossRef] [PubMed]
- Centelles, X.; Pelayo, F.; Lamela-Rey, M.J.; Fernández, A.I.; Salgado-Pizarro, R.; Castro, J.R.; Cabeza, L.F. Viscoelastic Characterization of Seven Laminated Glass Interlayer Materials from Static Tests. Constr. Build. Mater. 2021, 279, 122503. [Google Scholar] [CrossRef]
- Hála, P.; Zemanová, A.; Plachý, T.; Konrád, P.; Sovják, R. Experimental Modal Analysis of Glass and Laminated Glass Large Panels with EVA or PVB Interlayer at Room Temperature. Mater. Today Proc. 2022, 62, 2421–2428. [Google Scholar] [CrossRef]
- Pelayo, F.; López-Aenlle, M. Natural Frequencies and Damping Ratios of Multi-Layered Laminated Glass Beams Using a Dynamic Effective Thickness. Jnl Sandw. Struct. Mater. 2019, 21, 439–463. [Google Scholar] [CrossRef]
- Galić, J.; Stepinac, L.; Bošnjak, A.; Zovko, I. Influence of PVB Interlayer Mechanical Properties on Laminated Glass Elements Design in Dependence of Real Time-Temperature Changes. Polymers 2022, 14, 4402. [Google Scholar] [CrossRef] [PubMed]
- Šetkus, A.; Devenson, J.; Vaičikauskas, V.; Donėlienė, J.; Dubravskij, P.; Galdikas, A. Evaluation of PV Module Encapsulant by Infrared Absorbance Band Shape. Spectrochim. Acta Part A Mol. Biomol. Spectrosc. 2026, 363, 128490. [Google Scholar] [CrossRef] [PubMed]
- Luo, B.; Gallas, S.; Micallef, C.; Govaerts, J.; Gryllias, K.; Poortmans, J. Experimental and Finite Element Modal Analysis of Photovoltaic Modules for the Design of Next-Generation Vehicle-Integrated PV Applications. Sol. Energy Mater. Sol. Cells 2025, 290, 113683. [Google Scholar] [CrossRef]
Figure 1.
Schematic representation of the experimental modal-testing configuration, including the glass–POE–glass specimen, impact excitation, five accelerometers, LAN-XI data acquisition system, and BK Connect processing environment.
Figure 1.
Schematic representation of the experimental modal-testing configuration, including the glass–POE–glass specimen, impact excitation, five accelerometers, LAN-XI data acquisition system, and BK Connect processing environment.
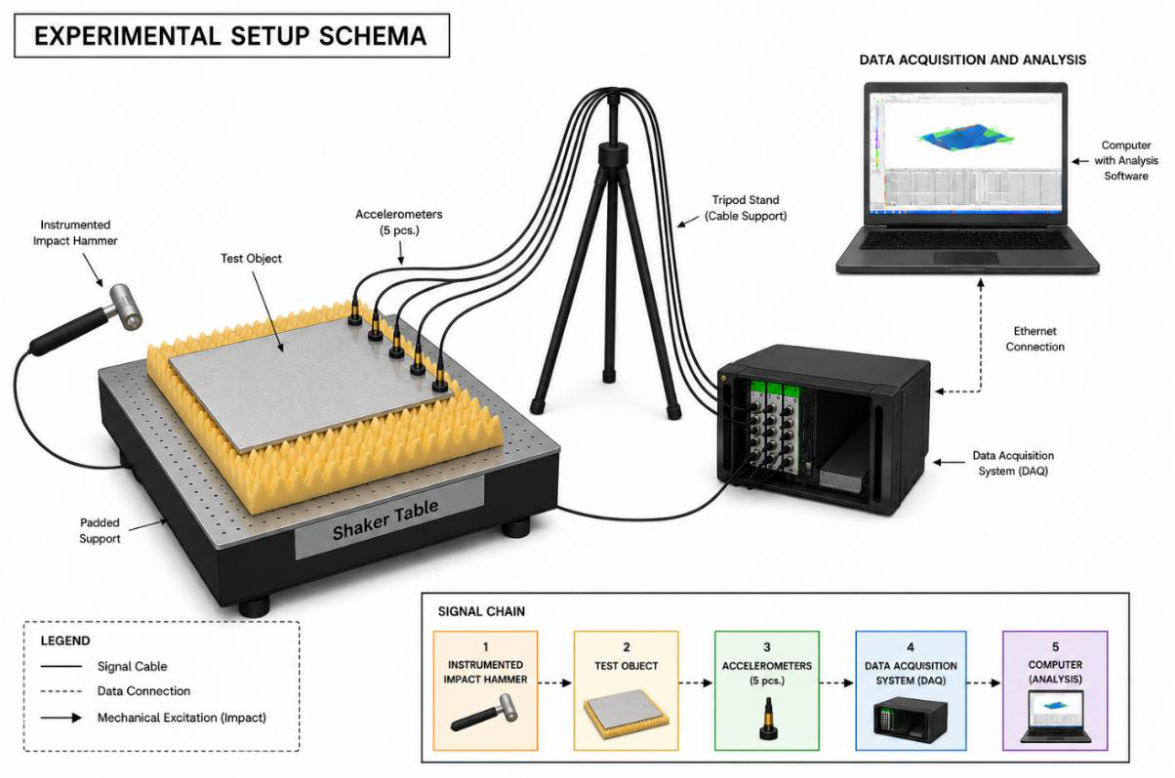
Figure 2.
Laboratory arrangement used for vibration measurements of the glass–POE–glass laminated specimens under approximately free–free boundary conditions.
Figure 2.
Laboratory arrangement used for vibration measurements of the glass–POE–glass laminated specimens under approximately free–free boundary conditions.
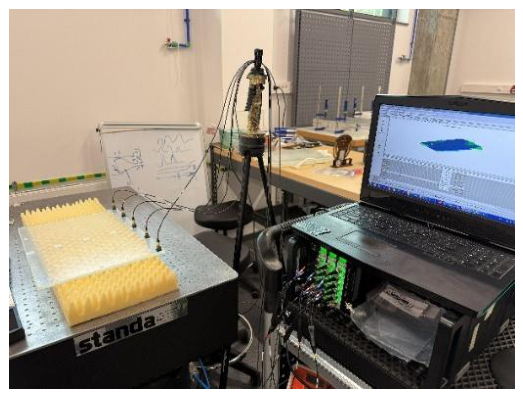
Figure 3.
Experimental response measurements for the GC = 68% specimen: (a) accelerometer measurement locations on the glass–POE–glass laminate; (b) representative acceleration time histories recorded at the five measurement locations during repeated impact excitation.
Figure 3.
Experimental response measurements for the GC = 68% specimen: (a) accelerometer measurement locations on the glass–POE–glass laminate; (b) representative acceleration time histories recorded at the five measurement locations during repeated impact excitation.
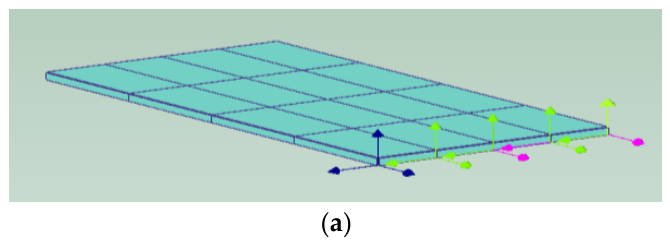
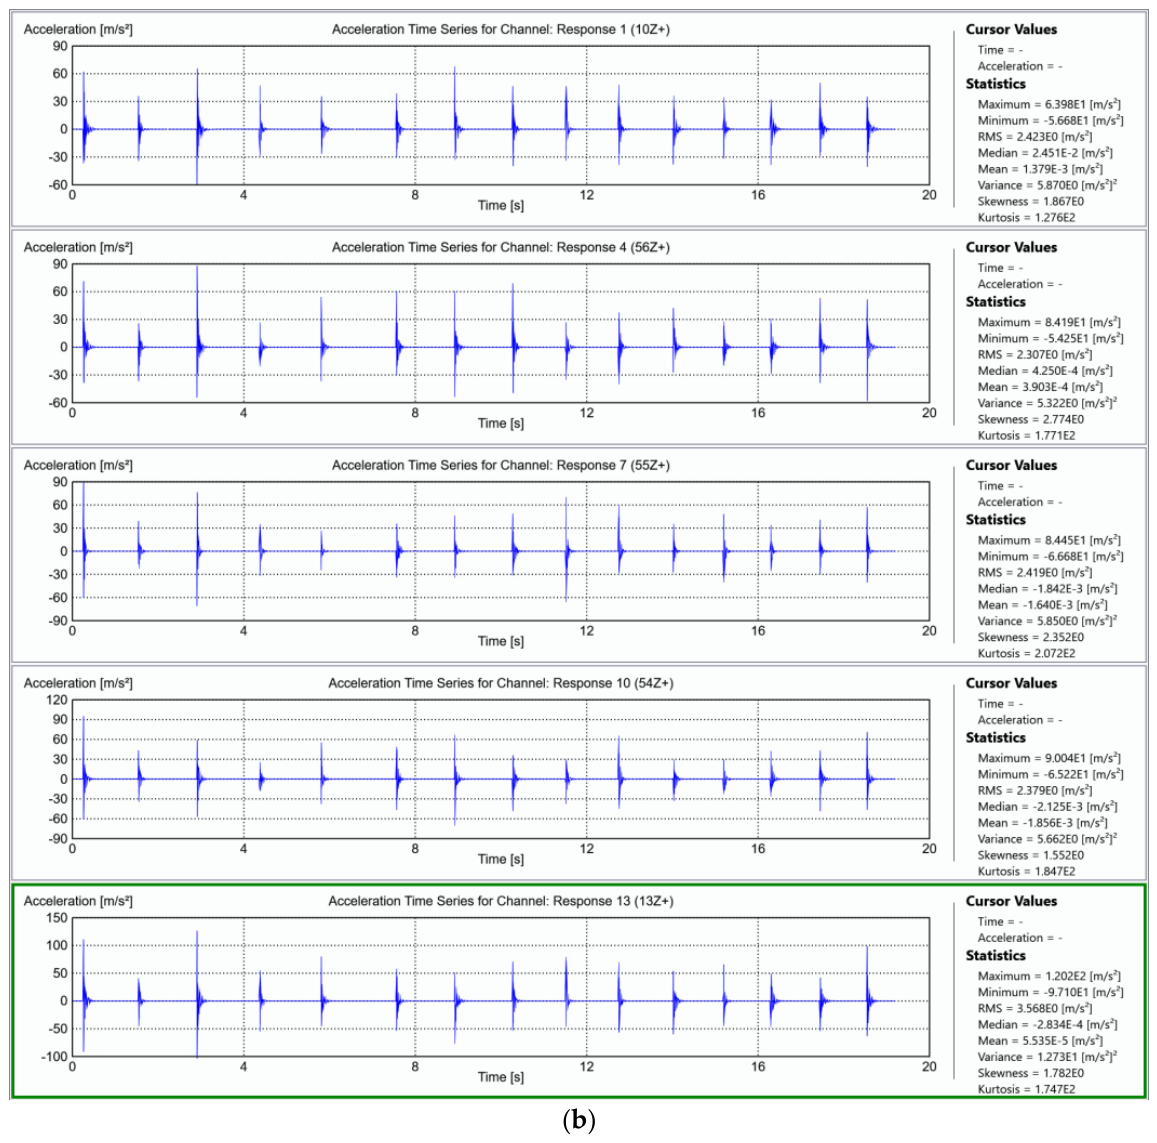
Figure 4.
Finite element representation of the glass–POE–glass laminate in COMSOL Multiphysics: (a) general model view; (b) layered laminate configuration.
Figure 4.
Finite element representation of the glass–POE–glass laminate in COMSOL Multiphysics: (a) general model view; (b) layered laminate configuration.
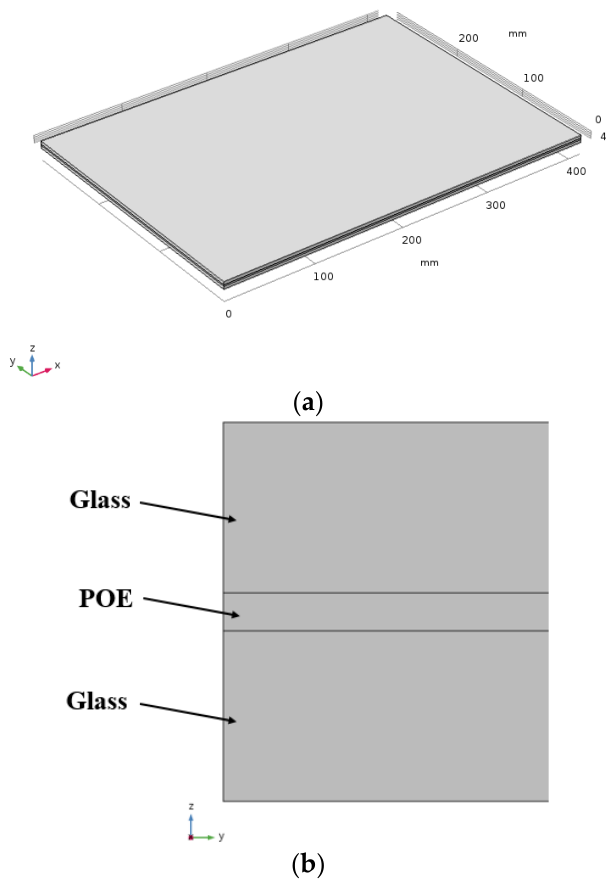
Figure 5.
Finite element discretization of the glass–POE–glass laminate.
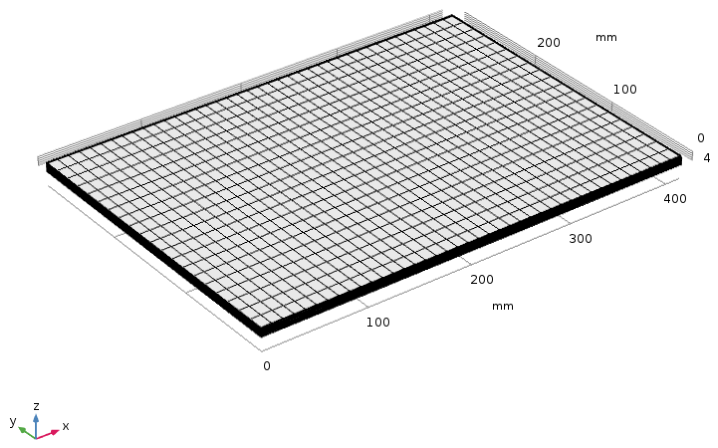
Figure 6.
Representative results used for modal parameter identification of the GC = 68% reference specimen: (a) Frequency Domain Decomposition (FDD); (b) Enhanced Frequency Domain Decomposition (EFDD).
Figure 6.
Representative results used for modal parameter identification of the GC = 68% reference specimen: (a) Frequency Domain Decomposition (FDD); (b) Enhanced Frequency Domain Decomposition (EFDD).
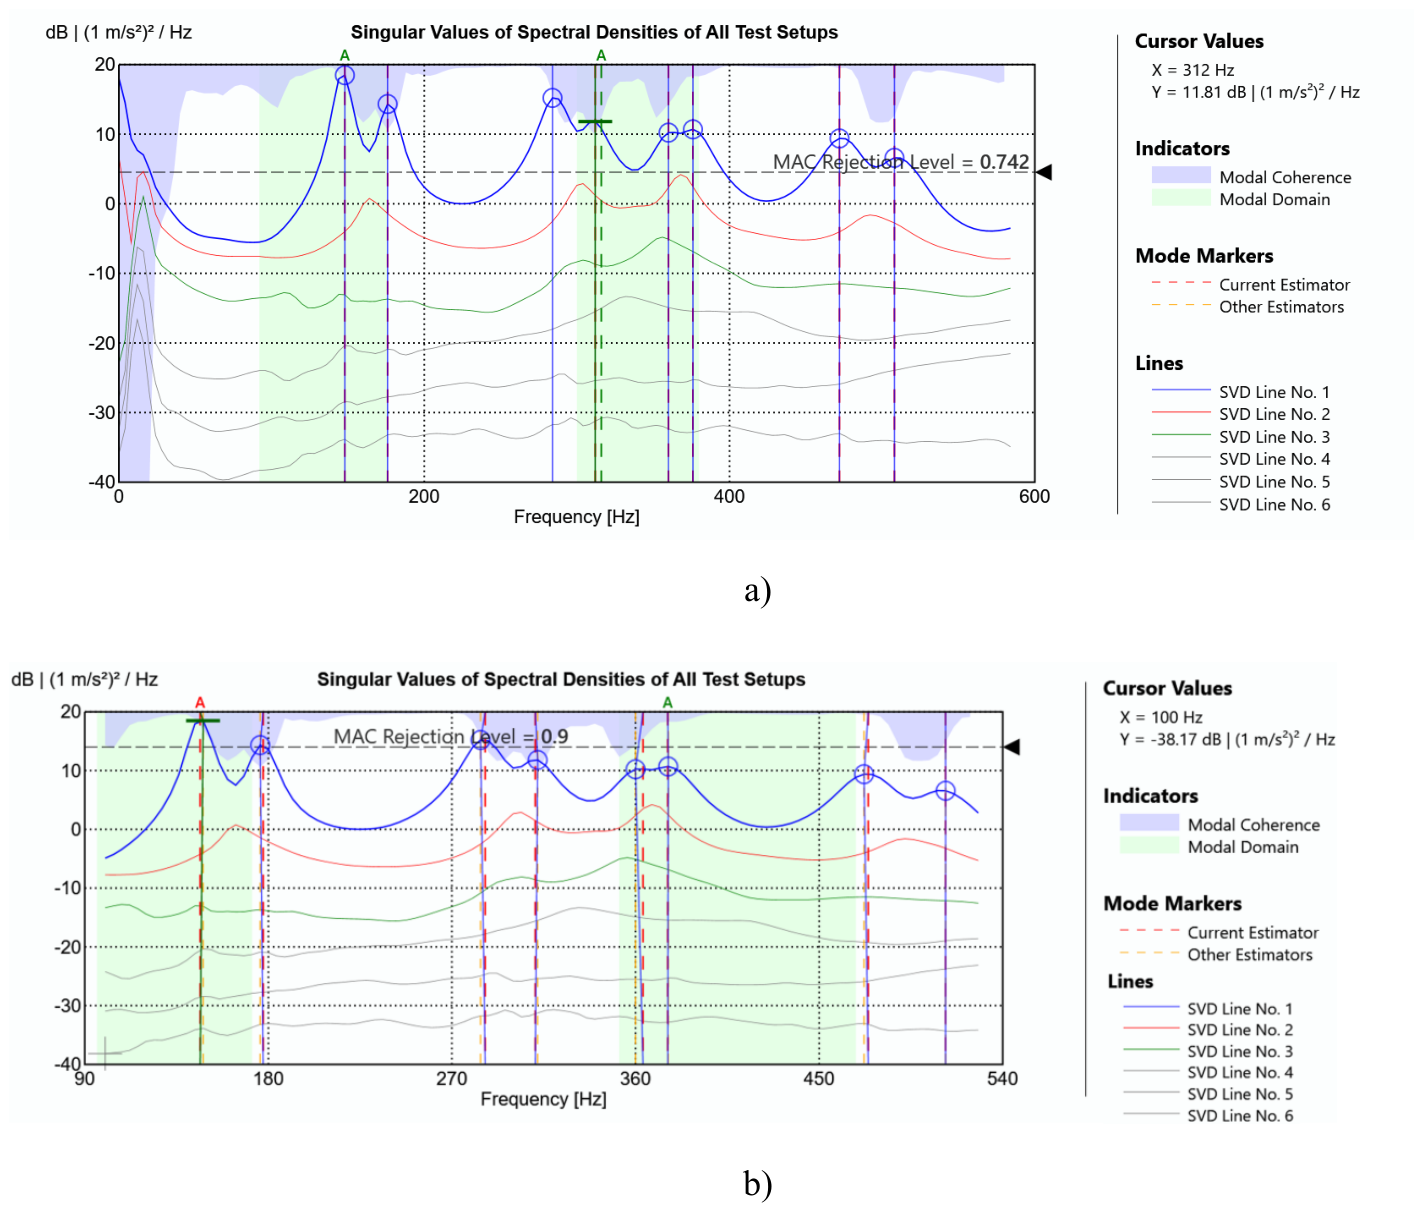
Figure 7.
E. erimentally identified mode shapes corresponding to the first six elastic vibration modes of the glass–POE–glass laminate: (a) Mode 1; (b) Mode 2; (c) Mode 3; (d) Mode 4; (e) Mode 5; (f) Mode 6.
Figure 7.
E. erimentally identified mode shapes corresponding to the first six elastic vibration modes of the glass–POE–glass laminate: (a) Mode 1; (b) Mode 2; (c) Mode 3; (d) Mode 4; (e) Mode 5; (f) Mode 6.
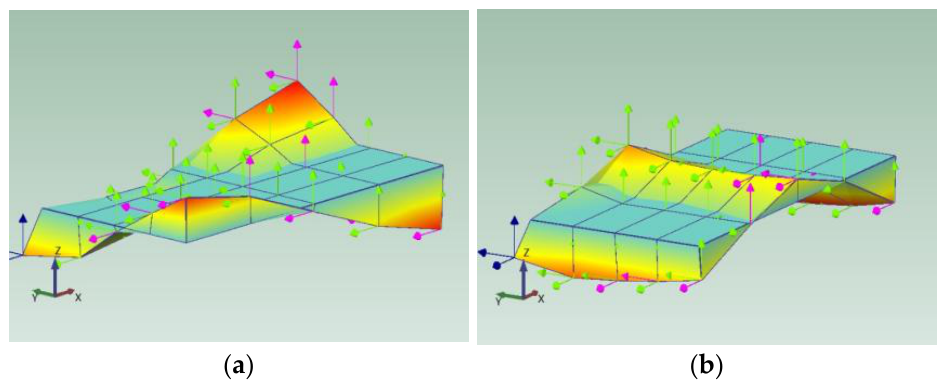
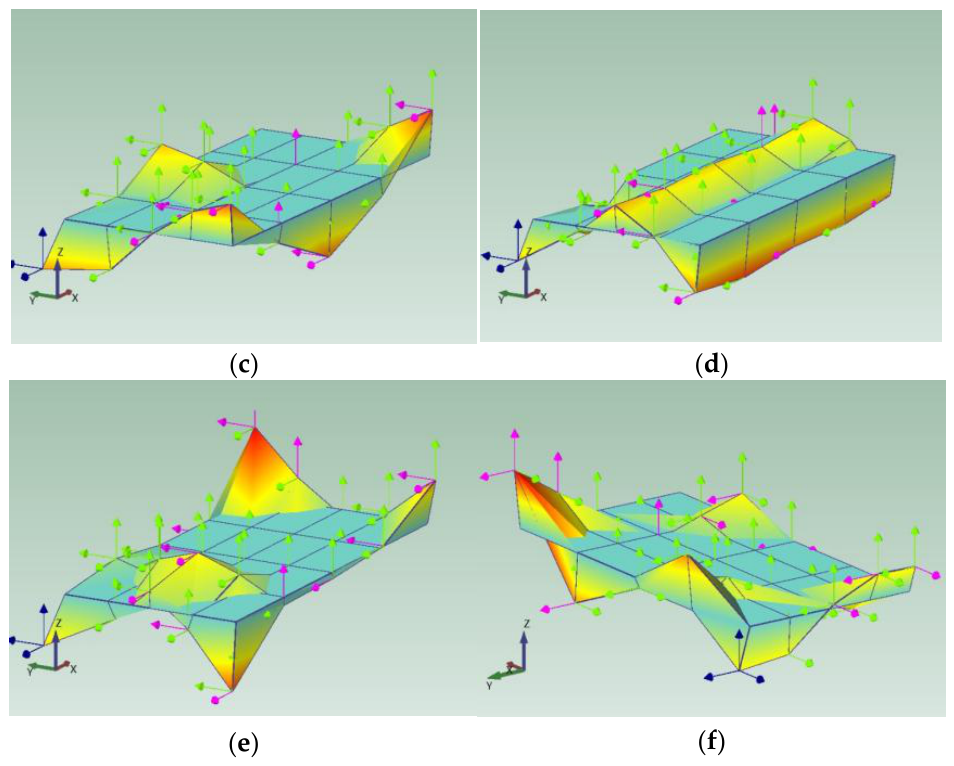
Figure 9.
FE-predicted mode shapes for the GC = 68% reference laminate corresponding to the experimentally identified modes shown in Figure 7: (a) Mode 1; (b) Mode 2; (c) Mode 3; (d) Mode 4; (e) Mode 5; (f) Mode 6.
Figure 9.
FE-predicted mode shapes for the GC = 68% reference laminate corresponding to the experimentally identified modes shown in Figure 7: (a) Mode 1; (b) Mode 2; (c) Mode 3; (d) Mode 4; (e) Mode 5; (f) Mode 6.
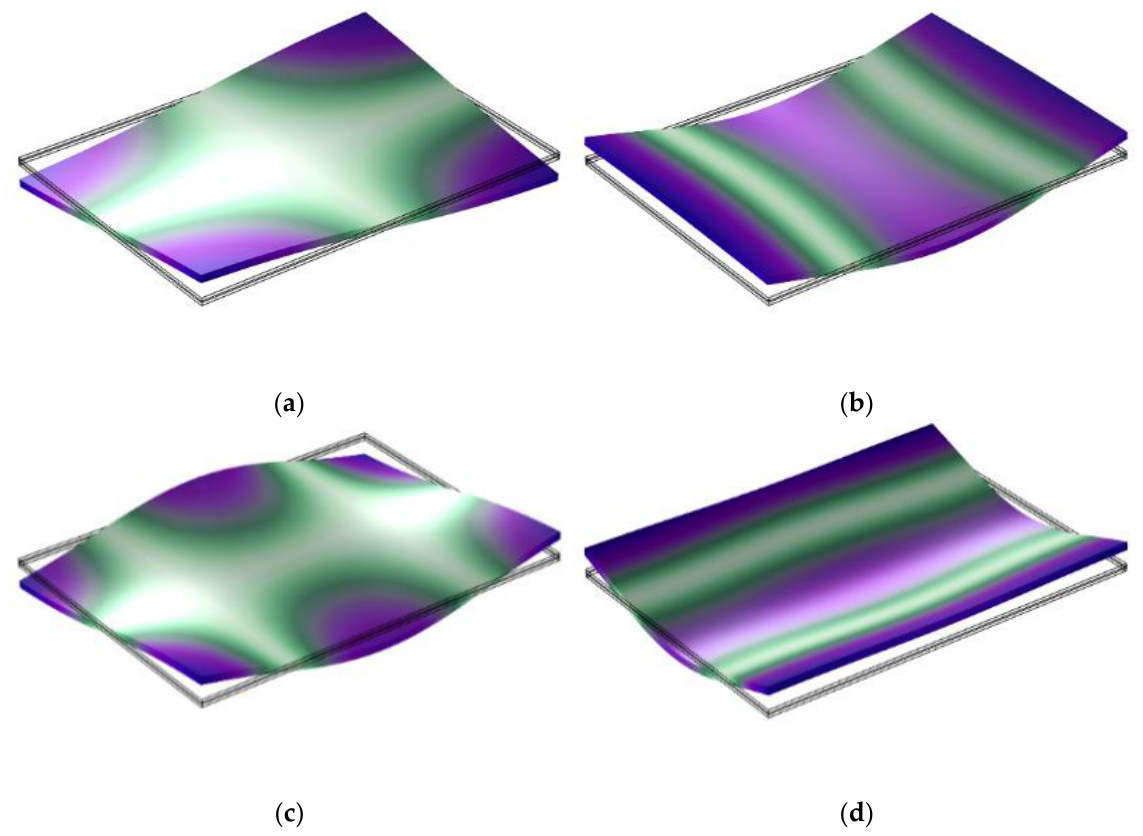
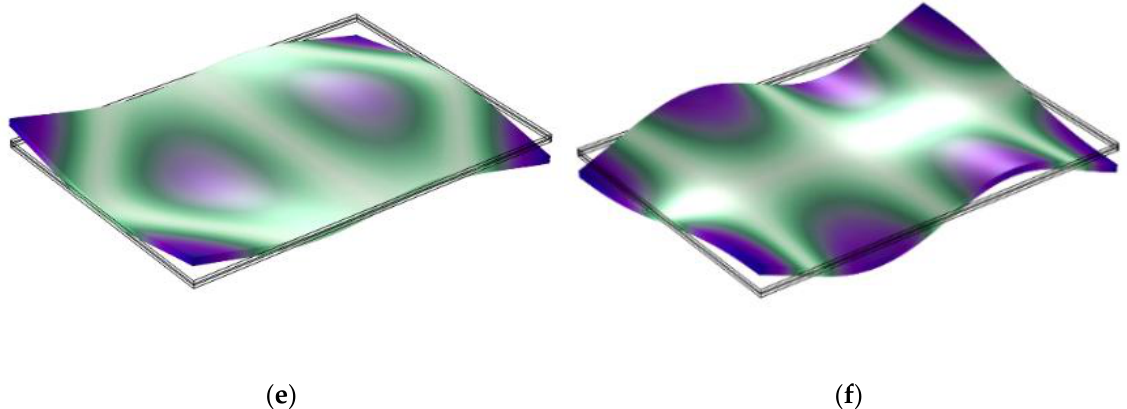
Table 1.
Nominal geometrical and material properties of the glass–POE–glass laminate used in the structural models.
Table 1.
Nominal geometrical and material properties of the glass–POE–glass laminate used in the structural models.
| Layer | Thickness, mm | Density, kg/m3 | Young’s modulus, MPa | Poisson’s ratio |
|---|---|---|---|---|
| Glass layer 1 | 3.6 | 2500 | 70,000 | 0.23 |
| POE interlayer | 0.8 | 857 | 11 1 | 0.45 |
| Glass layer 2 | 3.6 | 2500 | 70,000 | 0.23 |
1 The POE Young’s modulus listed in Table 1 represents the effective value adopted in the numerical model of the GC = 68% reference specimen and should not be interpreted as an experimentally measured modulus applicable to all investigated gel-content levels.
Table 2.
Geometrical and material parameters adopted in the analytical model.
| Parameter | Symbol | Value |
|---|---|---|
| Specimen length | a | 0.415 m |
| Specimen width | b | 0.298 m |
| Aspect ratio | a/b | 1.393 |
| Total laminate thickness | h | 8.0 mm |
| Total glass thickness | hg,total | 7.2 mm |
| Individual glass thickness | hg | 3.6 mm |
| POE interlayer thickness | hPOE | 0.8 mm |
| Glass Young’s modulus | Eg | 70 GPa |
| Glass Poisson’s ratio | νg | 0.23 |
| Glass density | ρg | 2500 kg/m3 |
| POE Young’s modulus | EPOE | 3–12 MPa |
| POE Poisson’s ratio | νPOE | 0.45 |
| POE density | ρPOE | 857 kg/m3 |
Table 3.
Modal parameters identified using FDD and EFDD for the GC = 68% reference specimen.
| Mode | FDD Frequency, Hz | FDD Complexity, % | EFDD Frequency, Hz | EFDD Damping Ratio, % | EFDD Complexity, % |
|---|---|---|---|---|---|
| 1 | 148 | 0.455 | 146.584 | 3.051 | 0.426 |
| 2 | 176 | 0.327 | 177.441 | 2.722 | 0.337 |
| 3 | 284 | 1.061 | 286.282 | 2.558 | 1.238 |
| 4 | 312 | 4.040 | 310.830 | 1.924 | 4.614 |
| 5 | 376 | 6.633 | 375.802 | 1.744 | 3.983 |
| 6 | 472 | 3.709 | 474.049 | 2.130 | 3.975 |
Table 4.
Experimentally identified FDD natural frequencies for the investigated POE gel-content levels.
Table 4.
Experimentally identified FDD natural frequencies for the investigated POE gel-content levels.
| Mode | GC 25% | GC 35% | GC 49% | GC 68% | GC 75% |
|---|---|---|---|---|---|
| 1 | 149 | 149 | 147 | 148 | 148 |
| 2 | 183 | 183 | 178 | 176 | 179 |
| 3 | 293 | 291 | 286 | 284 | 288 |
| 4 | 325 | 325 | 317 | 312 | 317 |
| 5 | 393 | 388 | 380 | 376 | 383 |
| 6 | 485 | 482 | 470 | 472 | 479 |
Table 8.
Descriptive statistical parameters characterizing the relationship between POE gel content and experimentally identified natural frequency.
Table 8.
Descriptive statistical parameters characterizing the relationship between POE gel content and experimentally identified natural frequency.
| Mode | Pearson’s r | R2 | RMSE, Hz | MAE, Hz | |
|---|---|---|---|---|---|
| 1 | −0.555 | 0.654 | 0.440 | 0.386 | |
| 2 | −0.812 | 0.788 | 1.284 | 1.197 | |
| 3 | −0.778 | 0.871 | 1.170 | 1.033 | |
| 4 | −0.861 | 0.812 | 2.201 | 2.014 | |
| 5 | −0.795 | 0.906 | 1.832 | 1.612 | |
| 6 | −0.567 | 0.842 | 2.288 | 2.115 |
Disclaimer/Publisher’s Note: The statements, opinions and data contained in all publications are solely those of the individual author(s) and contributor(s) and not of MDPI and/or the editor(s). MDPI and/or the editor(s) disclaim responsibility for any injury to people or property resulting from any ideas, methods, instructions or products referred to in the content. |
© 2026 by the authors. Licensee MDPI, Basel, Switzerland. This article is an open access article distributed under the terms and conditions of the Creative Commons Attribution (CC BY) license.
Copyright: This open access article is published under a Creative Commons CC BY 4.0 license, which permit the free download, distribution, and reuse, provided that the author and preprint are cited in any reuse.