

Submitted:
07 September 2026
Posted:
07 September 2026
You are already at the latest version
Abstract
This study examined associations between nutritional intake and subjective memory function in a nationally representative sample of Korean adults using the 2023 Korea National Health and Nutrition Examination Survey (KNHANES). A total of 5,591 eligible participants aged ≥ 19 years were included. Subjective memory function was assessed using the Health-Related Quality of Life Instrument with 8 Items (HINT-8) and then categorized into no, mild or severe difficulty. Nutritional intake was assessed using a 24-hour dietary recall interview.The participants with memory difficulties were more likely not only to be older, female, less educated and of lower socioeconomic status but also to exhibit comorbidities, such as hypertension and diabetes mellitus. Lower intakes of protein, fat, saturated fatty acids and cholesterol had a consistent association with a greater severity of memory complaints. Certain micronutrients, including riboflavin, niacin, retinol and magnesium, were decreased in the participants with memory difficulties, while vitamin E had an inverse correlation with subjective memory complaints in multivariate models. In conclusion, the current results suggest that suboptimal dietary intake may contribute to SMC in Korean adults, thus highlighting the importance of the potential role of balanced macronutrient and micronutrient consumption in maintaining cognitive health, particularly in populations at higher risk of memory decline.
Keywords:
nutrition surveys
; memory disorders
; dietary intake
; dietary proteins
; dietary fats
; vitamins
1. Introduction
Nutrition is an essential aspect of human daily lives, thus affecting their health, vitality and overall physical and mental well-being. It encompasses the consumption of food and beverages containing essential nutrients that are required for the optimal function of human body [1]. Moreover, good nutrition improves health-related quality of life (HRQoL), encompassing life satisfaction, by both averting malnutrition and preventing dietary deficiency disease [2].
Cognitive function is referred to as the mental processes, such as learning, thinking, reasoning, remembering and problem-solving. It entails diverse types of abilities, such as perception (an ability to interpret sensory information), attention (that to focus on specific stimuli and filter out distractions), memory (that to encode, store and retrieve information), language (that to understand and produce spoken and written language) and executive functions (higher-level cognitive skills that control and regulate other cognitive processes, including planning, problem-solving, decision-making and working memory) [3,4,5,6].
Nutrition has a significant effect on cognitive function throughout life. Ingestion of a balanced diet that is abundant in essential nutrients would therefore promote the development and maintenance of brain function and optimize the cognitive function. By contrast, poor nutrition can have a detrimental effect on cognitive function and thereby raise a risk of cognitive decline [7].
Previous literatures have shown that specific nutrients and ingredients have beneficial and detrimental effects on cognition and behavior [8,9,10,11]. Further, Kim JY and Kang SW explored the relationship between dietary intake and cognitive function in healthy Korean children and adolescents, thus showing that ingestion of healthy foods has a significant correlation with good cognitive function [12]. Along the continuum of the above published studies, this cross-sectional study was conducted to examine the relationship between nutritional intake and the degree of cognitive function in Korean adults.
2. Methods
2.1. Study Design
The current study performed an analysis of the second year (2023) of the 9th Korea National Health and Nutrition Examination Survey (KNHANES IX) (2022-2023) data [13]. The Korea National Health and Nutrition Examination Survey (KNHANES) began in 1998 and is a representative survey of Koreans that investigates health status, health behaviors and nutritional intake for statistical purposes. It consists of health interview, health examination and nutritional survey focusing on age-specific public health concerns. It uses a stratified, multistage, clustered probability sampling method to ensure representativeness of the civilian, non-institutionalized Korean population. The survey cycle is planned for 3-year units and the survey is conducted annually to produce timely statistics [14]. The 10th cycle, 1st year survey (2025) is currently underway. Data collected through the KNHANES are used as evidence for health policy and are publicly available to researchers. More information about KNHANES can be found elsewhere [15,16].
A total of 6,929 individuals (n = 6,929) participated in the KNHANES 2023 [17].
Inclusion criteria for the current study are as follows:
- (1)
- The participants aged ≥ 19 years old
- (2)
- The participants with available data about the dietary intake survey
- (3)
- The participants who responded to subjective memory status questions.
Exclusion criteria for the current study are as follows:
- (1)
- The participants aged < 19 years old
- (2)
- The participants with implausible total daily energy intake (< 500 kcal/day or > 5,000 kcal/day
- (3)
- The participants with a diagnosis of dementia or neurological disorders reported from the health survey
- (4)
- The participants with no available data about the dietary intake
- (5)
- The participants with missing data about key variables, such as memory status, nutritional intake or confounders.
The current study was conducted in accordance with the Declaration of Helsinki and the requirement for ethical approval was exempted by the Institutional Review Board of Ajou University Medical Center because the KNHANES database is publicly available.
2.2. Criteria for Data Analysis
The Health-related Quality of Life Instrument with 8 Items (HINT-8) is a questionnaire that is used to assess the HRQoL in a Korean population. It consists of four domains, such as physical, social, mental and positive health, and eight items, each rated on a 4-level scale, with higher scores indicating lower quality of life [18]. Of these, mental health domain consists of depression, memory and sleep [19]. Memory status served as a dependent variable. Then, subjective memory status, serving as a primary outcome, was assessed using a self-reported, memory-related questionnaire: “Do you experience difficulties with memory?” Then, the participants’ responses were categorized into ‘No memory difficulty’, ‘Mild memory difficulty’ and ‘Severe memory difficulty’ [18,19]. If necessary, the outcome was dichotomized into ‘No memory complaint’ and ‘Any memory complaint’.
Nutritional intake served as an independent variable, for which data was obtained through 24-hour dietary recall interview administered by trained dietitians. Primary independent variables include (1) energy, water and macronutrients, (2) fatty acids and cholesterol, (3) vitamins and (4) minerals.
To reduce confounding by total energy intake, nutrient intake was normalized per 1,000 kcal or adjusted for total energy using the residual method where appropriate.
Potential confounding variables, serving as covariates, include demographic variables, such as age, sex, levels of education and monthly household income, lifestyle factors, such as smoking status, alcohol consumption (yes/no) and physical activity (moderate or vigorous intensity), and clinical factors, such as body mass index (BMI) (kg/m²), hypertension (HTN) (yes/no), diabetes mellitus (DM) (yes/no), perceived stress and sleep quality.
2.3. Statistical Analysis
All analyses used the KNHANES sampling weights to account for its complex survey design. Moreover, descriptive statistics were generated as weighted means with standard errors (SE) for continuous variables and weighted proportions for categorical variables [13]. Statistical procedures were performed using R (survey package) or STATA (svy commands). Baseline characteristics were presented using weighted means ± standard error (SE) for continuous variables and weighted proportions for categorical variables. Comparisons between memory status groups were assessed using analysis of variance (ANOVA) or Kruskal-Wallis test for continuous variables and χ2-test for categorical variables. To identify the correlation between nutritional components and memory status, both univariate and multivariate regression models were used. Thus, the current study performed a binary logistic regression (when memory complaints were dichotomized), an ordinal logistic regression (when memory status was categorized into three levels) and a multiple linear regression (when a continuous memory score variable was available). Models were adjusted for age, sex, levels of education, income, lifestyle and clinical variables. Multi-collinearity among nutrients was assessed using Variance Inflation Factor (VIF). Statistical analysis was performed using the IBM SPSS Statistics ver. 29.0 (IBM Co., Armonk, NY, USA). A p-value of < 0.05 was considered statistically significant.
3. Results
3.1. Baseline Characteristics of the participants
A total of 5,591 adults aged ≥ 19 years were finally assessed, comprising 2,473 men (n = 2,473) and 3,198 women (n = 3,198), who were divided into three groups according to the self-reported memory status: the Group 1 (no memory difficulty, n = 2,557), the Group 2 (mild memory difficulty, n = 2,780) and the Group 3 (severe memory difficulty, n = 254) (Figure 1).
Baseline characteristics of the participants are represented in Table 1. The participants of the Group 3 were significantly older (mean age 48.9 ± 0.32 years in Group 1 versus 60.7 ± 1.23 years old in Group 3, p < 0.001). There was also a significant difference in the sex distribution, with women being more prevalent in the Group 3 (66.5%) as compared with the Group 1 (52.4%) (Table 1).
Levels of education had an inversely correlation with memory complaints. In more detail, 37.4% of the participants of the Group 3 were elementary school graduates, while 24.0% of them were ≥ college graduates, as compared with 48.2% of those of the Group 1. Furthermore, 58.3% of the participants of the Group 3 had a monthly household income of < USD 2,153, as compared with 26.4% those of the Group 1 (Table 1).
The prevalence of underlying conditions, such as HTN and DM, was significantly higher in the Group 3 as compared with the Group 1 (37.4% versus 22.0% and 21.3% versus 9.2%, respectively; p < 0.001). But there were no significant differences in the BMI and waist circumference between the three groups (p = 0.217 and 0.245, respectively) (Table 1).
The proportion of current smokers and that of binge drinking were significantly lower in the Group 3 as compared with the Group 1 (12.6% versus 17.2%, respectively, and 39.8% versus 55.2%, respectively; p = 0.007 and p < 0.001, respectively). But poor sleep quality was significantly more frequent in the Group 3 as compared with the Group 1 (32.3% versus 12.9%; p < 0.001). Moreover, perceived stress was more prevalent in the Group 3 as compared with the Group 1 (2.98 ± 0.01 versus. 2.62 ± 0.05, respectively; p < 0.001) (Table 1).
Serum 25-hydroxyvitamin D3 levels were significantly higher in the Group 3 as compared with the Group 1 (25.8 ± 0.81 ng/mL versus 23.5 ± 0.22 ng/mL; p < 0.001). Other laboratory measurements, such as fasting blood sugar, HbA1c, triglycerides and systolic blood pressure, showed small differences between the three groups. But these differences reached no statistical significance (Table 1).
3.2. Differences in the Memory Functions Depending on the Dietary Intake Between the Three Groups
In the univariate analysis, the participants of the Group 3 had significantly lower total energy, protein intake and fat intake as compared with those of the Group 1 (1,653.5 ± 43.9 kcal versus 1,811.5 ± 14.6 kcal, 59.9 ± 2.0 g versus 69.3 ± 0.7 g and 38.6 ± 1.9 g versus 49.6 ± 0.6 g, respectively; all p < 0.001). This was also confirmed in the multivariate analysis (p = 0.008, 0.044 and 0.003 in the corresponding order) (Table 2).
In both univariate and multivariate analyses, there were significant differences in SFA, MUFA, PUFA, n-3 FA, n-6 FA and cholesterol depending on the memory functions (p < 0.05) (Table 2).
In both univariate and multivariate analyses, there were no significant differences in vitamins depending on the memory functions (p > 0.05) (Table 2).
In both univariate and multivariate analyses, there were no significant differences in minerals depending on the memory functions (p > 0.05) (Table 2).
4. Discussion
Cognitive function serves as a key indicator of quality of life (QoL), and it has a dynamic path during life. That is, it undergoes evolution throughout life, thus termed as cognitive evolution, which is characterized by rapid and steep improvements in neurodevelopment during childhood, stabilization and maintenance of it during adulthood, a steady decline in it because of neural atrophy and degeneration during aging process [20,21,22]. Diverse factors are involved in such cognitive evolution throughout life; these include genetics, lifestyle (e.g., exercise and nutrition) and environment (e.g., stress, socioeconomic factors and levels of education), many of which are modifiable [23,24,25].
Deficits in cognitive dimensions may have a detrimental effect on an individual’s QoL. That is, impaired verbal abilities may lead to communication difficulties that may interfere with an individual’s ability to maintain desirable social roles; attention deficits may result in physical impairments, self-reported disability and poor activities of daily living; deficits in attention, memory and executive function may be associated with mechanisms underlying chronic pain; and awareness of cognitive dysfunction may cause depression [26,27,28,29,30]. From this context, it is mandatory to assess HRQoL in the context of cognitive function using patient-reported outcomes.
There is a growing interest in the significant effects of nutrition on cognitive function. Nutritional intake forms a source of energy and building blocks as well as key bioactive properties, which may affect the brain via some biological pathways and mechanisms [31,32].
The current study examined the association between nutritional intake and subjective memory function in a nationally representative sample of Korean adults using 2023 KNHANES data. Its results are as follows: First, the participants with memory difficulties were more likely not only to be older, female, less educated and of lower socioeconomic status but also to exhibit comorbidities, such as HTN and DM. Second, the current study also showed that lower intakes of protein, fat, SFAs and cholesterol had a consistent association with a greater severity of memory complaints. Third, certain micronutrients, including riboflavin, niacin, retinol and magnesium, were decreased in the participants with memory difficulties, while vitamin E had an inverse correlation with subjective memory complaints (SMC) in multivariate models.
As shown in the current study, older age, female sex, lower levels of education and lower monthly household income had a significant correlation with SMC. This is in agreement with previous published studies [33,34]. Chronic conditions such as HTN and DM are well-established risk factors of cognitive impairment because of their contribution to vascular and metabolic pathways involved in brain health [35,36]. Furthermore, poor sleep quality seen in the participants with SMC, indicating that sleep disturbances and mood disorders worsen the perceived memory problems, was also shown in previous literatures [37,38].
Lower intake of protein and fat in the participants with memory difficulties could be advocated by both clinical and epidemiological studies [39,40]. Essential amino acids, serving as precursors of protein, are required for the synthesis of neurotransmitters and synaptic functions. Insufficient intake of protein has a significant relationship with cognitive impairment, particularly in older adults [39]. Likewise, dietary fats, particularly including SFA and MUFA, are essential for maintaining the integrity of neuronal membrane and myelin structure. According to a previous study, insufficient intake of them may compromise neuronal signaling and memory function [40].
Cholesterol is mainly involved in the synaptic plasticity and neuronal repair [41]. The current study showed that lower intake of dietary cholesterol had a significant correlation with greater SMC, which is in agreement with a prior report suggesting that excessively low cholesterol might be associated with cognitive impairment [42].
Riboflavin and niacin are coenzymes that are involved in the energy metabolism and redox reactions, both of which are important for neuronal health. Insufficient intake of them has a relationship with cognitive decline and depressive symptoms [43,44]. Likewise, retinol is involved in the synaptic plasticity via retinoid signaling pathways [45,46]. In addition, animal studies have shown that vitamin A deficiency causes impairments in learning and memory [47]. Taken together, the current results indicate that it would be mandatory to ingest an adequate amount of vitamins, which is essential for preserving memory function.
Magnesium serves as an essential cofactor in enzymatic reactions and a regulator of N-methyl-D-aspartate (NMDA) receptor activity; its involvement in the synaptic plasticity and memory function has been well described in the literature [48,49]. We found that lower intake of magnesium was seen in the participants with SMC, which supports the experimental results showing that magnesium supplementation improves the cognitive function [48].
Of note, there was a positive correlation between vitamin E intake and SMC in the multivariate analysis. It is known that vitamin E is an antioxidant that might protect against neurodegeneration. Still, however, controversial opinions exist regarding its biological roles. In more detail, vitamin E supplementation beyond physiological levels may not confer cognitive benefit and could even be associated with adverse outcomes [50,51]. It can therefore be inferred that individuals with memory concerns might increase their vitamin E intake through diet or supplements or they might present with complex interactions between antioxidant status and neurocognitive health, which is advocated by previous literatures [52,53].
The current results cannot be generalized. Limitations of the current study are as follows: First, the current study failed to consider the effects of dietary habits on the cognitive function. There is a strong relationship between dietary habits and neuropsychological functions. It has been suggested that healthy cardiometabolic status serves as a protective factor against vascular dementia and neurological disease [54,55]. Second, the current study failed to consider the effects of dietary pattern on the cognitive function. Dietary pattern, entailing the overall combination of foods and beverages, can have a significant effect on the cognitive function. Healthy dietary pattern is characterized by greater intake of fruits, vegetables, whole grains and fish and smaller intake of red meat and sweets, and it is associated with better cognitive performance and a lower risk of cognitive decline. Conversely, intake of diets rish in processed foods, saturated fats and added sugars may have a detrimental effect on the cognitive health [56,57]. Third, it is impossible to rule out the possibility that if individuals with cognitive dysfunction are unaware of functional impairment, they would rate their HRQoL as being not deteriorated [26]. Fourth, the current study failed to consider the effects of nutrition risk on the cognitive function. By definition, nutrition risk is referred to as determinants or risk factors, such as eating alone or poor appetite, that may affect food intake [58]. Fifth, the current study failed to consider the effects of indicators of subclinical malnutrition, such as changes in body weight, on the cognitive function [59,60].
5. Conclusions
In conclusion, the current results suggest that suboptimal dietary intake may contribute to SMC in Korean adults, thus highlighting the importance of the potential role of balanced macronutrient and micronutrient consumption in maintaining cognitive health, particularly in populations at higher risk of memory decline. But this warrants further longitudinal and interventional studies.
Author Contributions
Conceptualization, M-.G.J.; methodology, M-.G.J.; formal analysis, M-.G.J.; investigations, M-.G.J.; data curation, M-.G.J.; writing—original draft preparation, M-.G.J.; writing—review and editing, M-.G.J. and B.J.L.; supervision, M-.G.J. All authors have read and agreed to the published version of the manuscript.
Funding
The authors received no external funding for the current study.
Institutional Review Board Statement
This study was conducted in accordance with the Declaration of Helsinki and the requirement for ethical approval was exempted by the Institutional Review Board of Taegu Science University because the KNHANES database is publicly available.
Informed Consent Statement
Not applicable.
Data Availability Statement
The raw data from the 2022 and 2023 KNHANES presented in this study are available at https://knhanes.kdca.go.kr/knhanes/main.do. (Accessed 28 February 2025).
Acknowledgments
The authors thank Laon Medi Solution Inc. (Seoul, Republic of Korea) and KDH Medical Inc. (Gwangmyeong, Gyeonggi, Republic of Korea) for providing additional support of this research.
Conflicts of Interest
The authors declare no conflicts of interest.
References
- Chen Y; Michalak M; Agellon LB. Importance of nutrients and nutrient metabolism on human health. Yale J. Biol. Med. 2018, 91, 95–103.
- Amarantos E; Martinez A; Dwyer J. Nutrition and quality of life in older adults. J. Gerontol. A Biol. Sci. Med. Sci. 2001, 56, 54–64. [CrossRef]
- Cowan N. Working memory underpins cognitive development, learning, and education. Educ. Psychol. Rev. 2014, 26, 197–223. [CrossRef]
- Oberauer K. Working memory and attention: A conceptual analysis and review. J. Cogn. 2019, 2, 36. [CrossRef]
- Tyng CM; Amin HU; Saad MNM; Malik AS. The influences of emotion on learning and memory. Front. Psychol. 2017, 8, 1454. [CrossRef]
- Robinson OJ; Vytal K; Cornwell BR; Grillon C. The impact of anxiety upon cognition: Perspectives from human threat of shock studies. Front. Hum. Neurosci. 2013, 7, 203. [CrossRef]
- Puri S; Shaheen M; Grover B. Nutrition and cognitive health: A life course approach. Front. Public Health 2023, 11, 1023907. [CrossRef]
- Bryan J; Osendarp S; Hughes D; Calvaresi E; Baghurst K; van Klinken JW. Nutrients for cognitive development in school-aged children. Nutr. Rev. 2004, 62, 295–306. [CrossRef]
- Stahl LA; Begg DP; Weisinger RS; Sinclair AJ. The role of omega-3 fatty acids in mood disorders. Curr. Opin. Investig. Drugs 2008, 9, 57–64.
- Itua I; Naderali EK. Omega-3 and memory function: To eat or not to eat. Am. J. Alzheimers Dis. Other Demen. 2010, 25, 479–482. [CrossRef]
- Spencer JP. The impact of fruit flavonoids on memory and cognition. Br. J. Nutr. 2010, 104, S40–S47. [CrossRef]
- Kim JY; Kang SW. Relationships between dietary intake and cognitive function in healthy Korean children and adolescents. J. Lifestyle Med. 2017, 7, 10–17. [CrossRef]
- Lee HA; Kim HR; Park H; Jung SY; Jeon JP; Park B; Jung KJ; Jee SH; Shim SM; Park H. Data resource profile: The Statistics of the Korea National Health and Nutrition Examination Survey (KNHANES) Biobank Project. J. Korean Med. Sci. 2025, 40, e189. [CrossRef]
- Oh K; Kim Y; Kweon S; Kim S; Yun S; Park S; Lee YK; Kim Y; Park O; Jeong EK. Korea National Health and Nutrition Examination Survey, 20th anniversary: Accomplishments and future directions. Epidemiol. Health 2021, 43, e2021025. [CrossRef]
- Kweon S; Kim Y; Jang MJ; Kim Y; Kim K; Choi S; Chun C; Khang YH; Oh K. Data resource profile: The Korea National Health and Nutrition Examination Survey (KNHANES). Int. J. Epidemiol. 2014, 43, 69–77. [CrossRef]
- Yun S; Oh K. The Korea National Health and Nutrition Examination Survey data linked Cause of Death data. Epidemiol. Health 2022, 44, e2022021. [CrossRef]
- Park M; Do TH; Park J. Multifactorial determinants of body composition in the Korean older adults: Using data from the 2022–2023 National Health and Nutrition Examination Survey. Nutrients 2025, 17, 1477. [CrossRef]
- Choi E; Seo HJ; Choo IH; Kim SM; Park JM; Choi YM. Health-related quality of life instrument with 8 items to measure health-related quality of life among family caregivers of people with dementia: A pilot validation study. Public Health Nurs. 2024, 41, 1210–1219. [CrossRef]
- Song GY. Health-related quality of life in older Koreans: A HINT-8-based cross-sectional analysis of obesity, sarcopenia, and sarcopenic obesity using the 2023 Korea National Health and Nutrition Examination Survey. Korean J. Fam. Med. 2025, 46, 195–203. [CrossRef]
- Gilmore JH; Knickmeyer RC; Gao W. Imaging structural and functional brain development in early childhood. Nat. Rev. Neurosci. 2018, 19, 123–137. [CrossRef]
- Peters R. Ageing and the brain. Postgrad. Med. J. 2006, 82, 84–88. [CrossRef]
- Craik FI; Bialystok E. Cognition through the lifespan: Mechanisms of change. Trends Cogn. Sci. 2006, 10, 131–138. [CrossRef]
- Mollon J; Knowles EEM; Mathias SR; Gur R; Peralta JM; Weiner DJ; Robinson EB; Gur RE; Blangero J; Almasy L; Glahn DC. Genetic influence on cognitive development between childhood and adulthood. Mol. Psychiatry 2021, 26, 656–665. [CrossRef]
- Dominguez LJ; Veronese N; Vernuccio L; Catanese G; Inzerillo F; Salemi G; Barbagallo M. Nutrition, physical activity, and other lifestyle factors in the prevention of cognitive decline and dementia. Nutrients 2021, 13, 4080. [CrossRef]
- Jefferson AL; Gibbons LE; Rentz DM; Carvalho JO; Manly J; Bennett DA; Jones RN. A life course model of cognitive activities, socioeconomic status, education, reading ability, and cognition. J. Am. Geriatr. Soc. 2011, 59, 1403–1411. [CrossRef]
- Pan CW; Wang X; Ma Q; Sun HP; Xu Y; Wang P. Cognitive dysfunction and health-related quality of life among older Chinese. Sci. Rep. 2015, 5, 17301. [CrossRef]
- Ble A; Volpato S; Zuliani G; Guralnik JM; Bandinelli S; Lauretani F; Bartali B; Maraldi C; Fellin R; Ferrucci L. Executive function correlates with walking speed in older persons: The InCHIANTI study. J. Am. Geriatr. Soc. 2005, 53, 410–415. [CrossRef]
- Bronnick K; Ehrt U; Emre M; De Deyn PP; Wesnes K; Tekin S; Aarsland D. Attentional deficits affect activities of daily living in dementia associated with Parkinson’s disease. J. Neurol. Neurosurg. Psychiatry 2006, 77, 1136–1142. [CrossRef]
- Attal N; Masselin-Dubois A; Martinez V; Jayr C; Albi A; Fermanian J; Bouhassira D; Baudic S. Does cognitive functioning predict chronic pain? Results from a prospective surgical cohort. Brain 2014, 137, 904–917. [CrossRef]
- Jorm AF. History of depression as a risk factor for dementia: An updated review. Aust. N. Z. J. Psychiatry 2001, 35, 776–781. [CrossRef]
- Murphy T; Dias GP; Thuret S. Effects of diet on brain plasticity in animal and human studies: Mind the gap. Neural Plast. 2014, 2014, 563160. [CrossRef]
- Mattson MP; Longo VD; Harvie M. Impact of intermittent fasting on health and disease processes. Ageing Res. Rev. 2017, 39, 46–58. [CrossRef]
- Jessen F; Amariglio RE; van Boxtel M; Breteler M; Ceccaldi M; Chételat G; Dubois B; Dufouil C; Ellis KA; van der Flier WM; et al. A conceptual framework for research on subjective cognitive decline in preclinical Alzheimer’s disease. Alzheimers Dement. 2014, 10, 844–852. [CrossRef]
- Mitchell AJ; Beaumont H; Ferguson D; Yadegarfar M; Stubbs B. Risk of dementia and mild cognitive impairment in older people with subjective memory complaints: Meta-analysis. Acta Psychiatr. Scand. 2014, 130, 439–451. [CrossRef]
- Iadecola C. Hypertension and dementia. Hypertension 2014, 64, 3–5. [CrossRef]
- Biessels GJ; Despa F. Cognitive decline and dementia in diabetes mellitus: Mechanisms and clinical implications. Nat. Rev. Endocrinol. 2018, 14, 591–604. [CrossRef]
- Wennberg AMV; Wu MN; Rosenberg PB; Spira AP. Sleep disturbance, cognitive decline, and dementia: A review. Semin. Neurol. 2017, 37, 395–406. [CrossRef]
- Yates JA; Clare L; Woods RT; MRC CFAS. Subjective memory complaints, mood and MCI: A follow-up study. Aging Ment. Health 2017, 21, 313–321. [CrossRef]
- Kinoshita K; Otsuka R; Takada M; Tsukamoto-Yasui M; Nishita Y; Tange C; Tomida M; Shimokata H; Kuzuya M; Imaizumi A; Arai H. The association between dietary amino acid intake and cognitive decline 8 years later in Japanese community-dwelling older adults. J. Nutr. Health Aging 2021, 25, 165–171. [CrossRef]
- Uauy R; Dangour AD. Nutrition in brain development and aging: Role of essential fatty acids. Nutr. Rev. 2006, 64, S24–S33. [CrossRef]
- Shin KC; Ali Moussa HY; Park Y. Cholesterol imbalance and neurotransmission defects in neurodegeneration. Exp. Mol. Med. 2024, 56, 1685–1690. [CrossRef]
- Schreurs BG. The effects of cholesterol on learning and memory. Neurosci. Biobehav. Rev. 2010, 34, 1366–1379. [CrossRef]
- Kennedy DO. B vitamins and the brain: Mechanisms, dose and efficacy—A review. Nutrients 2016, 8, 68. [CrossRef]
- Duthie SJ; Whalley LJ; Collins AR; Leaper S; Berger K; Deary IJ. Homocysteine, B vitamin status, and cognitive function in the elderly. Am. J. Clin. Nutr. 2002, 75, 908–913. [CrossRef]
- Marie A; Darricau M; Touyarot K; Parr-Brownlie LC; Bosch-Bouju C. Role and mechanism of vitamin A metabolism in the pathophysiology of Parkinson's disease. J. Parkinsons Dis. 2021, 11, 949–970. [CrossRef]
- Das BC; Thapa P; Karki R; Das S; Mahapatra S; Liu TC; Torregroza I; Wallace DP; Kambhampati S; Van Veldhuizen P; Verma A; Ray SK; Evans T. Retinoic acid signaling pathways in development and diseases. Bioorg. Med. Chem. 2014, 22, 673–683. [CrossRef]
- Cocco S; Diaz G; Stancampiano R; Diana A; Carta M; Curreli R; Sarais L; Fadda F. Vitamin A deficiency produces spatial learning and memory impairment in rats. Neuroscience 2002, 115, 475–482. [CrossRef]
- Slutsky I; Abumaria N; Wu LJ; Huang C; Zhang L; Li B; Zhao X; Govindarajan A; Zhao MG; Zhuo M; Tonegawa S; Liu G. Enhancement of learning and memory by elevating brain magnesium. Neuron 2010, 65, 165–177. [CrossRef]
- Barbagallo M; Veronese N; Dominguez LJ. Magnesium in aging, health and diseases. Nutrients 2021, 13, 463. [CrossRef]
- Lloret A; Badía MC; Mora NJ; Pallardó FV; Alonso MD; Viña J. Vitamin E paradox in Alzheimer's disease: It does not prevent loss of cognition and may even be detrimental. J. Alzheimers Dis. 2009, 17, 143–149. [CrossRef]
- Miller ER; Pastor-Barriuso R; Dalal D; Riemersma RA; Appel LJ; Guallar E. Meta-analysis: High-dosage vitamin E supplementation may increase all-cause mortality. Ann. Intern. Med. 2005, 142, 37–46. [CrossRef]
- Nazzi C; Avenanti A; Battaglia S. The involvement of antioxidants in cognitive decline and neurodegeneration: Mens sana in corpore sano. Antioxidants 2024, 13, 701. [CrossRef]
- Cherubini A; Martin A; Andres-Lacueva C; Di Iorio A; Lamponi M; Mecocci P; Bartali B; Corsi A; Senin U; Ferrucci L. Vitamin E levels, cognitive impairment and dementia in older persons: The InCHIANTI study. Neurobiol. Aging 2005, 26, 987–994. [CrossRef]
- Axelsson E; Wallin A; Svensson J. Patients with the subcortical small vessel type of dementia have disturbed cardiometabolic risk profile. J. Alzheimers Dis. 2020, 73, 1373–1383. [CrossRef]
- Hu JR; Abdullah A; Nanna MG; Soufer R. The brain-heart axis: Neuroinflammatory interactions in cardiovascular disease. Curr. Cardiol. Rep. 2023, 25, 1745–1758. [CrossRef]
- Chen X; Liu Z; Sachdev PS; Kochan NA; O'Leary F; Brodaty H. Dietary patterns and cognitive health in older adults: Findings from the Sydney Memory and Ageing Study. J. Nutr. Health Aging 2021, 25, 255–262. [CrossRef]
- Marchand NE; Jensen MK. The role of dietary and lifestyle factors in maintaining cognitive health. Am. J. Lifestyle Med. 2017, 12, 268–285. [CrossRef]
- Keller HH. Promoting food intake in older adults living in the community: A review. Appl. Physiol. Nutr. Metab. 2007, 32, 991–1000. [CrossRef]
- Keller HH; Østbye T. Nutritional risk and time to death: Predictive validity of SCREEN (Seniors in the Community Risk Evaluation for Eating and Nutrition). J. Nutr. Health Aging 2003, 7, 274–279.
- Ramage-Morin PL; Gilmour H; Rotermann M. Nutritional risk, hospitalization and mortality among community-dwelling Canadians aged 65 or older. Health Rep. 2017, 28, 17–27.
Figure 1.
Study flow chart.
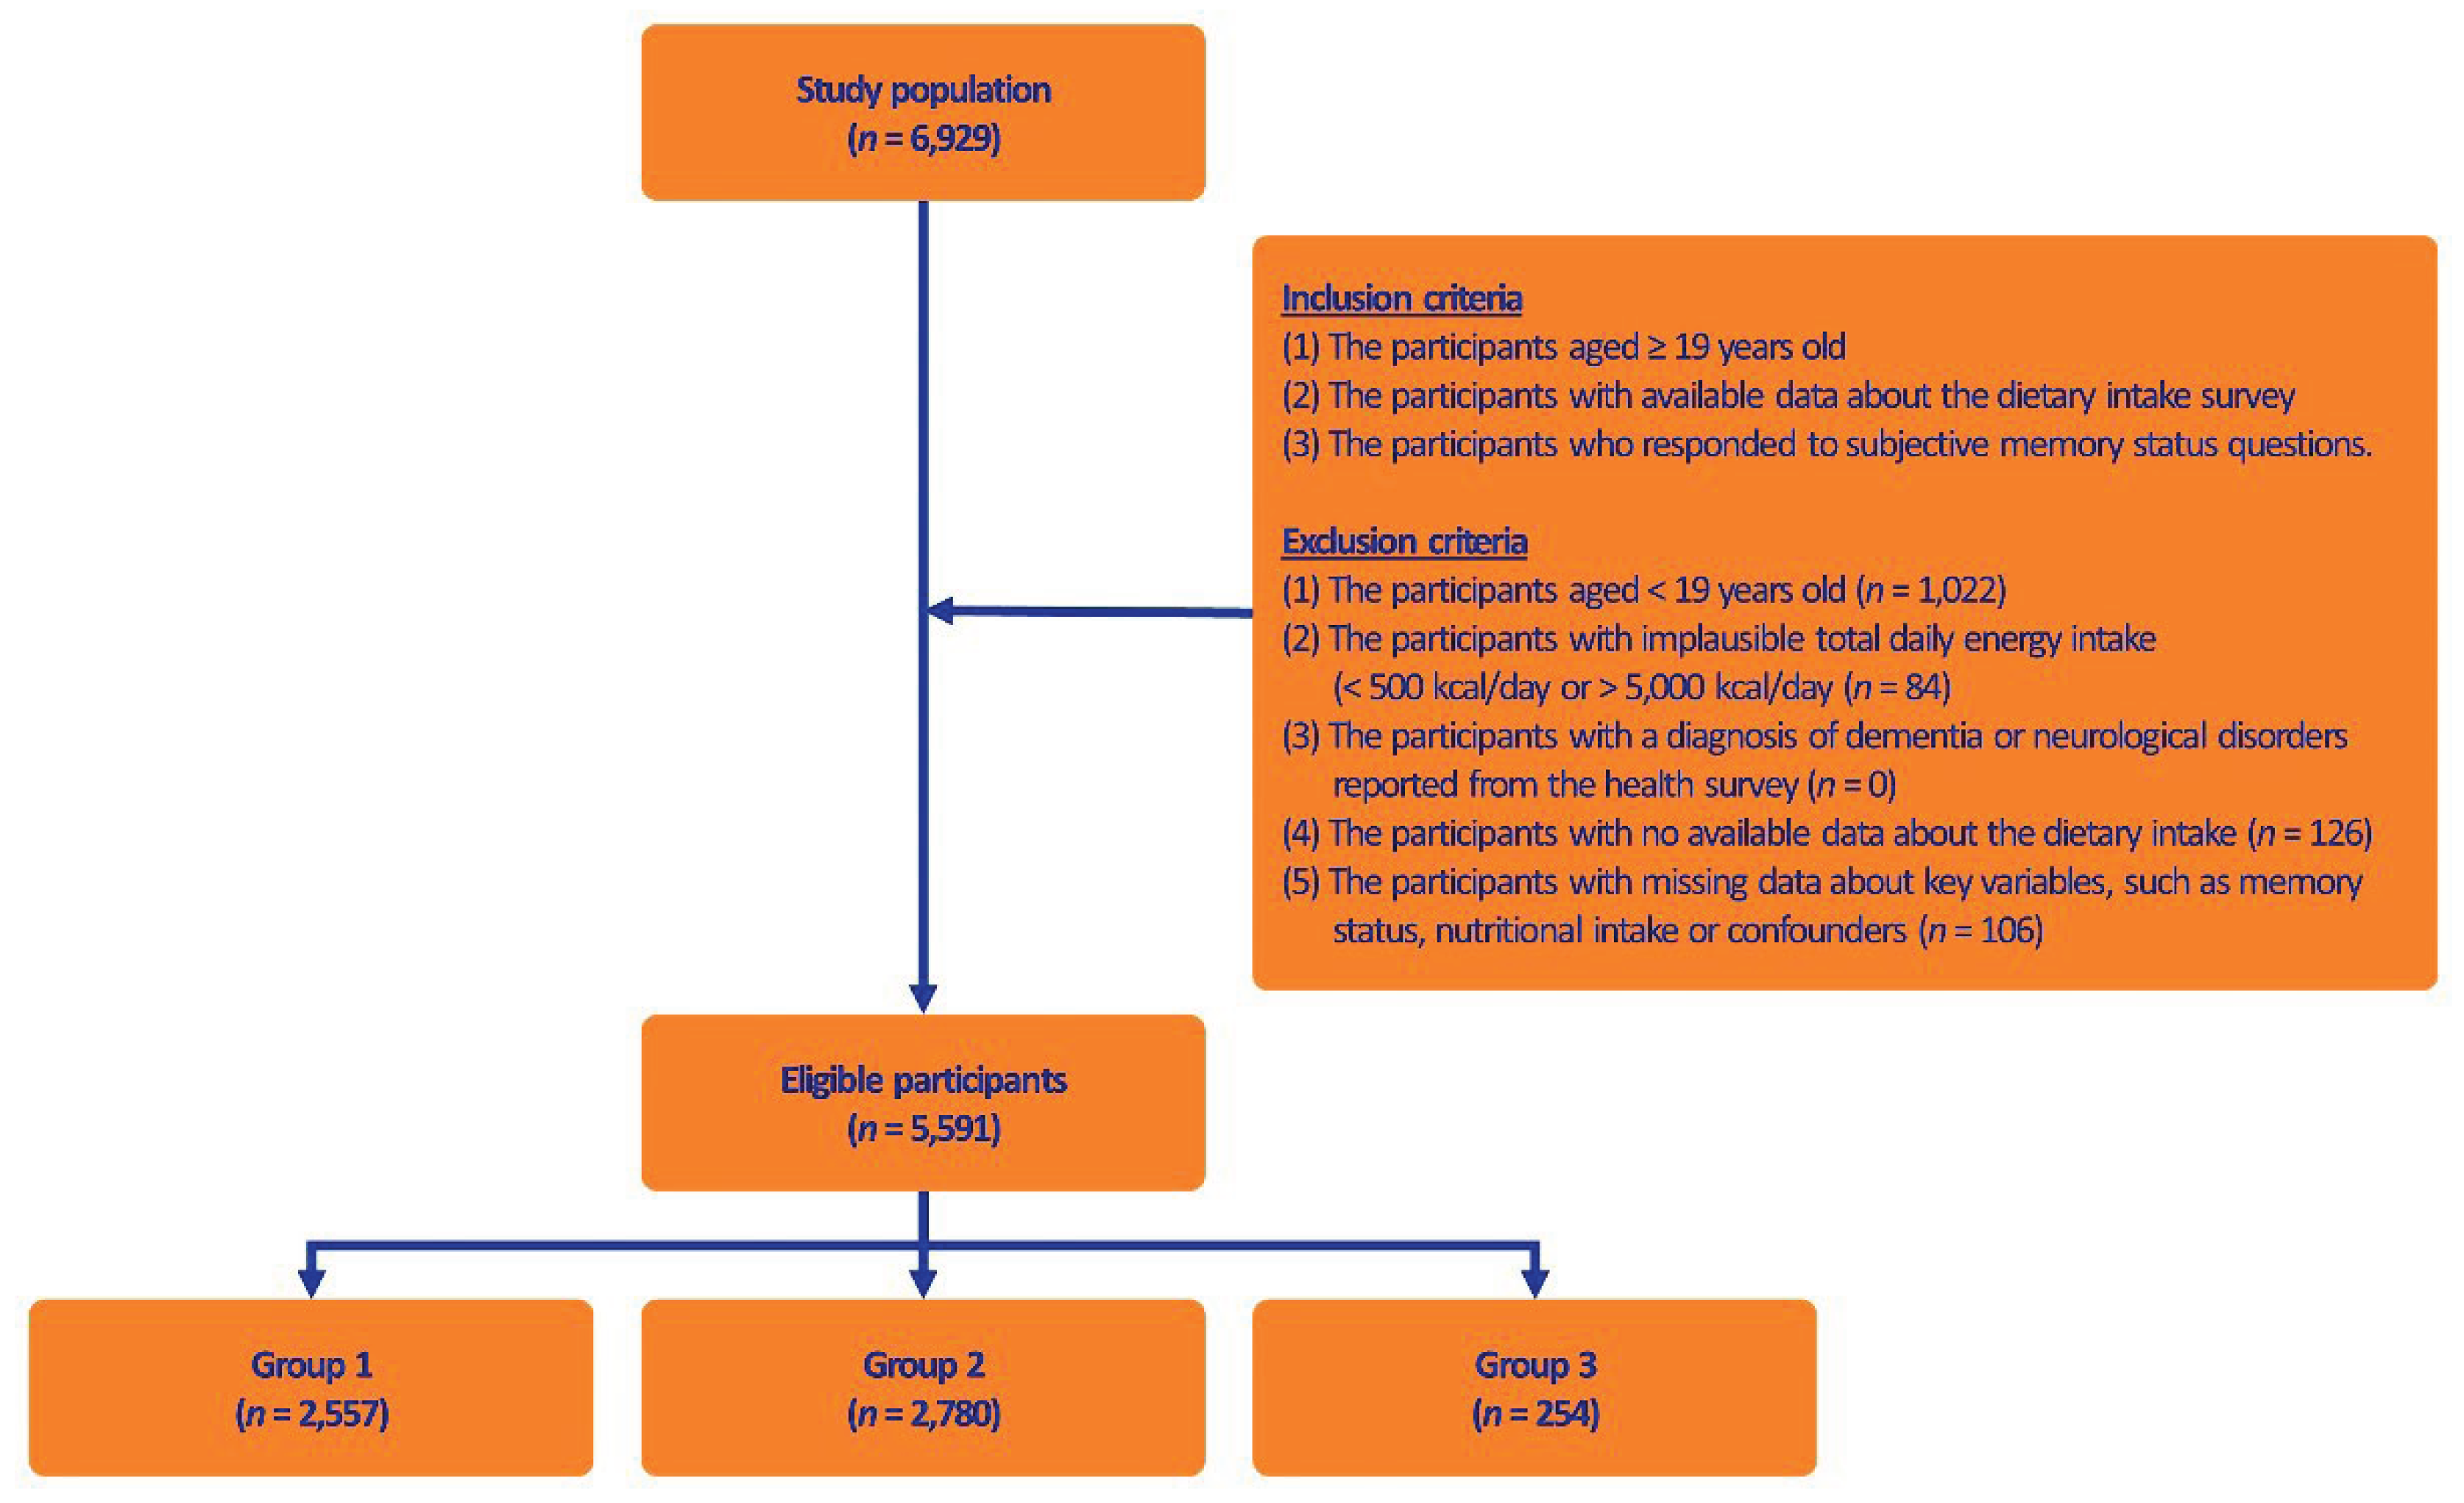

Table 1.
Baseline characteristics and laboratory measurements of the participants (n = 5,591).
| Variables | Values | p-value | ||||||||
|---|---|---|---|---|---|---|---|---|---|---|
| Group 1 (n = 2,557) |
Group 2 (n = 2,780) |
Group 3 (n = 254) |
||||||||
| Age (years old) | 48.90 ± 0.32 | 57.31 ± 0.29 | 60.67 ± 1.23 | < 0.001* | ||||||
| Sex | ||||||||||
| Men | 1,237 (48.4%) | 1,109 (39.9%) | 94 (37.0%) | |||||||
| Women | 1,320 (51.6%) | 1,671 (60.1%) | 160 (63.0%) | |||||||
| Levels of education | ||||||||||
| Elementary school graduates | 257 (10.1%) | 556 (20.0%) | 95 (37.4%) | |||||||
| Middle school graduates | 175 (6.8%) | 356 (12.8%) | 35 (13.8%) | |||||||
| High school graduates | 893 (34.9%) | 897 (32.3%) | 63 (24.8%) | |||||||
| ≥ College graduates | 1,231 (48.2%) | 969 (34.9%) | 61 (24.0%) | |||||||
| Monthly household income (USD) | ||||||||||
| < 2,153.53 | 673 (26.4%) | 1,050 (37.9%) | 147 (58.3%) | |||||||
| 2,153.53-3,589.22 | 580 (22.7%) | 598 (21.6%) | 37 (14.7%) | |||||||
| 3,589.22-7,178.44 | 932 (36.5%) | 845 (30.5%) | 50 (19.8%) | |||||||
| > 7,178.44 | 368 (14.4%) | 277 (10.0%) | 18 (7.1%) | |||||||
| Underlying diseases | ||||||||||
| HTN | ||||||||||
| Yes | 563 (22.0%) | 918 (33.0%) | 95 (37.4%) | |||||||
| No | 1,994 (78.0%) | 1,862 (67.0%) | 159 (62.6%) | |||||||
| DM | ||||||||||
| Yes | 234 (9.2%) | 387 (13.9%) | 54 (21.3%) | |||||||
| No | 2,323 (90.8%) | 2,393 (86.1%) | 200 (78.7%) | |||||||
| Body weight (kg) | 65.98 ± 0.27 | 63.37 ± 0.24 | 61.40 ± 0.74 | |||||||
| BMI (kg/m2) | 24.09 ± 0.08 | 23.98 ± 0.07 | 23.71 ± 0.23 | 0.217 | ||||||
| Waist circumference (cm) | 83.73 ± 0.22 | 84.12 ± 0.20 | 84.68 ± 0.69 | 0.245 | ||||||
| Smoking status | 439 (17.2%) | 399 (14.4%) | 32 (12.6%) | 0.007* | ||||||
| Binge drinking≥once a month | 1,412 (55.2%) | 1,342 (48.3%) | 101 (39.8%) | < 0.001* | ||||||
| Aerobic exercise≥once a month | ||||||||||
| Moderate intensity | 1,220 (50.7%) | 1,463 (56.3%) | 150 (65.8%) | |||||||
| Vigorous intensity | 1,187 (49.3%) | 1,137 (43.7%) | 78 (34.2%) | |||||||
| Poor sleep quality | ||||||||||
| Yes | 331 (12.9%) | 709 (25.5%) | 82 (32.3%) | |||||||
| No | 1,324 (51.8%) | 1,513 (54.4%) | 103 (40.6%) | |||||||
| No responses | 902 (35.2%) | 558 (20.1%) | 69 (27.0%) | |||||||
| Perceived stress | 2.98 ± 0.01 | 2.82 ± 0.01 | 2.62 ± 0.05 | |||||||
| SBP (mmHg) | 117.97 ± 0.30 | 120.23 ± 0.30 | 121.68 ± 1.13 | |||||||
| FBS (mg/dL) | 99.63 ± 0.47 | 101.21 ± 0.42 | 105.11 ± 1.59 | |||||||
| HbA1c (%) | 5.56 ± 0.02 | 5.68 ± 0.02 | 5.76 ± 0.05 | |||||||
| TG (mg/dL) | 127.52 ± 1.86 | 122.21 ± 1.67 | 120.56 ± 4.70 | 0.076 | ||||||
| 25-(OH)-D3 (ng/mL) | 23.50 ± 0.22 | 25.73 ± 0.23 | 25.78 ± 0.81 | <0.001* | ||||||
Abbreviations: HTN, hypertension; DM, diabetes mellitus; BMI, body mass index; SBP, systolic blood pressure; FBS, fasting blood sugar; HbA1c, glycated hemoglobin; TG, triglyceride; 25-(OH)-D3, 25-hydroxyvitamin D3. Values are mean ± standard error or the number of the participants with percentage, where appropriate. *Statistical significance at p < 0.05.
Table 2.
Differences in the memory functions depending on the dietary intake between the three groups.
Table 2.
Differences in the memory functions depending on the dietary intake between the three groups.
| Variables | Univariate analysis | Multivariate analysis | ||||||||
|---|---|---|---|---|---|---|---|---|---|---|
| Values | p-value | Values | p-value | |||||||
| Group 1 (n = 2,557) |
Group 2 (n = 2,780) |
Group 3 (n = 254) |
Group 1 (n = 2,557) |
Group 2 (n = 2,780) |
Group 3 (n = 254) |
|||||
| Energy, water and macronutrients | ||||||||||
| Energy (kcal) | 1,811.51 ± 14.58 |
1,765.92 ± 13.58 |
1,653.52 ±43.93§ |
0.001* | 1,760.74 ± 14.30 |
1,823.78 ± 13.64 |
1,803.31 ± 45.91 |
0.008* | ||
| Water (g) | 1,017.44 ± 11.75† |
967.64 ± 10.15‡ |
868.31 ± 34.97§ |
< 0.001* | 991.18 ± 11.38 |
1,003.84 ±10.86 |
997.20 ± 36.53 |
0.734 | ||
| Protein (g) | 69.25 ± 0.68† |
66.55 ± 0.61‡ |
59.90 ± 2.02§ |
< 0.001* | 67.03 ± 0.67 |
69.34 ± 0.63 |
67.34 ± 2.13 |
0.044* | ||
| Fat (g) | 49.59 ± 0.64† |
46.21 ± 0.60‡ |
38.56 ± 1.92§ |
< 0.001* | 46.52 ± 0.63 |
49.53 ± 0.61 |
46.90 ± 2.04 |
0.003* | ||
| Carbohydrate (g) | 254.04 ± 2.02 |
256.54 ± 1.93 |
254.90 ±6.78 |
0.671 | 252.94 ± 2.08 |
259.19 ± 1.99 |
261.83 ± 6.68 |
0.081 | ||
| FAs and cholesterol | ||||||||||
| SFA (g) | 15.61 ± 0.23† |
14.29 ± 0.21‡ |
11.41 ± 0.61§ |
< 0.001* | 14.45 ± 0.22 |
15.49 ± 0.21 |
14.24 ± 0.71 |
0.002* | ||
| MUFA (g) | 16.17 ± 0.24† |
14.89 ± 0.22‡ |
12.14 ± 0.67§ |
< 0.001* | 15.03 ± 0.23 |
16.10 ± 0.22 |
15.02 ± 0.75 |
0.004* | ||
| PUFA (g) | 12.64 ± 0.18 |
12.21 ± 0.17‡ |
10.78 ± 0.58§ |
0.004* | 12.12 ± 0.19 |
12.82 ± 0.18 |
12.65 ± 0.60 |
0.027* | ||
| n-3 FA (g) | 1.85 ± 0.03 |
1.96 ± 0.04 |
1.76 ± 0.11 |
0.038* | 1.85 ± 0.04 |
1.98 ± 0.04 |
1.95 ± 0.12 |
0.041* | ||
| n-6 FA (g) | 10.75 ± 0.16† |
10.22 ± 0.15 |
8.99 ± 0.53§ |
< 0.001* | 10.23 ± 0.16 |
10.80 ± 0.15 |
10.66 ± 0.52 |
0.046* | ||
| Cholesterol (mg) |
262.49 ± 4.03† |
245.38 ± 3.76‡ |
187.30 ± 10.77§ |
< 0.001* | 251.00 ± 4.12 |
260.31 ± 3.93 |
224.32 ± 13.23 |
0.016* | ||
| Vitamins | ||||||||||
| Vitamin A (μgRAE) |
391.71 ± 6.71 |
388.42 ± 6.51 |
355.90 ± 19.96 |
0.278 | 391.34 ± 7.15 |
391.41 ± 6.82 |
402.24 ± 22.95 |
0.107 | ||
| β-carotene (μg) | 2,760.08 ± 53.54 |
2,908.12 ± 56.45 |
2,886.65 ± 178.36 |
0.160 | 2,848.15 ± 59.74 |
2,824.66 ± 56.98 |
3,082.33 ± 191.72 |
0.430 | ||
| Retinol (μg) | 158.75 ± 4.94 |
143.44 ± 4.30 |
113.17 ± 11.64§ |
0.003* | 150.86 ± 4.94 |
153.39 ± 4.71 |
143.17 ±15.86 |
0.795 | ||
| Thiamine (mg) | 1.10 ± 0.01 |
1.07 ± 0.01 |
1.02 ± 0.04 |
0.054 | 1.07 ± 0.01 |
1.11 ± 0.01 |
1.12 ± 0.04 |
0.159 | ||
| Riboflavin (mg) |
1.60 ± 0.17† |
1.52 ± 0.01 |
1.44 ± 0.05§ |
< 0.001* | 1.56 ± 0.02 |
1.58 ± 0.02 |
1.63 ± 0.05 |
0.338 | ||
| Niacin (mg) | 12.10 ± 0.14† |
11.45 ± 0.13 |
10.51 ± 0.41§ |
<0.001* | 11.65 ± 0.14 |
11.98 ± 0.13 |
11.91 ± 0.45 |
0.250 | ||
| Folic acid (μgDFE) |
309.72 ± 3.27† |
325.26 ± 3.12 |
321.83 ± 11.39 |
0.003* | 316.41 ± 3.37 |
321.57 ± 3.21 |
330.92 ± 10.81 |
0.331 | ||
| Vitamin C (mg) |
68.68 ± 2.00 |
67.86 ± 1.49 |
63.53 ± 4.60 |
0.675 | 69.10 ± 1.93 |
68.75 ± 1.84 |
71.95 ± 6.19 |
0.882 | ||
| Vitamin D (μg) | 2.99 ± 0.12 |
2.91 ± 0.09 |
2.43 ± 0.21 |
0.268 | 3.02 ± 0.12 |
2.96 ± 0.11 |
2.64 ± 0.37 |
0.624 | ||
| Vitamin E (mg α-TE) |
6.95 ± 0.08 |
6.81 ± 0.07 |
6.50 ± 0.30 |
0.121 | 6.81 ± 0.08 |
7.03 ± 0.08 |
7.31 ± 0.25 |
0.045* | ||
| Minerals | ||||||||||
| Calcium (mg) | 499.08 ± 5.59 |
508.01 ± 5.79 |
469.36 ± 19.07 |
0.105 | 499.80 ± 6.22 |
513.49 ± 5.93 |
506.44 ± 19.97 |
0.299 | ||
| Phosphate (mg) |
1,036.78 ± 8.81 |
1,032.72 ± 8.49‡ |
938.88 ± 28.10§ |
0.004* | 1,025.02 ± 9.10 |
1,054.51 ± 8.68 |
1,022.36 ± 29.22 |
0.057 | ||
| Sodium (mg) | 3,203.08 ± 35.10 |
3,124.53 ± 32.50 |
3,092.25 ± 125.82 |
0.218 | 3,156.58 ± 35.39 |
3,198.18 ± 33.76 |
3,300.35 ± 113.59 |
0.424 | ||
| Potassium (mg) | 2,669.96 ± 24.69 |
2,750.09 ± 24.30 |
2,632.01 ± 86.51 |
0.044* | 2,694.10 ± 25.89 |
2,753.02 ± 24.69 |
2,788.56 ± 83.08 |
0.219 | ||
| Magnesium (mg) | 294.57 ± 2.66† |
307.53 ± 2.69 |
297.03 ± 9.23 |
0.003* | 298.54 ± 2.82 |
306.92 ± 2.69 |
310.10 ± 9.03 |
0.087 | ||
| Iron (mg) | 9.33 ± 0.13 |
9.25 ± 0.11 |
9.47 ± 0.55 |
0.813 | 9.24 ± 0.13 |
9.41 ± 0.13 |
10.33 ± 0.43 |
0.053 | ||
| Zinc (mg) | 9.89 ± 0.10 |
9.86 ± 0.09 |
9.45 ± 0.29 |
0.382 | 9.75 ± 0.10 |
10.04 ± 0.09 |
10.11 ± 0.31 |
0.095 | ||
Abbreviations: FA, fatty acid; SFA, saturated fatty acid; MUFA, monounsaturated fatty acid; PUFA, polyunsaturated fatty acid. Values are mean ± standard error or estimated marginal mean ± standard error, where appropriate. † Comparison between the Group 1 and the Group 2. ‡ Comparison between the Group 2 and the Group 3. § Comparison between the Group 1 and the Group 3. *Statistical significance at p < 0.05.
Disclaimer/Publisher’s Note: The statements, opinions and data contained in all publications are solely those of the individual author(s) and contributor(s) and not of MDPI and/or the editor(s). MDPI and/or the editor(s) disclaim responsibility for any injury to people or property resulting from any ideas, methods, instructions or products referred to in the content. |
© 2026 by the authors. Licensee MDPI, Basel, Switzerland. This article is an open access article distributed under the terms and conditions of the Creative Commons Attribution (CC BY) license (http://creativecommons.org/licenses/by/4.0/).
Copyright: This open access article is published under a Creative Commons CC BY 4.0 license, which permit the free download, distribution, and reuse, provided that the author and preprint are cited in any reuse.