

Submitted:
04 September 2026
Posted:
07 September 2026
You are already at the latest version
Abstract
We use molecular dynamics simulations to study hydrated Nafion at hydration levels λ=3,9,15 under external electric fields. At zero field, the static dielectric constant of the aqueous subsystem, obtained from water dipole fluctuations, grows with hydration, from ϵ≈2.9 at λ=3 to ϵ≈17.2 at λ=15; because the single-molecule dipole is essentially unchanged, this enhancement is cooperative in origin, reflecting the dipolar correlations that build up as the aqueous domains percolate. Under an applied field the fluctuation formula no longer defines an equilibrium dielectric constant, so we characterize the response through the polarization itself: the collective water dipole orients along the field already at low fields, while its magnitude 〈Mz〉 saturates gradually, on a field scale that grows with hydration. This polarization build-up is accompanied by a reorganization of the first H3O+–SO3(H) coordination shell and by a crossover from diffusive to drift-dominated proton transport. These signatures do not evolve independently but shift together to higher fields as hydration increases, showing that the water polarization and the proton transport are coupled to a common, hydration-controlled field scale: electrostatic screening by the added water simultaneously sets the equilibrium dielectric response and the field required for directed hydronium transport in perfluorinated membranes.
Keywords:
Nafion
; proton exchange membrane
; molecular dynamics
; external electric field
; dielectric constant
; hydronium transport
; hydration
; electrostatic screening
1. Introduction
Proton exchange membrane fuel cells (PEMFCs) are among the most promising energy conversion devices for sustainable power generation, relying on the efficiency and durability of proton-conducting membranes such as Nafion. Nafion, a perfluorosulfonic acid (PFSA) polymer, combines a hydrophobic polytetrafluoroethylene (PTFE) backbone with perfluoroether side chains terminated by sulfonic acid groups, forming a complex nanophase-separated morphology that governs water uptake and ion transport [1,2,3,4]. Understanding the molecular-scale structure and dynamics of Nafion is therefore essential for the design of improved membranes with enhanced proton conductivity and mechanical stability, an area that remains under intense development [5].
Atomistic and coarse-grained molecular dynamics (MD) simulations have played a crucial role in elucidating the relationship between hydration, morphology, and transport phenomena in Nafion. Early simulation studies revealed the existence of continuous water domains within the hydrophilic regions and provided insight into the formation of interconnected channels facilitating proton transport [1,6]. Subsequent works introduced more refined models of hydrated Nafion, demonstrating how sulfonic acid aggregation and water clustering drive nanophase segregation [2,3]. Jinnouchi et al. [7] further established that the mobility of hydronium ions is strongly coupled to the dynamic reorganization of the polymer–water interface, while later simulations clarified oxygen permeation and gas solubility in the membrane under operational conditions [8]. Atomistic simulation remains an active tool in this area: recent studies have resolved proton transport across the interfaces of the nanophase-separated domains in short-side-chain ionomers such as Aquivion [9] and characterized transport in Nafion-based composite membranes [10].
More recent studies have focused on the morphological response of Nafion thin films at electrode interfaces. Kang et al. [11] and Cheng et al. [12] employed high-resolution simulations and spectroscopic analyses to demonstrate that interfacial confinement, water content, and substrate hydrophilicity significantly alter the orientation of side chains and the connectivity of water domains, thus influencing proton transport near catalytic surfaces. These results reveal the multiscale complexity of Nafion morphology and point to the need for accurate atomic-level models that capture both electrostatic interactions and dielectric polarization effects. More recently, molecular dynamics has also been used to probe how external electric fields, together with temperature and hydration, affect proton transport in ordered and amorphous proton exchange membranes [13]; the field response of these materials is attracting growing attention.
In this work, we extend previous atomistic modeling efforts by performing density functional theory (DFT) calculations to obtain Hirshfeld-derived atomic charges for Nafion monomer units, which were subsequently used in classical molecular dynamics simulations with GROMACS. Rather than treating the dielectric, structural, and transport properties of hydrated Nafion as separate observables, we focus on how they are coupled under an external electric field. We show that the equilibrium dielectric response of the aqueous phase, the build-up and saturation of the field-induced water polarization, the reorganization of the hydronium coordination shell, and the onset of directed hydronium transport all trace back to one variable: the degree of electrostatic screening set by the water content. More water means stronger screening of the attraction between the mobile ions and the sulfonate network, and the characteristic field of each of these responses moves upward accordingly. By scanning hydration levels () and external fields, we thus map the coupling between water polarization and proton transport that governs the field response of perfluorinated ionomer membranes.
2. Molecular Models and Method
The Nafion monomer employed in the present simulations consists of a perfluorinated PTFE-like backbone composed of CFx units, bearing four perfluoroether side chains terminated by sulfonic acid groups (), as shown in Figure 1. The detailed chemical structure is presented in Figure 2. In this molecular model, four sulfonated side chains are covalently attached to the fluorocarbon backbone at regular intervals. The resulting repeat unit has a molecular weight of 3215 g mol−1 and an equivalent weight of EW = 804 g eq−1. This value is lower than that of standard Nafion 117 (EW ≈ 1100 g eq−1). Importantly, our model retains the standard Nafion long side chain (Figure 2); the reduced EW arises from a higher density of these side chains along the backbone, not from side-chain shortening. It thus represents the high-sulfonation-density end of the long-side-chain Nafion family, and although this EW coincides with the range of short-side-chain ionomers such as Aquivion/Hyflon (EW ≈ 700–870 g eq−1) [14], the two differ in side-chain chemistry. The higher density of sulfonic groups increases the concentration of exchange sites per unit mass, which is expected to promote water clustering and the percolation of ionic domains at a given hydration level . We do not vary the equivalent weight in this work; accordingly, the absolute field scales reported below may shift for membranes of higher EW, while the coupling mechanism we describe is expected to be general.
The bulk Nafion system was modeled by placing 36 Nafion monomers together with 10 hydronium (H3O+) and 10 hydroxide (OH−) ions, together with a number of water molecules (H2O) set by the hydration level , defined as the number of water molecules per sulfonic acid group. With four sulfonic groups per monomer and 36 monomers, the system contains 144 sulfonic acid groups in total. In the present topology these groups are modeled in their protonated −SO3H form, so that each monomer is electrically neutral, and the corresponding number of water molecules is , so that higher corresponds to a larger water content.
The ionic composition itself deserves a remark. The mobile carriers consist of a small, fixed population of 10 H3O+ and 10 OH− ions, so that the system is charge-neutral by construction. This differs from the fully dissociated limit expected for a perfluorosulfonic superacid at these hydration levels, in which each sulfonic group would donate its proton to the aqueous phase, yielding of order 144 H3O+ and 144 SO3− per box. What our setup probes, therefore, is the field response of a dilute carrier population within a predominantly protonated matrix, not the transport of a fully dissociated membrane. The diffusion coefficients and drift thresholds reported below should be read in that light: they characterize the field-driven mobility of the explicit carriers and the reorganization of the H3O+–SO3(H) coordination, and provide a lower bound on the proton transport of the fully hydrated, fully dissociated membrane.
All systems were contained in an orthorhombic simulation box of fixed dimensions nm3, common to every hydration level. Periodic boundary conditions were applied in all three spatial directions to mimic bulk behavior, as illustrated in Figure 3.
The bonded and Lennard–Jones parameters of the Nafion monomer were taken from the GROMOS 54A7 united-atom force field [15], the initial topology being generated with the Automated Topology Builder (ATB) [16,17]. Non-bonded interactions follow the GROMOS geometric combination rules. The atomic charges provided by the ATB were then replaced by charges derived from a Hirshfeld population analysis, following the strategy described in Refs. [18,19,20]. The electronic structure calculations were performed using Density Functional Theory (DFT) with the ORCA 5.0.4 package, employing the B3LYP functional and the def2-SVP basis set. Geometry optimizations were followed by single-point energy calculations, and the Hirshfeld method was applied to extract the partial atomic charges. These charges were uniformly scaled by a factor of 1.2 to reproduce the reference molecular dipole moment [18], and the scaled values were assigned to the Nafion topology.
The molecular dynamics (MD) simulations were conducted with the GROMACS 2024.5 software. Systems consisting of hydrated Nafion were constructed using different hydration levels, characterized by the hydration parameter (number of water molecules per sulfonic acid group). Values of = 3, 9 and 15 were studied to represent different levels of membrane hydration. Water was represented by the rigid four-site TIP4P/Ice model [21], while the hydronium (H3O+) and hydroxide (OH−) ions were represented by rigid, non-polarizable models carrying formal charges of and , respectively, with Lennard–Jones interactions assigned only to the oxygen atom. Following the approach of Elliott et al. [6], who built their hydronium fragment directly from the water molecule to preserve internal consistency with the solvent, the ionic oxygen Lennard–Jones parameters were taken from the SPC/E water model [22], and the ion geometry was inherited from a standard water model. This entails a slight mismatch between the van der Waals description of the ions and that of the TIP4P/Ice solvent; because the ions form a dilute species and the dielectric analysis is restricted to the water subsystem, we expect this mismatch to have a limited effect on the reported trends, but state it explicitly as a limitation. We note that TIP4P/Ice was parametrized to reproduce the phase diagram of ice rather than the dielectric or dynamical properties of ambient liquid water; owing to its four-site charge distribution it yields, at 300 K, a lower static dielectric constant and a slower self-diffusion than real water. The dielectric and transport quantities reported below should therefore be read against the intrinsic bulk behavior of this model, not against experimental water directly. After energy minimization and a 2.5 ns equilibration ( steps), production runs were carried out in the NVT ensemble at 300 K, with the temperature maintained by a Nosé–Hoover thermostat ( ps). The equations of motion were integrated with a leap-frog algorithm and a time step of 0.5 fs, and each production trajectory spanned 10 ns ( steps). A Verlet cutoff scheme was used with a common cutoff of 1.0 nm for the Lennard–Jones and real-space electrostatic interactions; long-range electrostatics were treated with the Particle Mesh Ewald (PME) method and a long-range dispersion correction was applied to both energy and pressure. All bonds involving hydrogen were constrained with the LINCS algorithm, and the water and ion geometries were kept rigid. The main simulation parameters are summarized in Table 1.
An external electric field was applied along the z direction. In the presence of the field, the total potential energy of the system is expressed as
where E is the magnitude of the external electric field, is the partial charge of particle i, and is its Cartesian coordinate along the z direction. The term represents the intermolecular interaction energy including electrostatic and Lennard–Jones contributions. This external-field scheme is the same one we have employed in previous molecular dynamics studies of electric-field effects on clathrate hydrates [23,24].
The electric field strength was varied between 0 and 4.0 V nm−1, with the specific values chosen for each hydration level listed in Table 2. The field magnitudes explored here (up to 4.0 V nm−1) are several orders of magnitude larger than the average macroscopic field across an operating PEMFC membrane (– V nm−1). Such elevated fields are a standard device in non-equilibrium molecular dynamics of membranes and electrolytes [13,23,24]: they are required to drive a measurable ionic response within the accessible simulation time, and they probe the local electrostatic scale at which the sulfonate–ion coupling operates. The drift thresholds reported below should therefore be read as a probe of the intrinsic coupling between polarization and transport, not as literal operating conditions; the physically meaningful result is the systematic shift of that coupling with hydration, not the absolute field values. All simulations were carried out in the canonical (NVT) ensemble at constant temperature of 300 K and fixed volume. A single simulation cell of fixed dimensions was used for all hydration levels and field strengths, and no constant-pressure (NPT) equilibration was performed. This choice is deliberate. Under the strong static external fields applied here, the field continuously does work on the net-mobile ionic species and drives the system into a field-driven steady state; barostat-based pressure control, which presupposes mechanical equilibrium and an unbiased virial, is therefore not well defined under the field, and a fixed-volume ensemble is the controlled and reproducible setting for a systematic scan over and E. Using an identical cell for every system further removes the volume as a confounding variable: differences in the computed observables reflect hydration and field, not concurrent changes in cell size, and the zero-field dielectric reference and the field response are evaluated in the same cell. A consequence of this protocol is that, since water is added to a cell of fixed size, the mass density increases with hydration, from to and g cm−3 for , 9 and 15. We therefore treat the systems as a controlled-volume series rather than as reproductions of the experimental swelling isotherm; because absolute transport coefficients depend on density, the cross- comparison below should be read as an analysis of the coupling and of the trends at fixed volume, not as a prediction of absolute mobilities at each hydration’s equilibrium density. For each value, the total dipole moment, its longitudinal component, and the Kirkwood factor were extracted from the trajectories. The static dielectric constant was obtained from the Kirkwood–Fröhlich dipole fluctuation formula implemented in GROMACS, , where is the total dipole of the aqueous subsystem. We restrict the fluctuation formula to the water molecules because the mobile ionic species (H3O+ and OH−) carry a net charge: their displacement contributes to the ionic conductivity rather than to the orientational polarization, and including them would conflate the two responses and make ill-defined under periodic boundary conditions. This expression is a linear-response, equilibrium relation: it is physically meaningful only in the absence of an external field, where the spontaneous dipole fluctuations sampled by the simulation define the zero-field susceptibility. Under a finite field the dipoles align and saturate, the fluctuations are suppressed, and the formula no longer yields a dielectric constant. We therefore report only at ; the field-dependent polarization response is characterized instead by and the alignment fraction , with the finite-volume Kirkwood factor used only as an apparent indicator of dipolar correlation. These analyses enabled the evaluation of the structural, polarization, and transport response of Nafion under different hydration states and external field conditions.
Statistical uncertainties on the zero-field dielectric constant were estimated by block averaging: the 8 ns of production sampled for the dipole (the first 2 ns being discarded as equilibration) was divided into four 2 ns blocks, and the reported uncertainty is the standard deviation across blocks. Our full-trajectory reproduces the built-in GROMACS estimate to within numerical precision at all three hydration levels, confirming the implementation. The block-to-block scatter is smallest at low hydration (: ) and largest at high hydration (: ). This trend follows the collective nature of the dielectric response: the autocorrelation time of the aqueous dipole grows from ns at to ns at , so that each fixed-length block contains correspondingly fewer independent samples of the slowly relaxing total dipole . The high-, strongly correlated regime is therefore intrinsically the hardest to converge, and the same collective correlations that enhance also govern its slower convergence.
3. Results and Discussion
The high sulfonate density has two direct consequences for ion transport. First, even in the absence of an applied field, the H3O+ ions at low hydration are already embedded in a dense network of neighboring sulfonic groups, which templates the vehicular motion of the intact H3O+ ions through the sulfonic-group array. This is reflected in the zero-field diffusion coefficients, which decrease monotonically with hydration: , , and cm2 s−1 for , 9, and 15, respectively. The progressive dilution of the sulfonate network by water thus reduces the intrinsic, field-free proton mobility as hydration increases. We emphasize that this trend is a feature of the controlled-volume protocol (Section 2): because the cell size is held fixed, increasing raises the mass density (from 1.40 to 1.75 g cm−3), so the added water crowds the fixed cell and reduces the free volume available for ion motion. The decreasing zero-field mobility therefore reflects this increasing confinement; it does not contradict the enhanced conductivity observed in constant-pressure, freely swelling membranes.
Second, the water content controls the minimum field required to drive H3O+ out of the diffusive regime into field-driven drift. As additional water molecules are incorporated, they progressively screen the electrostatic interaction between the sulfonate groups and the mobile ions, so that a stronger external field is needed to overcome the structural constraints of the hydrated matrix. This screening is quantified by the systematic shift of the drift threshold: , , and V nm−1 for , 9, and 15, respectively (see Section 3.2). Below each threshold, however, the field does enhance diffusive transport. The relative enhancement (the factor by which D increases from zero field to the diffusive maximum) grows with hydration, reflecting the larger structural reorganization that the field induces in more water-rich environments.
These observations are consistent with the classical cluster–channel model proposed by Hsu and Gierke [25] for Nafion membranes, in which sulfonic acid groups aggregate into hydrophilic ionic clusters interconnected by narrow channels. In the present model the high sulfonate density (EW = 804 g eq−1) promotes well-defined ionic domains even at moderate hydration levels. The applied field enhances the longitudinal connectivity of these domains by partially aligning the hydrated ionic regions, but the field strength required to achieve this alignment is set by the degree of electrostatic screening, which increases monotonically with . The quantitative thresholds reported here thus provide a direct measure of how membrane hydration controls the field-driven onset of directed hydronium transport.
3.1. Zero-Field Dielectric Response and Field-Induced Dipolar Alignment
At zero field, where the fluctuation formula defines a genuine equilibrium dielectric constant, the aqueous-subsystem grows monotonically with hydration, from at to at and at (Figure 4). This growth is driven by collective dipolar correlations: the static Kirkwood factor exceeds unity and increases with hydration, whereas the water molecular dipole is fixed by the (rigid) water model. The dielectric enhancement with hydration therefore reflects the increasing mutual alignment of the water dipoles as the aqueous domains percolate, not a change in the single-molecule dipole.
These values should be read relative to the bulk dielectric constant of the water model itself. Owing to its four-site charge distribution, TIP4P/Ice yields a static dielectric constant below that of experimental water at 300 K, so the growth from at to at reflects the progressive build-up of the aqueous dielectric response toward the model’s own bulk value as the hydrophilic domains percolate; it is not an approach to the experimental bulk permittivity.
Under a finite field the dipole-fluctuation formula no longer defines a dielectric constant: the field aligns the dipoles and suppresses the very fluctuations on which the linear-response relation rests, so the quantity it returns loses its physical meaning as . We therefore characterize the field response directly through the polarization of the aqueous subsystem. The longitudinal water dipole rises steeply at low fields and then saturates as the dipoles become fully aligned (Figure 5); for , for instance, grows from essentially zero at to D already at V nm−1, and then approaches its saturation value of D only gradually, with increments of a few percent per field step beyond V nm−1. Both the saturated dipole and the field needed to approach it grow with hydration: the and curves approach saturation by and 2 V nm−1, respectively, whereas for the approach extends to –4 V nm−1. The response is strongly anisotropic, with the longitudinal component dominating over the transverse ones for all and E, and the two observables separate the orientation of the collective dipole from its magnitude. The alignment fraction jumps from its near-isotropic zero-field value to already at V nm−1 for and 15, and above by V nm−1 for (Figure 6): the direction of the collective water dipole locks onto the field essentially immediately, at fields well below those at which its magnitude saturates. The continued growth of at higher fields therefore reflects the progressive alignment of the individual molecular dipoles within an already field-oriented collective moment, and it is this magnitude saturation, not the orientational locking, that carries the hydration-dependent field scale, consistent with field-induced ordering amplified by the percolation of the aqueous domains.
This field-driven alignment does not occur in isolation: it is coupled to the structural and transport reorganization characterized in the following sections, all sharing a common field scale, which is again set by hydration through electrostatic screening: the more water is present, the stronger the field required to align the ionic network and to drive the carriers out of the diffusive regime. Concretely, for the diffusion coefficient D reaches its diffusive-regime maximum at V nm−1, the drift onset occurs at V nm−1, and the S–H3O+ first-peak height peaks at V nm−1, all within the same narrow window; for the diffusive maximum of D ( V nm−1) and the field-induced recovery maximum of ( V nm−1) likewise cluster around the drift onset at – V nm−1, and for the same sequence is displaced to V nm−1. That the maxima of cooperative diffusion and of first-shell H3O+–SO3(H) occupancy track each other as varies points to a common origin for the polarization, structural, and transport responses: a screening-controlled build-up of correlated ionic ordering.
3.2. Hydronium Transport Coupled to the Polarization Response
The polarization response identified above is directly coupled to ion transport. To make this coupling explicit, we extracted the diffusion coefficients D of hydronium ions from the linear regime of the mean squared displacement (MSD) curves, fitting the time interval between 2000 and 6000 ps. This window excludes the initial ballistic regime and minimizes the nonlinear effects that emerge at long times under strong external fields. Because a uniform field exerts a net force on the charged carriers, the long-time motion ceases to be purely diffusive once the field is strong enough; we therefore restrict the quantitative analysis to the diffusive regime and treat the large-field data separately as a drift threshold (see below). The resulting curves for , 9 and 15 are shown in Figure 7, and the corresponding values are listed in Table 2.
Within the diffusive regime, displays a nonmonotonic, hydration-dependent behavior that parallels the build-up of the water polarization described above. For , D first decreases weakly as the field rises from zero ( between and ), then rises sharply to a local maximum near (). For the same feature appears but shifted to higher field: D peaks at () and is then suppressed at – ( and ). This local-maximum-then-suppression structure reflects the same cooperative ordering that underlies the growth of the water polarization, and progressively weakens with hydration: for it survives only as a shallow plateau near – ( and ), where the variation falls within the scatter of the fits and should be regarded as indicative rather than conclusive.
The most robust trend is the systematic shift of the field scale with hydration. The onset of field-driven drift, identified by the abrupt rise of the apparent D by several orders of magnitude, moves to progressively higher fields as increases: for , – for , and – for . This monotonic displacement is a direct manifestation of the electrostatic screening discussed above: the additional water progressively screens the interaction between the sulfonate groups and the mobile ions, so that a stronger field is required to overcome the structural constraints of the hydrated matrix and drive the carriers into the drift regime. The same screening that sets the field scale of the water polarization thus also displaces the transport threshold: the two responses move together because they share their origin.
Beyond these onset fields, the apparent diffusion coefficients increase by several orders of magnitude and no longer describe equilibrium diffusion: the motion is dominated by field-driven drift rather than thermal diffusion. These large-field values are reported in Table 2 for completeness, marked with a dagger, but are excluded from the quantitative analysis above because they do not represent equilibrium transport properties.
Finally, a limitation intrinsic to the present approach should be stated explicitly. Because the simulations use a classical, non-reactive force field, proton transport is captured only through the vehicular motion of intact H3O+ ions; the structural (Grotthuss) mechanism, in which the excess proton is relayed through the hydrogen-bond network, is not represented. As already emphasized by Elliott et al. [6], neglecting charge transfer in classical MD means that the computed diffusion coefficients should be regarded as a lower bound on the true proton mobility, particularly at high hydration where structural diffusion contributes an increasing fraction of the experimental conductivity. A reactive treatment, such as the multistate empirical valence bond (MS-EVB) method [26] or ReaxFF [27], would be required to recover the Grotthuss contribution.
3.3. Structural Signature in the First Coordination Shell
To connect the macroscopic transport behavior described above with microscopic structural changes, we computed radial distribution functions (RDFs) for three atom pairs: sulfur–sulfur (S–S), sulfur–hydronium (S–H3O+), and sulfur–water (S–W), for , 9, and 15 at the same electric fields studied in the MSD analysis. The resulting distributions are shown in Figure 8.
The S–S peak at nm, which corresponds to the nearest-neighbor sulfonate distance, and the S–W peak at nm remain at the same position across all fields and hydration levels, and their heights show no systematic field dependence below the drift onset: the S–S height fluctuates by ∼15–20% without a clear trend, and the S–W height is essentially constant, decreasing modestly (≈10–20%) only at the largest, drift-regime fields (Figure 8 and Figure 9). Neither the polymer backbone nor the primary hydration shell of the sulfonate groups therefore undergoes a significant field-induced structural reorganization below the drift onset.
In sharp contrast, the S–H3O+ distribution exhibits a clear and systematic response. Figure 9 shows the height of the first peak of each distribution as a function of E for the three hydration levels. For all , follows a nonmonotonic pattern that directly mirrors the ion-transport behavior: it rises toward a maximum located near the drift onset and falls once the drift regime is fully developed. For , rises from 0.75 at to 1.08 at V nm−1 and drops to 0.63 at V nm−1 (post-threshold). For , dips from 1.32 at to 0.81 at V nm−1, recovers to – around the drift onset (peaking at 1.21 at V nm−1), and then falls to 0.73 at V nm−1, beyond the onset at – V nm−1 where D has already jumped by two orders of magnitude. For , reaches its maximum value of 1.31 at V nm−1 and drops to 1.01 at V nm−1, coinciding with the abrupt rise of D from to cm2 s−1.
This behavior identifies a two-stage structural sequence. Below the threshold, the field progressively draws H3O+ ions into closer coordination with the SO3(H) groups, increasing the occupancy of the first coordination shell and building a field-aligned ionic network that enhances cooperative susceptibility. Once the threshold is crossed, the ions are no longer trapped at a single sulfonate site but transition to a mobile regime in which they migrate continuously between sites; the resulting reduction in residence time at any fixed site is reflected in the drop of . The drift threshold thus marks the crossover from localized coordination to delocalized transport, and the structural signature in confirms that this crossover is the common microscopic origin that couples the transport threshold in to the saturation of the field-induced dipolar alignment. The systematic shift of this threshold to higher fields with increasing is again a direct consequence of the electrostatic screening discussed in the preceding sections.
To complement the peak-height analysis with an integral measure, we computed running coordination numbers by integrating each RDF to a fixed cutoff taken, for every hydration level, from the position of the zero-field first minimum, so that the field dependence reflects changes in shell occupancy rather than in the integration boundary ( nm for and nm for ). Uncertainties were obtained by block averaging over four 2 ns blocks, as for the dielectric analysis. Because the S–H3O+ RDF is referenced to the hydronium ions, this coordination number counts the sulfonic groups surrounding each hydronium. At the S–H3O+ correlation remains weak ( stays at and the distribution lacks a clear first minimum), so no well-defined first coordination shell exists at low hydration and the field only begins to build incipient coordination; the coordination analysis is therefore meaningful only at and 15, where the shell is well defined. There, the first-shell occupancy confirms the two-stage picture of : it is high below the drift threshold and collapses once the drift regime is entered. For the number of coordinating sulfonic groups rises from at to near the drift-onset field ( V nm−1) and falls to at V nm−1; for it remains at – up to the drift onset ( at ; and at and V nm−1) and drops to at V nm−1, beyond the onset, where D has already jumped by two orders of magnitude. The nonmonotonic signature therefore reflects a genuine change in first-shell occupancy, not a normalization artifact, and the drift onset coincides with the loss of hydronium–sulfonate coordination. The S–S and S–W coordination numbers show no counterpart of the S–H3O+ collapse, varying by over the full field range: the S–S number decreases monotonically with hydration (, , for , 9, 15 at ), reflecting dilution of the sulfonate network, whereas the number of water molecules in the first sulfur shell is largest at high hydration (, , and for , 9, 15; the value is inflated by its wider first shell, nm versus nm at ), reflecting the growing hydration of the sulfur environment, consistent with Figure 9.
4. Conclusions
At zero field, the static dielectric constant of hydrated Nafion is set by collective dipolar correlations: the aqueous-subsystem grows with hydration (from at to at ) while the single-molecule dipole remains essentially constant, so the enhancement is cooperative in origin and tracks the percolation of the aqueous domains. Under an external field the dipole-fluctuation formula no longer defines a dielectric constant; the meaningful response is the polarization itself, which we follow through the longitudinal dipole and the alignment fraction . The orientation of the collective water dipole locks onto the field already at low fields for every hydration level; the field then progressively saturates the magnitude of the water polarization, reorganizes the first H3O+–SO3(H) coordination shell, and drives a crossover from diffusive to drift-dominated proton transport. The central result is the coupling among these responses. The saturation field of the water polarization, the first-shell occupancy, and the transport threshold all move to higher fields as hydration increases, and they move together. We attribute this concerted shift to electrostatic screening: the added water weakens the sulfonate–ion interaction, and in doing so it sets at once the equilibrium dielectric response and the field required for directed hydronium transport. Because all systems share a fixed simulation cell, the mass density increases with hydration, and the absolute diffusion coefficients (in particular their decrease with ) reflect this controlled-volume protocol rather than the behavior of a freely swelling membrane. Our conclusions concern the coupling between the polarization, structural, and transport responses and the concerted shift of their characteristic field with hydration, which are robust to this choice; they are not intended as predictions of absolute mobilities or of the hydration dependence of conductivity at each equilibrium density. Viewed this way, the dielectric, structural, and transport signatures form a single picture of the field response of perfluorosulfonated membranes, one in which hydration acts as a single knob that tunes both the polarization and the onset of proton conduction under bias.
Author Contributions
Conceptualization, D.P.L.J.; methodology, D.P.L.J. and J.L.L.; software, D.P.L.J.; validation, L.A.M.S. and J.T.T.; formal analysis, D.P.L.J. and A.G.C.; investigation, D.P.L.J., L.A.M.S., J.T.T. and D.N.J.A.; resources, D.P.L.J.; data curation, D.P.L.J.; writing—original draft preparation, D.P.L.J.; writing—review and editing, all authors; visualization, D.P.L.J.; supervision, J.L.L. and A.G.C.; project administration, D.P.L.J.; funding acquisition, D.P.L.J. All authors have read and agreed to the published version of the manuscript.
Funding
This research was funded by the Secretaría de Ciencia, Humanidades, Tecnología e Innovación (SECIHTI) through the Ciencia Básica y de Frontera research project CBF-2025-I-1583.
Institutional Review Board Statement
Not applicable.
Informed Consent Statement
Not applicable.
Data Availability Statement
The GROMACS input files (topologies and run parameters), the raw simulation outputs underlying the figures, and the Python analysis scripts are available from the corresponding author upon reasonable request.
Acknowledgments
The authors thankfully acknowledge computer resources, technical advice and support provided by Laboratorio Nacional de Supercómputo del Sureste de México (LNS), a member of the SECIHTI national laboratories, with project No. 202403053N. This work was carried out within the Ciencia Básica y de Frontera research project CBF-2025-I-1583 of SECIHTI. D.P.L.J. and A.G.C. also acknowledge the support of the Investigadoras e Investigadores por México program of SECIHTI.
Conflicts of Interest
The authors declare no conflicts of interest. The funders had no role in the design of the study; in the collection, analyses, or interpretation of data; in the writing of the manuscript; or in the decision to publish the results.
Abbreviations
The following abbreviations are used in this manuscript:
| PEMFC | Proton exchange membrane fuel cell |
| PFSA | Perfluorosulfonic acid |
| PTFE | Polytetrafluoroethylene |
| MD | Molecular dynamics |
| DFT | Density functional theory |
| ATB | Automated Topology Builder |
| EW | Equivalent weight |
| NVT | Canonical ensemble (constant number, volume, temperature) |
| PME | Particle Mesh Ewald |
| MSD | Mean squared displacement |
| RDF | Radial distribution function |
| MS-EVB | Multistate empirical valence bond |
References
- Vishnyakov, A.; Neimark, A.V. Molecular Dynamics Simulation of Microstructure and Molecular Mobilities in Swollen Nafion Membranes. J. Phys. Chem. B 2001, 105, 9586–9594. [Google Scholar] [CrossRef]
- Jang, S.S.; Molinero, V.; Cummings, P.T.; Goddard, W.A. Nanophase-segregation and transport in Nafion 117 from molecular dynamics simulations. J. Phys. Chem. B 2004, 108, 3149–3157. [Google Scholar] [CrossRef]
- Urata, S.; Irisawa, J.; Yamasaki, H. Molecular dynamics simulation of swollen membrane of perfluorinated ionomer. Electrochim. Acta 2005, 50, 2847–2855. [Google Scholar]
- Cui, S.; Liu, J.; Selvan, M.E.; Paddison, S.J. A molecular dynamics study of a Nafion polyelectrolyte membrane and proton diffusion. J. Phys. Chem. B 2007, 111, 2208–2218. [Google Scholar] [CrossRef] [PubMed]
- Maiti, T.K.; Singh, J.; Dixit, P.; Majhi, J.; Bhushan, S.; Bandyopadhyay, A.; Chattopadhyay, S. Advances in perfluorosulfonic acid-based proton exchange membranes for fuel cell applications: A review. Chem. Eng. J. Adv. 2022, 12, 100372. [Google Scholar] [CrossRef]
- Elliott, J.A.; Hanna, S.; Windle, A.H. Atomistic simulation and molecular dynamics of model systems for hydrated perfluorinated ionomer membranes. Phys. Chem. Chem. Phys. 1999, 1, 4855–4863. [Google Scholar] [CrossRef]
- Jinnouchi, R.; Okazaki, S. Molecular dynamics study of transport phenomena in a hydrated Nafion membrane. J. Electrochem. Soc. 2003, 150, E66–E73. [Google Scholar] [CrossRef]
- Jinnouchi, R.; Kodama, K.; Morimoto, Y. Molecular dynamics simulations on O2 permeation through Nafion membranes. J. Phys. Chem. C 2016, 120, 8221–8230. [Google Scholar]
- Bazaid, M.; Huang, Y.; Goddard, W.A.; Jang, S.S. Proton transport through interfaces in nanophase-separation of hydrated aquivion membrane: Molecular dynamics simulation approach. Colloids Surf. A 2023, 676, 132187. [Google Scholar] [CrossRef]
- Han, Z.Y.; Pei, S.P.; Yu, C.Y.; Zhou, Y.F. Molecular Dynamics Simulation Studies on the Micromorphology and Proton Transport of Nafion/Ti3C2Tx Composite Membrane. Chin. J. Polym. Sci. 2024, 42, 373–387. [Google Scholar] [CrossRef]
- Kang, K.; Kim, J.; Kim, S.; Kim, T. Nanostructures of Nafion film at platinum: a molecular dynamics study. J. Membr. Sci. 2020, 598, 117671. [Google Scholar]
- Cheng, X.; Subramaniam, B.; Huber, G.W. Nanostructures of Nafion thin films at platinum interfaces. J. Phys. Chem. C 2010, 114, 18929–18936. [Google Scholar]
- Ren, K.; Liu, X.; Rao, Z. Effect of temperature and external electric field on proton transport in ordered and amorphous proton exchange membranes: A molecular dynamics study. Int. J. Hydrogen Energy 2024, 54, 1422–1435. [Google Scholar] [CrossRef]
- Ghielmi, A.; Vaccarono, P.; Troglia, C.; Arcella, V. Proton exchange membranes based on the short-side-chain perfluorinated ionomer. J. Power Sources 2005, 145, 108–115. [Google Scholar] [CrossRef]
- Schmid, N.; Eichenberger, A.P.; Choutko, A.; Riniker, S.; Winger, M.; Mark, A.E.; van Gunsteren, W.F. Definition and testing of the GROMOS force-field versions 54A7 and 54B7. Eur. Biophys. J. 2011, 40, 843–856. [Google Scholar] [CrossRef] [PubMed]
- Malde, A.K.; Zuo, L.; Breeze, M.; Stroet, M.; Poger, D.; Nair, P.C.; Oostenbrink, C.; Mark, A.E. An Automated Force Field Topology Builder (ATB) and Repository: Version 1.0. J. Chem. Theory Comput. 2011, 7, 4026–4037. [Google Scholar] [CrossRef] [PubMed]
- Stroet, M.; Caron, B.; Visscher, K.M.; Geerke, D.P.; Malde, A.K.; Mark, A.E. Automated Topology Builder Version 3.0: Prediction of Solvation Free Enthalpies in Water and Hexane. J. Chem. Theory Comput. 2018, 14, 5834–5845. [Google Scholar] [CrossRef] [PubMed]
- Pérez de la Luz, A.; Aguilar-Pineda, J.A.; Méndez-Bermúdez, J.G.; Alejandre, J. Force field parameterization from the Hirshfeld molecular electronic density. J. Chem. Theory Comput. 2018, 14, 5949–5958. [Google Scholar] [CrossRef] [PubMed]
- Núñez-Rojas, E.; García-Melgarejo, V.; Pérez de la Luz, A.; Alejandre, J. Systematic parameterization procedure to develop force fields for molecular fluids using explicit water. Fluid Phase Equilibria 2019, 490, 1–12. [Google Scholar] [CrossRef]
- Carmona-Espíndola, J.; Núñez-Rojas, E.; García-Melgarejo, V.; Gázquez, J.L.; Alejandre, J. Constrained dipole moment density functional theory for charge distributions in force fields for the study of molecular fluids. J. Chem. Phys. 2020, 152, 124116. [Google Scholar] [CrossRef] [PubMed]
- Abascal, J.L.F.; Sanz, E.; García Fernández, R.; Vega, C. A potential model for the study of ices and amorphous water: TIP4P/Ice. J. Chem. Phys. 2005, 122, 234511. [Google Scholar] [CrossRef] [PubMed]
- Berendsen, H.J.C.; Grigera, R.J.; Straatsma, T.P. The missing term in effective pair potentials. J. Phys. Chem. 1987, 91, 6269–6271. [Google Scholar] [CrossRef]
- Luis, D.P.; Herrera-Hernández, E.C.; Saint-Martin, H. A theoretical study of the dissociation of the sI methane hydrate induced by an external electric field. J. Chem. Phys. 2015, 143, 204503. [Google Scholar] [CrossRef] [PubMed]
- Luis, D.P.; González-Calderón, A.; López-Lemus, J. Effects of externally-applied static electric fields on hydrogen hydrates: a molecular dynamics study. Mol. Simul. 2023, 49, 1552–1560. [Google Scholar] [CrossRef]
- Hsu, W.Y.; Gierke, T.D. Ion transport and clustering in Nafion perfluorinated membranes. J. Membr. Sci. 1983, 13, 307–326. [Google Scholar] [CrossRef]
- Day, T.J.F.; Soudackov, A.V.; Čuma, M.; Schmitt, U.W.; Voth, G.A. A second generation multistate empirical valence bond model for proton transport in aqueous systems. J. Chem. Phys. 2002, 117, 5839–5849. [Google Scholar] [CrossRef]
- van Duin, A.C.T.; Dasgupta, S.; Lorant, F.; Goddard, W.A. ReaxFF: A Reactive Force Field for Hydrocarbons. J. Phys. Chem. A 2001, 105, 9396–9409. [Google Scholar] [CrossRef]
Figure 1.
Snapshot of molecular model of single Nafion polymer.
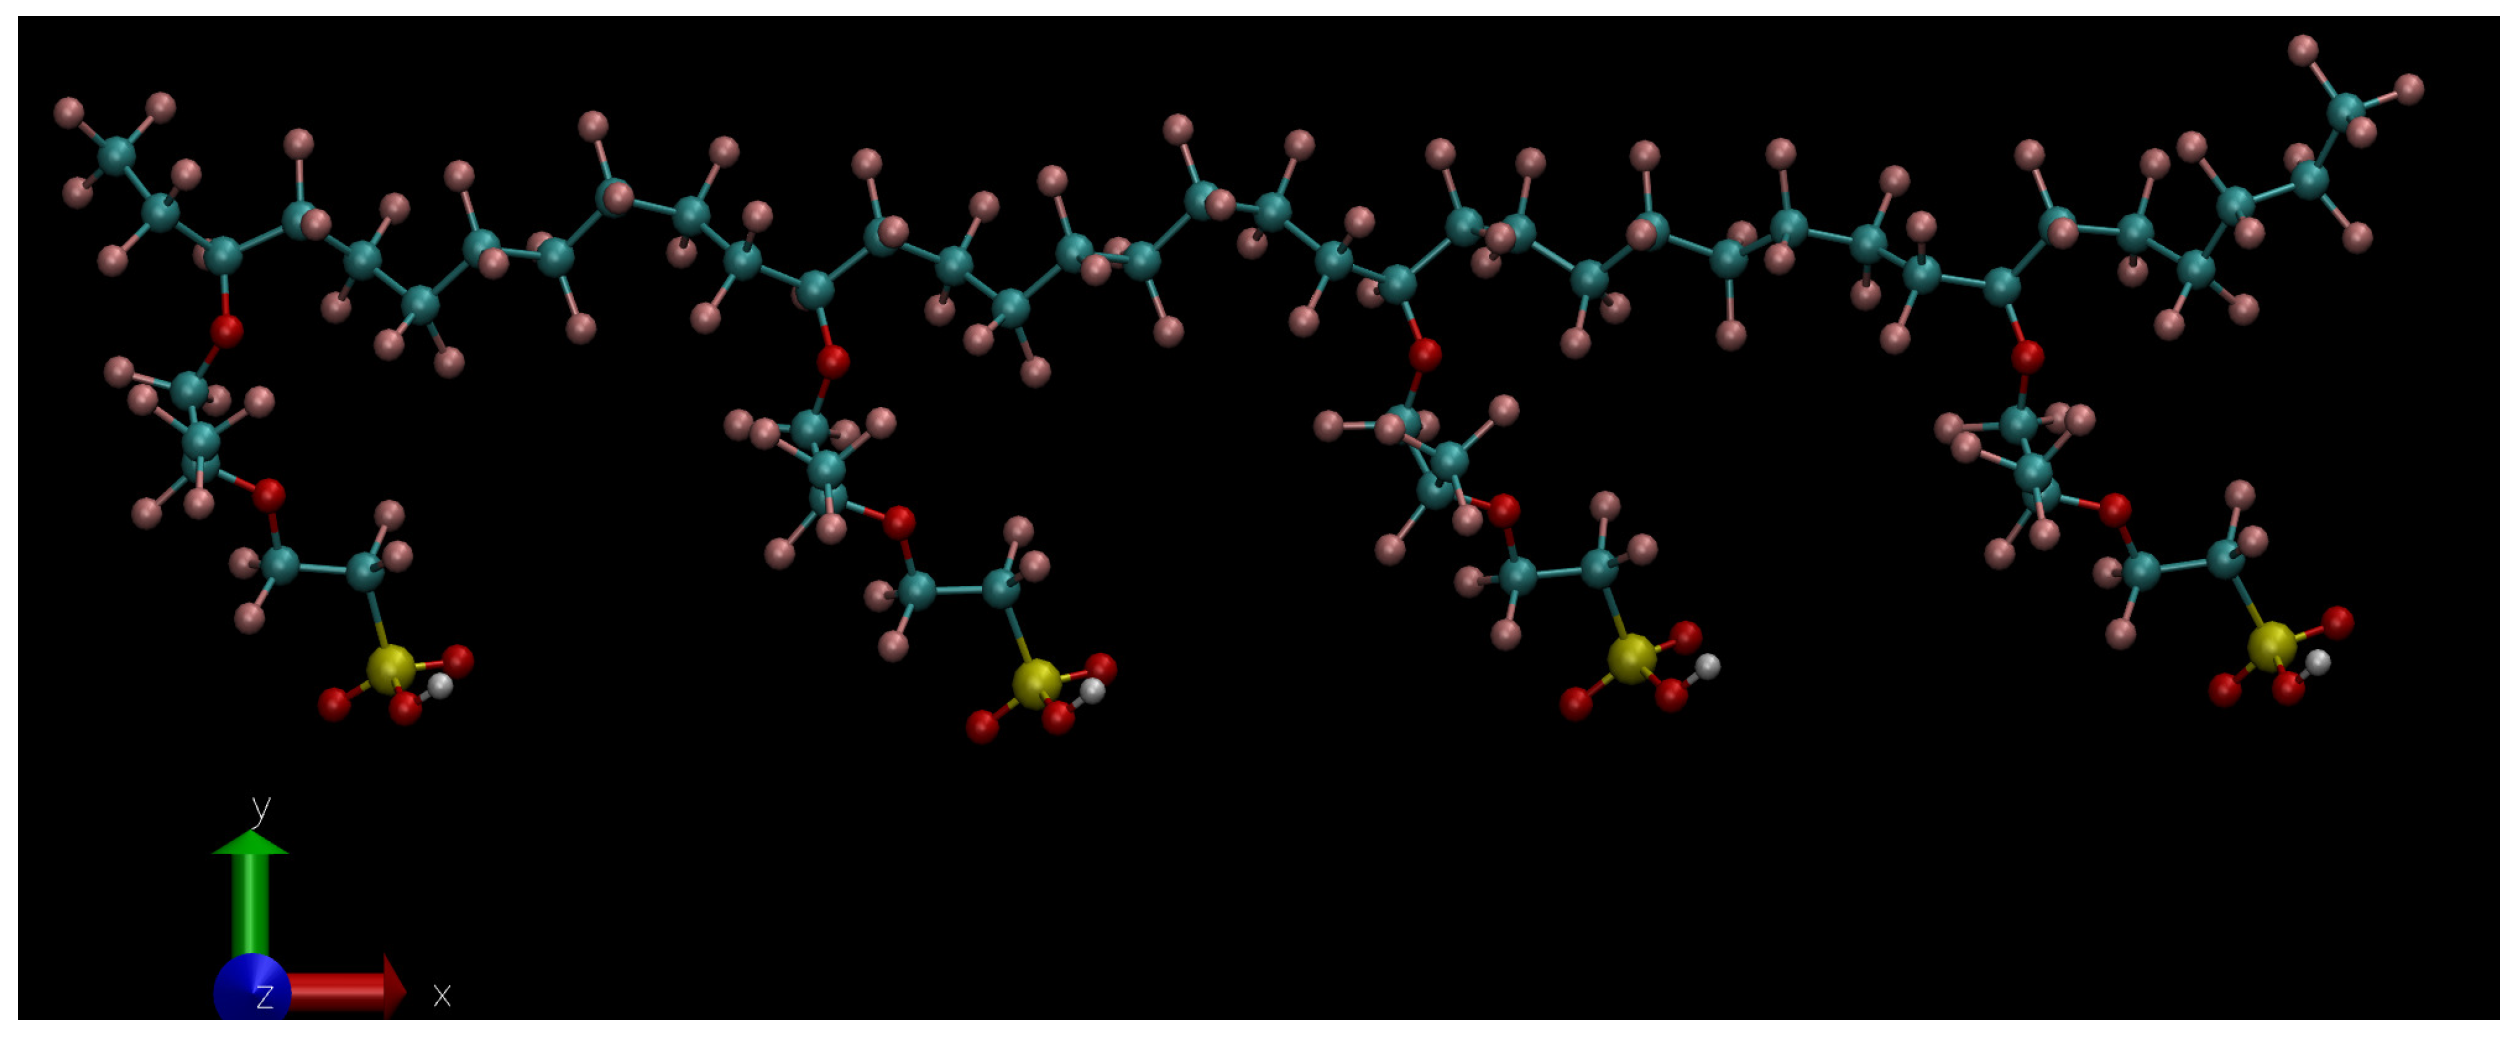
Figure 2.
Chemical structure of the perfluoroether side chain terminated by a sulfonic acid group (). Nafion monomer used in the simulations consist in a backbone formed by perfluorinated units () with 4 side chains attached to the 4 CF units.
Figure 2.
Chemical structure of the perfluoroether side chain terminated by a sulfonic acid group (). Nafion monomer used in the simulations consist in a backbone formed by perfluorinated units () with 4 side chains attached to the 4 CF units.
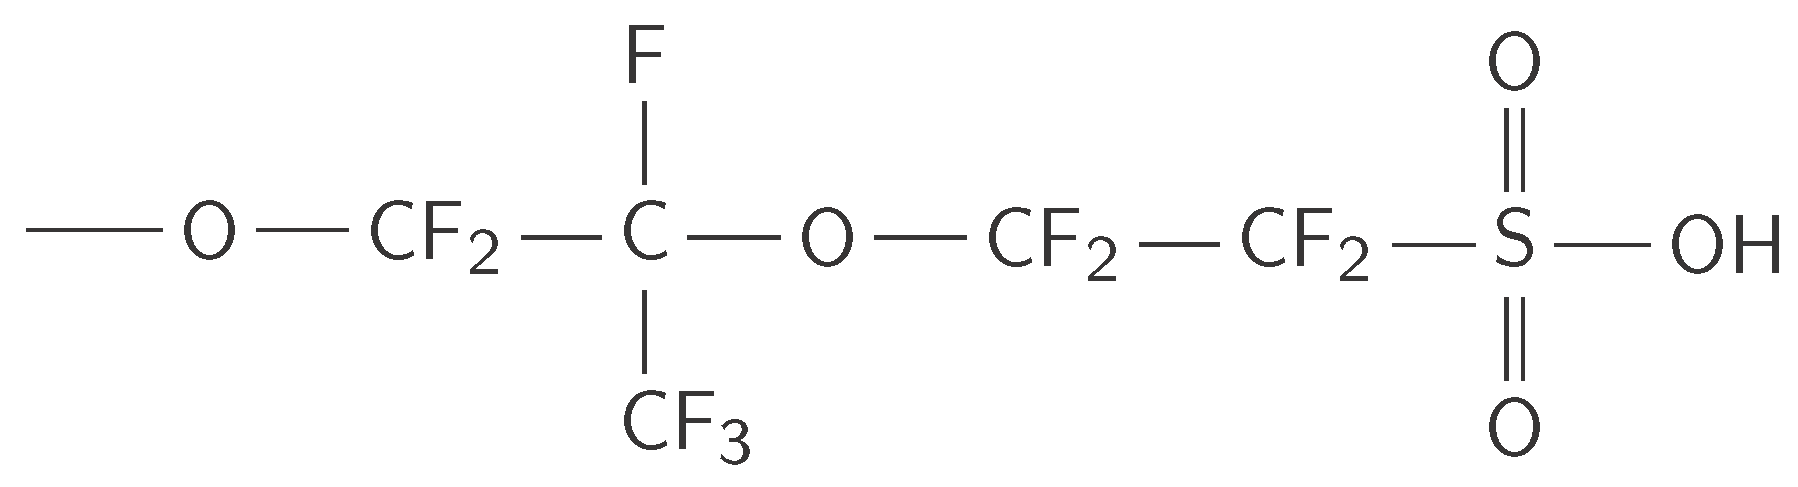
Figure 3.
Snapshot of the system with .
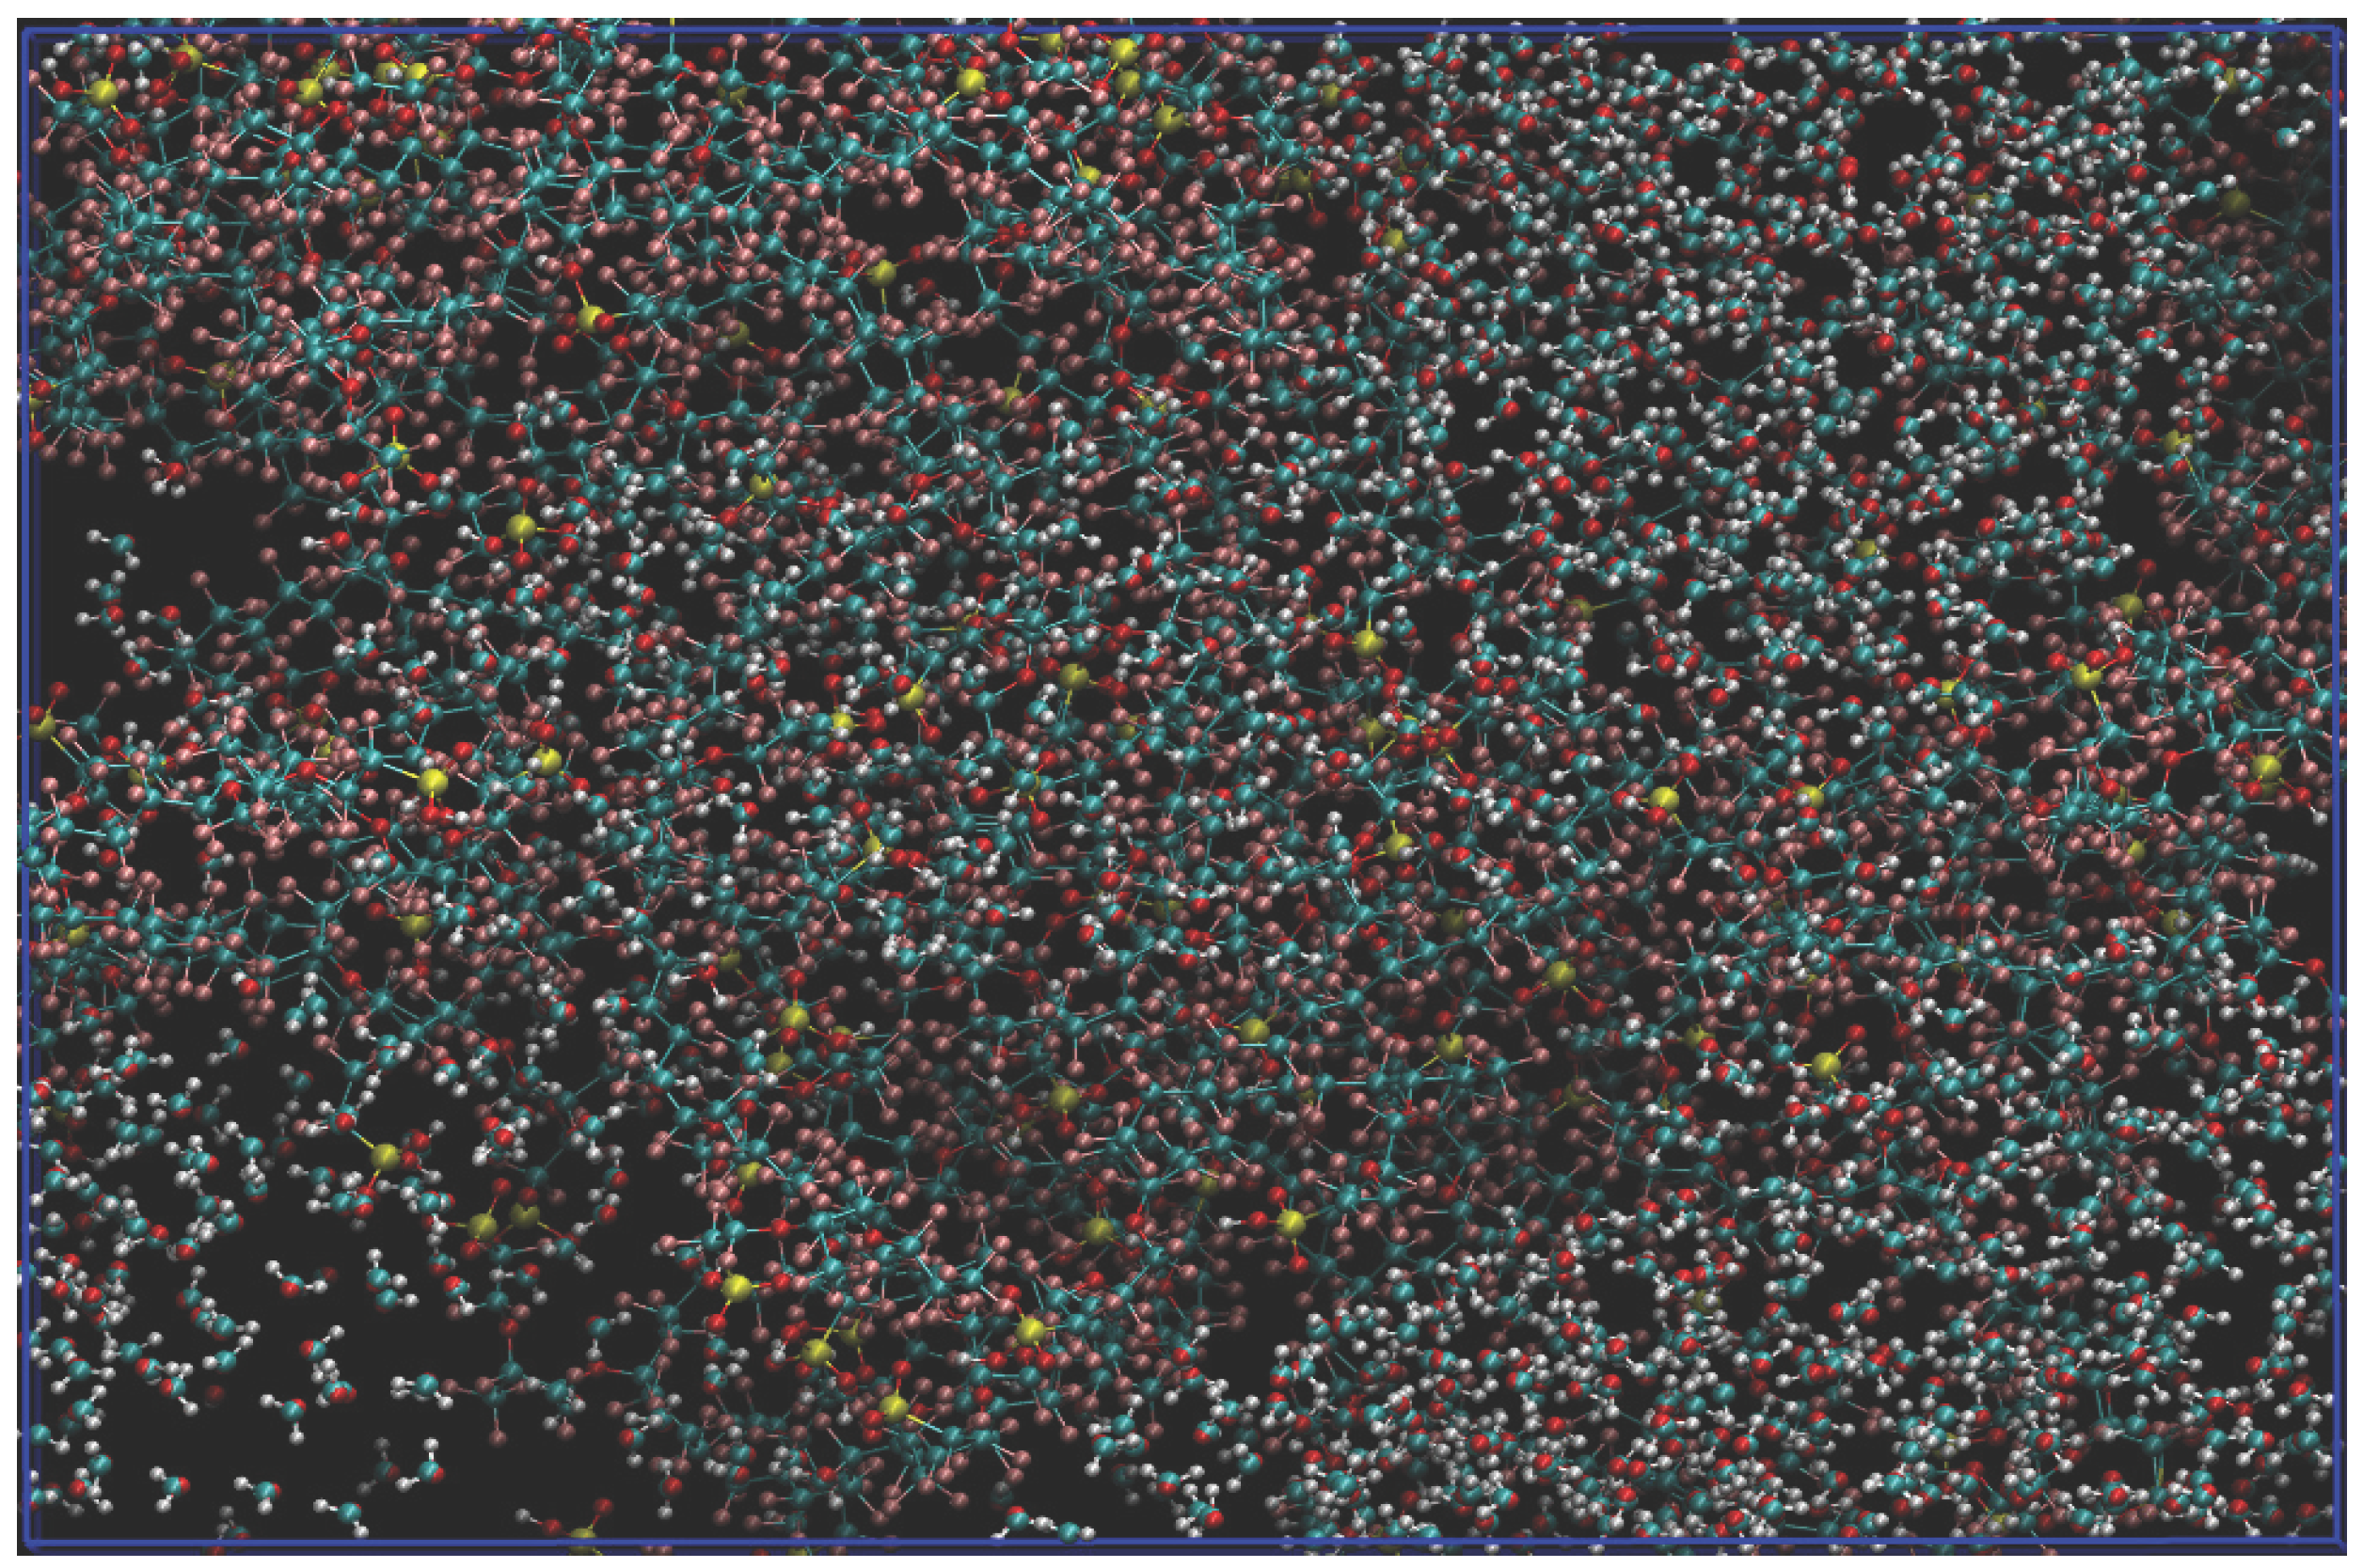
Figure 4.
Static dielectric constant of the aqueous subsystem as a function of hydration level at zero field, obtained from the Kirkwood–Fröhlich dipole fluctuation formula applied to the water molecules only. This is the only field condition under which the fluctuation formula defines an equilibrium dielectric constant; increases from at to at , driven by the collective dipolar correlations that develop as the aqueous domains percolate. Error bars are the standard deviation across four 2 ns blocks; the scatter is largest at , where the slowly relaxing collective dipole is hardest to converge within the fixed sampling window.
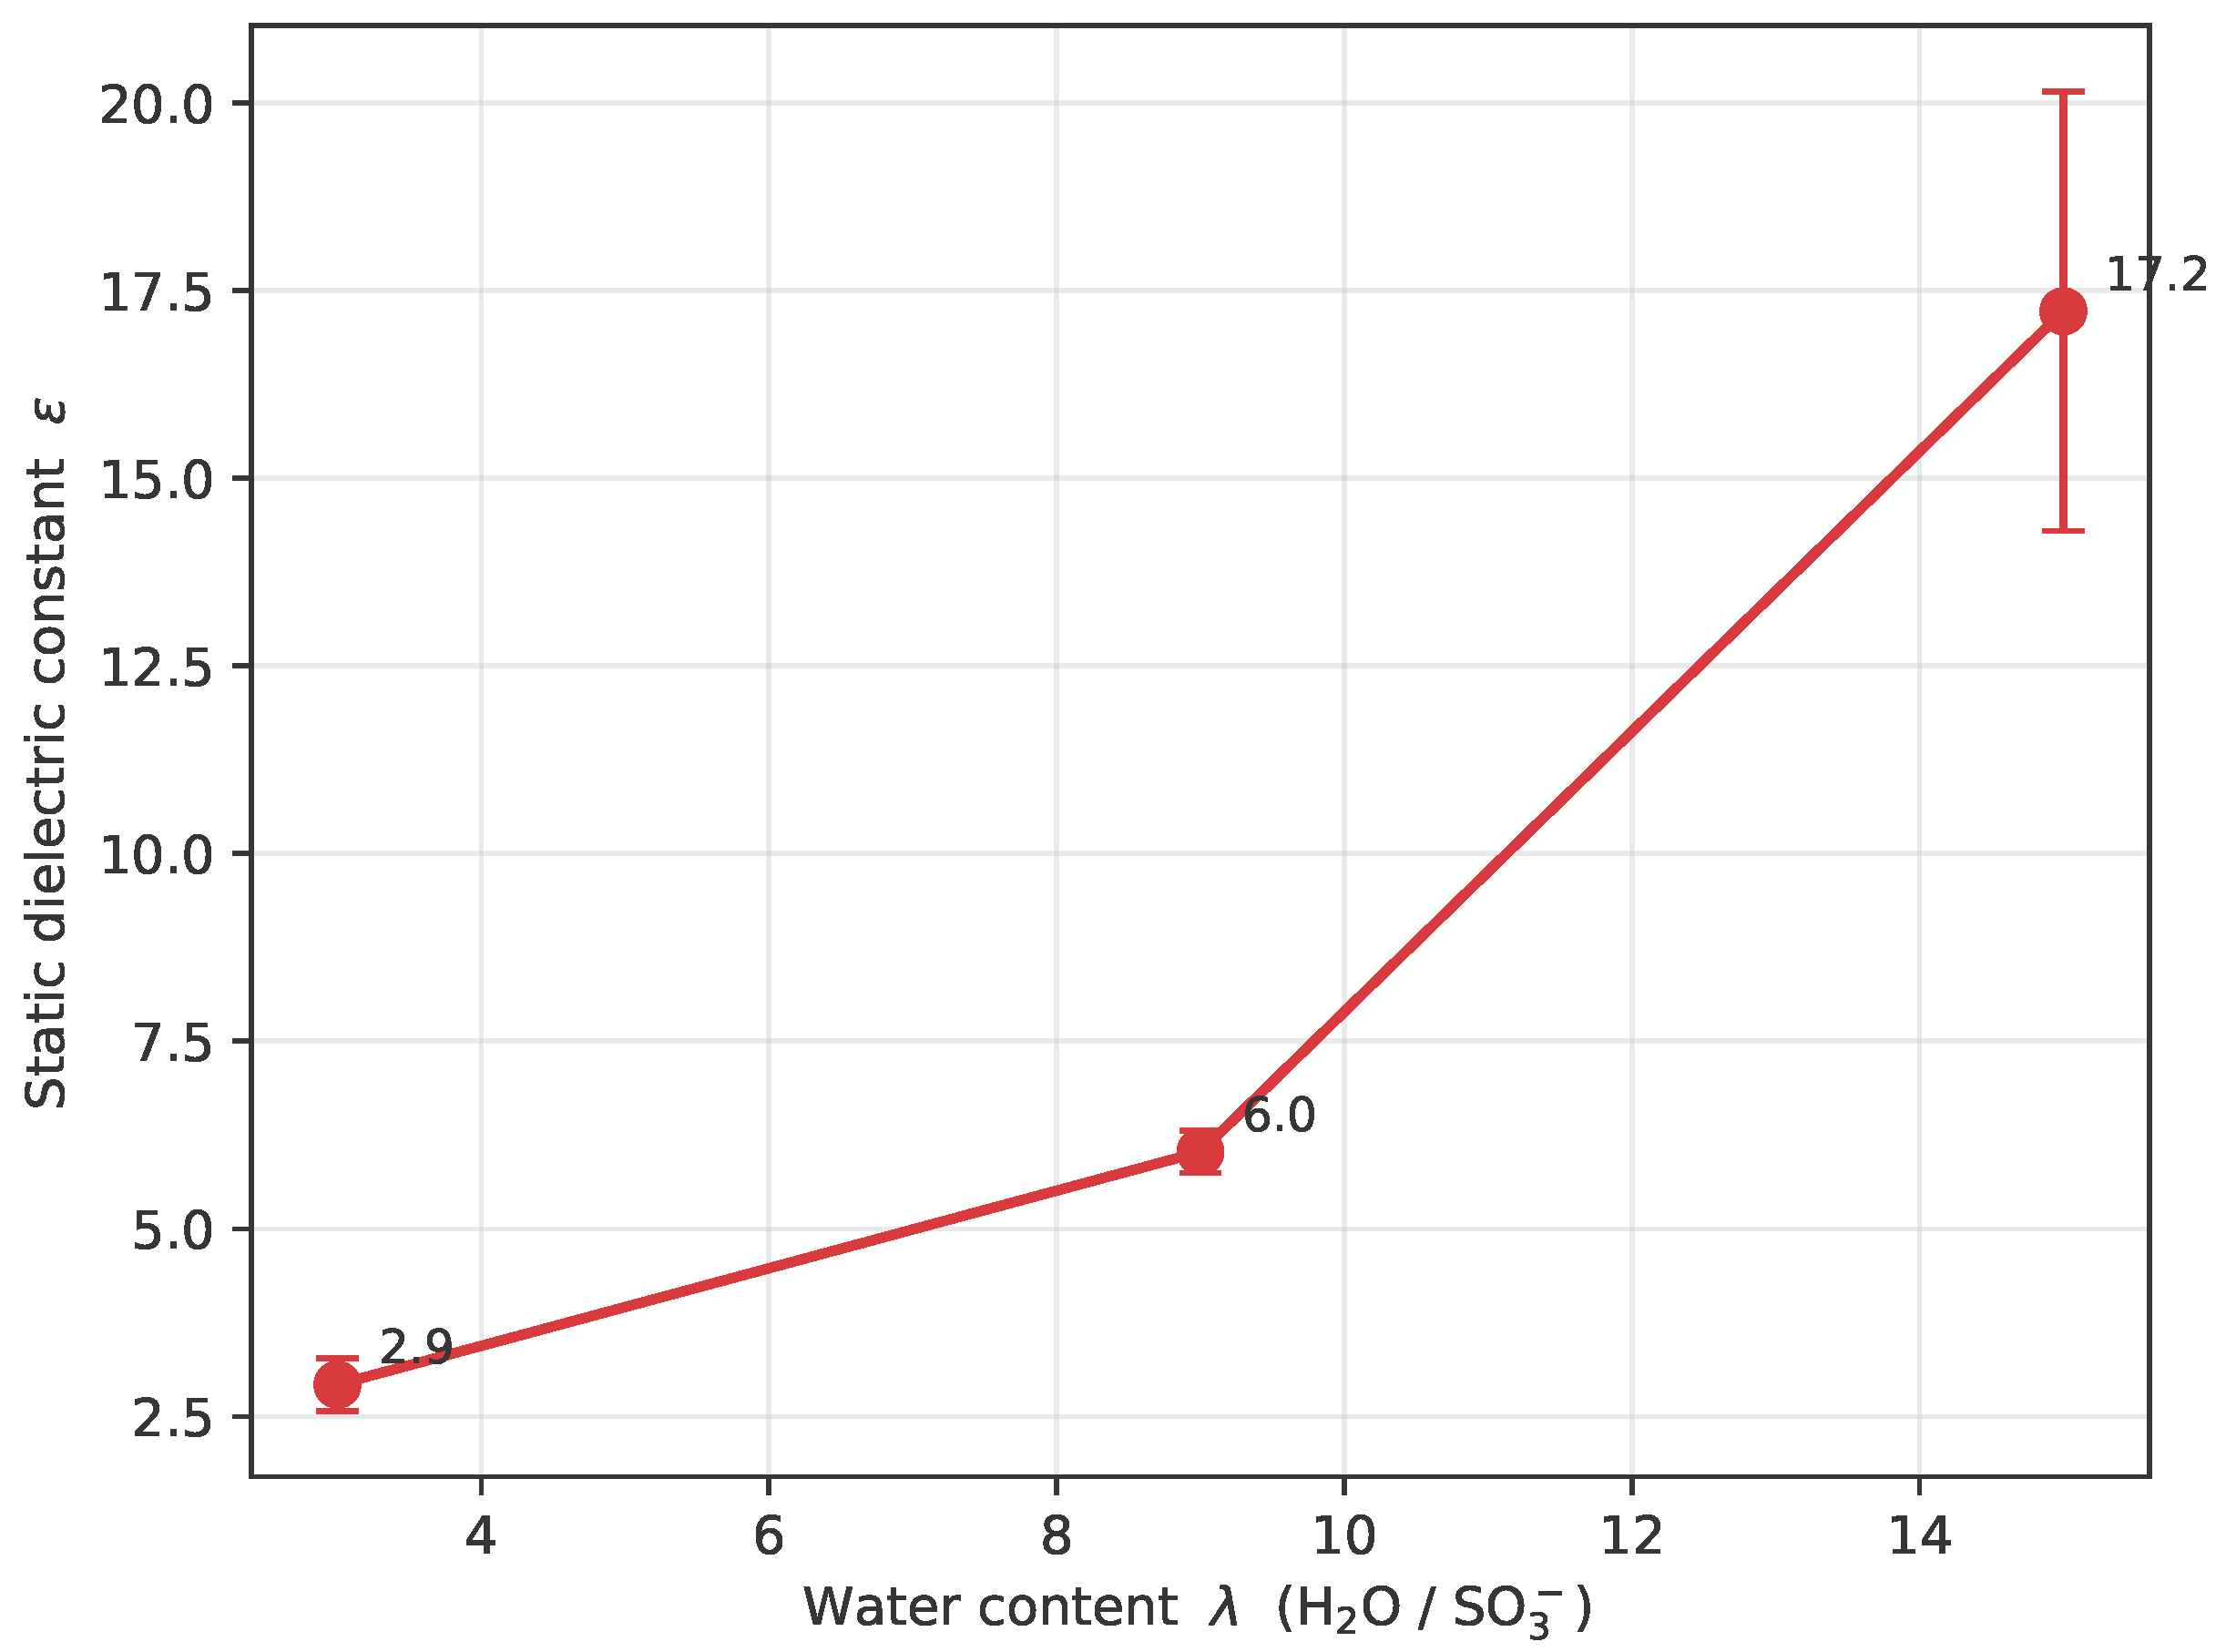
Figure 5.
Longitudinal total dipole of the aqueous subsystem vs. applied field E for each . The rise is steep at low fields and the approach to saturation is gradual; both the saturated magnitude and the field needed to reach it grow with hydration (, 2, and 3–4 V nm−1 for , 9, and 15, respectively).
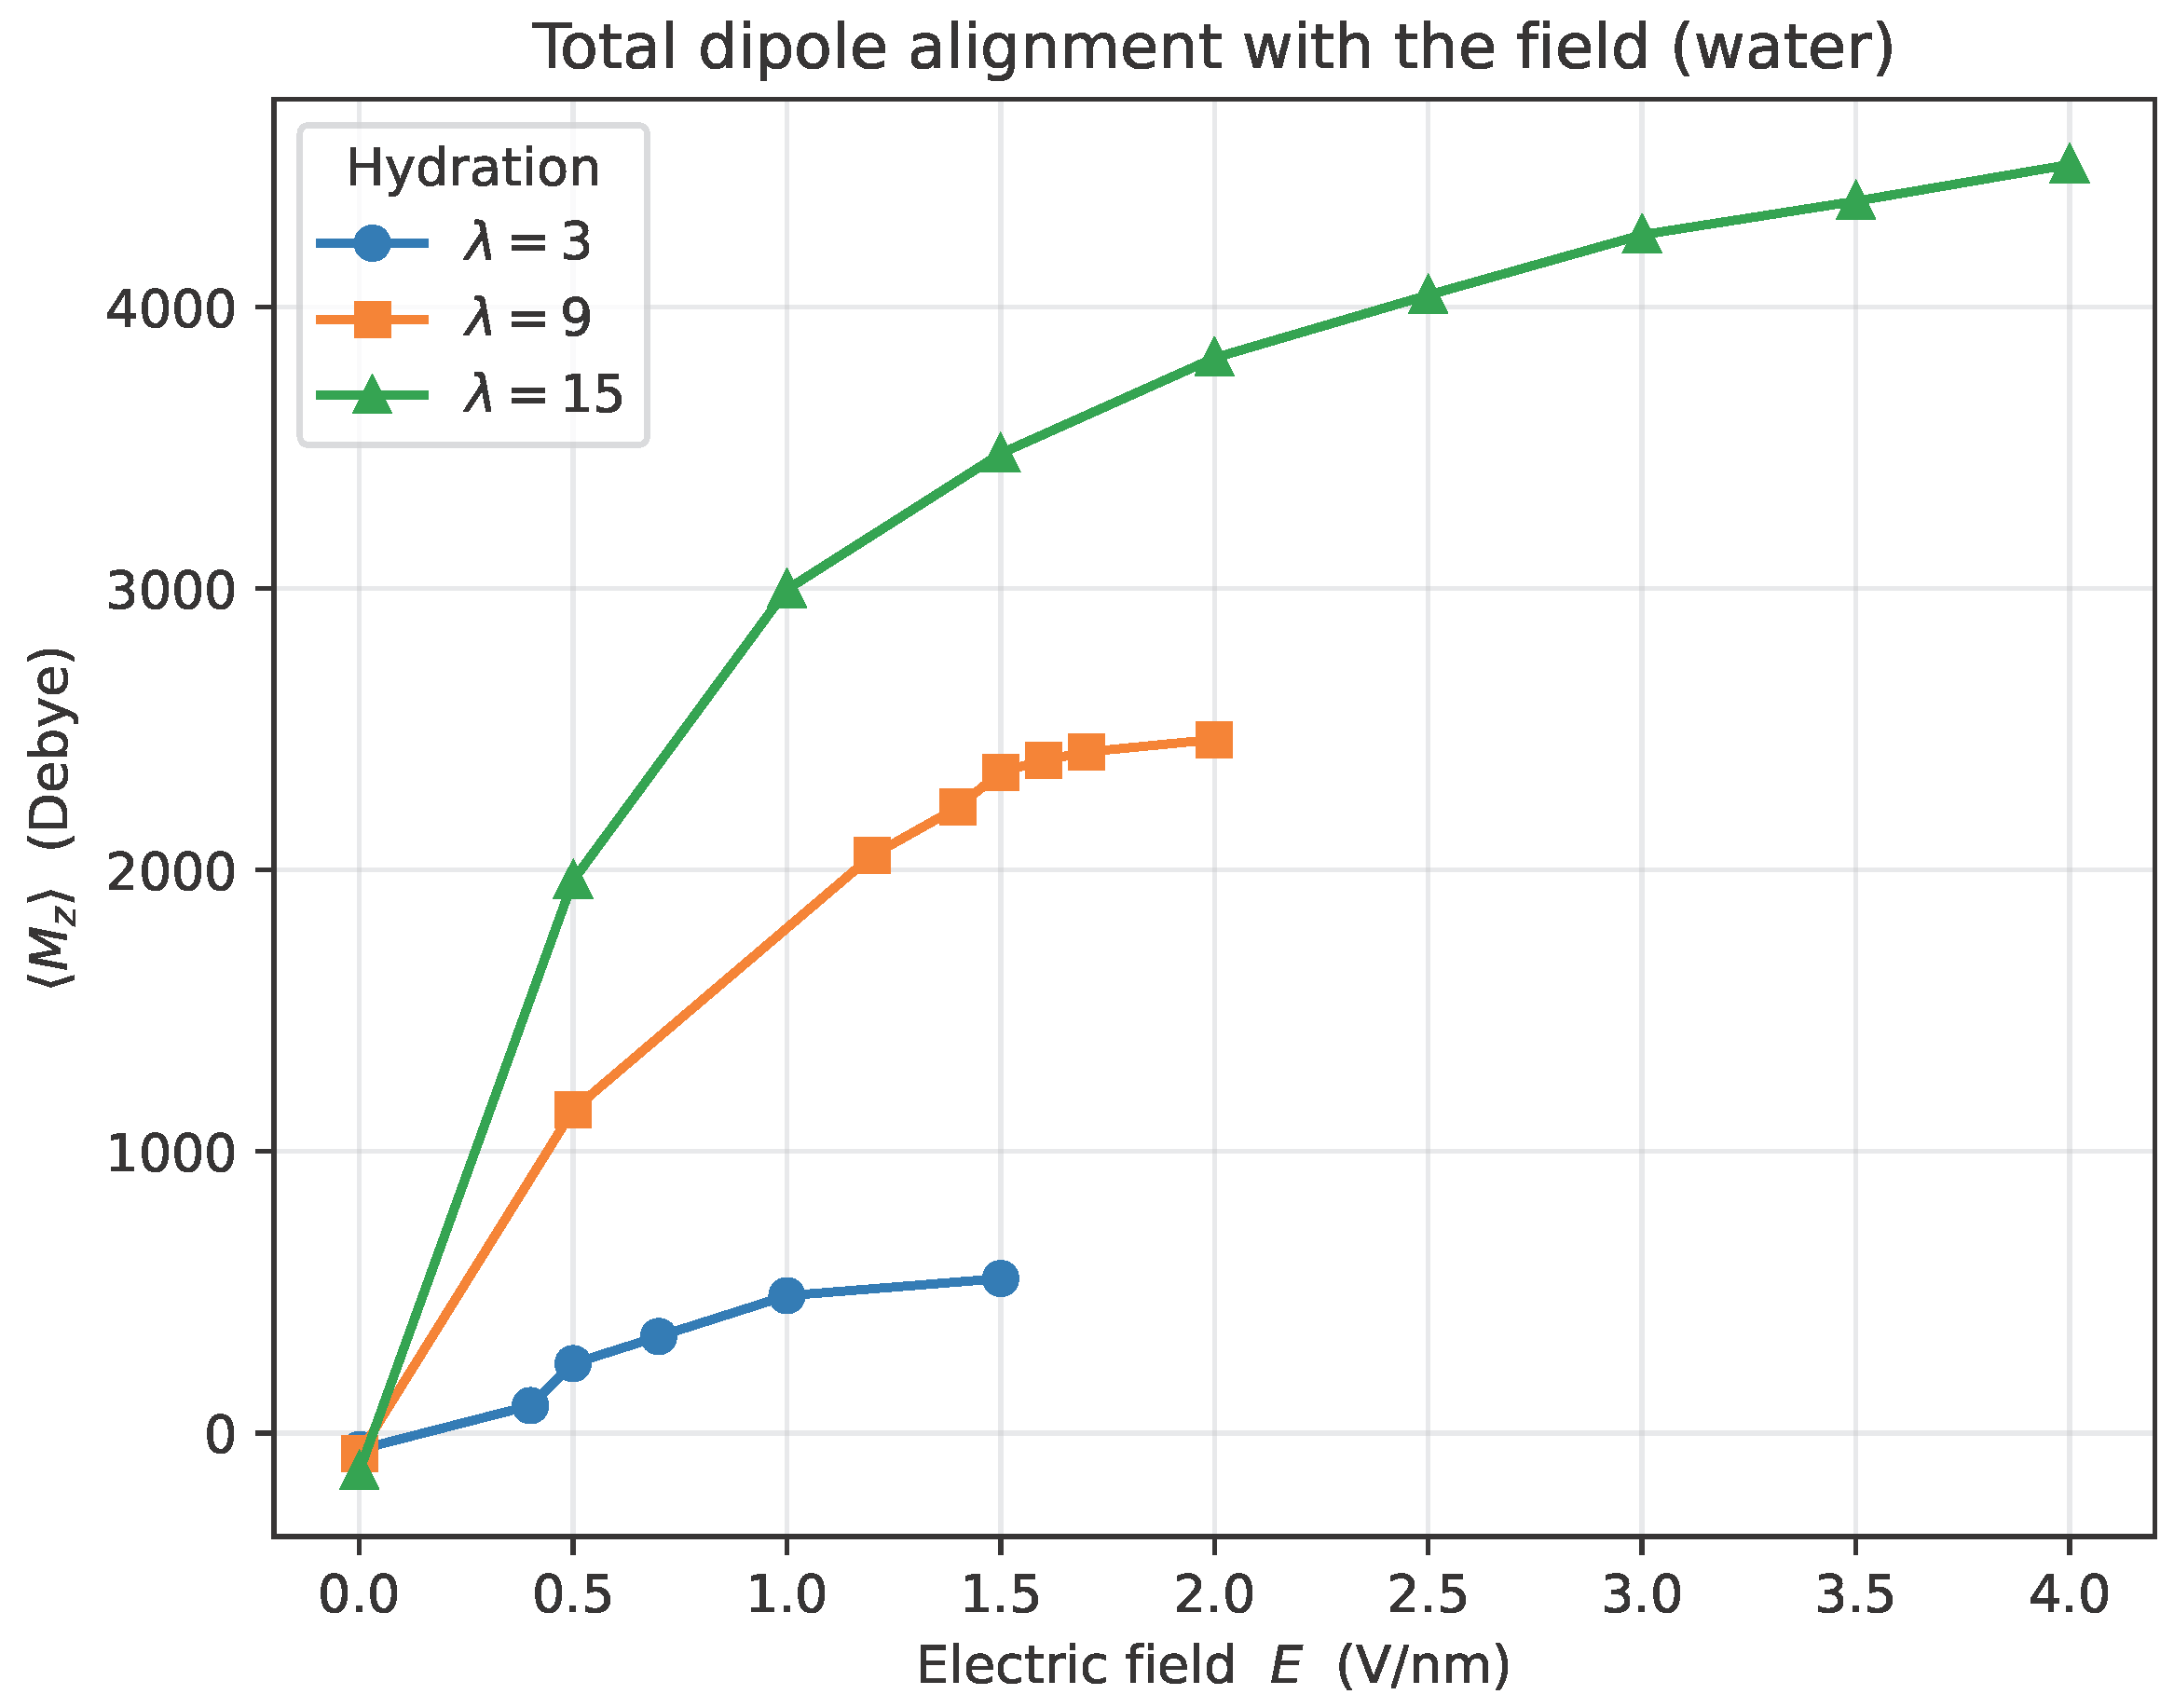
Figure 6.
Alignment fraction of the aqueous subsystem (computed per frame and averaged) vs. applied field E for each . It rises from the near-isotropic zero-field value (–) to already at V nm−1 for and 15, and by V nm−1 for : the orientation of the collective water dipole locks onto the field at fields well below those at which its magnitude saturates (cf. Figure 5).
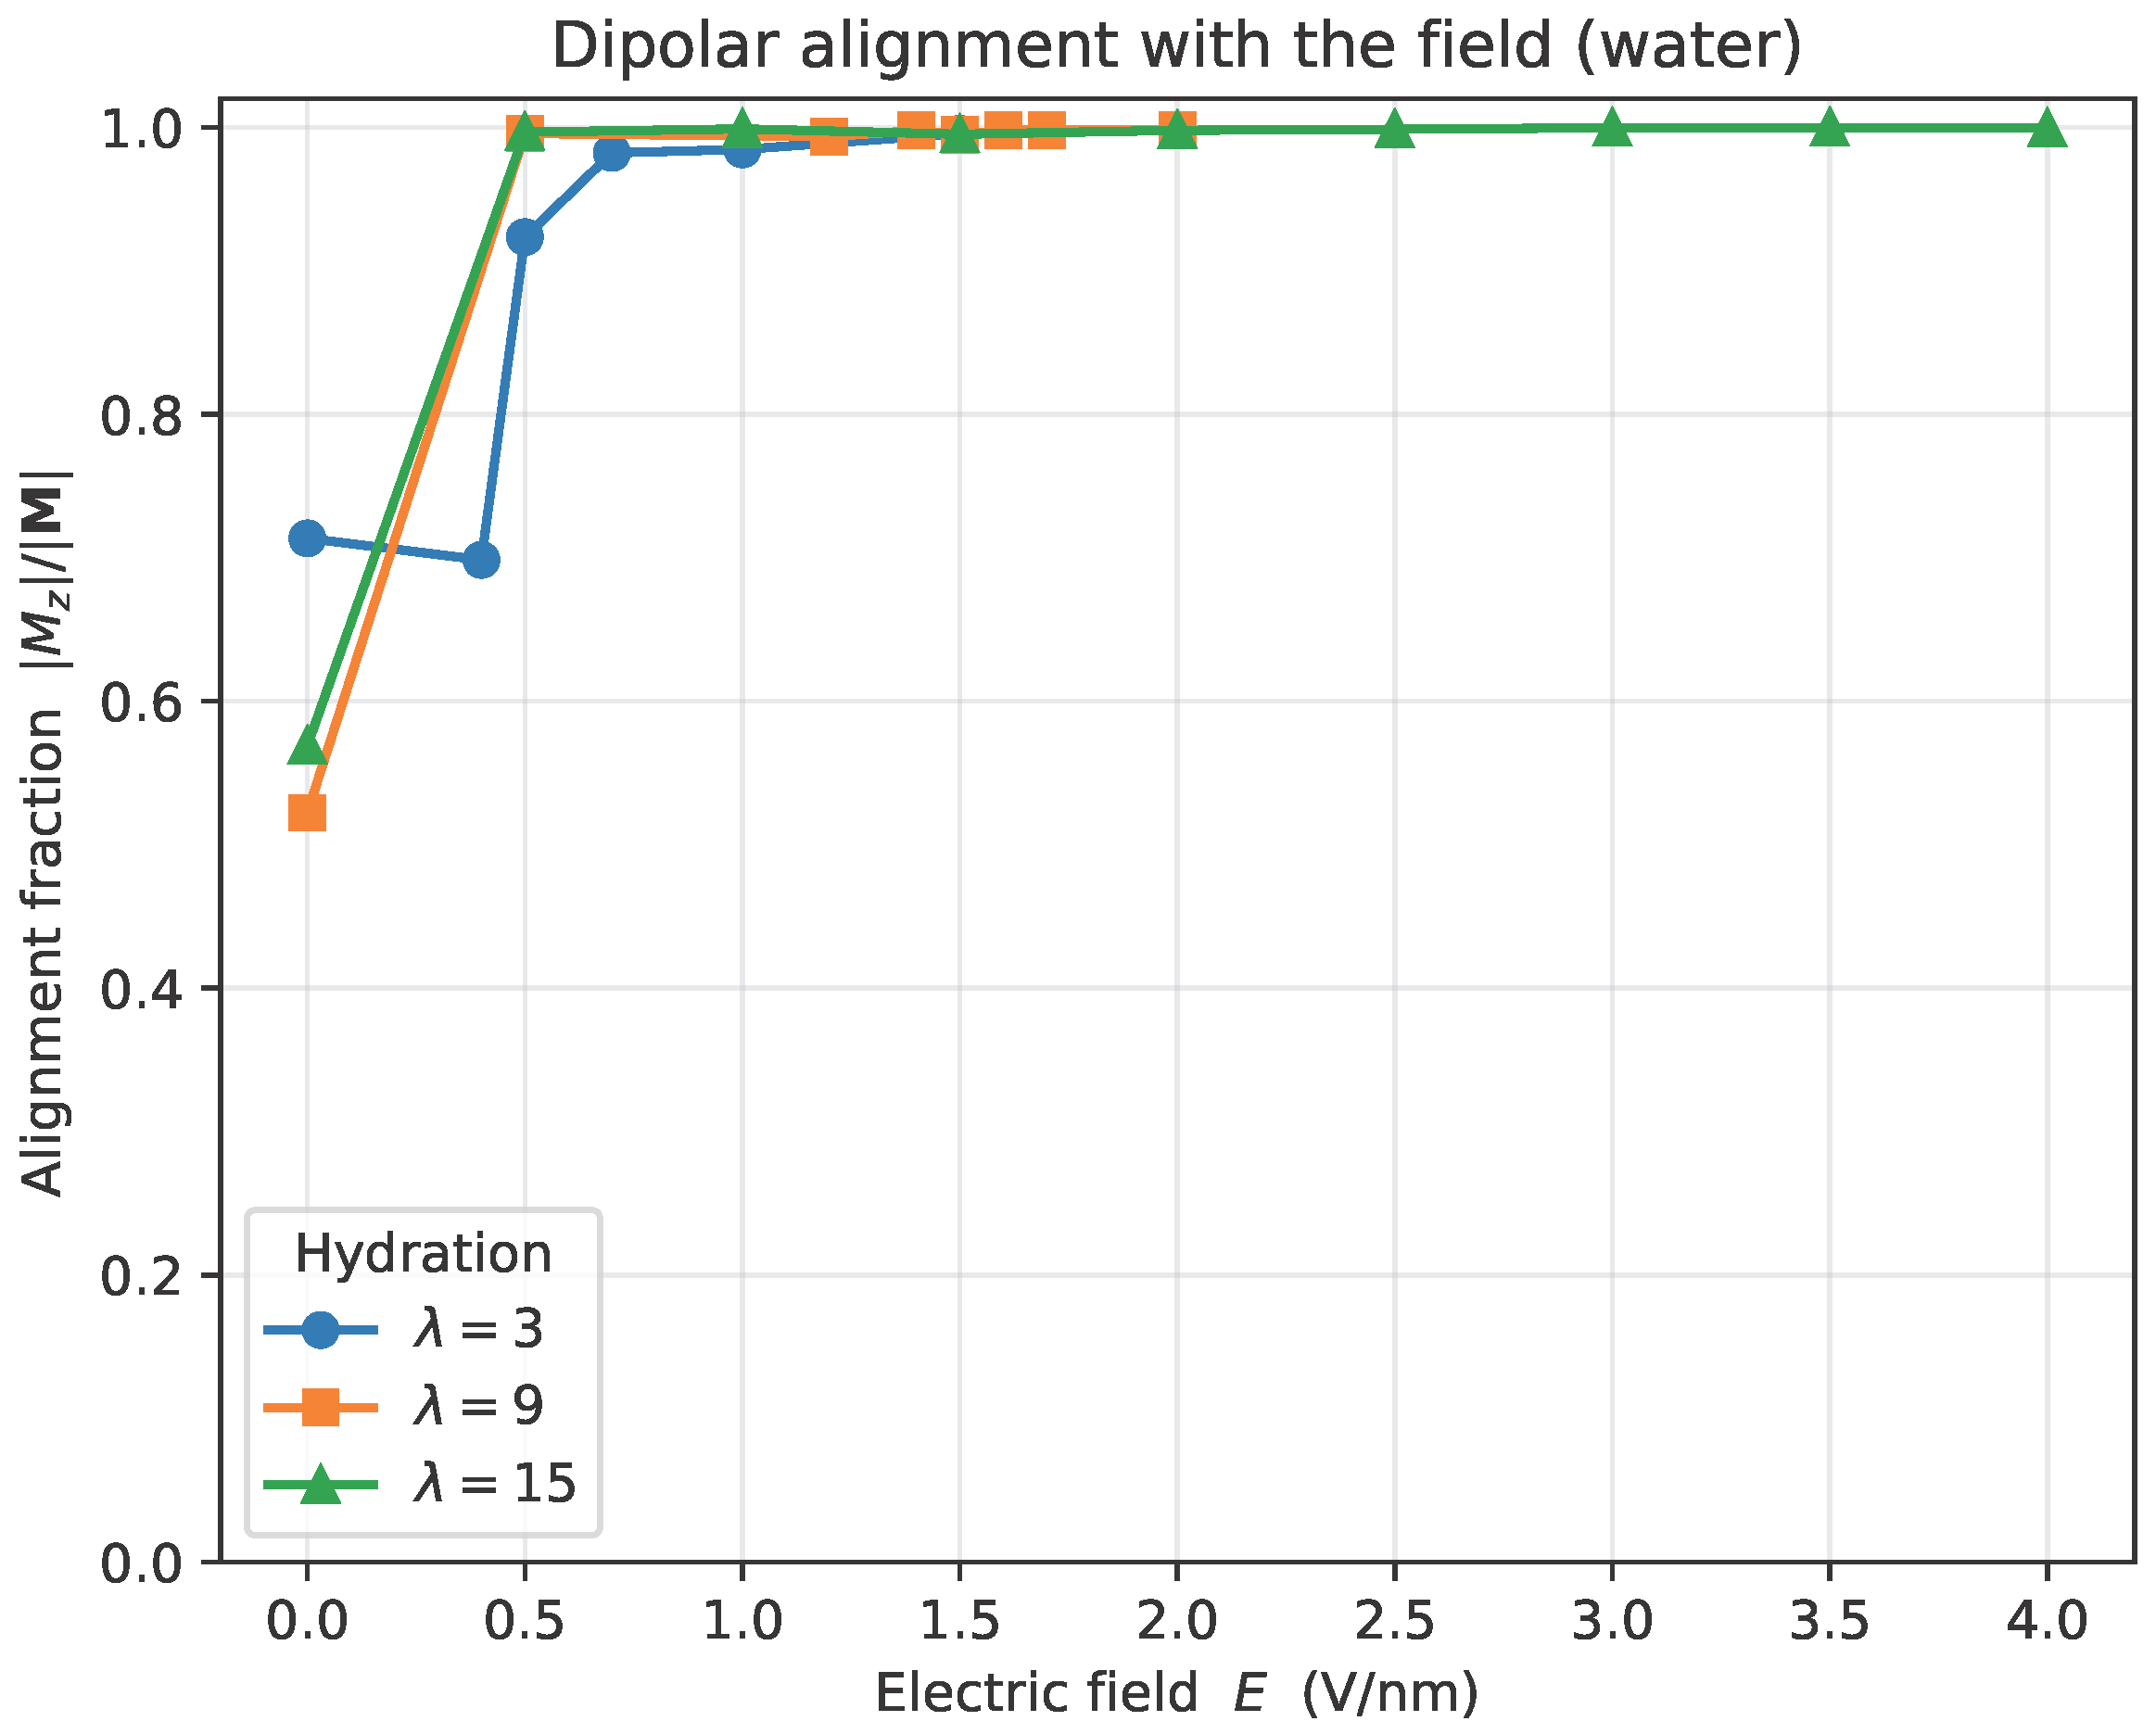
Figure 7.
Diffusion coefficient D of H3O+ as a function of the applied electric field E for , 9 and 15 (logarithmic vertical scale). Filled markers with solid lines denote the diffusive regime used in the quantitative analysis; open markers with dashed lines denote the drift-dominated regime, where the apparent D jumps by several orders of magnitude. Vertical dotted lines mark the onset of field-driven drift, which shifts to higher fields as increases (, and for , 9 and 15). The drift-regime points are shown to demonstrate the onset but are excluded from the diffusive analysis.
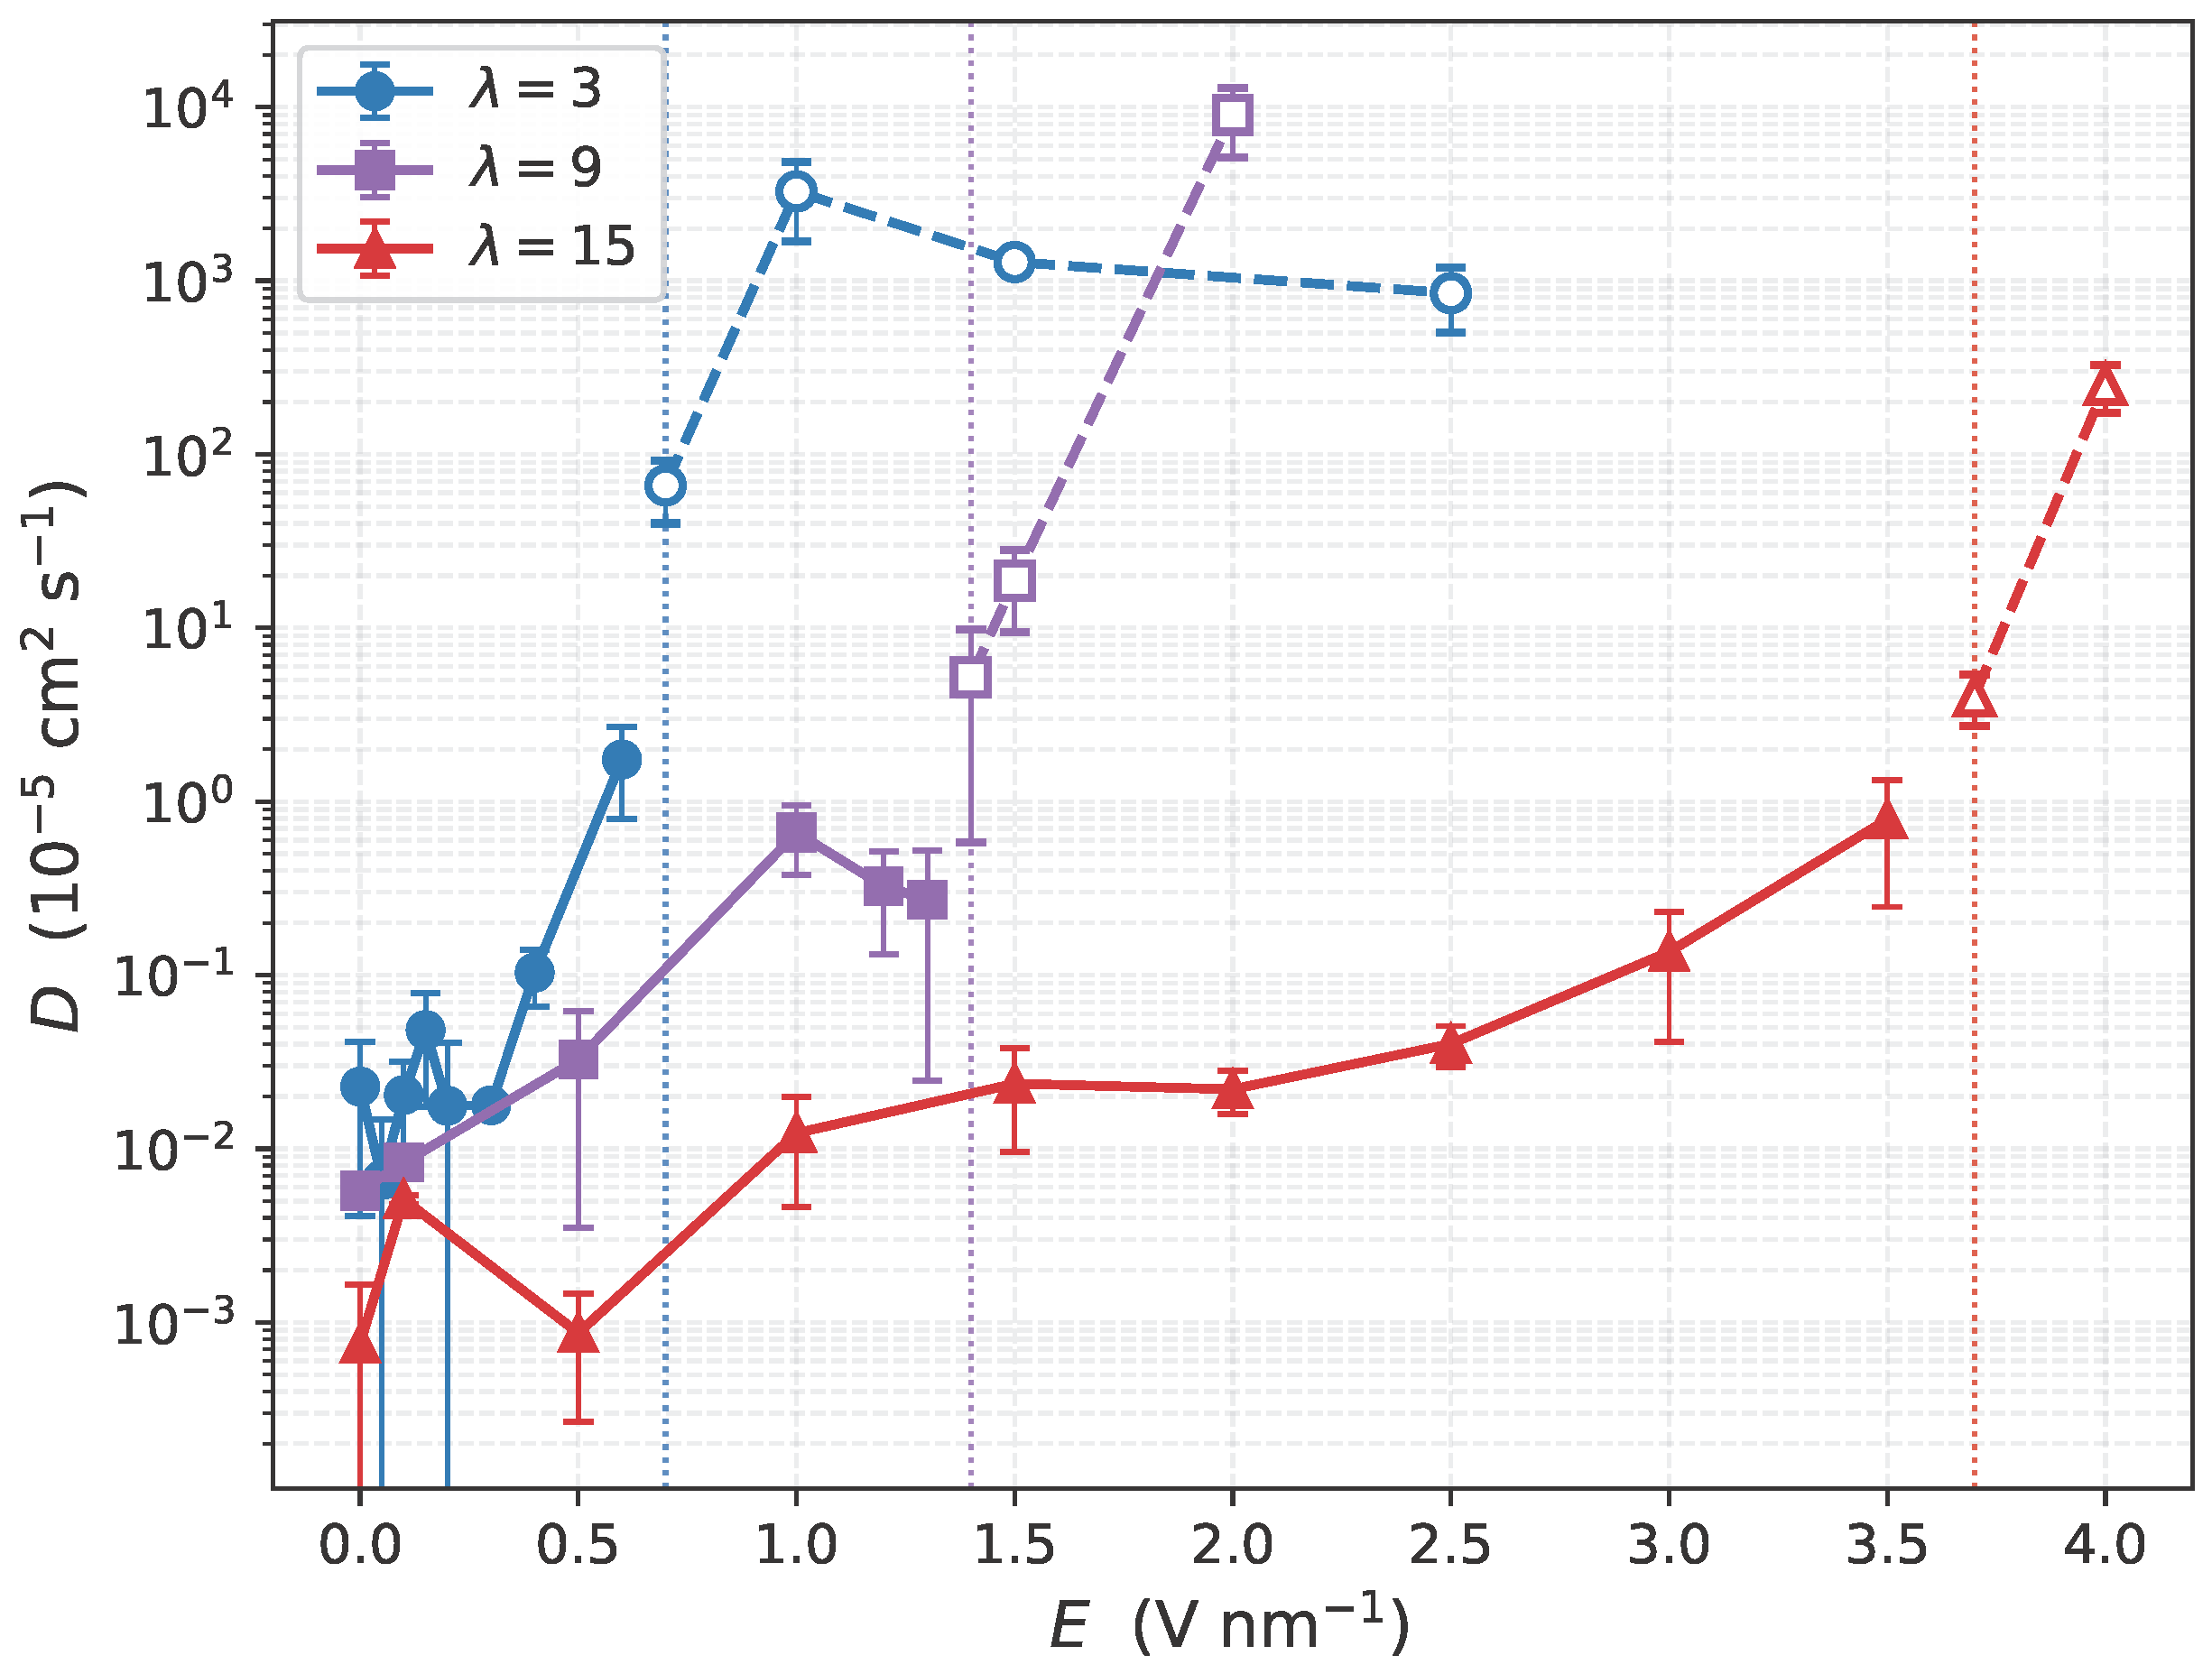
Figure 8.
Radial distribution functions for S–S (top row), S–H3O+ (middle row), and S–W (bottom row) pairs, for , 9, and 15 (columns) at several applied electric fields (color scale from dark to light: low to high E). The S–S and S–W distributions are essentially field-independent below the drift onset for all hydration levels, indicating that the polymer backbone and the primary hydration shell of the sulfonate groups are not significantly restructured by the field. The S–H3O+ distribution, by contrast, shows a systematic nonmonotonic evolution with E, discussed quantitatively in Figure 9.
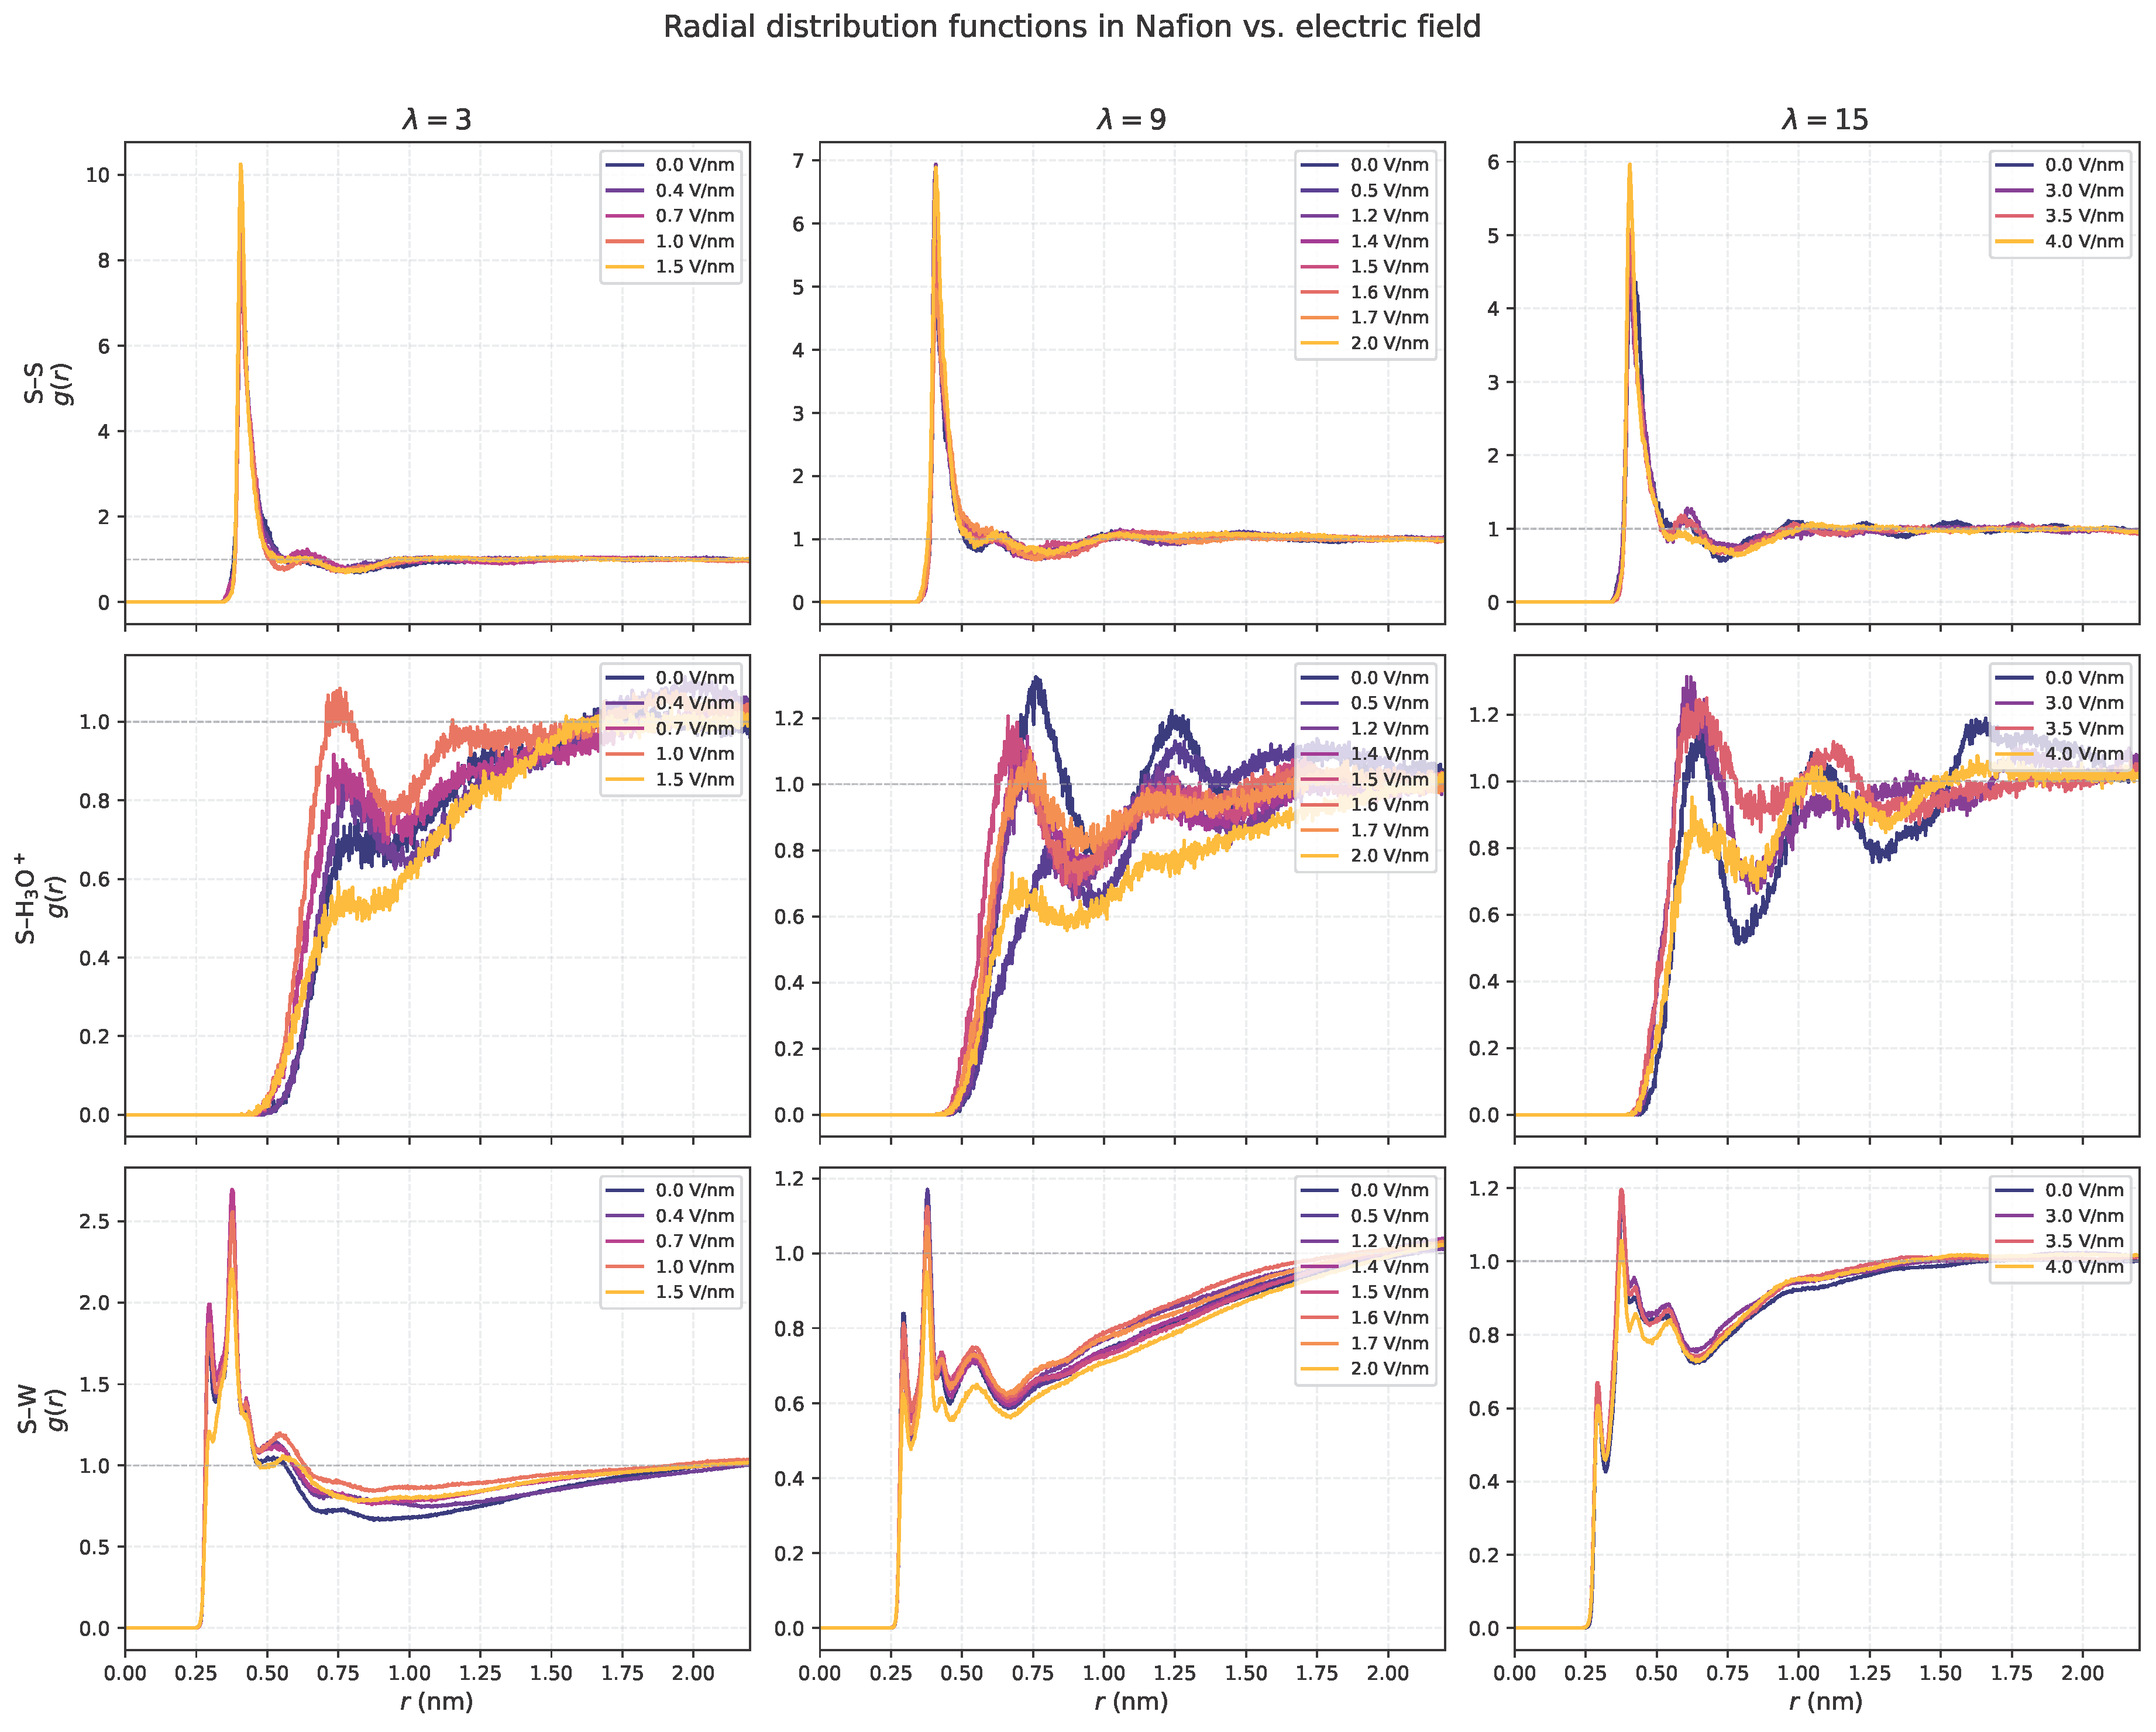
Figure 9.
Height of the first peak of the radial distribution functions as a function of applied field E for S–S (left), S–H3O+ (center), and S–W (right), for , 9, and 15. While the S–S and S–W peak heights show no systematic field dependence below the drift onset, the S–H3O+ peak height is nonmonotonic in field for all : it rises (for after an initial low-field dip) toward a maximum near the drift-onset field and then drops once the drift regime is entered (see Figure 7). This two-stage evolution identifies the crossover from localized coordination to delocalized transport as the microscopic origin of the coupling between structure and transport. Error bars, shown where computed, are the standard deviation of over four 2 ns blocks; they are largest for S–H3O+, reflecting the limited statistics of the dilute hydronium population.
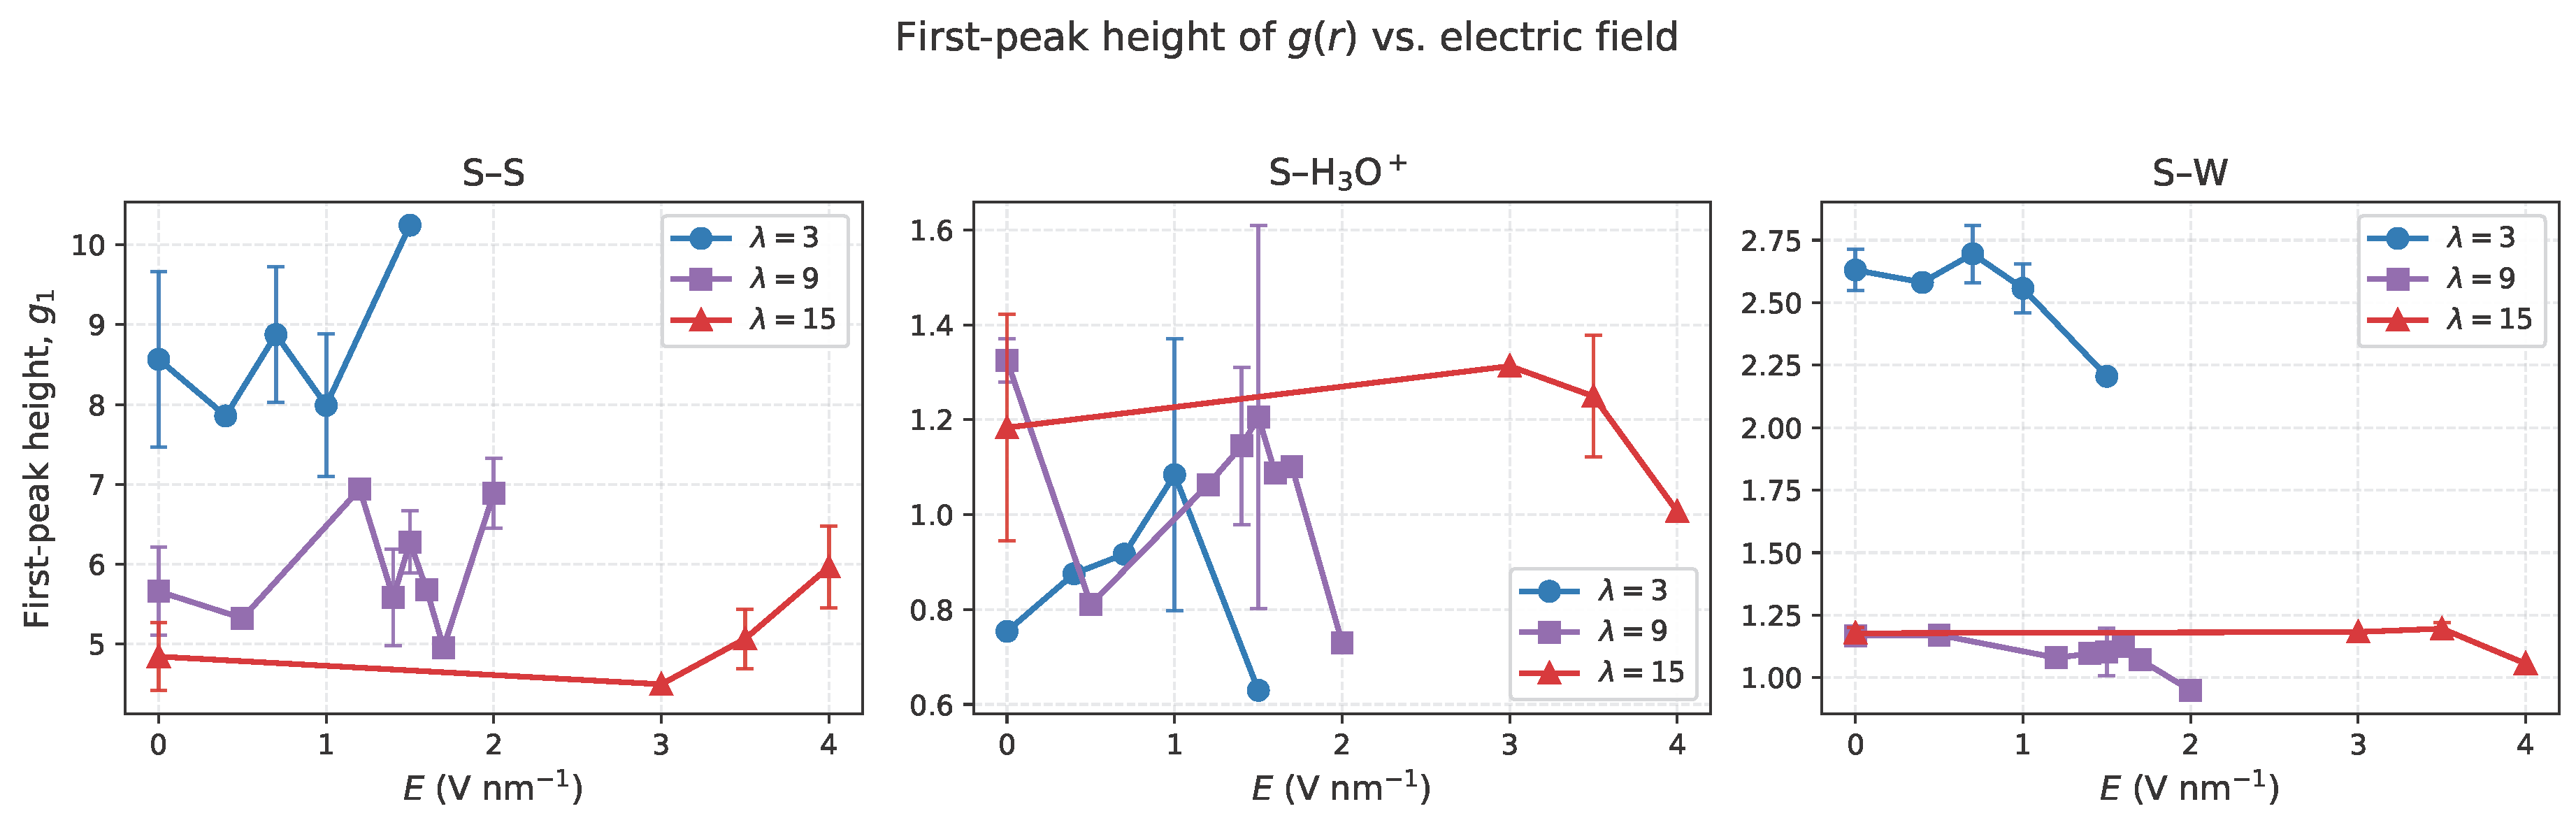

Table 1.
Molecular dynamics simulation parameters, common to all hydration levels and field strengths.
Table 1.
Molecular dynamics simulation parameters, common to all hydration levels and field strengths.
| Quantity | Value |
|---|---|
| MD engine | GROMACS 2024.5 |
| Integrator | leap-frog |
| Time step | 0.5 fs |
| Equilibration | steps (2.5 ns) |
| Production | steps (10 ns) |
| Ensemble | NVT (fixed volume) |
| Thermostat | Nosé–Hoover ( ps) |
| Temperature | 300 K |
| Box (fixed) | nm3 |
| Cutoff scheme | Verlet |
| 1.0 nm | |
| Long-range electrostatics | PME |
| Dispersion correction | energy + pressure |
| Constraints | LINCS (order 8, 2 iter.) |
| Water model | TIP4P/Ice |
Table 2.
Diffusion coefficients D of hydronium ions as a function of hydration level and applied electric field E, from linear fits to the MSD curves over 2000–6000 ps. For each , the upper block corresponds to the diffusive regime used in the analysis; the last entries (marked†) lie beyond the drift onset, where the apparent D is dominated by field-driven drift and are listed for completeness only.
| E (V nm−1) | D ( cm2 s−1) | |
|---|---|---|
| 3 | 0.0 | |
| 3 | 0.1 | |
| 3 | 0.2 | |
| 3 | 0.3 | |
| 3 | 0.4 | |
| 3 | 0.6 | |
| 3 | 0.7† | |
| 9 | 0.0 | |
| 9 | 0.5 | |
| 9 | 1.0 | |
| 9 | 1.2 | |
| 9 | 1.3 | |
| 9 | 1.4† | |
| 9 | 1.6† | |
| 15 | 0.0 | |
| 15 | 0.1 | |
| 15 | 1.0 | |
| 15 | 1.5 | |
| 15 | 2.0 | |
| 15 | 2.5 | |
| 15 | 3.0 | |
| 15 | 3.5 | |
| 15 | 3.7† | |
| 15 | 4.0† |
Disclaimer/Publisher’s Note: The statements, opinions and data contained in all publications are solely those of the individual author(s) and contributor(s) and not of MDPI and/or the editor(s). MDPI and/or the editor(s) disclaim responsibility for any injury to people or property resulting from any ideas, methods, instructions or products referred to in the content. |
© 2026 by the authors. Licensee MDPI, Basel, Switzerland. This article is an open access article distributed under the terms and conditions of the Creative Commons Attribution (CC BY) license (http://creativecommons.org/licenses/by/4.0/).
Copyright: This open access article is published under a Creative Commons CC BY 4.0 license, which permit the free download, distribution, and reuse, provided that the author and preprint are cited in any reuse.