

Submitted:
06 September 2026
Posted:
07 September 2026
You are already at the latest version
Abstract
Multiplicative threshold models are widely used to describe biological commitment steps. In their common form, a global permissive factor scales the product of locally acting terms, so a change in cellular state multiplies every substrate’s output by the same number. We show that this form has two problems. First, it is structurally unidentifiable: in a factorial design the permissive factor and the local terms are defined only up to a constant that can be traded between them, so the field has no absolute scale unless an external measurement anchors it or a substrate class responds with opposite sign. Second, where the required measurements exist, the form is empirically false. We reanalysed a published reporter series in Candida albicans in which 5′ leader architecture, amino-acid starvation, and global protein synthesis rate were measured in one experiment. A single scalar field mispredicts translational output by up to 8.6-fold, with a leave-one-out prediction error of 1.29 log units. A field indexed by leader class fits well (0.16 log units) and separates transcripts into three non-overlapping response classes. Without being fitted to it, the class comprising leaders with no inhibitory element recovers the independently measured global synthesis rate, placing that measurement at the 60.5th percentile of its bootstrap distribution. Repression strength does not substitute for architectural class: a structural element repressing 200-fold stays coupled to the global field, while an upstream open reading frame repressing 120-fold escapes it. Leader architecture therefore selects which field a transcript obeys rather than scaling a common one. We give the minimum design that identifies such a model.
Keywords:
multiplicative threshold models
; translational control
; upstream open reading frames (uORFs)
; structural identifiability
; permissive fields
; Candida albicans
; GCN4
Author Summary
Cells are often described as having a global throttle on protein synthesis: when stress closes it, every message is made more slowly by the same factor. Many quantitative models of biological decisions are built on that picture, with one global term multiplying whatever is specific to each gene. We show the picture cannot be right, and that models built on it cannot be fitted at all without extra information. Using a published experiment that measured everything needed — the sequence features of ten reporter messages, their output under starvation, and the cell’s overall protein synthesis rate — we find that messages fall into three sharply separated classes. Some track the global throttle exactly. Some are only partly coupled to it. Others ignore it and rise while it falls. Which class a message belongs to is set by a specific sequence element, not by how strongly the message is repressed to begin with. The consequence is that global translational control is a set of class-specific fields, and experiments meant to measure it must be designed to tell those classes apart.
Introduction
A recurring form in quantitative biology writes the output of a commitment step as a product of separable terms crossing a threshold:
R = Φ · (A · D · C) ≥ θ
Here A denotes the architecture or machinery that must be assembled, D the drive acting on it, C the local context, and Φ a permissive field set by the state of the cell. Forms of this kind have been applied to replication initiation [1], to plant and animal threshold decisions, and to behavioural commitment. Their appeal is that Φ carries the global state, so one measured quantity — a phosphorylation state, a metabolic rate — predicts how every substrate’s output shifts.
Statistical-thermodynamic models of transcription use a related device. The regulation factor of Bintu and colleagues collapses activator, repressor, and polymerase interactions into a single multiplicative fold-change on basal promoter activity [2,3]. Genome-wide tests of whether two signals combine additively or multiplicatively find that genes cluster at both behaviours rather than obeying one law [4], which already warns that a blanket multiplicative claim will not hold uniformly.
Two questions have not been addressed directly. Can Φ be estimated at all from the factorial designs used to test equation (1)? And where an independent measurement of the global state exists, does a single scalar Φ predict substrate-level output?
Translational control offers a clean test. Phosphorylation of eIF2α at Ser51 reduces ternary complex availability and lowers global initiation, and this reduction is directly measurable by radiolabel incorporation. Yet a small set of transcripts defined by upstream open reading frames (uORFs) in their 5′ leaders increase in output under the same conditions [5,6,7,8]. The canonical examples — yeast GCN4, mammalian ATF4 — are usually treated as exceptions to a global rule. We asked instead whether they falsify the rule’s form, and found that they do.
Results
A scalar field has no absolute scale in a factorial design
Taking logarithms of equation (1),
which is an additive model with four main effects. For a factorial in which each factor takes L levels, the design matrix had full column rank once one level per factor was taken as reference, so within-factor contrasts were estimable. We confirmed this numerically for two- and three-level designs (16 and 81 cells; rank 5/5 and 9/9).
log R = log Φ + log A + log D + log C
Full rank does not give identifiability of the terms themselves. The four factor means are confounded with the intercept: for any constant c, the pair (log Φ + c, log A − c) produces an identical fit. Φ is therefore estimable only as a contrast between the conditions actually sampled, never on an absolute scale, and the same holds for A, D, and C. Adding levels or replicates does not help, because the deficiency is structural rather than statistical.
Two things break the degeneracy. An external measurement of the global state on the response scale anchors Φ directly. Alternatively, a substrate class whose response to a Φ perturbation has opposite sign to the population fixes the scale by requiring Φ to change sign, which no reallocation of a constant can produce. Experiments intended to estimate a permissive field must include one or the other.
A system carrying all three required measurements
Sundaram and Grant reported a Candida albicans GCN4-luciferase series in which all three quantities appear in one experiment [9]. Point mutations at each uORF start codon, singly and in combination, generate leader variants differing only in architecture. Two stem-loop insertions of differing stability provide structural repressors in a uORF-free background. Amino-acid starvation (15 mM 3-aminotriazole) supplies the Φ perturbation, and Gcn2 dependence is established against a gcn2Δ strain. Reporter mRNA was measured by quantitative reverse-transcription PCR in the same constructs, so the transcriptional component divides out. Global protein synthesis was measured directly by ³⁵S-Cys/Met incorporation: approximately 80% inhibition at the reporter condition, giving Φglobal = 0.20.
We took as response the translational-efficiency ratio, stressed over basal, on the log scale. Ten constructs were analysable (Table 1).
A scalar field is falsified by a factor of eight
Under equation (1), A, D, and C are cis-encoded or held constant across the stress comparison for a given construct, so the predicted TE ratio is Φglobal = 0.20 for every leader. Observed ratios spanned 0.14 to 1.71. The largest discrepancy was 8.6-fold (Δu1); the median absolute log error across all ten constructs was 0.76 log units, or 2.1-fold. Four constructs increased in output while global synthesis fell fivefold.
The failure is not a matter of scale. Refitting Φ as a free common parameter (M2) rather than fixing it at the measured value reduced error only modestly, because the residual variation lay between classes rather than in a common offset (Table 2).
Three non-overlapping field classes
Replacing the scalar Φ with a field indexed by leader class improved cross-validated prediction roughly eightfold. Writing the initiation rate on transcript k as
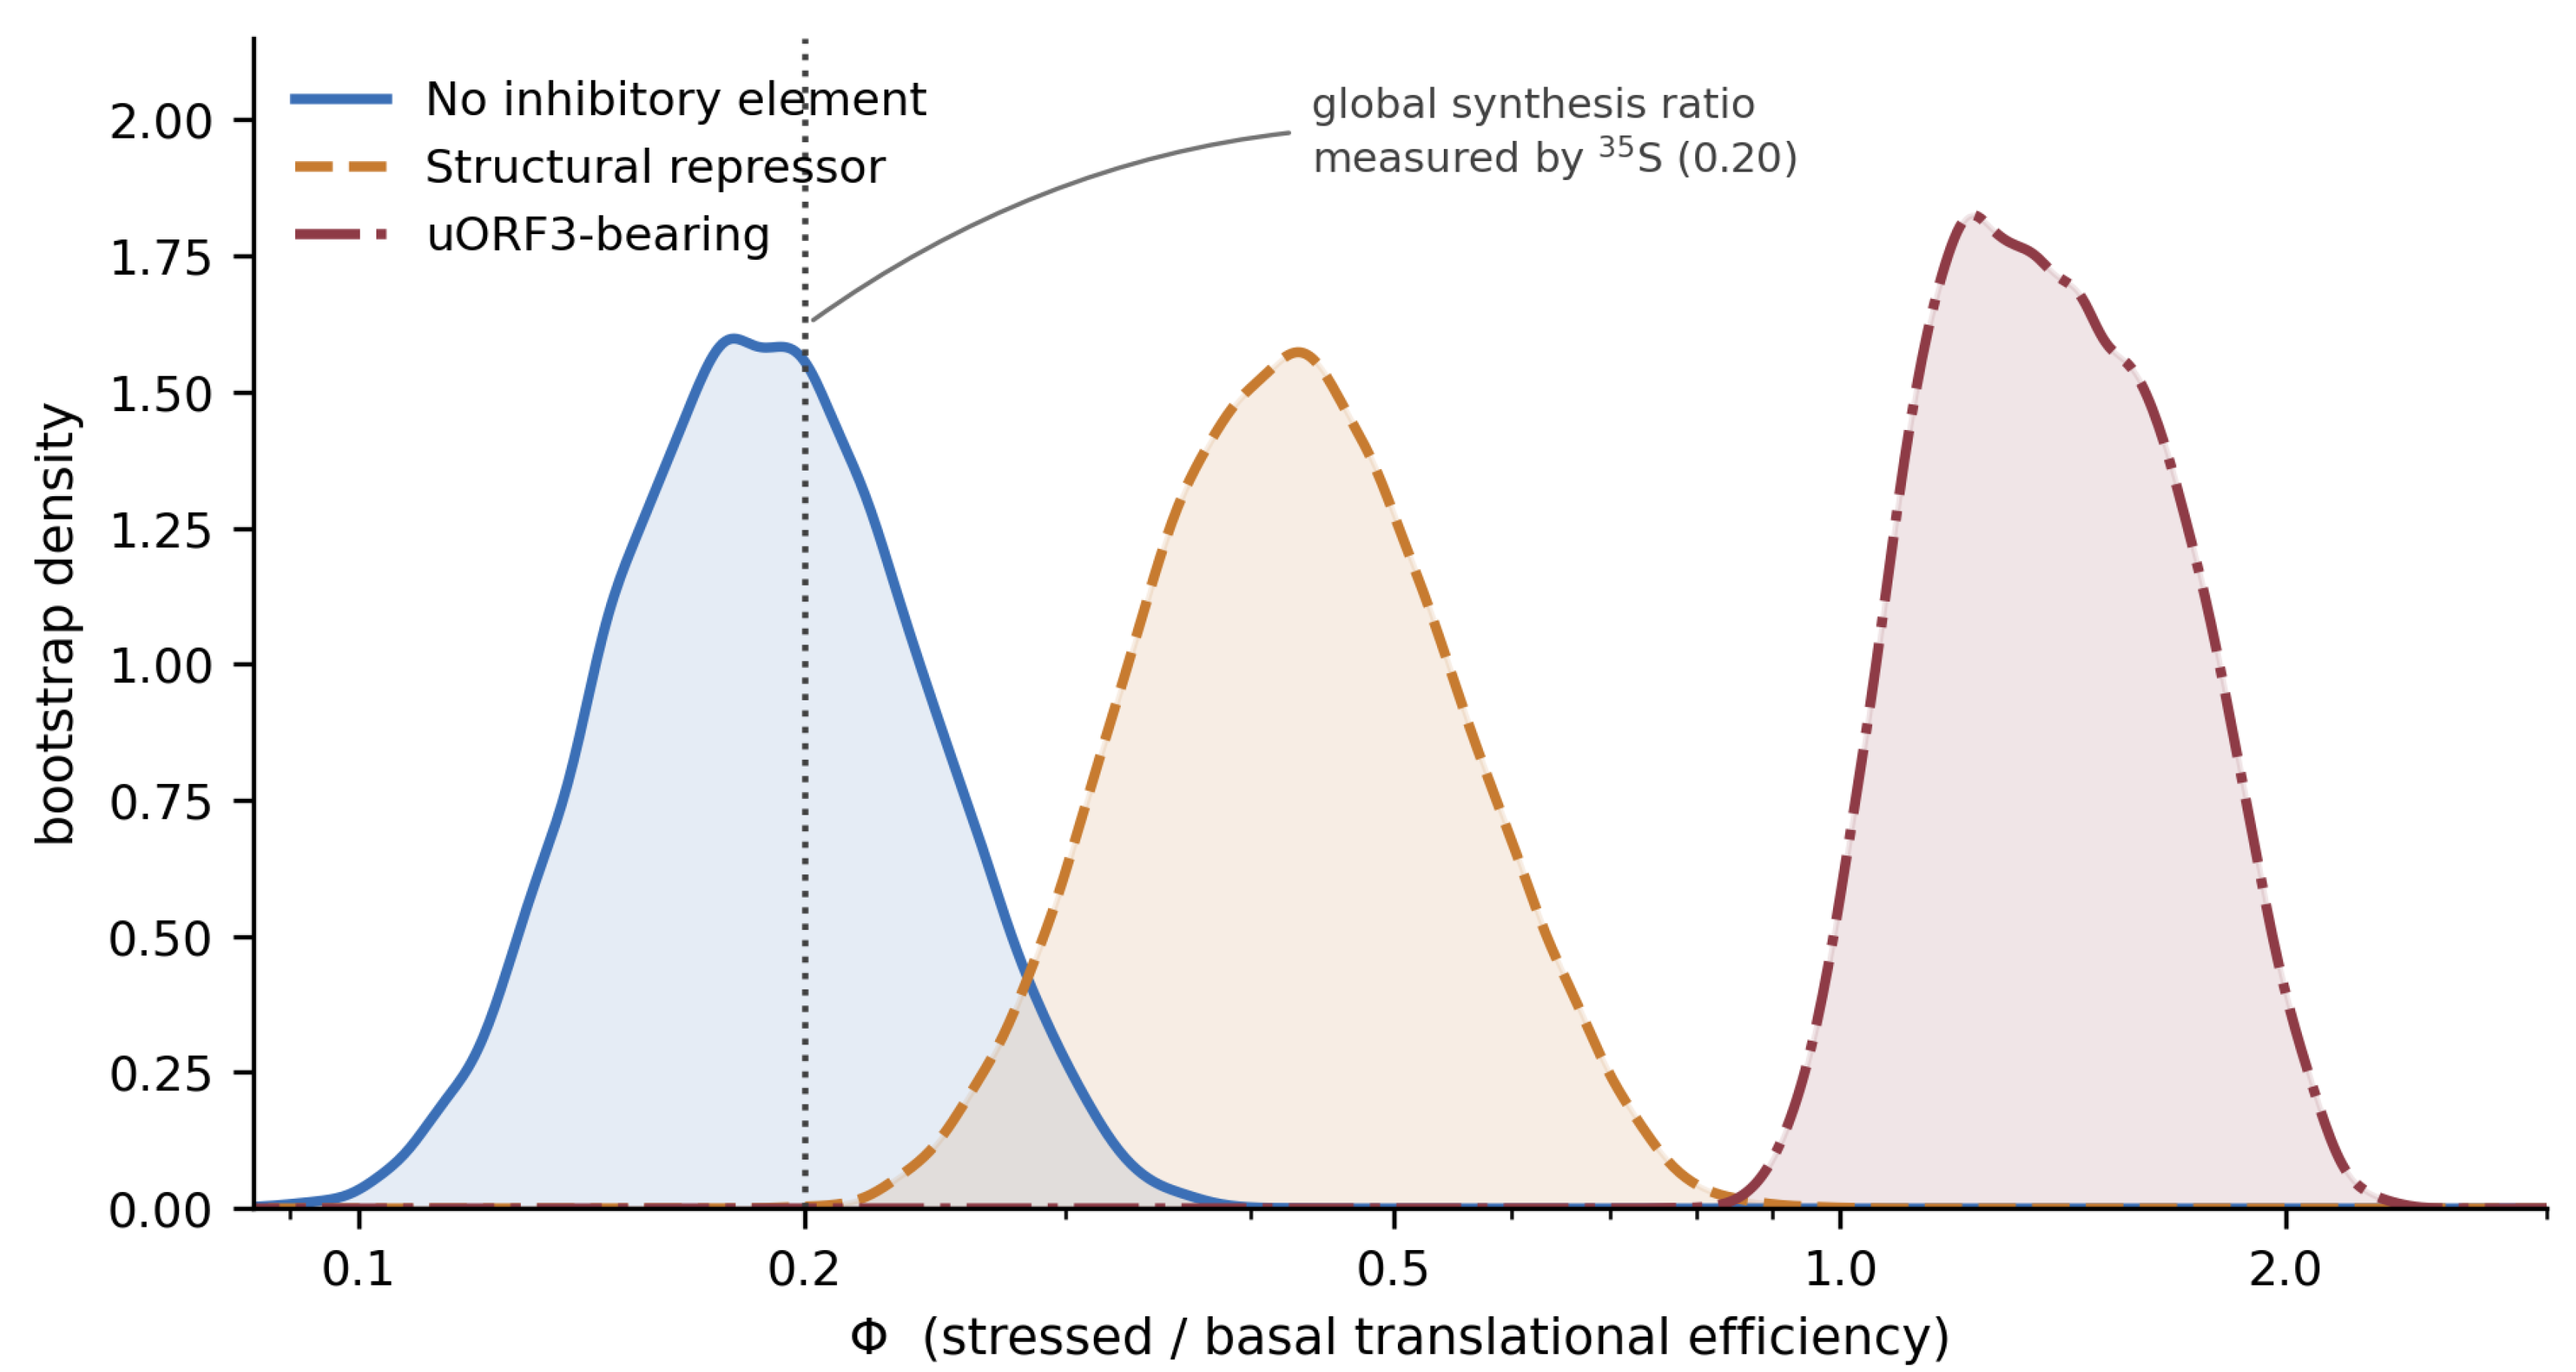
with ρk the leader-specific basal rate and c(k) the response class, a parametric bootstrap over 20,000 draws gave three classes that do not overlap (Fig 1, Table 3). The overlap coefficient between the extreme classes was 0.0000, and every pairwise ordering held in at least 99.99% of draws.
kinit,k = ρk · Φc(k)
Intervals are 2.5th and 97.5th percentiles of the bootstrap distribution. The output of uORF3-bearing leaders exceeded unity — that is, rose while global synthesis fell — in 96.98% of draws.
Figure 1.
Bootstrap distributions of the class-specific field. Densities of Φ for each leader class over 20,000 parametric bootstrap draws, plotted on a logarithmic abscissa. The independently measured global synthesis ratio (0.20, dotted line) is not used in the fit and falls within the leftmost distribution. Classes do not overlap.
Figure 1.
Bootstrap distributions of the class-specific field. Densities of Φ for each leader class over 20,000 parametric bootstrap draws, plotted on a logarithmic abscissa. The independently measured global synthesis ratio (0.20, dotted line) is not used in the fit and falls within the leftmost distribution. Classes do not overlap.
The class model recovers an independent measurement it was never given
The ³⁵S global synthesis ratio entered no class fit. It therefore served as an out-of-sample check, and it discriminated between the two candidate class structures more sharply than the information criteria did. The two-class model placed the uORF3-negative field at 0.246 (95% CI 0.168–0.369), a log distance of 0.205 from the measured 0.20. The three-class model, which separates structural repressors, placed the no-inhibitory-element field at 0.187 (95% CI 0.119–0.296), a log distance of 0.066 — 3.1-fold closer. The measured value sat at the 60.5th percentile of that distribution, where 50 would be exact recovery.
This is the strongest available evidence for the three-class structure, since it uses a quantity outside the fitted data. The information criteria and cross-validation agreed: over 4,000 bootstrap draws the three-class model achieved the lowest leave-one-out error in 71.2% of draws, against 25.9% for the class-plus-repression model and 3.0% for the two-class model.
Repression strength and field coupling are dissociated
Among the four uORF3-bearing leaders, basal repression and escape are collinear, so within that set a continuous model on repression strength could substitute for the class indicator. The stem-loop constructs separate them. SL(−41) represses 200-fold — more strongly than uORF3’s 120-fold — yet its TE ratio was 0.43, an order of magnitude below the uORF3-bearing class.
In the model containing both terms (M5), the uORF3 indicator carried a coefficient of +1.29 (95% CI 0.94–1.65; t = 7.40, 7 df, P = 0.0001) alongside a residual log-repression slope of +0.178 (95% CI 0.069–0.290). Escape is therefore not purely categorical; a graded contribution from repression strength survives, but it does not replace architectural class. Across 10,000 draws the uORF3-indexed model outperformed the repression-only model in 94.2%.
Gcn2 dependence localises the effect to initiation. In gcn2Δ cells, global synthesis is still strongly reduced by 3-aminotriazole through a Gcn2-independent, post-initiation route, yet reporter induction is abolished [9]. A general reduction in synthesis does not produce escape; only a gate acting at initiation does.
Robustness
Three constants enter the analysis and each was examined.
The mRNA divisor is common to all constructs and therefore an additive shift in logs. It cancels exactly from class contrasts, which were 6.64-fold at divisor values of 5, 7, and 9, while absolute Φ estimates scaled accordingly (Φ for uORF3-bearing leaders = 1.91, 1.37, 1.06). No conclusion about class structure depends on it.
Four of the ten induction values are stated verbally in the source (“little or no further induction”, “two- to fourfold”, “largely maintained”) rather than numerically. The bootstrap drew these from their stated ranges together with 15% multiplicative measurement noise. Log-scale bootstrap distributions were platykurtic and mildly asymmetric (Table 3; upper-to-lower half-width ratio 1.13 for the uORF3-bearing class), so percentile intervals are reported throughout rather than normal-theory intervals.
Leverage diagnostics for the continuous repression model (M3) showed no point exceeding the hat threshold 2p/n = 0.40; the two extreme low-repression constructs had hat values of 0.312. One point, SL(−41), exceeded the Cook’s distance threshold 4/n = 0.40 at D = 0.652. Leave-one-out refitting moved the slope from +0.432 to a range of +0.399 to +0.518, a maximum change of 20% attributable to that construct. The slope is therefore not driven by the extreme low-repression points, and the models that outperform M3 are not sensitive to this construct.
Discussion
The permissive field in equation (1) is usually read as a property of the cell. On this dataset it is a property of a transcript class. Leader architecture does not scale a common field; it selects which field the transcript sees. The form that survives, equation (3), removes architecture from the product and moves it into the index. Where our earlier application of the multiplicative form to replication initiation treated the global term as a single scalar [1], the present result indicates that such terms require class indexing wherever substrate-specific escape routes exist.
Three consequences follow for experiments built on multiplicative gate models.
First, a factorial design alone cannot estimate the field. Any such experiment needs either an external measurement of the global state on the response scale, or a substrate class showing a sign reversal. Both were present here, which is why the model could be adjudicated at all. Most factorial designs testing multiplicative models include neither.
Second, the escaping class must be represented in the design. An experiment sampling only leaders without inhibitory elements would have accepted the scalar model with an error of 0.7-fold, well within measurement noise. The falsifying observations are precisely the transcripts usually set aside as exceptions.
Third, repression strength is the wrong covariate. Investigators sometimes stratify by basal expression on the assumption that strongly repressed substrates respond more to a global change. Here that assumption inverts: the most strongly repressed construct in the series is among the least responsive.
Whether the effect generalises beyond this system is open. The mechanism is conserved in outline. Mammalian ATF4 is regulated by an analogous uORF arrangement under eIF2α phosphorylation, with transcriptional and translational control acting together [5,10]; a related bypass of an inhibitory uORF with poor initiation-codon context governs CHOP [11]; and mTORC1-dependent control of TOP mRNAs through LARP1 provides a second, mechanistically distinct case in which a transcript class inverts relative to a global signal [12]. Replicating this analysis in any of them would test whether the class structure found here belongs to uORF-mediated reinitiation specifically or to gated translational control generally. We regard that replication as the necessary next step rather than a corollary.
Two limitations bound the claims. The dataset comprises ten constructs from a single published experiment in one organism, and four induction values are reconstructed from verbal descriptions. Falsification of the scalar model is robust to both, resting on constructs with numerically stated values and on a discrepancy an order of magnitude larger than any plausible reconstruction error. The finer question of whether escape is two-class or three-class rests more heavily on the reconstructed values; the out-of-sample recovery of the ³⁵S measurement is the evidence we weight most, and it favours three classes.
Materials and Methods
Data. Values were taken from the Results and Discussion text of Sundaram and Grant [9], not digitised from figures; provenance is recorded per construct in the analysis script (S1 Code). Basal expression for the uORF1-only and uORF2-only constructs was derived from stated inhibition percentages relative to the uORF-free construct (35% and 85% respectively).
Response variable. Reporter fold-induction by 3-aminotriazole was divided by the measured mRNA fold-induction (7-fold, quantitative reverse-transcription PCR, same constructs) to isolate the translational component, then log-transformed.
Model fitting. Models were fitted by ordinary least squares on the log scale. Information criteria were computed from the Gaussian log-likelihood with the variance counted as a parameter; AICc used the correction 2k(k+1)/(n − k − 1). Leave-one-out cross-validation used root mean squared prediction error; for class models, folds in which a class would lose all members were treated as undefined, which is why the four-construct subset is reported descriptively only.
Bootstrap. Verbally-reported induction values were drawn uniformly from their stated ranges (0.7–2.0 for “little or no induction”, 2.0–4.0 for “two- to fourfold”, 7–13 for “largely maintained”); reporter values were multiplied by lognormal noise with 15% coefficient of variation, consistent with triplicate luciferase assays; the mRNA divisor was drawn uniformly from 5 to 9. Intervals are 2.5th and 97.5th percentiles over 20,000 draws (4,000 for model-ranking comparisons, 10,000 for pairwise model contests). Distribution shape was assessed by skewness, excess kurtosis, and half-width asymmetry; percentile intervals were retained on that basis.
Diagnostics. Hat values and Cook’s distances were computed from the ordinary least squares projection matrix, with thresholds 2p/n and 4/n. Class separation was quantified by the overlap coefficient of Gaussian kernel density estimates on the log scale.
Software. Python 3.13 with NumPy 2.4.4, pandas 3.0.2, SciPy 1.17.1, and Matplotlib 3.10.8.
Supplementary Materials
The following supporting information can be downloaded at the website of this paper posted on Preprints.org. S1 Code. Analysis script. Self-contained Python script reproducing every number, table, and figure reported here, including per-construct provenance of each input value.
References
- Rahman, T. A multiplicative behavioral model of DNA replication initiation. Open Life Sci. 2025, 20, 20251229. [Google Scholar] [CrossRef]
- Bintu, L.; Buchler, N.E.; Garcia, H.G.; Gerland, U.; Hwa, T.; Kondev, J.; et al. Transcriptional regulation by the numbers: models. Curr. Opin. Genet Dev. 2005, 15, 116–124. [Google Scholar] [CrossRef]
- Bintu, L.; Buchler, N.E.; Garcia, H.G.; Gerland, U.; Hwa, T.; Kondev, J.; et al. Transcriptional regulation by the numbers: applications. Curr. Opin. Genet Dev. 2005, 15, 125–135. [Google Scholar] [CrossRef]
- Sanford, E.M.; Emert, B.L.; Coté, A.; Raj, A. Gene regulation gravitates toward either addition or multiplication when combining the effects of two signals. Elife 2020, 9, e59388. [Google Scholar] [CrossRef]
- Vattem, K.M.; Wek, R.C. Reinitiation involving upstream ORFs regulates ATF4 mRNA translation in mammalian cells. Proc. Natl. Acad. Sci. U S A 2004, 101, 11269–11274. [Google Scholar] [CrossRef]
- Hinnebusch, A.G. Translational regulation of GCN4 and the general amino acid control of yeast. Annu Rev. Microbiol. 2005, 59, 407–450. [Google Scholar] [CrossRef]
- Abastado, J.P.; Miller, P.F.; Jackson, B.M.; Hinnebusch, A.G. Suppression of ribosomal reinitiation at upstream open reading frames in amino acid-starved cells forms the basis for GCN4 translational control. Mol. Cell Biol. 1991, 11, 486–496. [Google Scholar] [CrossRef]
- Harding, H.P.; Novoa, I.; Zhang, Y.; Zeng, H.; Wek, R.; Schapira, M.; et al. Regulated translation initiation controls stress-induced gene expression in mammalian cells. Mol. Cell 2000, 6, 1099–1108. [Google Scholar] [CrossRef]
- Sundaram, A.; Grant, C.M. A single inhibitory upstream open reading frame (uORF) is sufficient to regulate Candida albicans GCN4 translation in response to amino acid starvation conditions. RNA 2014, 20, 559–567. [Google Scholar] [CrossRef]
- Dey, S.; Baird, T.D.; Zhou, D.; Palam, L.R.; Spandau, D.F.; Wek, R.C. Both transcriptional regulation and translational control of ATF4 are central to the integrated stress response. J. Biol. Chem. 2010, 285, 33165–33174. [Google Scholar] [CrossRef]
- Palam, L.R.; Baird, T.D.; Wek, R.C. Phosphorylation of eIF2 facilitates ribosomal bypass of an inhibitory upstream ORF to enhance CHOP translation. J. Biol. Chem. 2011, 286, 10939–10949. [Google Scholar] [CrossRef]
- Jia, J.J.; Lahr, R.M.; Solgaard, M.T.; Moraes, B.J.; Pointet, R.; Yang, S.; et al. mTORC1 promotes TOP mRNA translation through site-specific phosphorylation of LARP1. Nucleic Acids Res. 2021, 49, 3461–3489. [Google Scholar] [CrossRef]

Table 1.
Leader variants, repression strength, and response to the Φ perturbation.
| Construct | uORF3 | Basal repression | TE ratio | vs Φglobal |
|---|---|---|---|---|
| WT (u1,u2,u3) | + | 120× | 1.43 | 7.1× |
| Δu1 (u2,u3) | + | 80× | 1.71 | 8.6× |
| Δu2 (u1,u3) | + | 60× | 1.00 | 5.0× |
| Δu1Δu2 (u3 only) | + | 60× | 1.43 | 7.1× |
| Δu3 (u1,u2) | − | 1× | 0.14 | 0.7× |
| Δu1Δu3 (u2 only) | − | 6.7× | 0.14 | 0.7× |
| Δu2Δu3 (u1 only) | − | 1.5× | 0.14 | 0.7× |
| Δu1Δu2Δu3 (none) | − | 1× | 0.14 | 0.7× |
| no-uORF + SL(−8.7) | − | 50× | 0.43 | 2.1× |
| no-uORF + SL(−41) | − | 200× | 0.43 | 2.1× |
TE ratio, translational-efficiency ratio (reporter fold-induction divided by mRNA fold-induction of 7). Φglobal = 0.20 from ³⁵S incorporation. SL, stem-loop, with predicted ΔG in kcal mol⁻¹.
Table 2.
Model competition (n = 10).
| Model | k | RSS | logLik | AIC | AICc | BIC | LOOCV-RMSE |
|---|---|---|---|---|---|---|---|
| M6 three classes (uORF3 / stem-loop / neither) | 3 | 0.15 | 6.71 | −5.43 | 2.57 | −4.22 | 0.16 |
| M5 uORF3 + log(repression) | 3 | 0.34 | 2.65 | 2.69 | 10.69 | 3.90 | 0.25 |
| M4 Φ indexed by uORF3 | 2 | 1.76 | −5.51 | 17.02 | 21.02 | 17.93 | 0.51 |
| M3 Φ ~ log(repression) | 2 | 3.04 | −8.23 | 22.47 | 26.47 | 23.37 | 0.68 |
| M2 scalar Φ, fitted | 1 | 10.36 | −14.37 | 32.73 | 34.45 | 33.34 | 1.13 |
| M1 scalar Φ, fixed at ³⁵S value | 0 | 16.55 | −16.71 | 35.42 | 35.92 | 35.72 | 1.29 |
k excludes the variance parameter, which is counted in all criteria. The ordering is identical under AIC, AICc, BIC, and leave-one-out cross-validation, so no conclusion depends on the small-sample correction.
Table 3.
Bootstrap estimates of class-specific fields (B = 20,000).
| Class | Φ (median) | 95% CI | log-scale skew | Excess kurtosis |
|---|---|---|---|---|
| No inhibitory element | 0.187 | 0.119–0.296 | +0.02 | −0.31 |
| Structural repressor | 0.427 | 0.269–0.683 | +0.04 | −0.34 |
| uORF3-bearing | 1.371 | 0.990–1.981 | +0.12 | −0.71 |
Disclaimer/Publisher’s Note: The statements, opinions and data contained in all publications are solely those of the individual author(s) and contributor(s) and not of MDPI and/or the editor(s). MDPI and/or the editor(s) disclaim responsibility for any injury to people or property resulting from any ideas, methods, instructions or products referred to in the content. |
© 2026 by the authors. Licensee MDPI, Basel, Switzerland. This article is an open access article distributed under the terms and conditions of the Creative Commons Attribution (CC BY) license (http://creativecommons.org/licenses/by/4.0/).
Copyright: This open access article is published under a Creative Commons CC BY 4.0 license, which permit the free download, distribution, and reuse, provided that the author and preprint are cited in any reuse.