

Submitted:
04 September 2026
Posted:
07 September 2026
You are already at the latest version
Abstract
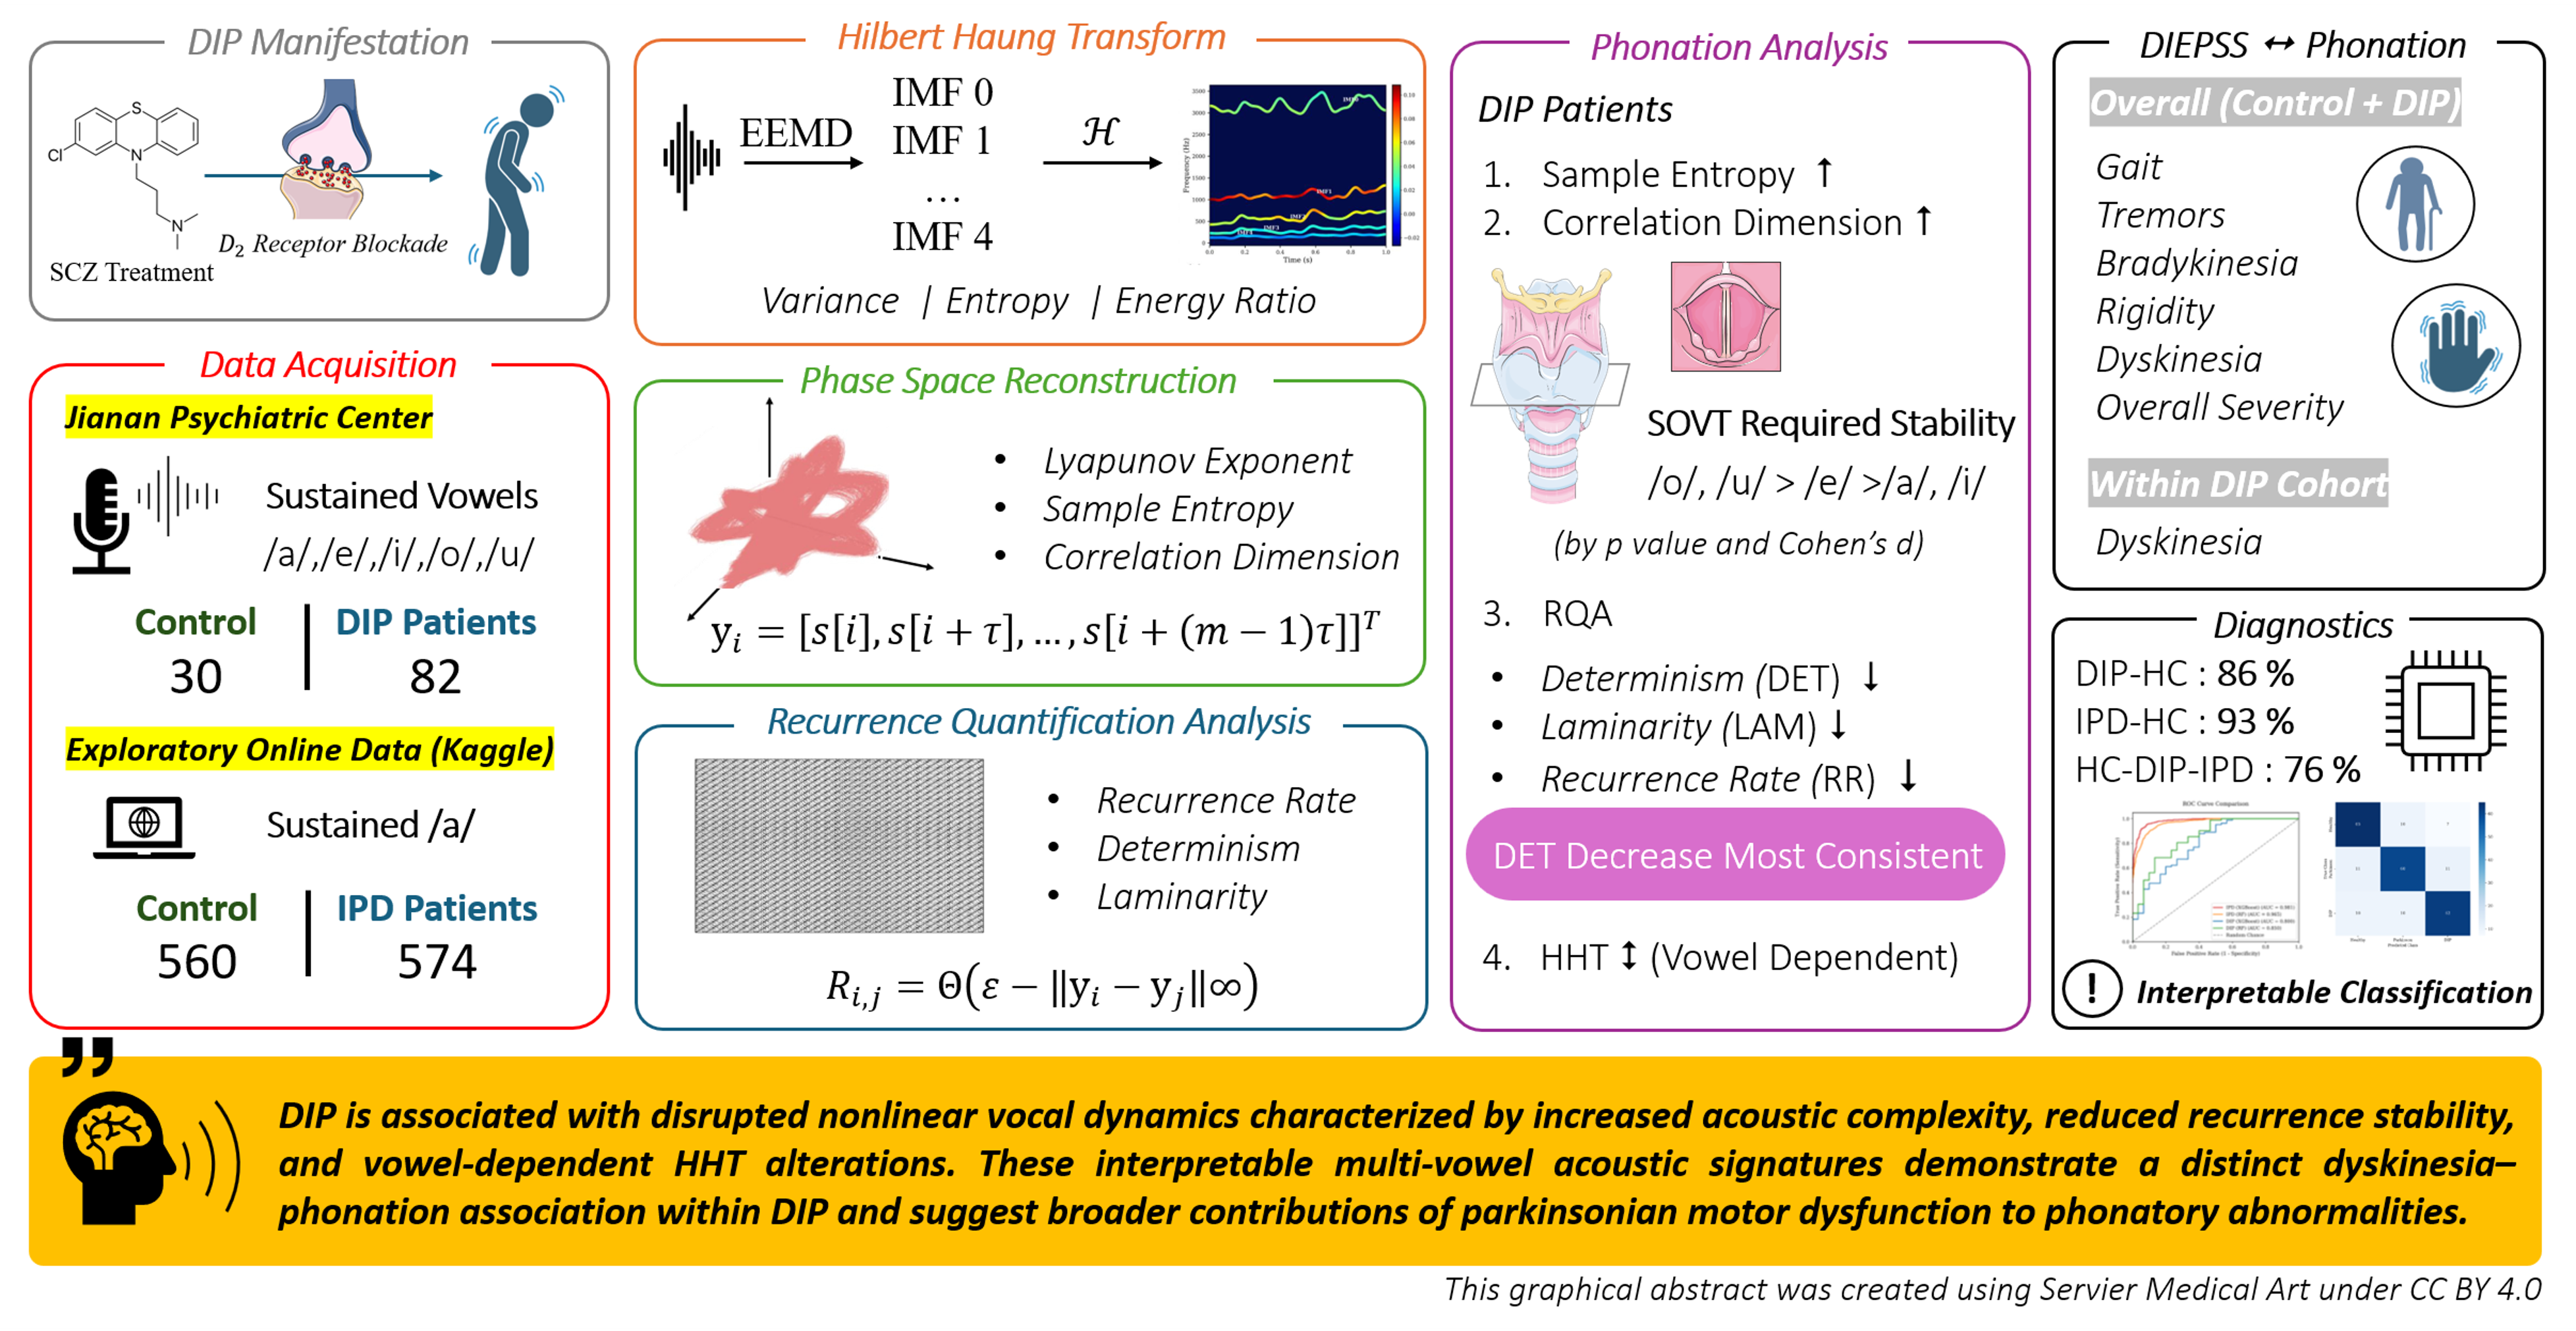
Background/Objectives: Drug-induced parkinsonism (DIP) is a common extrapyramidal adverse effect of dopamine-receptor blocking agents, yet interpretable biomarkers of its acoustics remain limited. This study investigated whether nonlinear dynamics could provide physiologically interpretable markers of DIP and clarify how these abnormalities vary across vowels and extrapyramidal symptoms. Methods: Sustained phonations of five vowels (/a/, /i/, /u/, /e/, /o/) were analyzed in 82 patients with DIP and 30 healthy controls. Hilbert–Huang Transform (HHT) features were integrated along with Sample Entropy, Correlation Dimension, Largest Lyapunov Exponent, and Recurrence Quantification Analysis (RQA). Associations with Drug-Induced Extrapyramidal Symptoms Scale (DIEPSS) domains were examined. An external idiopathic Parkinson’s disease (IPD) dataset and machine-learning were used as secondary analyses to evaluate diagnostic utility. Results: HHT-derived features showed vowel dependence, whereas nonlinear measures revealed broader abnormalities in DIP. Sample Entropy and Correlation Dimension were most prominently increased in rounded back vowels /u/ and /o/. RQA determinism was significantly reduced across all vowels, with recurrence rate and laminarity reduced across multiple vowels, indicating impaired recurrence of phonation. Within the DIP cohort, dyskinesia showed the strongest association with acoustic abnormalities, whereas broader motor domains, including Gait, Bradykinesia, Rigidity, Tremor, Dyskinesia, and Overall Severity, characterized patient–control differences. Secondary analyses with Random Forest achieved a three-class classification of 76.0%. Conclusions: DIP is associated with measurable disruption of nonlinear vocal dynamics, characterized by vowel-sensitive HHT and entropy features and relatively consistent reductions in RQA determinism. These interpretable acoustic patterns may provide a non-invasive means of characterizing extrapyramidal motor dysfunction.
Keywords:
drug-induced parkinsonism
; extrapyramidal syndrome
; parkinsonism
; laryngeal nonlinear acoustic
; Hilbert-Huang transform
; entropy
; correlation dimension
; recurrence quantification analysis
; dyskinesia
1. Introduction
Drug-Induced Parkinsonism (DIP) is one of the most common extrapyramidal symptoms (EPS) resulting from central dopamine receptor blockade following antipsychotic therapy [1,2,3]. Clinically characterized by rigidity, bradykinesia, resting tremors, and gait disturbances, DIP often mimics idiopathic Parkinson’s disease (IPD), posing a major challenge for accurate differential diagnosis and side-effect monitoring. Traditional clinical assessment of DIP relies heavily on subjective physical examination scales, such as the Drug-Induced Extrapyramidal Symptom Scale (DIEPSS) [4,5,6] and the Glasgow Antipsychotic Side Effect Scale (GASS) [7]. While useful, these rating scales are time-consuming, prone to intra- and inter-rater variability, and unable to capture subtle, early-stage motor dysfunctions before obvious movement impairment manifests [8].
In contrast, speech acoustic analysis could detect impairments in laryngeal motor control that may already be present at an early stage, with prior studies observing decreased variability in fundamental frequency during the prodromal period, detectable as early as five years prior to the diagnosis of Parkinson’s disease [9,10,11]. Interestingly, a similar classification study further supports this possibility, using speech feature extraction and machine-learning algorithms to identify dysarthria-related patterns in longitudinal recordings of celebrities, they achieved a fair ROC-AUC of 0.75 five years prior to diagnosis [12]. In brief, patient speech could potentially provide a sensitive, non-invasive probe of extrapyramidal disorders. This may be attributed to the fine-grained coordination required for laryngeal motor control. In PD, for example, this control can be disrupted by abnormalities at multiple levels, including anatomical changes such as vocal-fold hyperadduction, muscular dysfunction characterized by rigidity and bradykinesia, and neurological dysfunction involving both dopaminergic and non-dopaminergic pathways [13], including laryngeal somatosensory deficits [14], which together may influence phonation, articulation, and prosody [15].
Over the past decade, advances in machine learning (ML) and deep learning have driven numerous studies toward the development of speech and voice-based diagnostic tools for Parkinson’s disease and other speech disorders [12,16,17,18,19,20,21,22,23,24]. Many of these approaches rely on conventional acoustic descriptors, including pitch perturbation (jitter), amplitude perturbation (shimmer), fundamental frequency (), and spectral representations such as Mel-Frequency Cepstral Coefficients (MFCCs). Although these features have demonstrated considerable value for classification, their physiological and mechanistic interpretability remains limited. In particular, MFCCs provide an efficient compact representation of the spectral envelope, but discriminative MFCC patterns do not readily translate into specific alterations in vocal-fold mechanics or the underlying nonlinear and non-stationary dynamics of phonation [16,22,24].
Voice production is inherently a complex dynamical process governed by interactions among aerodynamic forces, vocal-fold tissue oscillation, and neuromuscular control. When neurogenic impairment disrupts smooth vocal fold mechanics, the laryngeal system shifts from stable periodic vibration toward nonlinear turbulence and chaotic dynamics, giving rise to complex recurrence structures and fractal scaling [25] Capturing these underlying physical mechanisms requires advanced nonlinear signal processing methods. For instance, the Hilbert-Huang Transform (HHT), combining Empirical Mode Decomposition (EMD) and Hilbert Spectral Analysis, is particularly suitable for non-stationary signals, decomposing complex acoustic waveforms into intrinsic frequency components (IMFs) without imposing fixed basis functions [26]. Recent studies have applied HHT-derived features to Parkinson’s disease and voice pathology classification [27,28]. However, these approaches have largely emphasized time-dependent HHT feature sequences combined with deep-learning classifiers, thereby prioritizing predictive performance while retaining limited direct interpretability of the underlying acoustic dynamics.
An alternative approach is to derive compact, time-independent summary measures from HHT that characterize physically meaningful properties of the decomposed signal, such as frequency variability, spectral distribution, and relative energy organization. When integrated with nonlinear dynamic measures, including Correlation Dimension (), Largest Lyapunov Exponent (), Sample Entropy, and Recurrence Quantification Analysis (RQA), such features may provide a more interpretable description of vocal-system instability, including attractor complexity, trajectory divergence, irregularity, and recurrent or laminar behavior [25,26]. This framework shifts the emphasis from identifying which high-dimensional features best classify disease toward understanding how the underlying vocal dynamics are altered.
Despite growing interest in HHT and nonlinear acoustic analysis [25,26,27,28], comprehensive integration of interpretable HHT-derived summary measures with quantified chaotic and phase-space dynamics remains scarce. This gap is particularly evident in drug-induced parkinsonism (DIP), for which acoustic markers of laryngeal instability remain substantially less studied than in idiopathic Parkinson’s disease (IPD). Given known clinical differences between DIP and IPD, including differences in resting tremors and motor asymmetry, it remains unclear whether these conditions exhibit distinct patterns of vocal nonlinearity, recurrence, and phase-space dynamics. Furthermore, acoustic changes across different degrees of extrapyramidal symptom severity, as quantified by the Drug-Induced Extrapyramidal Symptoms Scale (DIEPSS), remain poorly characterized. Addressing these gaps may therefore improve not only diagnostic discrimination but also the mechanistic interpretation of how different forms and severities of parkinsonism alter laryngeal motor dynamics.
To bridge this gap, this study proposes a physics-grounded, nonlinear acoustic framework to evaluate laryngeal stability in DIP. By combining HHT-derived spectral metrics with phase-space chaos parameters across five cardinal vowels (a,i,u,e,o), we aim to: First evaluate nonlinear dynamic degradation and energy redistribution of vocal fold vibration across healthy controls (HC), DIP patients, and IPD patients; Second, isolate key nonlinear physical parameters capable of capturing laryngeal micro-tremors, glottal instability, and phase-space trapped states; Third, analyze overall marker significance on subcategories of the DIEPSS Scale to uncover which symptom dimensions are most strongly associated with acoustic alterations; Lastly, develop a physics-grounded machine learning model for accurate and interpretable differential diagnosis between healthy, IPD, and DIP cohorts.
2. Materials and Methods
2.1. Dataset
To investigate Drug-Induced Parkinsonism (DIP), vocal recordings were collected from DIP patients with schizophrenia and healthy controls at Jianan Psychiatric Center, Taiwan. The DIP group comprised 82 patients with DSM-5 schizophrenia receiving antipsychotic treatment who fulfilled the study criteria for drug-induced parkinsonism, as determined through DIEPSS, by board certified psychiatrists. The mean daily antipsychotic dose, expressed as chlorpromazine-equivalent dose, was 522.17 ± 243.21 mg/day. Each participant produced sustained phonations of the five vowels (/a/, /i/, /u/, /e/, and /o/) at a sampling rate of .
The patient group included 45 males and 37 females, whereas the healthy control group included 14 males and 16 females. Sex distribution did not differ significantly between groups ( = 0.25, p = 0.61). The mean age was 45.6 ± 10.2 years in the patient group and 30.8 ± 9.0 years in the healthy control group, representing a significant between-group difference (F = 49.7, p < 0.01). The mean age at onset of schizophrenia in the patient group was 21.51 ± 8.02 years.
For secondary analysis with Idiopathic Parkinson’s Disease (IPD), an external dataset comprising recordings from patients with IPD (N = 560) and healthy controls (N = 574) was obtained from Kaggle [29]. This dataset was restricted to sustained /a/ phonations. Because the DIP and IPD cohorts originated from different datasets, control-referenced baseline normalization was performed prior to cross-disease comparison to reduce dataset-related variability.
2.2. Signal Preprocessing and Windowing
To isolate steady-state vocal fold dynamics from onset/offset acoustic transients, raw audio signals were preprocessed using a trimming procedure, trimming both silence and onset/offset vocals (200ms), then we normalized the amplitude. The data were separated by three sequential non-overlapping temporal windows with a length of 2 s.
2.3. Hilbert-Huang Transform (HHT) & Ensemble EMD
Non-stationary and nonlinear properties of vocal fold vibrations were decomposed using Ensemble Empirical Mode Decomposition (EEMD). The visualizations are shown in Figure 1.
2.3.1. EEMD Decomposition
For a discrete window signal, EEMD adds independent trials of zero-mean white noise to prevent mode mixing:
where:
Each trial is decomposed into Intrinsic Mode Functions (IMFs), , and a monotonic residual using the sifting process:
The final ensemble-averaged IMFs are computed as:
where:
2.3.2. Hilbert Spectral Analysis
The analytic signal for each IMF is formulated via the Hilbert Transform :
where the instantaneous amplitude and instantaneous phase are defined by:
The discrete instantaneous frequency (in Hz) is derived from the phase derivative:
2.3.3. Derived HHT Feature Formulations
For each IMF , three specific metrics are extracted, together with a global high-to-low energy ratio:
- Frequency Variance ():where:
- Frequency Spectral Entropy (): Constructing a 50-bin normalized probability density function of over non-zero bins :
- IMF Energy Ratio (): Defining IMF energy :
- High-to-Low Energy Ratio ():
2.4. Nonlinear Dynamics & Chaos Quantification
To characterize nonlinear laryngeal instability, a centered sub-segment of length samples () is mapped into an -dimensional phase-space attractor using Takens’ Delay Embedding Theorem [30]. The visualizations are shown in Figure 2.
2.4.1. Phase-Space Reconstruction
Given embedding dimension and time delay , the trajectory matrix is constructed where :
where:
2.4.2. Correlation Dimension ()
Using the Grassberger-Procaccia algorithm [33], the spatial correlation integral measures the frequency of vector pairs closer than distance under Chebyshev distance :
where is the Heaviside step function. The Correlation Dimension is defined as the scaling exponent in the limit :
2.4.3. Largest Lyapunov Exponent ()
Calculated via Rosenstein’s algorithm [34], the distance between each trajectory point and its nearest neighbor is tracked over discrete time steps :
Assuming exponential divergence, is computed from the slope of the average logarithmic divergence curve .
2.4.4. Sample Entropy (SampEn)
Defining as the probability that two sequences of length match within tolerance , and as the match probability for length :
2.5. Recurrence Quantification Analysis (RQA)
Using the phase-space trajectory , an unthresholded distance matrix is converted into a binary Recurrence Matrix using cutoff threshold :
where:
The structural topology of is quantified through three RQA metrics:
- Recurrence Rate (): The proportion of recurrent points in phase space:
- Determinism (): The fraction of recurrence points that form diagonal lines of minimum length , reflecting deterministic trajectory predictability:where represents the frequency distribution of diagonal lengths of length .
- Laminarity (): The proportion of recurrence points forming vertical structures of minimum length , quantifying phase-space trapped states:where represents the frequency distribution of vertical lengths of length .
2.6. Statistical Analysis
All statistical analyses were conducted using Python with the SciPy and Pandas libraries. To ensure the assumption of independent observations, all window bootstrapped acoustic features were first aggregated by calculating the mean for each unique participant.
Four primary statistical comparisons were performed:
- DIP vs. Healthy Controls: To identify acoustic features significantly altered by Drug-Induced Parkinsonism.
- DIP-DIEPSS Correlations: To assess how acoustic degradation maps onto specific clinical phenotypes, Spearman rank correlations were computed across all acoustic features (N = 110 metrics) for each individual DIEPSS subcategory (items 1–9). To evaluate panel-wide signal enrichment across multiple acoustic features, empirical p-value distributions were visualized via Quantile-Quantile (Q-Q) plots against the theoretical uniform null distribution. Distribution inflation factors based on both the median () and mean () of the test statistics were calculated to identify symptom domains exhibiting systematic, widespread association with DIP laryngeal dysfunction.
- IPD vs. Healthy Controls: To identify acoustic features significantly altered by Idiopathic Parkinson’s Disease.
- DIP vs. IPD: To directly contrast the two pathologies. Because the DIP and IPD cohorts originated from distinct datasets with potential recording discrepancies, a baseline Z-score normalization was applied prior to this comparison. Patient features were mathematically normalized against the mean and standard deviation of their respective healthy control cohorts. This converted the raw acoustic values into standardized Z-scores, thereby reducing, but not eliminating, potential dataset-related scale differences.
Because nonlinear acoustic features frequently violate assumptions of normality, the non-parametric Mann-Whitney U test (two-sided) was utilized for all comparisons to determine statistical significance. To quantify the clinical magnitude of these differences independent of sample size, Cohen’s d was calculated using the pooled standard deviation. Features were subsequently ranked by their p value to identify the most robust discriminative biomarkers. To assess the robustness of the findings, supplementary sensitivity analyses were performed using age- and sex-adjusted regression models, with Benjamini–Hochberg false discovery rate (FDR) correction across the 20 prespecified vowel–feature comparisons. Detailed results are provided in Appendix A.
2.7. Multi-Vowel Combinatorial Fusion and Cross-Validation
To construct subject-level feature representations without introducing artificial temporal dependencies, a combinatorial sampling strategy is applied:
- Vowel Feature Assembly: For subject and vowel , window features are stored in set .
- Bootstrapped Feature Fusion: Exactly 10 synthetic subject-level feature vectors () are formed by randomly sampling one window vector per vowel:where
- Validation Integrity: To strictly prevent data leakage resulting from subject-level bootstrapping, all classification experiments utilize Group -Fold Cross-Validation (), where all 10 bootstrapped rows belonging to subject are strictly restricted to either the training set or the validation set within any given fold. Predictions are generated exclusively on the held-out validation subjects per fold, producing an un-biased Out-of-Fold (OOF) prediction matrix across the entire dataset for downstream evaluation.
2.8. Machine Learning and Model Evaluation
To evaluate the diagnostic utility of the extracted nonlinear acoustic features, machine learning models were developed using Random Forest (RF) and eXtreme Gradient Boosting (XGBoost) algorithms. These tree-based algorithms were selected for their inherent robustness against nonlinear data distributions and their ability to model complex feature interactions without requiring extensive data scaling.
Three distinct classification tasks were designed:
- DIP vs. Healthy: A binary classifier trained to distinguish patients with Drug-Induced Parkinsonism from healthy controls.
- IPD vs. Healthy: A binary classifier trained to distinguish patients with Idiopathic Parkinson’s Disease from healthy controls.
- Multi-Class Ensemble Classifier (DIP vs. IPD vs. Healthy): A multi-class framework designed to categorize an acoustic profile into one of the three clinical states.
A significant methodological challenge in merging these cohorts was class imbalance, owing to the large size of the IPD and Healthy datasets relative to the DIP cohort. To fully utilize larger datasets without inducing predictive bias toward the majority classes, a multi-class ensemble approach comprising 7 independent models was developed. For each of the 7 models, the IPD and Healthy cohorts were randomly under-sampled to exactly match the size of the DIP cohort, guaranteeing a perfectly balanced 1:1:1 training ratio. The final multi-class prediction was derived by aggregating the outputs of these 7 models via majority voting.
2.9. Model Validation
Model performance was comprehensively evaluated on the concatenated Out-of-Fold (OOF) predictions using standard classification metrics, including Accuracy, Precision, Recall (Sensitivity), -Score, and the Area Under the Receiver Operating Characteristic Curve (ROC-AUC). Hyperparameter tuning for both RF and XGBoost architectures was executed using nested grid search, optimizing the out-of-fold -score across the validation splits. Subject-level probability scores were aggregated across the 10 bootstrapped samples per subject to yield final subject-level ROC-AUC and diagnostic precision.
3. Results
3.1. Hilbert Huang Transform Markers
As illustrated in Figure 3a,b, a statistically significant difference emerges in the lower-frequency Intrinsic Mode Function (IMF) regimes for sustained vowel /a/. Specifically, IMF 4, IMF 3, and IMF 2 exhibit higher values in healthy controls (, , and , respectively). This indicates that the variance of low-frequency oscillations is decreased in DIP, likely reflecting vocal fold motor restriction and laryngeal rigidity in patients.
However, a broader investigation across all vowel phonemes in Figure 3c,d reveal no consistent or universal trend in the HHT metrics between cohorts. Because empirical mode decomposition characteristics depend inherently on the acoustic properties of the produced sound, vowel-specific articulatory dynamics exert distinct effects on the extracted physical metrics. This highlights the role of HHT sound characteristics as a vowel-dependent augmentation marker and underscores the diagnostic superiority of universal nonlinear markers including RQA and Sample Entropy, which we will discuss in the next section.
3.2. Nonlinear System Markers
3.2.1. DIP vs. HC
In Figure 4a,b, a comprehensive evaluation of nonlinear dynamics and phase-space metrics reveals significant laryngeal motor degradation in patients with Drug-Induced Parkinsonism (DIP) compared to healthy controls across multiple cardinal vowels. Unlike the vowel-dependent variations observed in frequency-domain HHT features, key nonlinear measures, specifically Sample Entropy, Correlation Dimension (), and Recurrence Quantification Analysis (RQA) metrics, demonstrate remarkable consistency and diagnostic utility across phoneme contexts.
A striking increase in vocal dynamic complexity and irregularity is observed in DIP patients. Sample Entropy exhibits substantial positive effect sizes across all phonemes, reaching statistical significance in vowels /o/ (), /u/ (), and /e/ (), reflecting an increase in aperiodic, turbulent vocal fold vibration secondary to incomplete glottal closure and impaired muscle tone control.
Concurrently, phase-space attractor complexity, quantified via Correlation Dimension (), is consistently elevated in DIP cohort. As illustrated in Figure 2c and Figure 4a,b, DIP patients exhibit a higher spatial embedding dimension across vowels /o/ () and /u/ (). This increase in indicates a higher number of active degrees of freedom governing vocal fold oscillation, confirming that neurogenic disruption in DIP shifts smooth, low-dimensional glottal attractors toward higher-dimensional chaotic states.
From a vocal tract aerodynamic perspective, the heightened nonlinearity observed in high-to-mid back rounded vowels, specifically /o/ and /u/, can be attributed to the acoustic coupling between the laryngeal source and the vocal tract configuration. As established in classical acoustic theory, back rounded vowels such as /o/ and /u/ require lip rounding and protraction, which constricts the anterior vocal tract exit and lengthens the overall tract cavity. This anterior constriction elevates acoustic impedance and supra-glottal backpressure, creating a semi-occluded vocal tract (SOVT) environment [35,36,37].
When the laryngeal musculature functions normally, this inertive reactance supports stable glottal self-oscillation. As detailed by Franca (2012) [36], high-back rounded vowels (/u/) and mid-back rounded vowels (/o/) demonstrate statistically significant reductions in shimmer and voice turbulence in healthy controls compared to front unrounded vowels, establishing back vowels as highly stable acoustic tasks in normative speech. However, under the neurogenic dysregulation and muscular rigidity characteristic of DIP, the added acoustic loading severely amplifies underlying glottal irregularities. Consequently, minor asymmetrical oscillations or incomplete glottal closures are translated into pronounced acoustic turbulence and chaotic path divergence, as summarized in Table 1.
Although entropy and correlation dimension metrics offer more intuitive physical insights into patient–control differences than HHT features, their statistical significance remains vowel-dependent. In contrast, Recurrence Quantification Analysis (RQA) metrics demonstrate the most robust diagnostic separation between DIP patients and healthy controls across phonemic contexts, with recurrence structures universally lower in patients.
Among the evaluated RQA metrics, a pronounced and statistically significant collapse in determinism (RQA DET) is observed across all five cardinal vowels: /a/ (d = −0.90, p < 0.001), /o/ (d = −0.74, p < 0.001), /e/ (d = −0.66, p = 0.004), /u/ (d = −0.66, p = 0.008), and /i/ (d = −0.46, p = 0.044). This sharp drop in diagonal line structures within reconstructed phase space signifies a fundamental loss of predictable, rule-governed vocal fold periodicity, primarily driven by laryngeal micro-tremors and glottal instability.
Parallel to this deterministic degradation, vertical line recurrence structures (RQA LAM), which quantify phase-space intermittency and trapped states, are significantly reduced in patients with Drug-Induced Parkinsonism across /a/ (d = −0.82, p < 0.001), /o/ (d = −0.58, p = 0.019), /e/ (d = −0.55, p = 0.008), and /i/ (d = −0.49, p = 0.038). Furthermore, overall trajectory recurrence rate (RQA RR) is markedly diminished, reaching robust statistical significance in vowels /a/ (d = −0.97, p < 0.001), /e/ (d = −0.52, p = 0.021), and /o/ (d = −0.43, p = 0.032), collectively demonstrating a systemic breakdown of phase-space recurrence dynamics in pathological voice production.
3.2.2. DIP vs. IPD
As demonstrated in Table 2, DIP patients exhibit significantly more severe degradation in phase-space recurrence rate (d = −0.61, p < 0.001), determinism (d = −0.73, p < 0.001), and laminarity (d = −0.58, p < 0.001). Furthermore, Sample Entropy (d = 0.52, p < 0.001), Correlation Dimension (d = 0.31, p < 0.001), and Lyapunov Exponent (d = 0.27, p = 0.01) are markedly higher in DIP than in IPD.
These findings indicate greater disruption of recurrent and regular vocal dynamics in the DIP dataset relative to the IPD dataset. Although DIP and IPD differ in their underlying pathophysiology, specifically pharmacological dopamine-receptor blockade versus progressive nigrostriatal neurodegeneration, the present cross-dataset design does not permit these acoustic differences to be attributed directly to specific neurobiological mechanisms and may be an artifact caused by inconsistent symptom severity.
3.3. DIEPSS Scale Comparison
The clinical severity of patients with drug-induced parkinsonism (DIP) was assessed using the Drug-Induced Extrapyramidal Symptoms Scale (DIEPSS), which comprises nine individual items: Gait, Bradykinesia, Sialorrhea, Rigidity, Tremor, Akathisia, Dyskinesia, Dystonia, and Overall Severity [4,5,6]. Each item is scored from 0 (normal) to 4 (severe) through objective observation and clinical interviews. To evaluate the association between the extracted acoustic metrics and clinical severity, Spearman rank correlations were computed across the DIP patient database and visualized using Quantile-Quantile (Q-Q) plots, with inflation factors calculated for both mean () and median () to account for feature panel scale ( metrics; Figure 5).
For most DIEPSS items (Gait, Bradykinesia, Sialorrhea, Rigidity, Tremor, Akathisia, Dystonia and Overall Severity), the observed -value distributions aligned closely with or fell below the null expectation line (), reflecting an absence of widespread correlation with the acoustic metrics within the patient group. In contrast, Dyskinesia (DIEPSS-8) demonstrated a marked upward departure from the null line on the Q-Q plot, accompanied by substantial distribution-wide inflation (, ). Global significance testing confirmed that this systematic deviation was statistically significant (Fisher’s combined test, ; Kolmogorov-Smirnov test, ). This selective enrichment suggests that glottal dynamic instability among DIP patients is predominantly driven by dyskinetic manifestations.
In contrast, expanding the analysis across all participants, including healthy controls (HC) and patients with drug-induced parkinsonism (DIP), yielded markedly different results. As illustrated in Figure 6, subscores for DIEPSS 1, 2, 4, 5, 8, and 9 reached robust statistical significance across both Fisher’s combined probability test and the Kolmogorov–Smirnov (KS) test, with each demonstrating inflation factors () exceeding 2. Specifically, marked deviations from the null distribution were observed in Gait (Fisher’s , KS ), Bradykinesia (Fisher’s , KS ), Rigidity (Fisher’s , KS ), Tremor (Fisher’s , KS ), Dyskinesia (Fisher’s , KS ), and Overall Severity (Fisher’s , KS ). While Sialorrhea and Akathisia also achieved nominal significance under Fisher’s test (Fisher’s and , respectively), neither reached significance in the KS test (KS and ), and Dystonia remained non-significant across both metrics (Fisher’s , KS ). This divergence indicates that while primary motor signs distinguish the disease state from healthy physiology across the entire cohort, within-group acoustic heterogeneity in DIP is selectively sensitive to dyskinesia.
3.4. Machine Learning Results
3.4.1. Binary DIP vs. HC Model
To evaluate the clinical diagnostic capability of the extracted multi-vowel nonlinear feature space, binary classification models were trained using eXtreme Gradient Boosting (XGBoost) and Random Forest (RF) algorithms. Model evaluation was conducted using 5-fold Group Cross-Validation grouped strictly by subject to ensure complete isolation across splits, with performance metrics computed directly on concatenated Out-of-Fold (OOF) predictions.
As summarized in Table 3, Random Forest achieved superior overall classification performance compared to XGBoost, yielding an Out-of-Fold ROC-AUC of 0.85, an accuracy of 0.86, an -score of 0.91, and clinical sensitivity of 0.99. XGBoost yielded a lower ROC-AUC of 0.80 and an accuracy of 0.79. The relative advantage of Random Forest may partly reflect its bagging architecture, which can reduce variance in modest-sized datasets. (, ). Notably, both models exhibited a specificity of 0.50, indicating high sensitivity but limited specificity, likely reflecting the trade-off induced by class imbalance () prior to probability thresholding.
To examine the features contributing to classifier predictions, Shapley Additive Explanations (SHAP) were computed across Out-of-Fold validation sets for both models, illustrated in Figure 7.
While nonlinear chaos metrics dominated predictive importance, specific HHT-derived features, such as o_imf_2_energy_ratio and a_imf_3_freq_variance, provided complementary diagnostic information, consistent with the statistical analyses and supporting HHT-derived measures as vowel-dependent augmentation features.
3.4.2. Binary IPD vs. HC Model
To validate the generalizability and diagnostic efficacy of our physics-grounded nonlinear acoustic framework, a single-vowel () binary classification model was trained on the external Idiopathic Parkinson’s Disease cohort (, ). Benchmarking on IPD enables direct comparison with the extensive existing voice diagnostic literature. Model evaluation was executed via 5-fold cross-validation, with performance metrics calculated directly on out-of-fold (OOF) predictions.
As summarized in Table 4, XGBoost achieved exceptional diagnostic performance, reaching an Out-of-Fold ROC-AUC of 0.98, an accuracy of 0.93, and balanced sensitivity and specificity of 0.93. Random Forest similarly yielded high performance, achieving an ROC-AUC of 0.97 and an accuracy of 0.90. The Receiver Operating Characteristic (ROC) curves across datasets and architectures are illustrated in Figure 8, highlighting the stark performance advantage achieved on the larger IPD cohort.
The 93% accuracy achieved by XGBoost aligns with median benchmark results reported across comprehensive systematic reviews of machine learning voice diagnostics for Parkinson’s disease [23]. Crucially, this suggests that replacing black-box feature extraction with interpretable HHT spectral parameters and nonlinear dynamic metrics incurs little-to-no performance trade-off, offering a potentially interpretable framework for neurogenic voice classification.
3.4.3. Multiclass Ensemble Model
To achieve a differential diagnostic capability across all three clinical states, Drug-Induced Parkinsonism (DIP), Idiopathic Parkinson’s Disease (IPD), and Healthy Controls (HC), a multi-class classification architecture was evaluated. To address severe dataset size disparities across cohorts, a 7-Model Balanced Under-Sampling Ensemble was deployed, enforcing a balanced 1:1:1 training ratio ( per class) per fold, with final Out-of-Fold (OOF) predictions aggregated via majority voting.
As illustrated in Figure 9, the multi-class ensemble achieved an overall diagnostic accuracy of 76.0%, with perfectly balanced macro-averaged precision, recall, and -score (all 0.760). Class-specific evaluation revealed robust diagnostic performance across all cohorts. Specifically, the model accurately identified 62 out of 82 patients with Drug-Induced Parkinsonism (DIP), yielding a recall of 0.756, a precision of 0.775, and an -score of 0.765. Misclassifications for the DIP cohort were evenly distributed, with 10 instances categorized as Healthy Controls (HC) and 10 as Idiopathic Parkinson’s Disease (IPD). For the healthy control cohort, the classifier successfully identified 65 out of 82 subjects (Recall = 0.793, Precision = 0.756, -Score = 0.774), demonstrating clear separation between healthy phonation and pathological vocal degradation. Similarly, the model correctly classified 60 out of 82 IPD subjects (Recall = 0.732, Precision = 0.750, -Score = 0.741). Cross-pathology confusions occurred symmetrically between IPD and DIP, with 11 IPD instances misclassified as DIP and 11 DIP instances misclassified as IPD.
The balanced diagonal performance across all three classes confirms that the 7-model under-sampling ensemble successfully prevented predictive bias toward any single cohort. Crucially, the model demonstrates that nonlinear chaos dynamics and Hilbert-Huang spectral metrics contain sufficient discriminative power to separate not only healthy voices from pathological speech, but also to differentiate Drug-Induced Parkinsonism from Idiopathic Parkinson’s Disease.
4. Discussion
The findings of this study establish that physics-grounded nonlinear acoustics and Hilbert–Huang spectral metrics provide a sensitive, non-invasive probe for detecting and differentiating Drug-Induced Parkinsonism (DIP) from Idiopathic Parkinson’s Disease (IPD) and healthy states. By shifting the acoustic analytical paradigm from traditional linear perturbation measures to phase-space chaos and empirical mode decomposition, this framework addresses the fundamental physical reality of human phonation as a nonlinear, non-stationary dynamical system. The marked elevation in Sample Entropy and Correlation Dimension () observed in DIP patients reflects an increase in active degrees of freedom and chaotic trajectory divergence during vocal fold oscillation. Biomechanically, antipsychotic-induced blockade of central dopamine receptors induces extrapyramidal hypertonicity, muscle rigidity, and incomplete glottal closure. When subglottal airflow passes through an irregularly approximated glottis, smooth periodic oscillation degenerates into turbulent, aperiodic tissue vibration, driving the system toward higher-dimensional chaos [38].
HHT-derived frequency variability exhibited clear vowel-dependent behavior. For example, during sustained /a/ phonation, frequency variance was reduced in the lower-frequency IMFs (IMF 4, IMF 3, and IMF 2), whereas sustained /e/ and /u/ phonations showed increased variance in IMF 4 and IMF 1, respectively. Although reduced fundamental frequency variability during connected or running speech and increased jitter during sustained phonation have been reported in Parkinson’s disease in specific study contexts [9,12,39], our findings in DIP suggest that frequency variability is not expressed uniformly across phonetic conditions. This interpretation is consistent with evidence that fundamental frequency and related acoustic variability are influenced by speech-task and linguistic characteristics, including lexical stress and differences between sustained phonation and connected speech [40,41,42]. Accordingly, HHT-derived frequency variability may be better interpreted as a phoneme- and task-sensitive marker rather than a universal disease signature.
In addition, our findings reveal a second form of phoneme-specific sensitivity related to articulatory geometry. The heightened nonlinearity observed in the high-to-mid back rounded vowels /u/ and /o/ is consistent with source–filter acoustic coupling. Lip rounding and posterior tongue elevation constrict the anterior vocal tract and lengthen the acoustic tube, creating a semi-occluded vocal tract (SOVT) configuration [35,36,37]. In healthy phonation, the resulting supraglottal backpressure and inertive reactance may contribute to more stable vocal-fold oscillation. Under extrapyramidal motor dysfunction, however, this acoustic loading may make underlying glottal irregularities more acoustically apparent. This may help explain why /u/ and /o/ showed the largest Sample Entropy effect sizes (d = +0.95 and d = +0.80, respectively).
While entropy metrics showed vowel-dependent significance, RQA demonstrated more consistent cross-vowel abnormalities, particularly for determinism (DET), which was significantly reduced across all five vowels. This pattern is consistent with previous voice-disorder studies showing reduced diagonal recurrence structures and lower regularity in pathological phonation, with DET also reported to be lower in disordered than in normal voices [43,44]. In contrast, recurrence rate (RR) and laminarity (LAM) also tended to decrease across vowels in our DIP cohort, but their statistical significance was less consistent. Notably, prior studies have not shown uniform changes in these measures; for example, LAM may remain unchanged or even increase slightly in some pathological voice datasets. Such discrepancies may reflect differences in the underlying disorder, recording protocol, embedding parameters, recurrence threshold, or RQA implementation. Overall, these findings suggest that reduced DET may represent a relatively robust marker of disrupted vocal dynamical regularity, whereas RR and LAM may be more sensitive to disease and method specific conditions.
Analysis within the DIP cohort using individual DIEPSS domains demonstrated that acoustic abnormalities were most prominently associated with dyskinesia compared with the other extrapyramidal symptom dimensions. Several findings may explain this selective association. First, dyskinesia has been reported to demonstrate the highest node-strength centrality within the extrapyramidal symptom network, suggesting that it represents a highly interconnected domain of antipsychotic-induced motor dysfunction [45]. Second, patients with dyskinesia have demonstrated substantially greater segment-to-segment fluctuations in formant frequencies [46], consistent with unstable articulatory motor control. Related studies have also described excessive formant fluctuations and vowel distortion during sustained phonation in dysarthric speech [47]. Clinically, dyskinetic movements may involve oral and pharyngeal musculature as well as other body regions; involvement of the mouth and throat can interfere directly with articulation and may coexist with salivation, swallowing difficulty, reduced speech rate, and impaired pronunciation [48,49]. Collectively, these observations provide a plausible clinical and biomechanical basis for the particularly strong association between dyskinesia and the nonlinear acoustic abnormalities observed within our DIP cohort.
When healthy controls, who by definition had no extrapyramidal manifestations and were therefore assigned a score of zero across DIEPSS domains, were included in the analysis, a broader pattern emerged. Gait, bradykinesia, rigidity, tremor, dyskinesia, and overall severity all showed significant acoustic associations. This broader involvement of parkinsonian motor domains in vocal dysfunction is also supported by findings from Parkinson’s disease, as evidenced by several clinical and acoustic observations. Re-emergent vocal tremors during sustained vowel phonation has been reported in a patient who also exhibited rigidity and mild bradykinesia during longitudinal follow-up [50]. Moreover, although vocal tremor was acoustically detectable at similar frequencies in both patients with Parkinson’s disease and healthy controls, patients with Parkinson’s disease showed significantly greater tremor amplitude [51]. Smoothed cepstral peak prominence (CPPS) has also shown trends toward associations with rigidity and bradykinesia [52]. These findings are consistent with the clinical characteristics of hypokinetic dysarthria, in which rigidity and bradykinesia contribute to articulatory undershoot, breathy phonation, and reduced vocal intensity [53]. Moreover, the contribution of overall severity is supported by studies showing that higher Hoehn–Yahr stages and Unified Parkinson’s Disease Rating Scale (UPDRS) scores are associated with greater perceptual voice impairment, reduced phonatory performance, and poorer speech articulation [54,55,56], suggesting that vocal abnormalities may reflect the cumulative burden of parkinsonian motor dysfunction.
Taken together, these findings demonstrate substantial clinical and acoustic overlaps between DIP and PD, suggesting broadly convergent effects of parkinsonian motor dysfunction on phonatory and articulatory control. Dyskinesia, however, may represent an important point of divergence. Unlike bradykinesia, rigidity, tremor, and gait disturbance, dyskinesia is not a cardinal manifestation of untreated PD and is most commonly recognized as a treatment-related motor complication, particularly following chronic levodopa exposure [57,58,59]. In contrast, within our DIP cohort, dyskinesia emerged as the DIEPSS domain most strongly associated with acoustic abnormalities. This finding suggests that dyskinesia-related vocal instability may represent a distinctive feature of DIP beyond the acoustic manifestations shared with PD.
Exploratory comparison between the DIP and IPD cohorts identified distinct normalized nonlinear acoustic profiles. Relative to their respective healthy-control reference groups, the DIP cohort showed greater reductions in phase-space determinism, laminarity, and recurrence rate, together with higher Sample Entropy and Correlation Dimension than the IPD cohort. These differences are compatible with the distinct clinical and pathophysiological contexts of the two disorders; however, given the cross-dataset design, they should not be interpreted as direct evidence of disease-specific neurobiological mechanisms. IPD is a progressive neurodegenerative disorder that frequently presents with asymmetric motor involvement, whereas DIP arises in the context of pharmacological dopamine-receptor blockades and is often characterized by more symmetric motor manifestations. Whether these differences contribute to the observed patterns of laryngeal instability and phase-space dynamics warrants investigation in prospectively matched cohorts recorded under standardized conditions. As a proof-of-concept analysis, the balanced multi-class ensemble achieved an overall accuracy of 76.0%, with comparable class-specific F1-scores across DIP, IPD, and healthy controls. These findings suggest that nonlinear voice features may contain information relevant to differentiating drug-induced from idiopathic parkinsonism, while prospective external validation is required before clinical diagnostic application.
Despite these promising outcomes, several methodological limitations must be acknowledged. First, the primary DIP cohort size (, ) remains small, which constrained model specificity during binary classification prior to ensemble balancing. In addition, age differed significantly between the DIP and HC groups, and residual demographic confounding cannot be excluded. Future studies should therefore recruit larger and more demographically comparable cohorts across diverse psychiatric settings to further evaluate the generalizability of these findings. Second, cross-disease comparisons relied on merging our primary multi-vowel dataset with an external, single-vowel () IPD dataset. Although baseline -score normalization against matched healthy control cohorts was rigorously applied to neutralize acoustic recording discrepancies, subtle batch effects stemming from differing microphone hardware and recording environments cannot be entirely ruled out. Third, the cross-cohort comparison between IPD and DIP did not explicitly account for extrapyramidal symptom (EPS) clinical severity scores, such as the Drug-Induced Extrapyramidal Symptom Scale (DIEPSS) or the Extrapyramidal Symptom Rating Scale (ESRS). While our nonlinear framework successfully differentiated the two movement disorders based on acoustic chaos and phase-space dynamics, future prospective studies should aim to collect standardized multi-vowel acoustic recordings simultaneously alongside detailed clinical rating scales from matched IPD, DIP, and healthy cohorts under identical acoustic conditions to further refine multi-class differential accuracy and stratify acoustic biomarkers by motor symptom severity.
5. Conclusions
This study establishes a physics-grounded, nonlinear acoustic framework for characterizing laryngeal motor dysfunction in Drug-Induced Parkinsonism (DIP). By integrating interpretable Hilbert–Huang Transform (HHT)-derived spectral descriptors with entropy, phase-space chaos, and Recurrence Quantification Analysis (RQA), the framework extends conventional acoustic analysis beyond purely discriminative features toward a more mechanistically interpretable description of vocal dynamics. HHT-derived parameters provided vowel-dependent information on frequency variability and energy organization, whereas nonlinear measures revealed greater vocal irregularity and attractor complexity in DIP. Most notably, RQA demonstrated a consistent reduction in recurrence rate, determinism, and laminarity across phonemic contexts, indicating a generalized loss of stable and recurrent vocal-fold dynamics.
The multi-vowel analysis further showed that rounded back vowels, particularly /u/ and /o/, were especially sensitive to nonlinear abnormalities, supporting an interaction between laryngeal instability and vowel-dependent source–filter coupling. Within the DIP cohort, DIEPSS analysis identified dyskinesia as the most prominent symptom-specific acoustic correlate. In contrast, when associations were examined across healthy controls and patients with DIP, a broader pattern emerged, with gait disturbance, bradykinesia, rigidity, tremor, dyskinesia, and overall severity all showing significant acoustic associations. These findings suggest that, at the group level, DIP-related vocal abnormalities reflect the convergent effects of multiple parkinsonian motor disturbances on phonatory and articulatory control, whereas dyskinesia may represent a more distinctive source of inter-individual acoustic variability within DIP.
Finally, for exploratory analysis, these interpretable acoustic features retained substantial diagnostic utility. The Random Forest model achieved a ROC-AUC of 0.85 with 99% sensitivity and 50% specificity for DIP versus healthy controls, while the balanced three-class ensemble achieved 76% accuracy in differentiating DIP, IPD, and healthy participants. Taken together, these findings support nonlinear voice analysis as a non-invasive and interpretable approach for detecting laryngeal motor instability, characterizing symptom-specific extrapyramidal effects, and assisting differential diagnosis between drug-induced and idiopathic parkinsonism.
Author Contributions
Conceptualization, A.A.L. and C.L.; methodology, A.A.L. and C.L.; software, A.A.L.; validation, A.A.L. and C.L.; formal analysis, A.A.L.; investigation, A.A.L. and C.L.; resources, C.L.; data curation, C.L.; writing—original draft preparation, A.A.L.; writing—review and editing, A.A.L.; visualization, A.A.L.; supervision, C.L.; project administration, C.L.; funding acquisition, C.L. All authors have read and agreed to the published version of the manuscript.
Funding
This research was funded by Jianan Psychiatric Center and the Ministry of Health and Welfare in Taiwan, under Grant Number 2021-A02. The APC was funded by The Department of General Psychiatry Taoyuan Psychiatric Center, MOHW Taoyuan, Taiwan.
Institutional Review Board Statement
The study was conducted in accordance with the Declaration of Helsinki and approved by the Institutional Review Board of Jianan Psychiatric Center under IRB-20-010 at 2021 05/27.
Informed Consent Statement
Informed consent was obtained from all subjects involved in the study. Written informed consent has been obtained from the patient(s) to publish this paper.
Data Availability Statement
The data is available on request.
Acknowledgments
During the preparation of this manuscript/study, the author(s) used Gemini 3.1 Pro for the purposes of coding. The authors have reviewed and edited the output and take full responsibility for the content of this publication.
Conflicts of Interest
The authors declare no conflicts of interest. The funders had no role in the design of the study.
Abbreviations
The following abbreviations are used in this manuscript:
| DIP | Drug-Induced Parkinsonism |
| EPS | Extrapyramidal Symptoms |
| DIEPSS | Drug-Induced Extrapyramidal Symptoms Scale |
| ROC | Receiver Operating Characteristic |
| AUC | Area Under Curve |
| IPD | Idiopathic Parkinson’s Disease |
| HC | Healthy Control |
| HHT | Hilbert–Huang Transform |
| IMF | Intrinsic Mode Function |
| EEMD | Ensemble Empirical Mode Decomposition |
| RQA | Recurrence Quantification Analysis |
| RR | Recurrence Rate |
| DET | Determinism |
| LAM | Laminarity |
| FDR | False Discovery Rate |
| RF | Random Forest |
| XGBoost | eXtreme Gradient Boosting |
| OOF | Out-of-Fold |
| SOVT | Semi-occluded Vocal Tract |
| SHAP | Shapley Additive Explanations |
| KS | Kolmogorov–Smirnov |
Appendix A
Appendix A.1. Age Related Associations
Analysis of age via Spearman rank correlations verify the validity of our findings. An overall feature inflation factor of was obtained by the methods mentioned above. Though Kolmogorov-Smirnov (KS) Test (p = ) indicates a significant difference, further discussion into confounding factors could explain different mechanisms compared to DIP-HC exist, thus supporting that the aforementioned results in the paper are not artifacts of inadequate age control (F = 49.7, p < 0.01).
This point could be made due to the following reasons. First, assessing KS group significance with uniform distribution, results from DIP vs. HC are more significant compared to age group analysis, with KS statistics of 0.237 and 0.174 respectively, as visualized in QQ plots in Figure A1. This means DIP contributes more changes in physics biomarkers to what pure age provides. Second, as detailed in Table A1, features of significance in spearman age analysis do not overlap with DIP vs. HC. Third, supplementary findings indicate that age alters vowel specific HHT results like IMF 4 energy ratio (/o/) or IMF 2 frequency entropy (/e/), while DIP alters broad nonlinear metrics like sample entropy, correlation dimension, and RQA results, pointing to mechanistic differences.
Figure A1.
Quantile-Quantile plot of (a) logarithmic p value distribution of Spearman age correlation, Median Inflation Factor , Mean Inflation Factor , KS p value (b) logarithmic p value distribution of DIP vs. HC significance, Median Inflation Factor , Mean Inflation Factor , KS p value .
Figure A1.
Quantile-Quantile plot of (a) logarithmic p value distribution of Spearman age correlation, Median Inflation Factor , Mean Inflation Factor , KS p value (b) logarithmic p value distribution of DIP vs. HC significance, Median Inflation Factor , Mean Inflation Factor , KS p value .
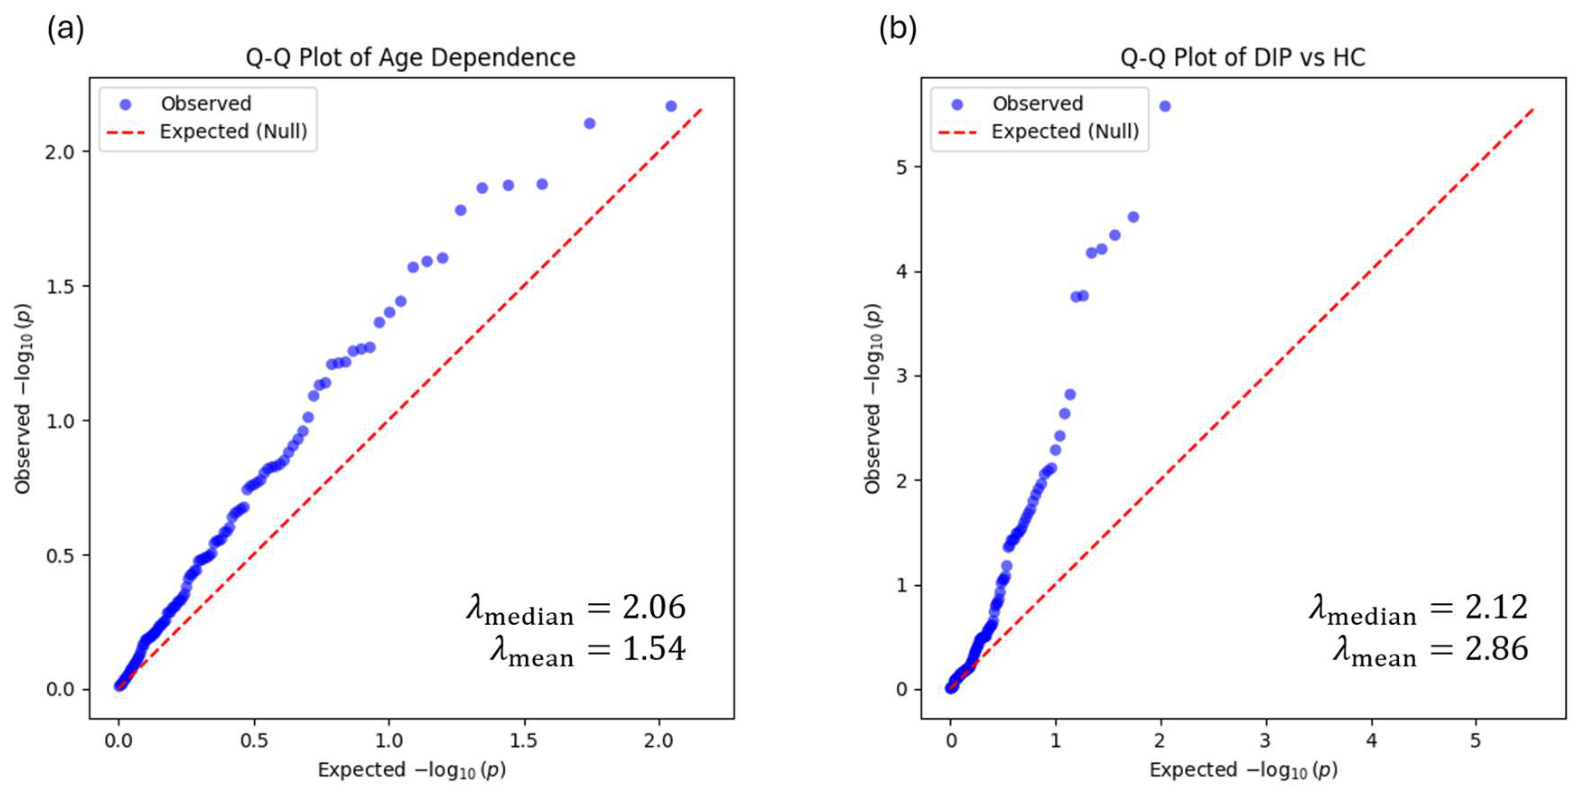

Table A1.
Features of significant correlation by age within DIP cohort.
| Age Spearman | DIP vs. HC | |||
|---|---|---|---|---|
| Nonlinear Feature | Correlation | p | Cohen’s d | p |
| o_imf_4_energy_ratio | 0.298488 | 0.006797 | 0.310231 | 0.775026 |
| e_imf_3_energy_ratio | 0.29329 | 0.007877 | −0.12031 | 0.316359 |
| e_imf_2_freq_entropy | 0.27416 | 0.013259 | −0.15636 | 0.676523 |
| u_imf_3_freq_variance | 0.273798 | 0.013386 | 0.076922 | 0.681335 |
| o_imf_2_freq_variance | 0.272928 | 0.013695 | −0.38156 | 0.090675 |
| e_imf_2_freq_variance | 0.265572 | 0.016566 | 0.026859 | 0.83091 |
| o_imf_3_freq_entropy | −0.24906 | 0.024949 | −0.18896 | 0.652664 |
| o_imf_3_energy_ratio | 0.247877 | 0.02567 | −0.02682 | 0.488206 |
| o_imf_3_freq_variance | 0.245742 | 0.027013 | −0.01268 | 0.934545 |
| o_imf_1_energy_ratio | −0.23326 | 0.036111 | 0.521977 | 0.023206 |
| o_lyapunov_exponent | 0.22903 | 0.03972 | −0.11588 | 0.705586 |
| i_imf_1_freq_entropy | 0.225131 | 0.04331 | −0.22529 | 0.265424 |
Appendix A.2. Adjusted Regression of Main DIP vs. HC Features
To address potential demographic confounding, multivariable regression models were fitted for the prespecified primary nonlinear acoustic features, with diagnostic group, age, and sex entered simultaneously as predictors. Benjamini–Hochberg false discovery rate correction was applied across the 25 primary vowel–feature comparisons.
After adjustment for age and sex, 15 of the 25 prespecified nonlinear vowel–feature associations remained significant after FDR correction. The most robust findings involved RQA metrics, particularly recurrence rate, determinism, and laminarity, together with increased Sample Entropy in round back vowels /u/, /o/, and /e/. These findings indicate that the principal DIP-associated nonlinear acoustic abnormalities cannot be explained solely by the substantial age difference between the DIP and healthy-control cohorts.
Table A2.
Adjusted regression for DIP vs. HC nonlinear features, FDR corrected.
| Feature | Unadjusted | Age + Sex Adjusted | 95% CI | p-Value | FDR |
|---|---|---|---|---|---|
| a_rqa_rr | −0.915 | −1.039 | [−1.513, −0.564] | 3.25 × 10⁻⁵ | 6.55 × 10⁻⁴ |
| a_rqa_det | −0.838 | −1.020 | [−1.500, −0.540] | 5.24 × 10⁻⁵ | 6.55 × 10⁻⁴ |
| a_rqa_lam | −0.765 | −0.957 | [−1.442, −0.472] | 1.63 × 10⁻⁴ | 0.0014 |
| e_rqa_lam | −0.522 | −0.898 | [−1.386, −0.410] | 4.13 × 10⁻⁴ | 0.0024 |
| u_sample_entropy | +0.882 | +0.870 | [0.391, 1.349] | 4.82 × 10⁻⁴ | 0.0024 |
| o_rqa_lam | −0.571 | −0.868 | [−1.357, −0.380] | 6.27 × 10⁻⁴ | 0.0025 |
| o_rqa_det | −0.728 | −0.861 | [−1.350, −0.372] | 7.05 × 10⁻⁴ | 0.0025 |
| u_rqa_det | −0.681 | −0.835 | [−1.329, −0.340] | 0.0011 | 0.0035 |
| o_sample_entropy | +0.771 | +0.810 | [0.320, 1.301] | 0.0014 | 0.0040 |
| e_rqa_det | −0.624 | −0.796 | [−1.295, −0.298] | 0.0020 | 0.0050 |
| u_rqa_lam | −0.342 | −0.672 | [−1.151, −0.192] | 0.0065 | 0.0148 |
| a_correlation_dimension | +0.408 | +0.634 | [0.145, 1.123] | 0.0115 | 0.0239 |
| e_rqa_rr | −0.493 | −0.644 | [−1.148, −0.140] | 0.0128 | 0.0246 |
| i_rqa_lam | −0.540 | −0.561 | [−1.058, −0.065] | 0.0271 | 0.0483 |
| e_sample_entropy | +0.515 | +0.566 | [0.059, 1.073] | 0.0291 | 0.0485 |
| o_rqa_rr | −0.440 | −0.531 | [−1.038, −0.024] | 0.0405 | 0.0598 |
| i_sample_entropy | +0.408 | +0.533 | [0.023, 1.043] | 0.0406 | 0.0598 |
| i_rqa_det | −0.531 | −0.501 | [−1.008, 0.006] | 0.0528 | 0.0733 |
| u_rqa_rr | −0.301 | −0.477 | [−0.975, 0.021] | 0.0601 | 0.0791 |
| a_sample_entropy | +0.323 | +0.453 | [−0.034, 0.940] | 0.0682 | 0.0852 |
References
- Whitworth, A.B.; Fleischhacker, W.W. Adverse effects of antipsychotic drugs. Int. Clin. Psychopharmacol. 1995, 9, 21–27. [Google Scholar] [CrossRef] [PubMed]
- Musco, S.; Ruekert, L.; Myers, J.; Anderson, D.; Welling, M.; Cunningham, E.A. Characteristics of Patients Experiencing Extrapyramidal Symptoms or Other Movement Disorders Related to Dopamine Receptor Blocking Agent Therapy. J. Clin. Psychopharmacol. 2019, 39, 336–343. [Google Scholar] [CrossRef] [PubMed]
- Shin, H.W.; Chung, S.J. Drug-induced parkinsonism. J. Clin. Neurol. 2012, 8, 15–21. [Google Scholar] [CrossRef] [PubMed]
- Chouinard, G.; Margolese, H.C. Manual for the extrapyramidal symptom rating scale (ESRS). Schizophr. Res. 2005, 76, 247–265. [Google Scholar] [CrossRef] [PubMed]
- Peljto, A.; Zamurovic, L.; Milovancevic, M.P.; Aleksic, B.; Tosevski, D.L.; Inada, T. Drug-induced Extrapyramidal Symptoms Scale (DIEPSS) Serbian Language version: Inter-rater and Test-retest Reliability. Sci. Rep. 2017, 7, 8105. [Google Scholar] [CrossRef] [PubMed]
- Kim, J.-H.; Jung, H.Y.; Kang, U.G.; Jeong, S.H.; Ahn, Y.M.; Byun, H.-J.; Ha, K.-S.; Kim, Y.S. Metric characteristics of the drug-induced extrapyramidal symptoms scale (DIEPSS): A practical combined rating scale for drug-induced movement disorders. Mov. Disord. 2002, 17, 1354–1359. [Google Scholar] [CrossRef] [PubMed]
- Bock, M.C.; et al. Clinical validation of the self-reported Glasgow Antipsychotic Side-effect Scale using the clinician-rated UKU side-effect scale as gold standard reference. J. Psychopharmacol. 2020, 34, 820–828. [Google Scholar] [CrossRef] [PubMed]
- Knol, W.; Keijsers, C.J.; Jansen, P.A.; van Marum, R.J. Systematic evaluation of rating scales for drug-induced parkinsonism and recommendations for future research. J. Clin. Psychopharmacol. 2010, 30, 57–63. [Google Scholar] [CrossRef] [PubMed]
- Harel, B.; Cannizzaro, M.; Snyder, P.J. Variability in fundamental frequency during speech in prodromal and incipient Parkinson’s disease: A longitudinal case study. Brain Cogn. 2004, 56, 24–29. [Google Scholar] [CrossRef] [PubMed]
- Karimi, A.; Moein, N.; D’Alessandro, E.; Bearss, K.A.; Robichaud, S.; Bar, R.J.; DeSouza, J.F.X. A Pilot Study Comparing Speech Characteristics in People With Parkinson’s Disease and Controls Dancing Weekly Over 5-Years. J. Voice 2025. [Google Scholar] [CrossRef] [PubMed]
- Fumel, J.; Bahuaud, D.; Weed, E.; Fusaroli, R.; Basirat, A. A Systematic Review and Bayesian Meta-Analysis of Acoustic Measures of Prosody in Parkinson’s Disease. J. Speech Lang. Hear Res. 2024, 67, 2548–2564. [Google Scholar] [CrossRef] [PubMed]
- Favaro, A.; Butala, A.; Thebaud, T.; et al. Unveiling early signs of Parkinson’s disease via a longitudinal analysis of celebrity speech recordings. npj Park. Dis. 2024, 10, 207. [Google Scholar] [CrossRef] [PubMed]
- Hammer, M.J.; Barlow, S.M. Laryngeal somatosensory deficits in Parkinson’s disease: Implications for speech respiratory and phonatory control. Exp. Brain Res. 2010, 201, 401–409. [Google Scholar] [CrossRef] [PubMed]
- Ma, A.; Lau, K.K.; Thyagarajan, D. Voice changes in Parkinson’s disease: What are they telling us? J. Clin. Neurosci. 2020, 72, 1–7. [Google Scholar] [CrossRef] [PubMed]
- Rusz, J.; et al. Quantitative acoustic measurements for characterization of speech and voice disorders in early untreated Parkinson’s disease. J. Acoust. Soc. Am. 2011, 129, 350–367. [Google Scholar] [CrossRef] [PubMed]
- Sedigh Malekroodi, H.; Lee, B.-I.; Yi, M. Voice-Based Detection of Parkinson’s Disease Using Machine and Deep Learning Approaches: A Systematic Review. Bioengineering 2025, 12, 1279. [Google Scholar] [CrossRef] [PubMed]
- Brahmi, Z.; Mahyoob, M.; Al-Sarem, M.; Algaraady, J.; Bousselmi, K.; Alblwi, A. Exploring the Role of Machine Learning in Diagnosing and Treating Speech Disorders: A Systematic Literature Review. Psychol. Res. Behav. Manag. 2024, 17, 2205–2232. [Google Scholar] [CrossRef] [PubMed]
- Gupta, R.; Gunjawate, D.R.; Nguyen, D.D.; Jin, C.; Madill, C. Voice disorder recognition using machine learning: A scoping review protocol. BMJ Open 2024, 14, e076998. [Google Scholar] [CrossRef] [PubMed]
- Paduthala, J.M.; Joseph, N.; Thomas, S.; Varghese, N.A.; Mahesh, S. Comparative Analysis of Machine Learning Models for Speech Disorder Detection. In Proceedings of the 2025 2nd International Conference on Trends in Engineering Systems and Technologies (ICTEST), Ernakulam, India, 3–5 April 2025; pp. 1–6. [Google Scholar] [CrossRef]
- Mei, J.; Desrosiers, C.; Frasnelli, J. Machine learning for the diagnosis of Parkinson’s disease: A review of literature. Front. Aging Neurosci. 2021, 13, 633752. [Google Scholar] [CrossRef] [PubMed]
- Jeancolas, L.; et al. X-vectors: New quantitative biomarkers for early Parkinson’s disease detection from speech. Front. Neuroinformatics 2021, 15, 578369. [Google Scholar] [CrossRef] [PubMed]
- Ngo, Q.C.; et al. Computerized analysis of speech and voice for Parkinson’s disease: A systematic review. Comput. Methods Programs Biomed. 2022, 226, 107133. [Google Scholar] [CrossRef] [PubMed]
- Altham, C.; Zhang, H.; Pereira, E. Machine learning for the detection and diagnosis of cognitive impairment in Parkinson’s disease: A systematic review. PLoS ONE 2024, 19, e0303644. [Google Scholar] [CrossRef] [PubMed]
- Meral, M.; Ozbilgin, F.; Durmus, F. Fine-Tuned Machine Learning Classifiers for Diagnosing Parkinson’s Disease Using Vocal Characteristics: A Comparative Analysis. Diagnostics 2025, 15, 645. [Google Scholar] [CrossRef] [PubMed]
- Little, M.A.; et al. Exploiting Nonlinear Recurrence and Fractal Scaling Properties for Voice Disorder Detection. Biomed. Eng. OnLine 2007, 6, 23. [Google Scholar] [CrossRef] [PubMed]
- Huang, N.E. Introduction to the Hilbert–Huang transform and its related mathematical problems. Hilbert-Huang Transform Its Appl. 2005, 1–26. [Google Scholar] [CrossRef]
- Ma, Y.; Zheng, F.; Lu, J.; et al. A computer-aided diagnosis system of parkinson’s disease based on hilbert spectrum features of speech. Sci. Rep. 2026, 16, 2738. [Google Scholar] [CrossRef] [PubMed]
- Er, M.B.; İlhan, N. Voice Pathology Detection Based on Canonical Correlation Analysis Method Using Hilbert–Huang Transform and LSTM Features. Arab J. Sci. Eng. 2025, 50, 11693–11711. [Google Scholar] [CrossRef]
- Available online: https://www.kaggle.com/datasets/ucimachinelearning/parkinsons-voice-dataset.
- Takens, F. Detecting Strange Attractors in Turbulence. In Dynamical Systems and Turbulence; Rand, D., Young, L.S., Eds.; Lecture Notes in Mathematics; Springer: Berlin/Heidelberg, Germany, 1981; Volume 898. [Google Scholar] [CrossRef]
- Fraser, A.M.; Swinney, H.L. Independent coordinates for strange attractors from mutual information. Phys. Rev. A Gen. Phys. 1986, 33, 1134–1140. [Google Scholar] [CrossRef] [PubMed]
- Kennel, M.B.; Brown, R.; Abarbanel, H.D. Determining embedding dimension for phase-space reconstruction using a geometrical construction. Phys. Rev. A 1992, 45, 3403–3411. [Google Scholar] [CrossRef] [PubMed]
- Grassberger, P.; Procaccia, I. Characterization of Strange Attractors. Phys. Rev. Lett. 1983, 50, 346–349. [Google Scholar] [CrossRef]
- Rosenstein, M.T.; Collins, J.J.; De Luca, C.J. A practical method for calculating largest Lyapunov exponents from small data sets. Physica D. Nonlinear Phenom. 1993, 65, 117–134. [Google Scholar] [CrossRef]
- Titze, I.R. Voice training and therapy with a semi-occluded vocal tract: Rationale and scientific underpinnings. J. Speech Lang. Hear Res. 2006, 49, 448–459. [Google Scholar] [CrossRef] [PubMed]
- Franca, M.C. Acoustic comparison of vowel sounds among adult females. J. Voice 2012, 26, 671.e9–671.e17. [Google Scholar] [CrossRef] [PubMed]
- Story, B.H.; Laukkanen, A.M.; Titze, I.R. Acoustic impedance of an artificially lengthened and constricted vocal tract. J. Voice 2000, 14, 455–469. [Google Scholar] [CrossRef] [PubMed]
- Rahn, D.A.; Chou, M.; Jiang, J.J.; Zhang, Y. Phonatory Impairment in Parkinson’s Disease: Evidence from Nonlinear Dynamic Analysis and Perturbation Analysis. J. Voice 2007, 21, 64–71. [Google Scholar] [CrossRef] [PubMed]
- Jiménez-Jiménez, F.J.; Gamboa, J.; Nieto, A.; Guerrero, J.; Orti-Pareja, M.; Molina, J.A.; García-Albea, E.; Cobeta, I. Acoustic voice analysis in untreated patients with Parkinson’s disease. Park. Relat. Disord. 1997, 3, 111–116. [Google Scholar] [CrossRef] [PubMed]
- Bowen, L.K.; Hands, G.L.; Pradhan, S.; Stepp, C.E. Effects of Parkinson’s Disease on Fundamental Frequency Variability in Running Speech. J. Med. Speech Lang. Pathol. 2013, 21, 235–244. [Google Scholar] [PubMed] [PubMed Central]
- Exner, A.H.; Francis, A.L.; MacPherson, M.K.; Darling-White, M.; Huber, J.E. The Effects of Speech Task on Lexical Stress in Parkinson’s Disease. Am. J. Speech-Lang. Pathol. 2023, 32, 506–522. [Google Scholar] [CrossRef] [PubMed]
- Rusz, J.; Cmejla, R.; Tykalova, T.; Ruzickova, H.; Klempir, J.; Majerova, V.; Picmausova, J.; Roth, J.; Ruzicka, E. Imprecise vowel articulation as a potential early marker of Parkinson’s disease: Effect of speaking task. J. Acoust. Soc. Am. 2013, 134, 2171–2181. [Google Scholar] [CrossRef] [PubMed]
- Vieira, V.J.D.; Costa, S.C.; Correia, S.L.N.; Lopes, L.W.; Costa, W.C.A.; de Assis, F.M. Exploiting nonlinearity of the speech production system for voice disorder assessment by recurrence quantification analysis. Chaos 2018, 28, 085709. [Google Scholar] [CrossRef] [PubMed]
- Lopes, L.W.; Vieira, V.J.D.; Costa, S.L.D.N.C.; Correia, S.É.N.; Behlau, M. Effectiveness of Recurrence Quantification Measures in Discriminating Subjects With and Without Voice Disorders. J. Voice 2020, 34, 208–220. [Google Scholar] [CrossRef] [PubMed]
- Park, S.-C.; Kim, G.-M.; Kato, T.A.; Chong, M.-Y.; Lin, S.-K.; Yang, S.-Y.; Avasthi, A.; Grover, S.; Kallivayalil, R.A.; Xiang, Y.-T.; et al. Dyskinesia is most centrally situated in an estimated network of extrapyramidal syndrome in Asian patients with schizophrenia: Findings from research on Asian psychotropic prescription patterns for antipsychotics. Nord. J. Psychiatry 2021, 75, 9–17. [Google Scholar] [CrossRef] [PubMed]
- Gerratt, B.R. Formant frequency fluctuation as an index of motor steadiness in the vocal tract. J. Speech Hear Res. 1983, 26, 297–304. [Google Scholar] [CrossRef] [PubMed]
- Rowe, H.P.; Gutz, S.E.; Maffei, M.F.; Tomanek, K.; Green, J.R. Characterizing Dysarthria Diversity for Automatic Speech Recognition: A Tutorial From the Clinical Perspective. Front. Comput. Sci. 2022, 4, 770210. [Google Scholar] [CrossRef] [PubMed]
- Yang, L.; et al. Vocal Changed in Parkinson’s Disease Patients. Arch. Biomed. Clin. Res. 2019, 1, 2. [Google Scholar] [CrossRef]
- Schwartz, J.S.; Song, P.; Blitzer, A. Spasmodic Dysphonia; Humana Press: Totowa, NJ, USA, 2007; pp. 109–121. [Google Scholar]
- Tsuboi, T.; Tanaka, Y.; Kobayasi, K.; Hashimoto, R.; Ito, Y.; Nishio, N.; Tsuboi, T.; Sone, M.; Katsuno, M.; Aiba, I. Re-Emergent Vocal Tremor in a Patient with Parkinson’s Disease. Mov. Disord. Clin. Pract. 2025, 12, 860–862. [Google Scholar] [CrossRef] [PubMed]
- Gillivan-Murphy, P.; Miller, N.; Carding, P. Voice Tremor in Parkinson’s Disease: An Acoustic Study. J. Voice 2019, 33, 526–535. [Google Scholar] [CrossRef] [PubMed]
- Gianlorenço, A.C.; Costa, V.; Fabris-Moraes, W.; Teixeira, P.E.P.; Gonzalez, P.; Pacheco-Barrios, K.; Ramos-Estebanez, C.; Di Stadio, A.; El-Hagrassy, M.M.; Camsari, D.D.; et al. Associations of Voice Metrics with Postural Function in Parkinson’s Disease. Life 2025, 15, 27. [Google Scholar] [CrossRef] [PubMed]
- Cohen, H. Disorders of Speech and Language in Parkinson’s Disease. In Mental and Behavioral Dysfunction in Movement Disorders; Humana Press: Totowa, NJ, USA, 2003; pp. 125–134. [Google Scholar]
- Skodda, S.; Grönheit, W.; Mancinelli, N.; Schlegel, U. Progression of voice and speech impairment in the course of Parkinson’s disease: A longitudinal study. Park. Dis. 2013, 389195. [Google Scholar] [CrossRef] [PubMed]
- Lazarus, J.P.; Vibha, D.; Handa, K.K.; Singh, S.; Goyal, V.; Srivastava, T.; Aggarwal, V.; Behari, M. A study of voice profiles and acoustic signs in patients with Parkinson’s disease in North India. J. Clin. Neurosci. 2012, 19, 1125–1129. [Google Scholar] [CrossRef] [PubMed]
- Suppa, A.; Costantini, G.; Asci, F.; Di Leo, P.; Al-Wardat, M.S.; Di Lazzaro, G.; Scalise, S.; Pisani, A.; Saggio, G. Voice in Parkinson’s Disease: A Machine Learning Study. Front. Neurol. 2022, 13, 831428. [Google Scholar] [CrossRef] [PubMed]
- Kwon, D.K.; Kwatra, M.; Wang, J.; Ko, H.S. Levodopa-Induced Dyskinesia in Parkinson’s Disease: Pathogenesis and Emerging Treatment Strategies. Cells 2022, 11, 3736. [Google Scholar] [CrossRef] [PubMed]
- Thanvi, B.; Lo, N.; Robinson, T. Levodopa-induced dyskinesia in Parkinson’s disease: Clinical features, pathogenesis, prevention and treatment. Postgrad. Med. J. 2007, 83, 384–388. [Google Scholar] [CrossRef] [PubMed] [PubMed Central]
- Loo, R.T.J.; Tsurkalenko, O.; Klucken, J.; Mangone, G.; Khoury, F.; Vidailhet, M.; Corvol, J.C.; Krüger, R.; Glaab, E.; NCER-PD Consortium. Levodopa-induced dyskinesia in Parkinson’s disease: Insights from cross-cohort prognostic analysis using machine learning. Park. Relat. Disord. 2024, 126, 107054. [Google Scholar] [CrossRef] [PubMed]
Figure 1.
(a) EEMD Mode Decomposition of Patient Vocals (b) Gaussian Filtered Instantaneous Frequency of IMFs (c) Dynamic Frequency-Energy Plot.
Figure 1.
(a) EEMD Mode Decomposition of Patient Vocals (b) Gaussian Filtered Instantaneous Frequency of IMFs (c) Dynamic Frequency-Energy Plot.
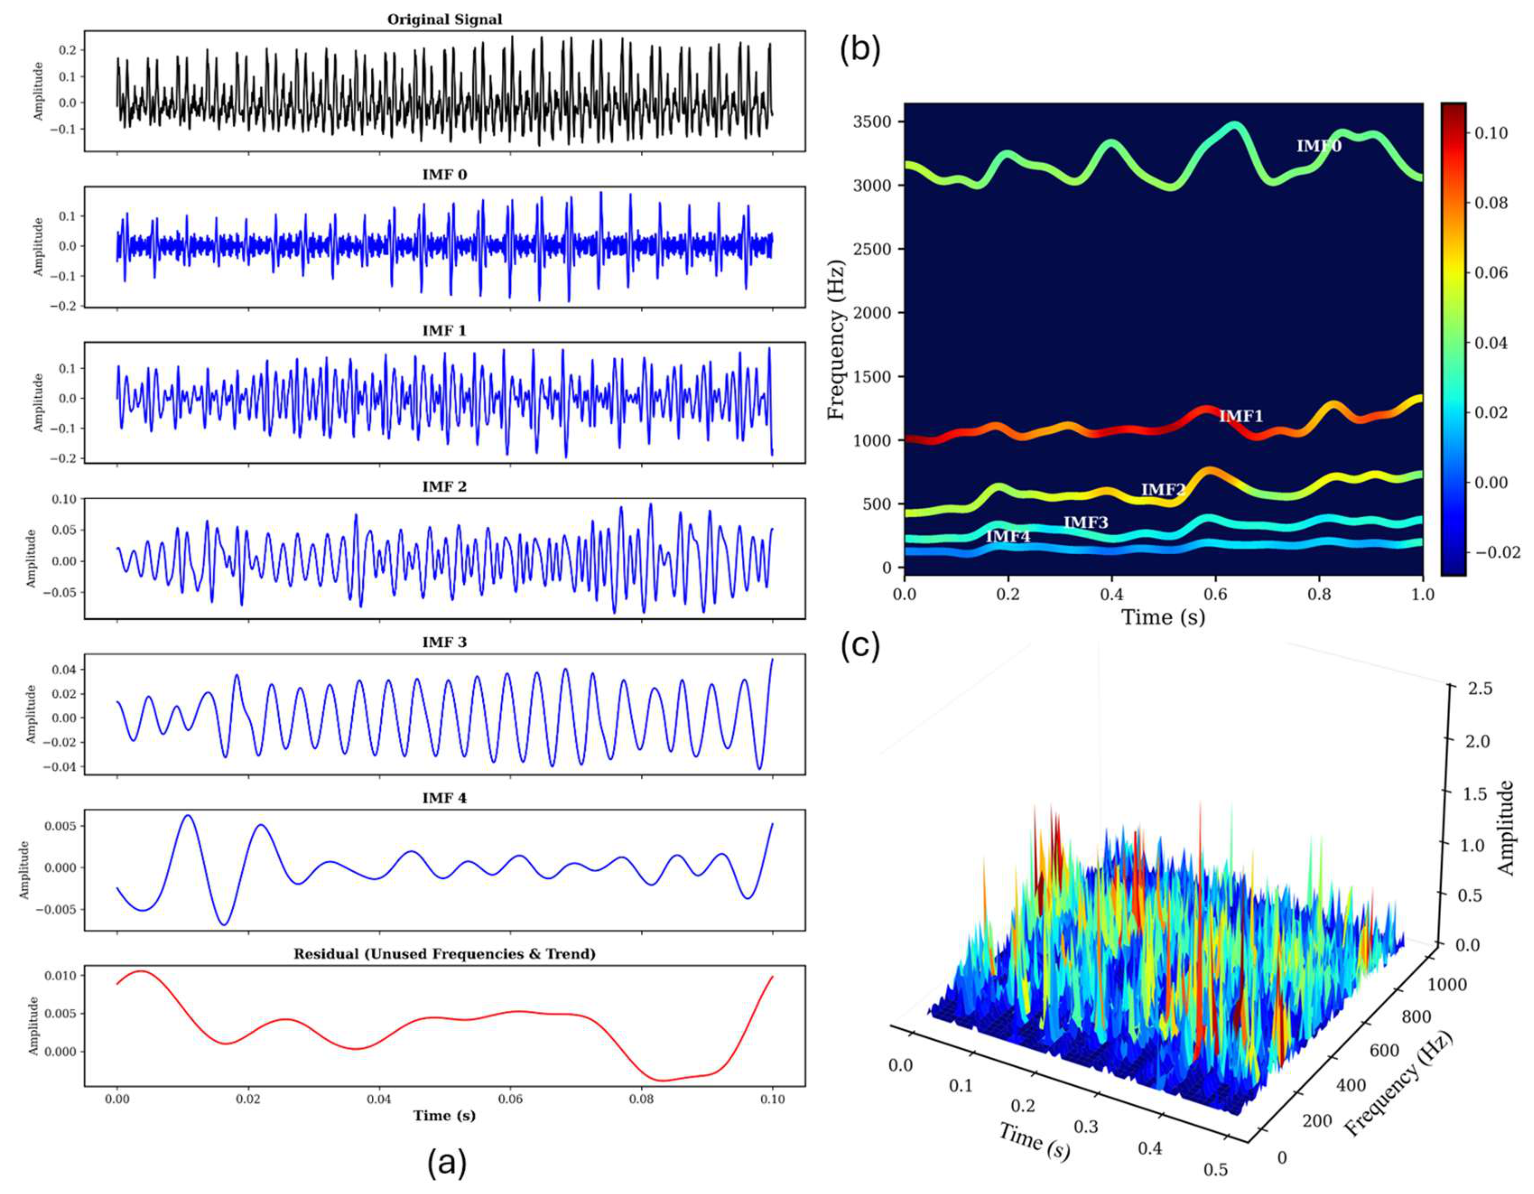
Figure 2.
(a) Representative phase-space reconstruction of a DIP vocal signal showing trajectory divergence, (1.36 ms) for visualization (b) Recurrence Plot of DIP Patient Vocals (c) Representative comparison of correlation-dimension estimation between a DIP participant and a healthy control.
Figure 2.
(a) Representative phase-space reconstruction of a DIP vocal signal showing trajectory divergence, (1.36 ms) for visualization (b) Recurrence Plot of DIP Patient Vocals (c) Representative comparison of correlation-dimension estimation between a DIP participant and a healthy control.
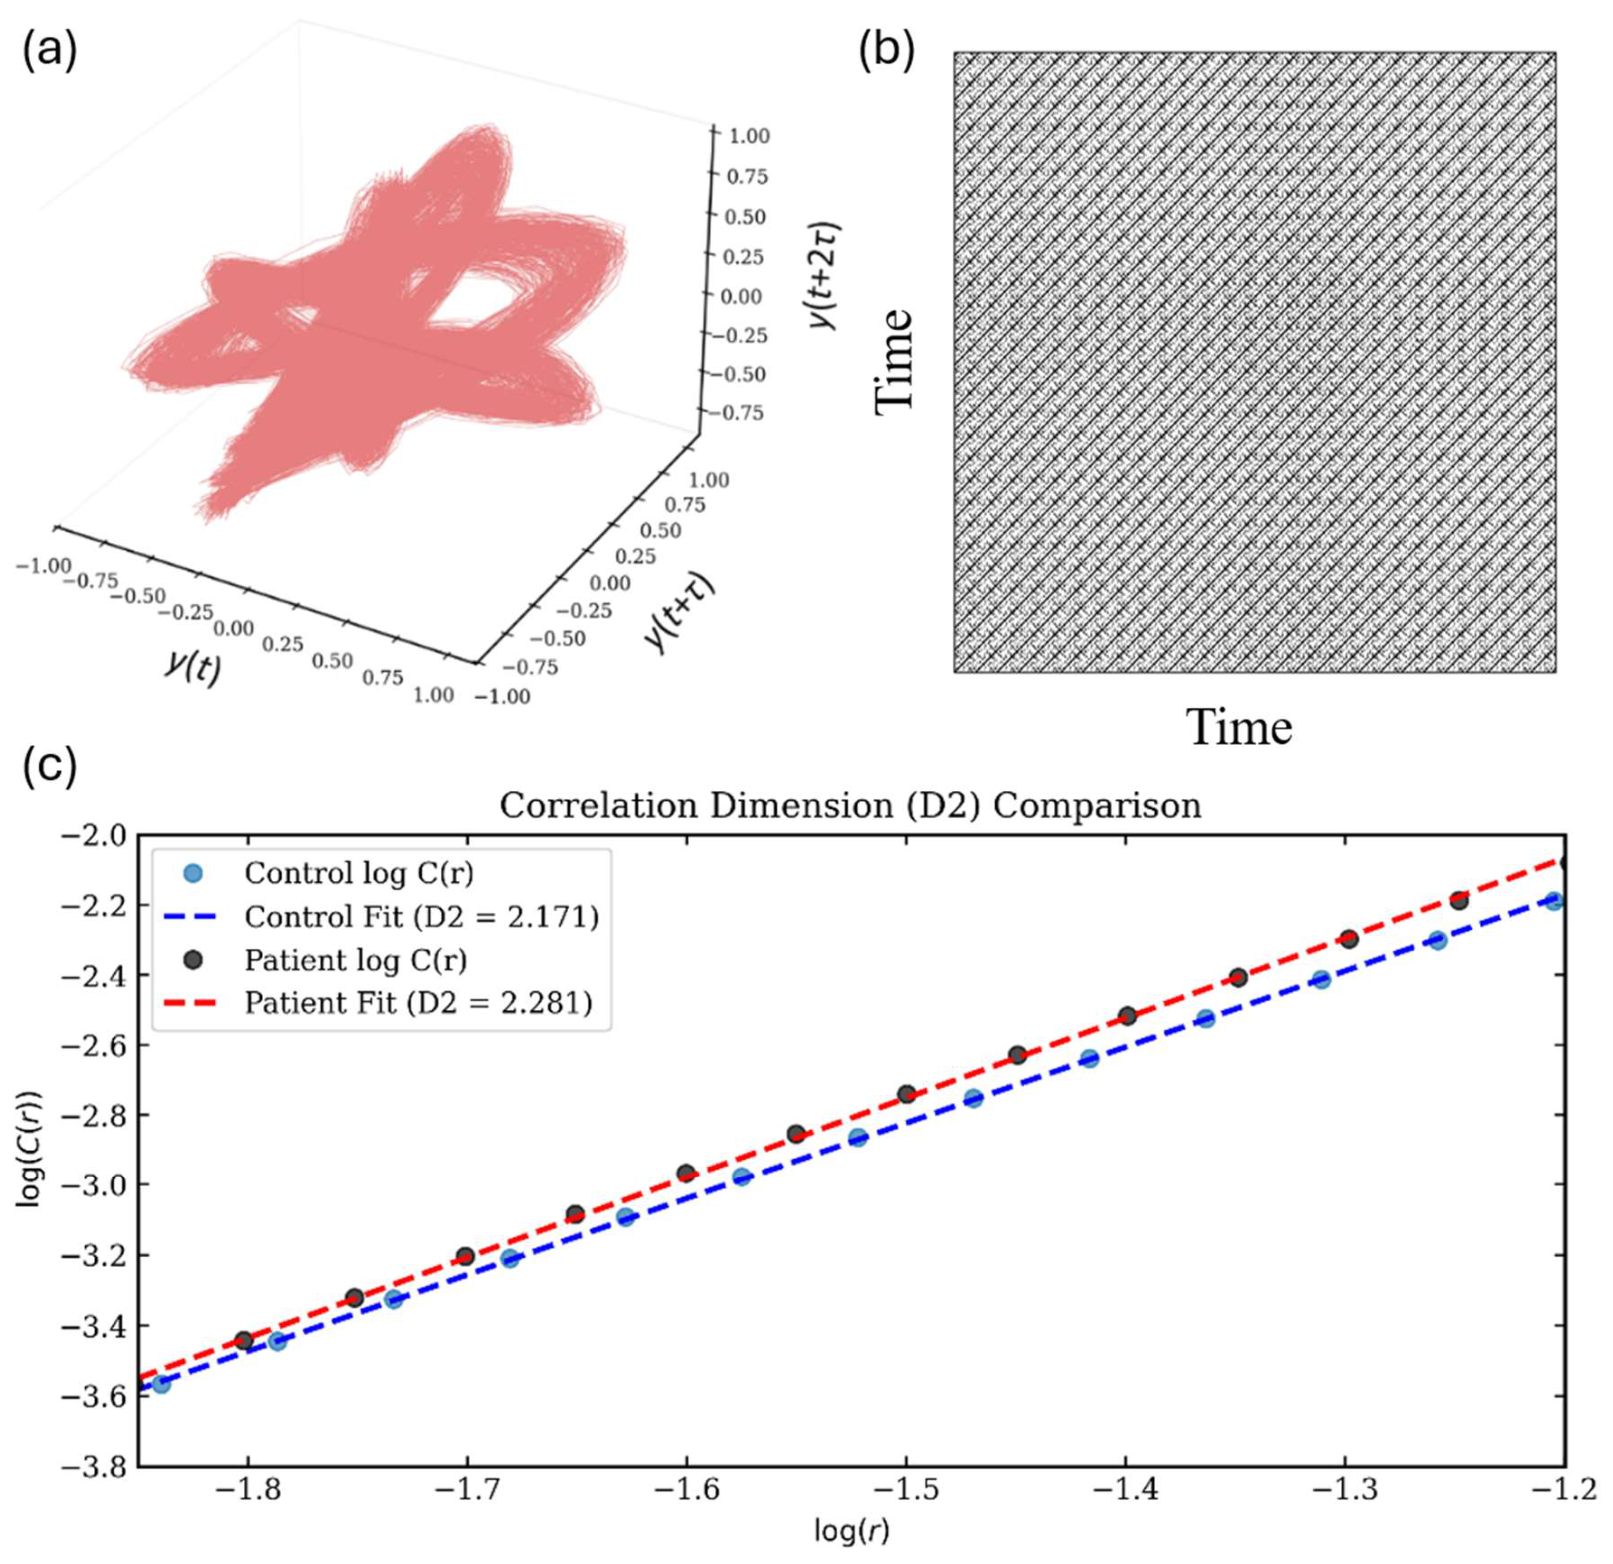
Figure 3.
Hilbert–Huang Transform (HHT) physics-based feature analysis between DIP patients and healthy controls: (a) Cohen’s d effect sizes for vowel /a/ features across IMFs; (b) corresponding p-values for vowel /a/ features; (c) Cohen’s d effect sizes for frequency variance across all five cardinal vowels and IMFs; (d) corresponding p-values for frequency variance across vowels and IMFs.
Figure 3.
Hilbert–Huang Transform (HHT) physics-based feature analysis between DIP patients and healthy controls: (a) Cohen’s d effect sizes for vowel /a/ features across IMFs; (b) corresponding p-values for vowel /a/ features; (c) Cohen’s d effect sizes for frequency variance across all five cardinal vowels and IMFs; (d) corresponding p-values for frequency variance across vowels and IMFs.
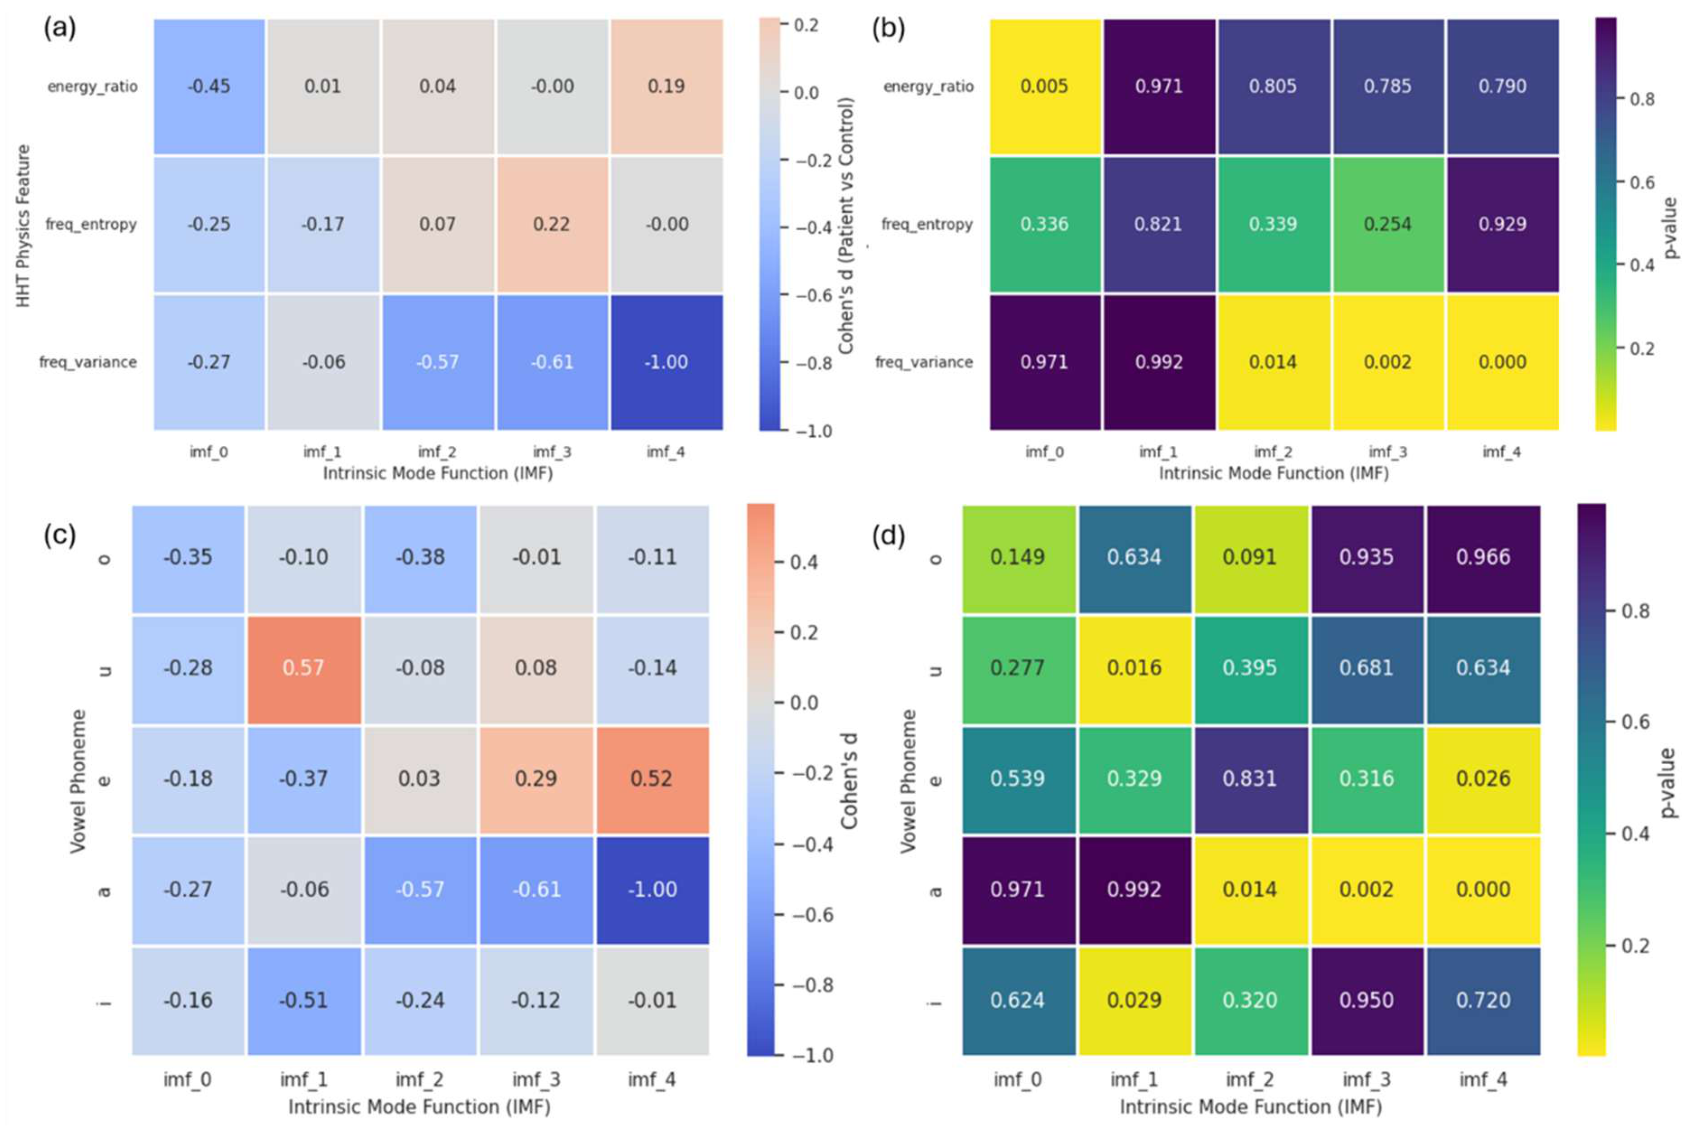
Figure 4.
(a) Heatmap of Vowel Nonlinear Physics Feature Cohen’s D Values between DIP Patients and Healthy Control (b) Heatmap of Vowel Nonlinear Physics Feature p Values between DIP Patients and Healthy Control.
Figure 4.
(a) Heatmap of Vowel Nonlinear Physics Feature Cohen’s D Values between DIP Patients and Healthy Control (b) Heatmap of Vowel Nonlinear Physics Feature p Values between DIP Patients and Healthy Control.
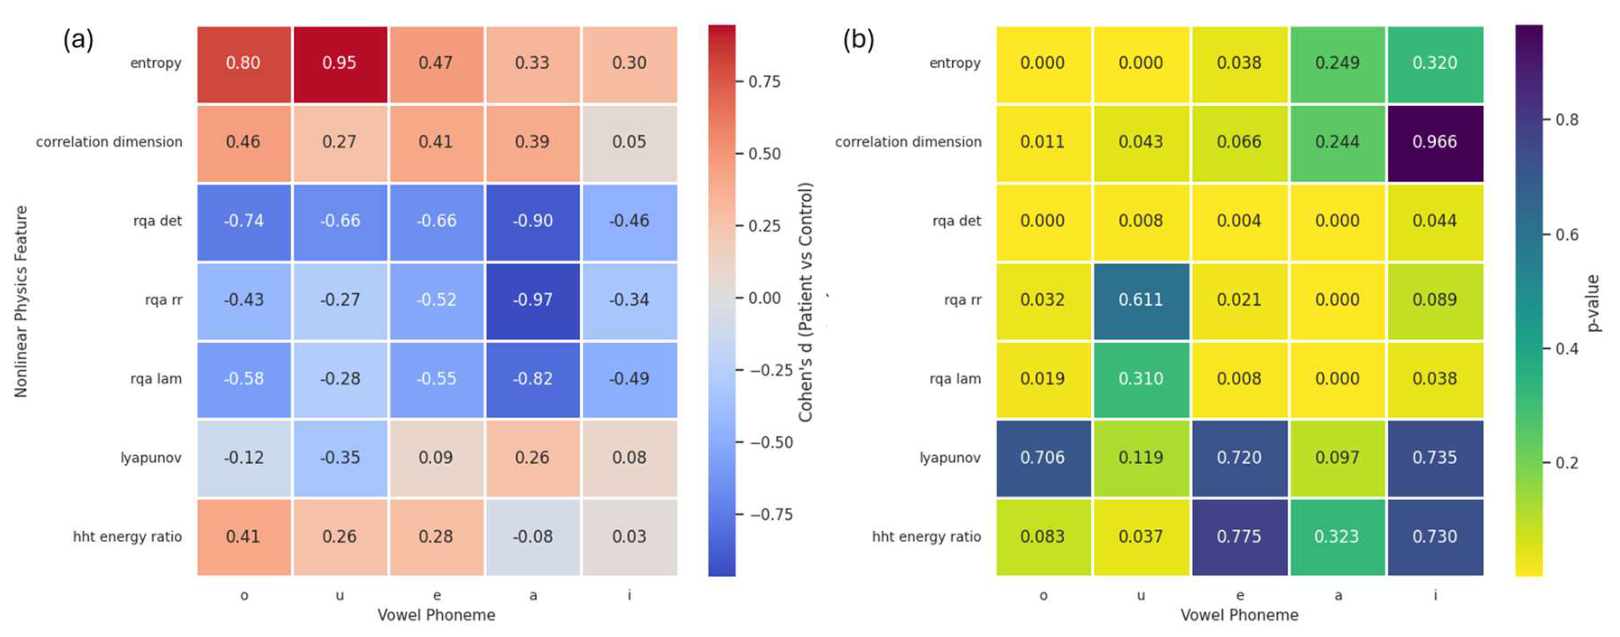
Figure 5.
Q-Q Plot of acoustic metrics Spearman p-value across DIEPSS 1–9 within DIP.
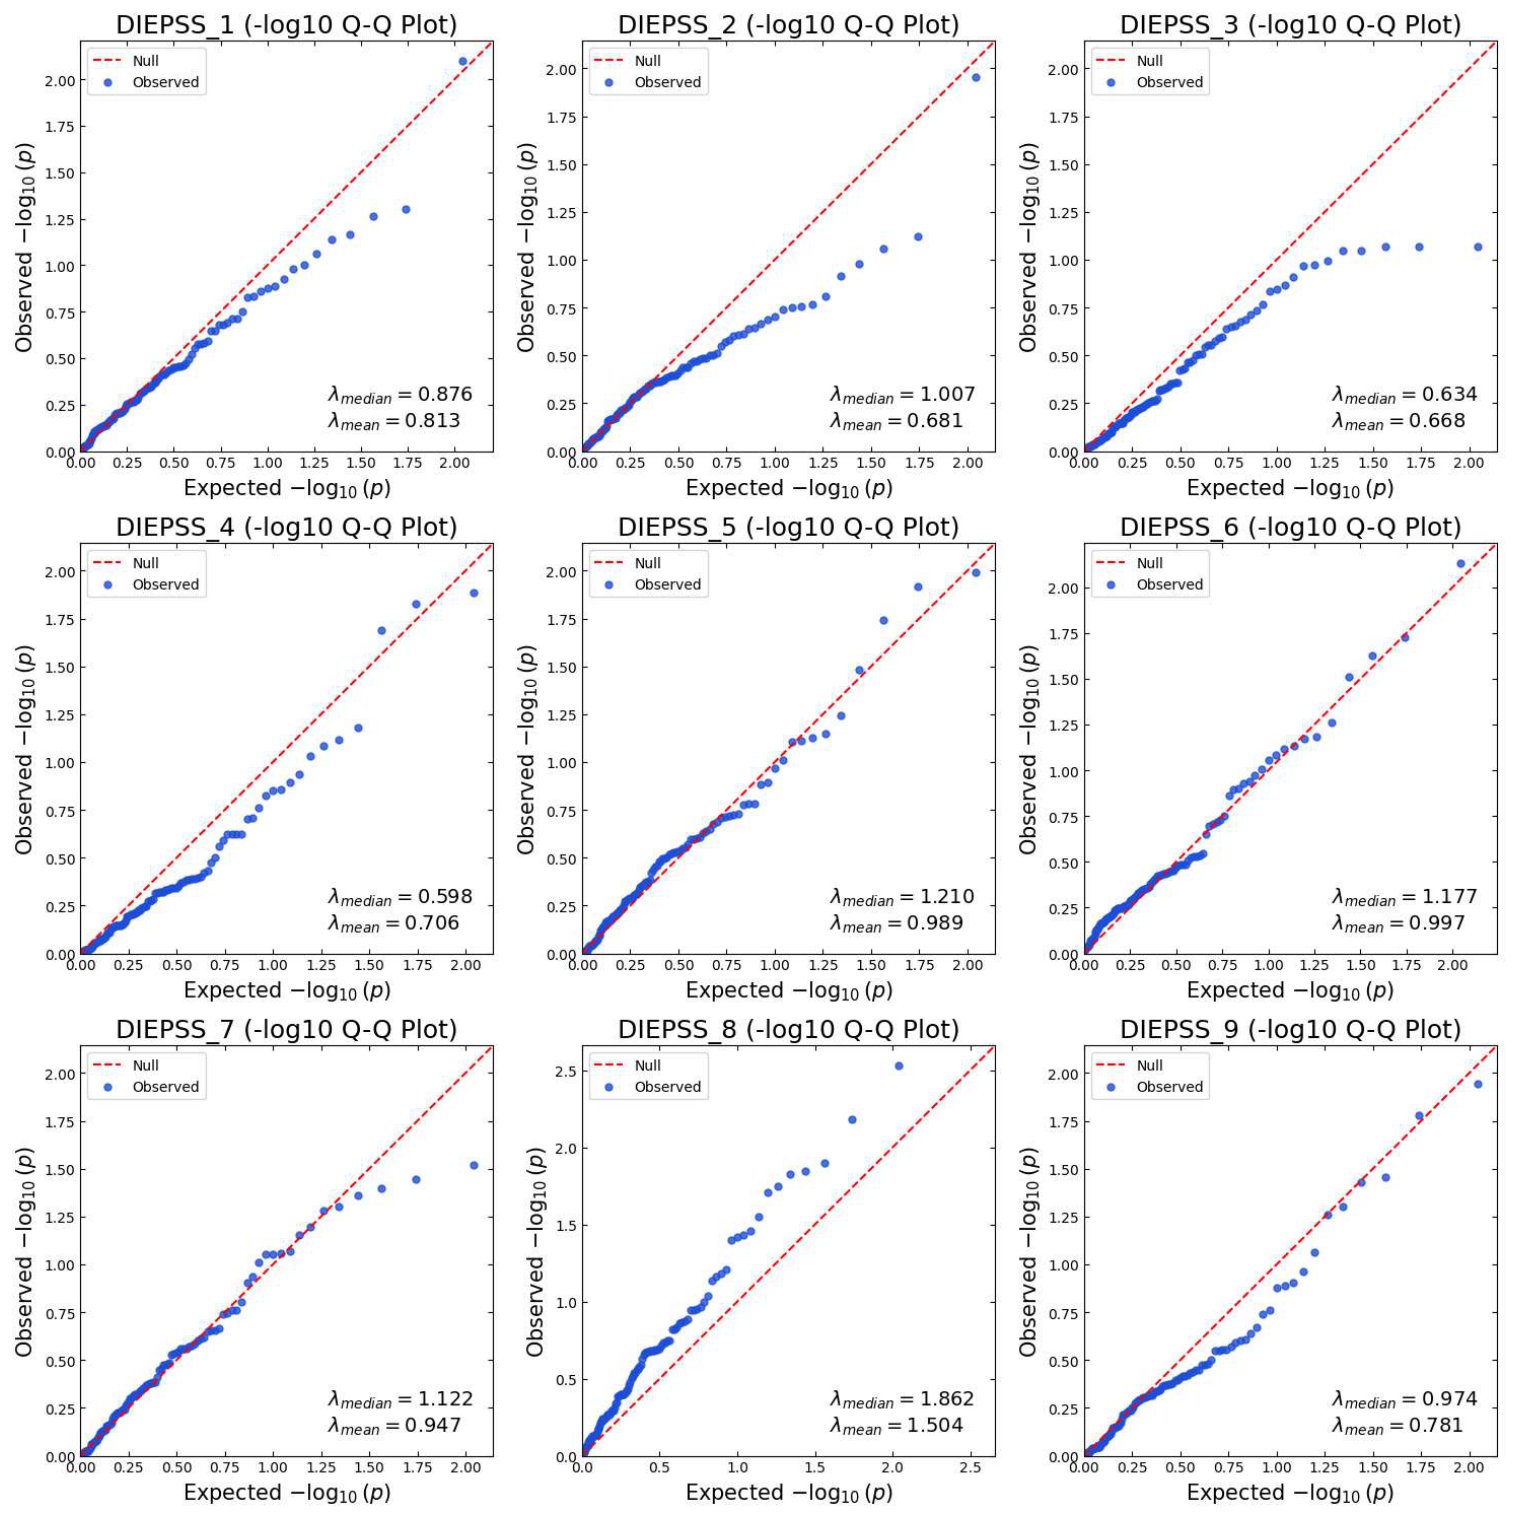
Figure 6.
Q-Q Plot of acoustic metrics Spearman p-value across DIEPSS 1–9 within all participants (DIP and HC), with HC marked as zero (normal) in every sub-score.
Figure 6.
Q-Q Plot of acoustic metrics Spearman p-value across DIEPSS 1–9 within all participants (DIP and HC), with HC marked as zero (normal) in every sub-score.
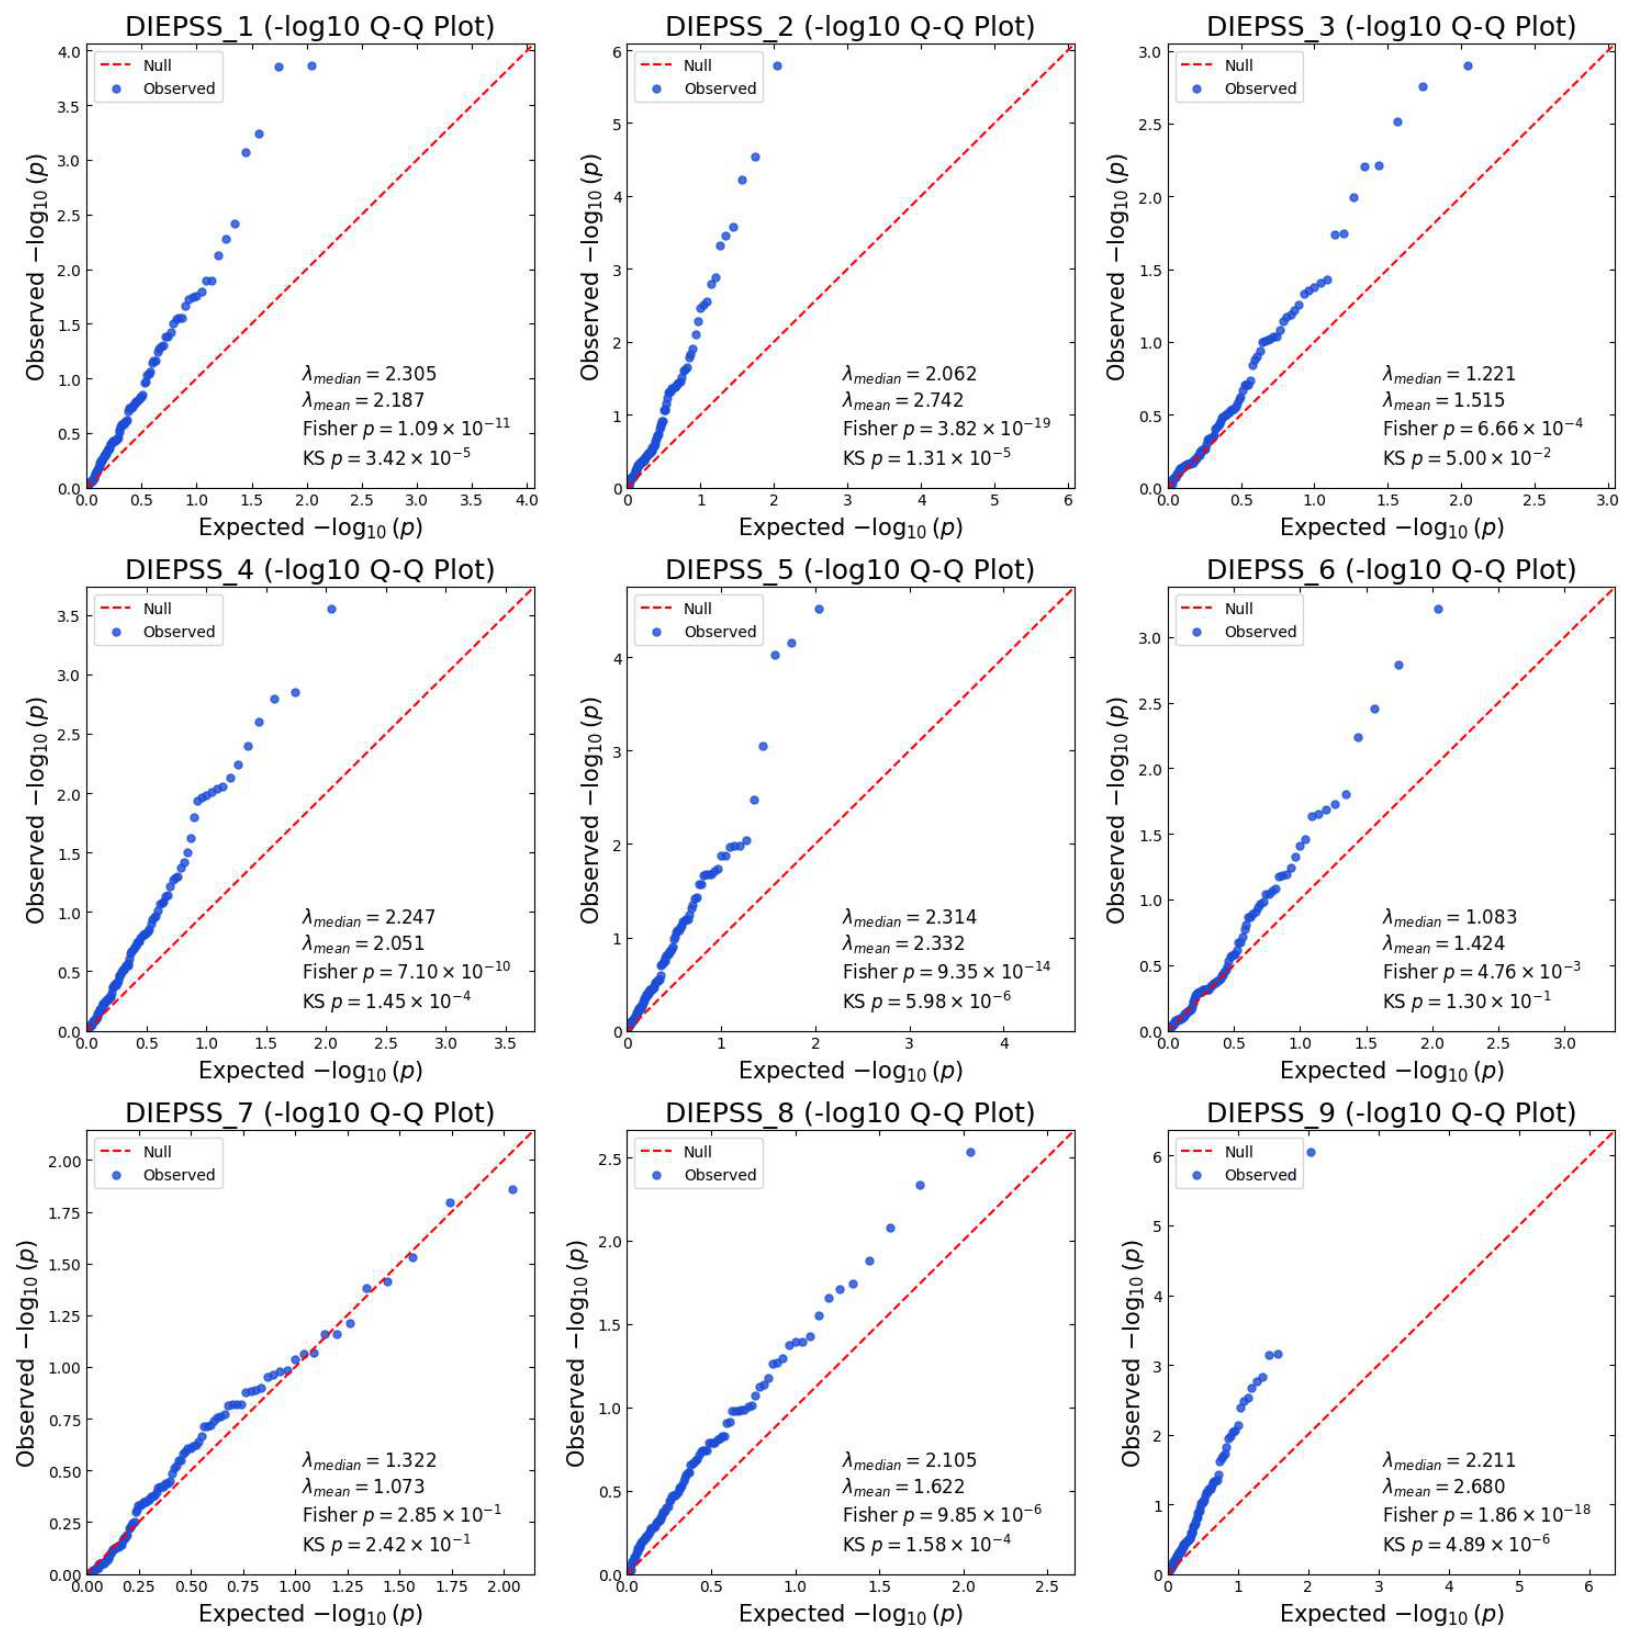
Figure 7.
Shapley Summary Plot of DIP vs. HC Binary Classification (a) XG Boost Model (b) Random Forest Model.
Figure 7.
Shapley Summary Plot of DIP vs. HC Binary Classification (a) XG Boost Model (b) Random Forest Model.
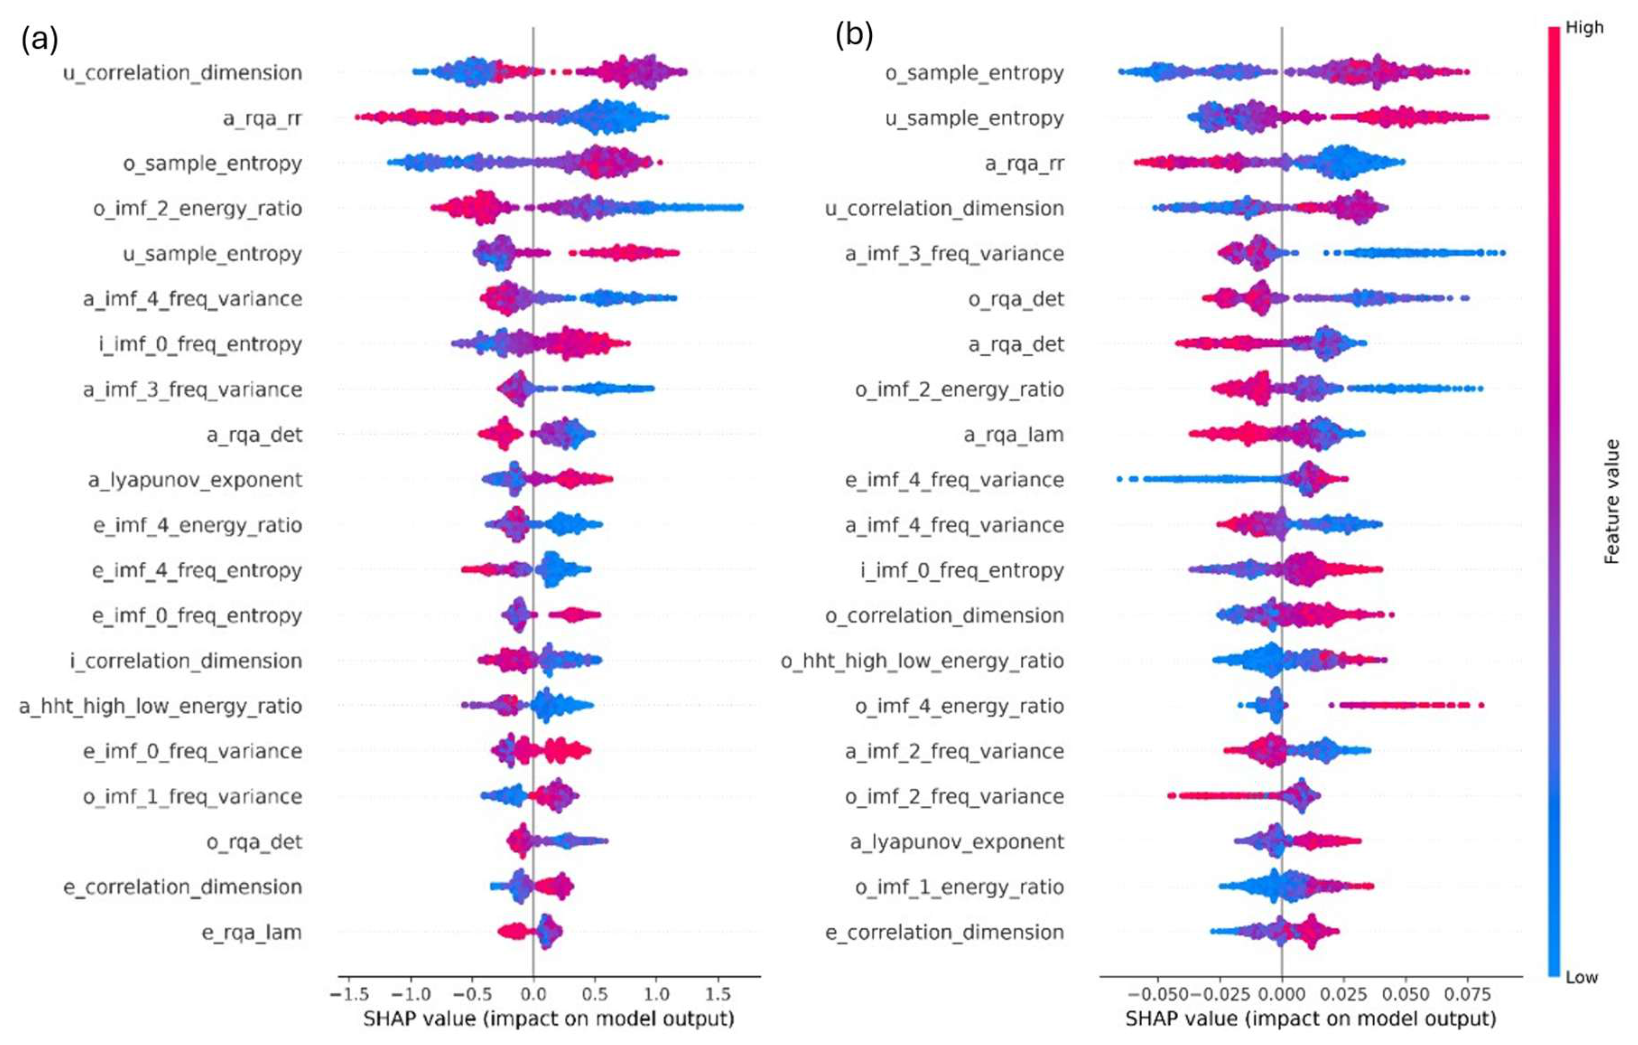
Figure 8.
ROC-AUC Curve Comparisons in IPD-HC and DIP-HC Binary Classification.
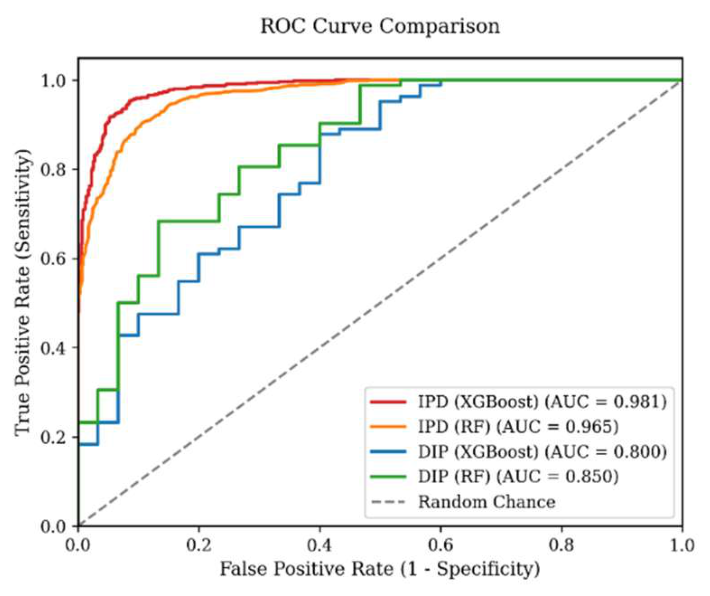
Figure 9.
Confusion Matrix of Multiclass DIP-IPD-HC Classification.
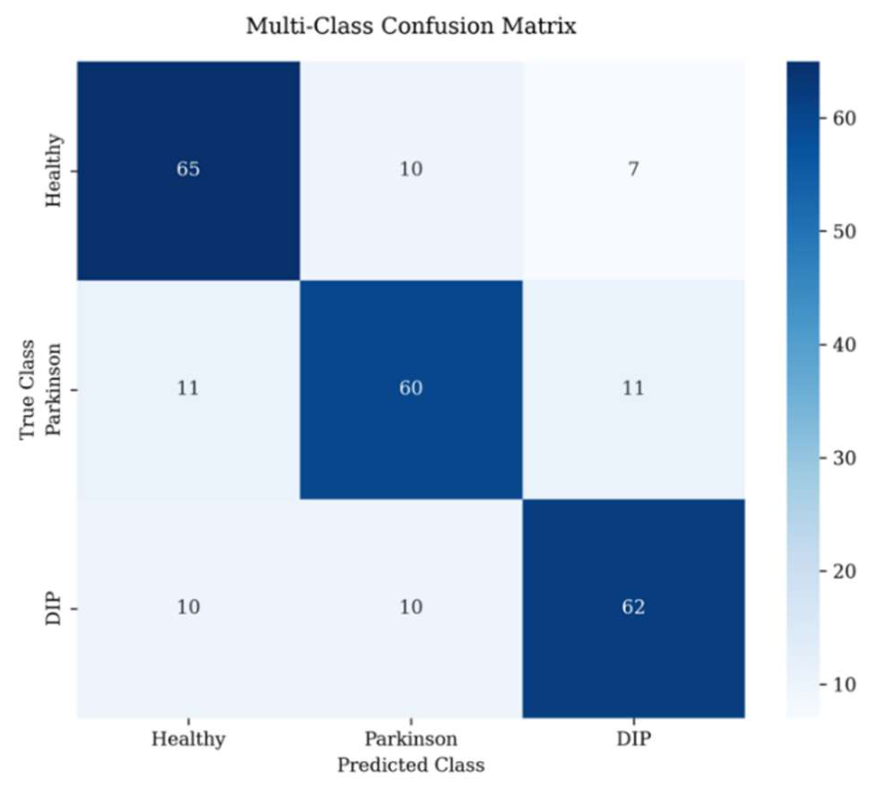
Table 1.
Vowel Characterization and DIP-Control Entropy Statistical Comparison.
| Vowel | Tongue Position | Lip Shape | Entropy Cohen’s D | p |
|---|---|---|---|---|
| U | High-Back | Rounded | +0.96 | |
| O | Mid-Back | Rounded | +0.80 | |
| E | Mid-Front | Unrounded | +0.47 | 0.04 |
| A | Low-Front | Unrounded | +0.33 | 0.25 |
| I | High-Front | Unrounded | +0.30 | 0.32 |
Table 2.
Mean Z score to HC, Nonlinear Feature Comparison Between DIP and IPD Patients.
| Nonlinear Feature | DIP Z | IPD Z | p | Cohen’s d |
|---|---|---|---|---|
| RQA RR | −0.81 | 0.16 | −0.61 | |
| RQA DET | −0.98 | −0.03 | −0.73 | |
| RQA LAM | −0.97 | −0.17 | −0.58 | |
| Correlation Dimension | 0.36 | 0.00 | 0.31 | |
| Sample Entropy | 0.47 | −0.17 | 0.52 | |
| Lyapunov exponent | 0.34 | 0.02 | 0.01 | 0.27 |
Table 3.
Out-of-Fold performance metrics for binary classification between Drug-Induced Parkinsonism (DIP) and Healthy Controls (HC).
Table 3.
Out-of-Fold performance metrics for binary classification between Drug-Induced Parkinsonism (DIP) and Healthy Controls (HC).
| Model | AUC | Accuracy | Sensitivity | Specificity | F1-Score |
|---|---|---|---|---|---|
| XG Boost | 0.80 | 0.79 | 0.89 | 0.50 | 0.86 |
| Random Forest | 0.85 | 0.86 | 0.99 | 0.50 | 0.91 |
Table 4.
Out-of-Fold performance metrics for binary classification between Idiopathic Parkinson’s Disease (IPD) and Healthy Controls (HC).
Table 4.
Out-of-Fold performance metrics for binary classification between Idiopathic Parkinson’s Disease (IPD) and Healthy Controls (HC).
| Model | AUC | Accuracy | Sensitivity | Specificity | F1-Score |
|---|---|---|---|---|---|
| XG Boost | 0.98 | 0.93 | 0.93 | 0.93 | 0.93 |
| Random Forest | 0.97 | 0.90 | 0.90 | 0.90 | 0.90 |
Disclaimer/Publisher’s Note: The statements, opinions and data contained in all publications are solely those of the individual author(s) and contributor(s) and not of MDPI and/or the editor(s). MDPI and/or the editor(s) disclaim responsibility for any injury to people or property resulting from any ideas, methods, instructions or products referred to in the content. |
© 2026 by the authors. Licensee MDPI, Basel, Switzerland. This article is an open access article distributed under the terms and conditions of the Creative Commons Attribution (CC BY) license (http://creativecommons.org/licenses/by/4.0/).
Copyright: This open access article is published under a Creative Commons CC BY 4.0 license, which permit the free download, distribution, and reuse, provided that the author and preprint are cited in any reuse.