

Submitted:
05 September 2026
Posted:
07 September 2026
You are already at the latest version
Abstract
This study introduces the EMS Record Reliability Index (EMS-RRI), an interpretable, applicability-aware measure of whether each prehospital patient-care record is complete enough to support downstream smart-ambulance AI. Using National Emergency Medical Services Information System (NEMSIS) data, we analyzed 500,000 EMS records from the 2025 dataset for development and internal evaluation and 200,000 records from the 2024 dataset for temporal validation. We constructed basic and domain-weighted EMS-RRI variants and evaluated supervised models that identify low-reliability records using broader EMS context rather than the EMS-RRI score itself. The final XGBoost model achieved ROC-AUC/PR-AUC/F1 values of 0.9145/0.8659/0.7745 on the 2025 internal test set and 0.8887/0.8407/0.7455 under temporal validation. Failure analysis showed that most false negatives were borderline cases: more than 86% were within 2 EMS-RRI points of the cutoff, while only about 3% had scores below 70. Larger temporal declines were observed in selected regional and urbanicity subgroups, including Western Plains and Frontier records. Adding EMS-RRI to downstream high-acuity prediction produced modest but consistent gains across validation, internal-test, and temporal cohorts. By providing a practical record-level reliability signal before downstream smart-ambulance AI use, EMS-RRI reinforces a central requirement of high-stakes prehospital automation: trustworthy decisions must begin with trustworthy records.
Keywords:
trustworthy artificial intelligence
; smart ambulance
; emergency medical services
; EMS patient-care records
; record reliability
; explainable machine learning
; data quality
; NEMSIS
1. Introduction
1.1. Background and Motivation
Emergency medical services (EMS) serve as a bridge between out-of-hospital emergencies and definitive hospital care, requiring assessment, treatment, transport decisions, and documentation to be completed within severe time and environmental constraints. NEMSIS standardizes EMS patient-care reporting for state and national evaluation, yet missing and inconsistent record elements continue to complicate quality assessment, clinical research, and downstream analytics [1].
This problem is clinically consequential. Prior work found that 28.2% of EMS trauma records were missing scene physiologic data, and patients missing one or more physiologic measures had increased mortality risk (adjusted OR 2.15; 95% CI 1.13–4.10) [2]. As artificial intelligence enters prehospital care through smart-ambulance applications for triage, disposition, and outcome prediction, incomplete EMS records become a direct threat to trustworthy automation. A practical framework is therefore needed to quantify, communicate, and predict record-level reliability before EMS data are used in downstream AI systems.
1.2. Current Literature
Prior work shows that NEMSIS provides a large and valuable national EMS data infrastructure, but its scale and heterogeneity create challenges for reliability assessment. National EMS datasets contain millions of activations and extensive structured responses, yet integration with controlled terminologies, electronic health records, and interoperable systems remains complex [3]. EMS data quality has also been studied across dimensions such as completeness, accuracy, consistency, accessibility, and timeliness, with prior reviews emphasizing the need for clear operational definitions of quality [4].
Several studies indicate that EMS documentation completeness is variable and non-random. Vital-sign documentation is often less complete in pediatric encounters, especially among infants, than in adult records [5]. State-level NEMSIS analyses have identified missingness related to data mapping, variable definitions, infrastructure, and training [6], while trauma studies have shown that higher injury severity, lower Glasgow Coma Scale scores, and mortality are associated with more incomplete prehospital physiological data [7]. Reliability also differs by element type: operational variables may show stronger agreement than initial physiologic measurements [8], and prehospital stroke assessments show better agreement for gross motor findings than for subtler neurological signs [9]. Age- and condition-specific evidence further suggests that uniform completeness expectations may be inadequate, as pediatric vital-sign interpretation and monitor-detected hypoxia can differ substantially from documented prehospital records [10,11].
Machine-learning applications in EMS have expanded across triage, diagnosis, treatment, and outcome prediction. A recent scoping review identified 164 EMS-guided machine-learning studies and reported generally strong performance across clinical domains [12]. NEMSIS-based models have also shown promise for prehospital stroke identification using structured EMS data and SHAP-based interpretation [13]. However, these studies generally evaluate downstream model performance without first quantifying whether the input EMS record is sufficiently complete for reliable automated use.
Explainable AI can improve transparency and clinical trust [14], but explanations alone cannot ensure safety when model inputs are incomplete or unreliable [15]. At the operational level, documentation quality can improve through agency feedback, quality-assurance reporting, training, and workflow interventions [16,17]. Nevertheless, documentation patterns remain sensitive to encounter characteristics, transport disposition, special populations, and differences in system definitions or workflows [18,19]. Together, the literature supports the need for an interpretable, applicability-aware, and temporally evaluated record-level reliability framework for EMS data before downstream smart-ambulance AI use.
1.3. Research Gaps
Despite growing work on EMS data quality and machine learning for prehospital care, five gaps motivate this study:
- 1.
- Prior EMS data-quality studies have characterized missingness and completeness, but a practical record-level framework is still needed to score only the documentation elements applicable to each EMS event. Uniform completeness measures may penalize records for fields that were not clinically relevant or conditionally required.
- 2.
- Existing work has largely examined documentation gaps retrospectively. Less is known about the predictability of low-reliability EMS data from broader clinical, operational, temporal, geographic, and patient context without using the score criteria that define reliability.
- 3.
- Reliability assessment frameworks must be evaluated across temporal cohorts and heterogeneous EMS settings. Prior work shows that EMS data definitions, documentation practices, and system workflows vary across regions and agencies, but temporal and subgroup robustness of record-level reliability models remains insufficiently studied.
- 4.
- Aggregate model metrics do not show whether missed low-reliability records are borderline cases or severely incomplete records. Failure severity, cutoff proximity, and subgroup-specific error patterns require explicit analysis before reliability prediction can be used in downstream EMS AI workflows.
- 5.
- Although EMS machine-learning models have been developed for triage, diagnosis, and outcome prediction, limited evidence exists on whether explicit record-level reliability information provides complementary value for downstream prediction tasks. This gap is important for determining whether reliability scoring can serve as more than a retrospective audit measure.
1.4. Study Objectives and Contributions
To address these gaps, this study develops and evaluates the EMS-RRI as a reliability-screening framework for downstream smart-ambulance AI applications. Specifically, the study examines whether EMS record reliability can be quantified using an interpretable, applicability-aware score; whether low-reliability records can be predicted from broader event context without directly using the scoring elements; whether the score and prediction model remain stable across temporal, subgroup, and documentation-state evaluations; and whether EMS-RRI provides complementary information for downstream high-acuity prediction. This study makes the following contributions:
- 1.
- Introduces EMS-RRI, an interpretable and applicability-aware score that quantifies record-level completeness using only scoring elements relevant to each EMS event.
- 2.
- Develops a machine-learning framework that predicts low-reliability EMS records from broader clinical, operational, temporal, geographic, and patient context without directly using the scoring elements themselves.
- 3.
- 4.
- Conducts failure-case analysis to distinguish borderline errors from more severe low-reliability misses and identify regional and urbanicity subgroups with elevated miss rates.
- 5.
- Demonstrates that EMS-RRI contributes complementary information to downstream high-acuity prediction, supporting its potential role as a reliability-screening signal before smart-ambulance AI use.
Figure 1 summarizes the proposed reliability-aware EMS AI pipeline, showing how EMS-RRI converts raw EMS records into a record-level reliability signal that can support selective review and downstream smart-ambulance AI tasks.
2. Methodology
2.1. Study Design and Analytical Workflow
This study developed a reliability-aware machine learning framework for EMS patient-care records. The analysis followed four stages:
- 1.
- preprocessing and integration of raw NEMSIS data;
- 2.
- construction of the interpretable EMS Record Reliability Index (EMS-RRI);
- 3.
- prediction and explanation of low-reliability records; and
- 4.
- assessment of EMS-RRI utility for downstream patient-acuity prediction.
The 2025 NEMSIS dataset comprised 500,000 EMS events and was partitioned into training (), validation (), and internal-test () sets. An independent NEMSIS 2024 dataset of 200,000 events was reserved for temporal validation and was not used for model fitting, feature selection, or threshold selection.
2.2. Raw NEMSIS Data Processing
The NEMSIS public-use data are distributed across the primary event file and several linked clinical tables. Records were connected using the unique patient-care-report identifier, PcrKey. Figure 2 summarizes the overall data-preparation and analysis workflow.
The preprocessing procedure consisted of four main steps:
- 1.
- Event selection and linked-table retrieval. Target EMS events were sampled from Pub_PCRevents, the primary event table in the NEMSIS public-use release. Using PcrKey, corresponding records were retrieved from linked tables containing the clinical and operational variables used for reliability scoring and subsequent analyses.
- 2.
- Event-level consolidation. One-to-one tables were merged directly. Tables containing multiple rows per event, including vital-sign records, were aggregated to one row per PcrKey. Aggregated variables included record counts and indicators for missing, non-informative, and physiologically implausible values.
- 3.
- Documentation-state and numeric processing. System-defined values such as NOTRECORDED and NOTAPPLICABLE were retained as distinct documentation states when analytically relevant. For numeric variables, special-value tokens, invalid strings, and implausible entries were converted to missing values before numeric conversion.
- 4.
- Merge validation and dataset reduction. One-to-one and many-to-one merge checks were used to detect unintended event duplication. The resulting event-level datasets were then restricted to variables required for EMS-RRI construction, predictive modeling, temporal validation, explainability analysis, and downstream acuity prediction.
2.3. Construction of the EMS Record Reliability Index
The EMS Record Reliability Index (EMS-RRI) evaluated documentation quality for 21 selected NEMSIS elements drawn from five sections. For each EMS record, only applicable elements were scored, and the index reflected the proportion of those elements with a recorded, informative value. Table 1 summarizes the distribution of rules across these sections.
Element applicability was determined in two ways:
- Generally applicable elements: included unless the record explicitly indicated that the element did not apply.
- Condition-dependent elements: included only when a related field confirmed that the relevant condition was present.
For instance, detailed cardiac-arrest elements were included only when eArrest.01 indicated cardiac arrest before or after EMS arrival. The basic EMS-RRI for each record was calculated as
where when scoring element j applied to record i, and when that applicable element contained a documented, informative value. For example, if 11 of the 21 scoring elements applied to a record and 9 of those 11 were documented, the EMS-RRI was
Non-applicable elements were excluded from the calculation. Scores ranged from 0 to 100, with higher scores indicating more complete documentation among the elements relevant to that record.
A domain-weighted EMS-RRI was calculated as a sensitivity measure. Each of the five NEMSIS sections was assigned the same maximum contribution to the score, and that contribution was divided among the scoring elements within the section. This weighting reduced the influence of sections containing more selected elements but also imposed equal importance across sections; therefore, the unweighted EMS-RRI was retained as the primary measure. The weighted score was calculated as
where was the weight assigned to the scoring element j. The basic EMS-RRI was used as the primary measure because it directly represented the percentage of applicable elements that were documented. The weighted EMS-RRI was used to assess whether the findings changed when all five NEMSIS sections were given equal influence.
Low-reliability thresholds were derived from the 20th-percentile score values in the 2025 training set. Since EMS-RRI values were discrete, all records at or below the percentile-boundary score were included. The resulting cutoffs were 81.8182 for the basic score and 82.0513 for the weighted score. These thresholds were then applied unchanged to the 2025 validation and internal-test sets and the 2024 temporal-validation dataset.
2.4. Feature Selection and Leakage Control
Predictors were selected to estimate low-record reliability from information that was independent of the EMS-RRI calculation. The following controls were applied:
- EMS-RRI source elements excluded: The 21 NEMSIS elements used to calculate EMS-RRI were not included as predictors. Retaining them would allow the model to reconstruct the score and low-reliability label directly, resulting in target leakage.
- Derived target information excluded: The target was the binary low-reliability label derived from the basic EMS-RRI cutoff. The continuous EMS-RRI score, the 21 scoring elements used to calculate it, and other direct derivatives of the target were excluded from the predictor set to prevent target leakage.
- Raw timestamps excluded: Exact date and clock-time fields were omitted to reduce the risk of learning event order, collection-period effects, or processing patterns. Derived duration variables, such as dispatch, response, and scene-related intervals, were retained.
- Redundant variables removed: Duplicate age representations were excluded, and age was represented using the standardized age-in-years variable.
- Predictor-set refinement: The initial model included 34 numeric and categorical predictors covering derived operational durations, patient characteristics, clinical context, geography, payment, disposition, and outcome. Primary impression and primary symptom were subsequently removed, as they were high-cardinality, sparse, unstable across years, and reduced validation performance. The final XGBoost [22] model therefore used 32 predictors.
All refinement decisions were made using the 2025 validation set. The finalized 32-predictor model was then evaluated on the 2025 internal-test set and the 2024 temporal-validation dataset.
2.5. Preprocessing for Predictive Modeling
Predictive-model preprocessing was performed as follows:
- Numeric variables: NEMSIS special-value states, such as NOTRECORDED and NOTAPPLICABLE, and invalid numeric strings were converted to NaN. Missing values were imputed using the median estimated from the 2025 training set. For each numeric predictor requiring imputation, a separate binary missingness-indicator feature was created, where 1 indicated that the original value was missing and 0 indicated that it was observed.
- Numeric scaling: Numeric predictors were scaled using the training-set median and interquartile range.
- Categorical variables: Missing categories were imputed using the most frequent training-set value and encoded using one-hot encoding. Categories not observed during training were ignored during transformation.
- Leakage prevention: All preprocessing steps were fitted only on the 2025 training set and applied unchanged to the validation, internal-test, and 2024 temporal-validation datasets using scikit-learn pipelines.
2.6. Prediction of Low-Reliability EMS Records
Two supervised classifiers were evaluated. A regularized stochastic gradient descent (SGD) [23] logistic classifier was used as a scalable linear baseline. The classifier used logistic loss, regularization, and class-balanced weighting. XGBoost was used as the nonlinear model because it can model interactions among heterogeneous operational and categorical predictors.
The XGBoost classifier used 500 trees, a learning rate of 0.05, a maximum tree depth of 6, a minimum child weight of 5, row subsampling of 0.8, column subsampling of 0.8, histogram-based tree construction, and a random seed of 42. The same general modeling configuration was used for the basic and weighted low-reliability targets.
Classification thresholds were selected exclusively on the 2025 validation partition by maximizing the F1 score. Once selected, the thresholds were frozen and applied without modification to the 2025 internal-test and 2024 temporal datasets. The finalized 32-predictor basic EMS-RRI XGBoost model used a threshold of 0.40.
2.7. Model Explainability and Robustness Analysis
Model interpretation and robustness were evaluated using four analyses:
- Feature-level SHAP analysis: SHapley Additive exPlanations (SHAP) were computed for a random sample of 30,000 records from the 2025 internal-test set. Mean absolute SHAP values were calculated for each transformed feature. One-hot encoded categories and numeric missingness indicators were then mapped back to their source predictors, and their SHAP values were summed.
- Domain-level interpretation: Predictors were grouped into broader clinical and operational domains. Domain importance was calculated by summing the SHAP importance values of predictors within each domain. These values were interpreted together with validation ablation results because domains with more predictors or encoded categories can accumulate larger SHAP totals.
-
Documentation-state robustness: Three versions of the predictor representation were compared:
- 1.
- Original representation: Distinct documentation states, including NOTRECORDED and NOTAPPLICABLE, were retained together with numeric missingness indicators.
- 2.
- Collapsed-state representation: Distinct unavailable-value categories, such as NOTRECORDED and NOTAPPLICABLE, were replaced by a single common category (UNAVAILABLE). This prevented the model from distinguishing why a value was unavailable.
- 3.
- Documentation-blind representation: Categorical documentation-state information and numeric missingness indicators were removed from the predictors.
This comparison assessed whether performance depended mainly on documentation-state patterns or on broader clinical and operational predictors. - Temporal and subgroup robustness: Performance on the 2025 internal-test set was compared with the 2024 temporal-validation dataset. Numeric shift was measured using the population stability index and categorical shift using Jensen–Shannon distance. Performance was also examined across NASEMSO region, U.S. Census region, and urbanicity without subgroup-specific threshold adjustments.
2.8. Failure-Case and Subgroup Error Analysis
Failure analysis was conducted using the frozen 32-predictor XGBoost model at the prespecified threshold of 0.40 on the 2025 internal test set () and the 2024 temporal-validation set (). Records were classified as true positives, false positives, false negatives, or true negatives using the basic EMS-RRI low-reliability cutoff of .
For false positives and false negatives, EMS-RRI values were examined relative to the cutoff, including whether they were within 2 or 5 points of it. False-negative severity was further summarized using EMS-RRI thresholds of 70 and 60. Error rates were also evaluated across NASEMSO region, U.S. Census region, and urbanicity, with subgroup estimates reported only when both outcome classes contained at least 100 records.
2.9. Downstream High-Acuity Utility Analysis
This analysis tested whether the basic EMS-RRI improved high-acuity prediction beyond standard early-encounter predictors.
- Outcome definition: A binary acuity target was created from eDisposition.19. Records coded as Critical (4219001) or Emergent (4219003) were assigned to the high-acuity class, while records coded as Lower Acuity (4219005) were assigned to the lower-acuity class. Records coded as NOTRECORDED, NOTAPPLICABLE, or Dead Without Resuscitation Efforts (4219007) were excluded.
- Eligible datasets: The final analysis included 309,790 records from 2025 and 115,877 records from 2024. High-acuity prevalence was 21.63% and 22.42%, respectively. The preserved 2025 partitions contained 216,840 training, 46,501 validation, and 46,449 internal-test records. All eligible 2024 records were used for temporal validation.
- Early-encounter predictors: The acuity models used a separate 18-predictor set restricted to information available early in the EMS encounter. Although several variables overlapped with the 32-predictor low-reliability model, later-available disposition, transport, payment, and outcome variables were excluded to reduce temporal leakage. The retained predictors covered derived operational durations, geographic context, urbanicity, age, cardiac-arrest status, and early clinical information.
-
Model comparison: Two XGBoost models were evaluated:
- 1.
- a baseline model using the 18 early-encounter predictors; and
- 2.
- an EMS-RRI-enhanced model using the same predictors plus the continuous basic EMS-RRI.
- Training and threshold selection: Both models used identical preprocessing and XGBoost settings. Class imbalance was handled using scale_pos_weight. Decision thresholds were selected on the 2025 validation set by maximizing F1 score and then frozen. The selected thresholds were 0.70 for the baseline model and 0.68 for the EMS-RRI-enhanced model.
- Outcome separation from EMS-RRI: The acuity outcome field, eDisposition.19, was not one of the 21 scoring elements used to construct EMS-RRI.
- Reliability-stratified evaluation: Performance was also compared across fixed EMS-RRI strata: low reliability (), medium reliability ( and ), and high reliability (). The same boundaries and frozen model thresholds were used for the 2025 internal-test and 2024 temporal-validation datasets.
2.10. Evaluation Measures
Model performance was evaluated using the measures summarized in Table 2.
For temporal evaluation, the preprocessing pipeline, selected predictors, fitted models, and classification thresholds developed using the 2025 data were applied unchanged to the 2024 dataset. No 2024 records were used for model development or threshold selection.
2.11. Software and Reproducibility
Data processing, model development, and analysis were conducted in Python, primarily using Google Colab. Pandas and NumPy were used for data handling, scikit-learn and XGBoost for predictive modeling, and SHAP for model interpretation. A random seed of 42 was used where supported.
3. Results
3.1. EMS-RRI Score Characteristics
The basic and domain-weighted EMS-RRI distributions were similar across the 2025 and 2024 event-level datasets. Table 3 summarizes the main score characteristics and low-reliability prevalence.
The basic and domain-weighted low-reliability classifications agreed for 91.05% of records in 2025 and 91.35% in 2024, with Cohen’s values of 0.785 and 0.797, respectively. The corresponding continuous scores were also strongly correlated in 2025 (Pearson ; Spearman ) and 2024 (Pearson ; Spearman ).
Most records contained 11 applicable scoring elements, accounting for 81.91% of records in 2025 and 80.51% in 2024. The largest contributors to undocumented applicable elements were eDispatch.02, eScene.01, and eScene.07; together, these elements accounted for 75.27% of undocumented applicable items in 2025 and 74.86% in 2024.
3.2. Model and Feature-Set Selection
Candidate models were compared on the 2025 validation set in two stages. First, SGD classifier and XGBoost were evaluated using the same 34-predictor specification. Second, the primary impression and primary symptom were removed, producing the final 32-predictor XGBoost model. Table 4 summarizes the validation results.
XGBoost outperformed SGD using the same 34 predictors. Removing primary impression and primary symptom predictors further improved validation performance, and the 32-predictor XGBoost model was selected for final evaluation.
3.3. Low-Reliability Prediction Performance
The final 32-predictor XGBoost model used a classification threshold of 0.40 selected on the 2025 validation set. Performance remained similar on the 2025 internal-test set. Table 5 summarizes the results.
3.4. Explainability and Documentation-State Robustness
SHAP analysis of the final 32-predictor XGBoost model showed that clinical situation and acuity accounted for the largest share of total mean absolute SHAP importance. This was followed by disposition and transport, geographic and urbanicity context, timing and operational response, and payment and service level.
Figure 3 presents the domain-level distribution.
Collapsing distinct unavailable-value categories and removing documentation-state information reduced the ROC-AUC value moderately. Table 6 summarizes these results.
3.5. Temporal and Subgroup Robustness
Table 7 summarizes the largest predictor-distribution shifts between the 2025 internal-test and 2024 temporal-validation datasets.
Figure 4 compares ROC-AUC across geographic and urbanicity subgroups in the 2025 internal-test and 2024 temporal-validation datasets. The largest declines were observed for the Western Plains NASEMSO region, from 0.8743 to 0.8044 (), and Frontier urbanicity, from 0.8738 to 0.8086 ().
3.6. Failure-Case Analysis
Table 8 summarizes the overall error profile and EMS-RRI severity of misclassified records. False-negative rates were higher than false-positive rates in both datasets and increased during temporal validation. Most false negatives were concentrated near the EMS-RRI cutoff, whereas false positives generally had substantially higher EMS-RRI values.
Table 9 reports the subgroups with the highest temporal false-negative rates. The largest increases were observed for Frontier and Western Plains records.
3.7. Downstream High-Acuity Prediction
Adding the continuous basic EMS-RRI produced modest improvements in high-acuity prediction across the validation, internal-test, and temporal-validation datasets (Table 10). The baseline and EMS-RRI-enhanced models used validation-selected thresholds of 0.70 and 0.68, respectively.
Table 11 shows the change in performance after adding EMS-RRI within each reliability stratum.
The largest gains were generally observed among low- and medium-reliability records, whereas changes among high-reliability records were minimal.
4. Discussion
4.1. Principal Findings
This study developed an applicability-aware EMS Record Reliability Index (EMS-RRI) and evaluated its use in reliability prediction, temporal validation, model explanation, and downstream acuity prediction. Five main findings emerged:
- 1.
- The EMS-RRI produced similar score distributions and low-reliability prevalence across the 2025 and 2024 NEMSIS datasets.
- 2.
- The basic and domain-weighted EMS-RRI measures showed strong agreement, indicating that the overall reliability pattern was not highly dependent on the weighting strategy.
- 3.
- Low-reliability records could be predicted with strong internal discrimination and moderately lower, but still substantial, performance under temporal validation.
- 4.
- Model explanations and documentation-state ablations showed that predictions reflected both documentation patterns and broader clinical, operational, and geographic context.
- 5.
- Failure-case analysis showed that most false negatives were concentrated near the EMS-RRI cutoff rather than among severely incomplete records, although higher miss rates were observed in selected regional and urbanicity subgroups.
- 6.
- Adding the continuous basic EMS-RRI produced modest but consistent improvements in downstream high-acuity prediction, particularly among records with lower or intermediate reliability.
4.2. Interpretation of the EMS-RRI
The EMS-RRI provides an event-specific measure of documentation completeness by evaluating only scoring elements applicable to each EMS record. The repeated discrete score values reflect the finite number of applicable elements and explain why the percentile-based low-reliability threshold included more than exactly 20% of records.
The strong agreement between the basic and domain-weighted scores indicates that the identified reliability patterns were robust to the weighting strategy. The basic EMS-RRI was retained as the primary measure because it offered the most direct and transparent interpretation at the record level.
4.3. Prediction and Explanation of Low-Reliability Records
XGBoost substantially outperformed the linear SGD classifier under the same 34-predictor specification, suggesting that low-record reliability was associated with nonlinear interactions among clinical, operational, and contextual variables. Removing the high-cardinality primary-impression and primary-symptom predictors further improved validation performance and temporal stability, resulting in the final 32-predictor model.
The final model maintained similar validation and internal-test performance, while showing a moderate decline during 2024 temporal validation. This indicates that the prediction task generalized across years, although temporal changes in documentation practices and categorical distributions affected performance.
SHAP analysis showed that clinical situation and acuity, disposition and transport, geographic context, and operational-response variables contributed most strongly to low-reliability prediction. These results should not be interpreted as causal effects. Instead, they indicate which predictor groups were most influential in the fitted model.
Documentation-state ablation provided additional insight. Performance decreased when distinct states such as NOTRECORDED and NOTAPPLICABLE were collapsed, and declined further when documentation-state information was removed. The model therefore benefited from distinguishing why information was unavailable. However, the documentation-blind model retained meaningful discrimination, suggesting that predictions were not based exclusively on missingness patterns.
4.4. Temporal and Subgroup Robustness
Numeric predictors showed little temporal distribution shift, whereas larger changes occurred in selected categorical variables. Despite these changes, the final model retained useful discrimination in the 2024 dataset.
Performance was not uniform across geographic and urbanicity subgroups. The largest declines occurred for Frontier urbanicity and the Western Plains NASEMSO region. These differences may reflect regional variation in documentation practices, EMS system organization, case mix, sample size, or coding patterns. Because subgroup-specific thresholds were not re-estimated, the findings represent direct transfer of the 2025 model rather than locally adjusted performance.
These results support temporal transportability at the national level but also show that aggregate performance can conceal weaker behavior within particular operational settings.
4.5. Interpretation of Failure Modes
- 1.
- Primary failure mode: The model was more likely to miss low-reliability records than to incorrectly flag reliable records, and this imbalance increased during temporal validation.
- 2.
- Severity of missed cases: More than 86% of false negatives were within 2 EMS-RRI points of the cutoff, while only about 3% had scores below 70. Most missed cases were therefore borderline rather than severely incomplete.
- 3.
- False-positive interpretation: False positives generally had substantially higher EMS-RRI values, suggesting that the model sometimes responded to contextual or operational patterns not fully represented by the completeness-based score.
- 4.
- Subgroup implications: Higher false-negative rates in Frontier, Rural, Western Plains, Midwest, and Great Lakes records indicate that model performance may vary across EMS environments and should be monitored over time.
4.6. Downstream Utility of EMS-RRI
The downstream high-acuity experiment showed that adding the continuous EMS-RRI produced modest but consistent improvements across validation, internal-test, and temporal-validation datasets. Because the baseline model already achieved strong performance, large gains were not expected. However, the consistent improvement indicates that record reliability captured information not fully represented by the original clinical and operational predictors.
The broader contribution of EMS-RRI is therefore not limited to incremental predictive gain. Its primary value is to function as a reliability-screening layer for smart-ambulance AI systems. In a smart-ambulance workflow, downstream models may support time-sensitive tasks such as clinical decision support, destination planning, resource coordination, patient-priority assessment, and early hospital notification. These tasks depend on the assumption that the underlying EMS record is sufficiently complete. EMS-RRI makes that assumption explicit by providing a record-level signal of whether the data are reliable enough to support automated use.
In deployment, records with adequate reliability could proceed to downstream AI models, while low-reliability or uncertain records could trigger selective review, abstention, additional documentation checks, or human-in-the-loop verification. This workflow shifts smart-ambulance AI from a purely prediction-centered design to a reliability-aware design, where the system considers both the predicted clinical risk and the trustworthiness of the input record. Such a framework is especially important in prehospital care, where incomplete documentation can propagate into automated triage, routing, and resource-allocation decisions. By screening records before downstream use, EMS-RRI supports safer and more dependable smart-ambulance automation.
4.7. Limitations and Future Work
The EMS-RRI operationalized documentation reliability through the completeness of selected applicable NEMSIS elements and was not designed to verify the factual or clinical correctness of recorded information. The low-reliability cutoff was derived from the discrete 2025 training-set distribution, which resulted in prevalence slightly above the intended 20% threshold. Temporal validation used an earlier year from the same national data system, so performance may differ across local agencies, software platforms, vendors, and documentation workflows. Although EMS-RRI was designed to support downstream smart-ambulance AI workflows, it was evaluated retrospectively using NEMSIS records and was not tested in a deployed smart-ambulance system. Some geographic and urbanicity subgroups showed larger temporal declines, but subgroup-specific recalibration was not performed. Finally, SHAP values reflect associations within the fitted model and should not be interpreted causally.
Future work should validate the EMS-RRI and low-reliability prediction model across additional years, EMS agencies, software platforms, and prospectively collected records to determine whether local recalibration is required. Prospective studies should also evaluate real-time integration of EMS-RRI, uncertainty estimates, and selective review into smart-ambulance workflows, including clinical decision support, destination planning, resource coordination, and quality control.
5. Conclusions
This study positions EMS-RRI as a pre-deployment reliability layer for smart-ambulance AI rather than merely a retrospective documentation-completeness score. The findings show that EMS record reliability can be quantified in an applicability-aware manner, predicted from broader event context, and used to inform whether downstream AI should proceed, abstain, or trigger additional review. Although the framework was evaluated retrospectively, its central implication is operational: smart-ambulance systems should not treat every EMS record as equally trustworthy before automated triage, routing, or resource-support decisions. By making record reliability explicit, EMS-RRI supports a shift from prediction-only automation toward reliability-aware prehospital AI. Future smart-ambulance systems should evaluate not only what the available data suggest but also whether those data are complete enough to justify automated use.
Funding
This research received no external funding.
Institutional Review Board Statement
Not applicable.
Informed Consent Statement
Not applicable.
Data Availability Statement
The data used in this study were obtained from the NEMSIS Public-Release Research Datasets. Access to these datasets is available through the NEMSIS Technical Assistance Center subject to its data-use procedures and requirements.
Acknowledgments
The authors acknowledge the National Emergency Medical Services Information System (NEMSIS) Technical Assistance Center and participating EMS agencies for providing the Public-Release Research Datasets used in this study. The findings and conclusions are those of the authors and do not necessarily represent the official views of NEMSIS, participating EMS agencies, or affiliated organizations.
Conflicts of Interest
The authors declare no conflicts of interest
References
- Ehlers, J.; Fisher, B.; Peterson, S.; Dai, M.; Larkin, A.; Bradt, L.; Mann, N.C. Description of the 2020 NEMSIS Public-Release Research Dataset. Prehospital Emerg. Care 2023, 27, 473–481. [Google Scholar] [CrossRef] [PubMed]
- Laudermilch, D.J.; Schiff, M.A.; Nathens, A.B.; Rosengart, M.R. Lack of Emergency Medical Services Documentation Is Associated with Poor Patient Outcomes: A Validation of Audit Filters for Prehospital Trauma Care. J. Am. Coll. Surg. 2010, 210, 220–227. [Google Scholar] [CrossRef] [PubMed]
- Williams, N. Considering Non-Hospital Data in Clinical Informatics Use Cases: A Review of the National Emergency Medical Services Information System (NEMSIS). Inform. Med. Unlocked 2022, 35, 101129. [Google Scholar] [CrossRef] [PubMed]
- Mashoufi, M.; Ayatollahi, H.; Khorasani-Zavareh, D. A Review of Data Quality Assessment in Emergency Medical Services. Open Med. Inform. J. 2018, 12, 19–32. [Google Scholar] [CrossRef] [PubMed]
- Cercone, A.; Ramgopal, S.; Martin-Gill, C. Completeness of Pediatric Versus Adult Patient Assessment Documentation in the National Emergency Medical Services Information System. Prehospital Emerg. Care 2024, 28, 243–252. [Google Scholar] [CrossRef] [PubMed]
- Abir, M.; Taymour, R.K.; Goldstick, J.E.; Malsberger, R.; Forman, J.; Hammond, S.; Wahl, K. Data Missingness in the Michigan NEMSIS (MI-EMSIS) Dataset: A Mixed-Methods Study. Int. J. Emerg. Med. 2021, 14, 22. [Google Scholar] [CrossRef] [PubMed]
- O’Neill, M.; Cheskes, S.; Drennan, I.; Keown-Stoneman, C.; Lin, S.; Nolan, B. Injury Severity Bias in Missing Prehospital Vital Signs: Prevalence and Implications for Trauma Registries. Injury 2025, 56, 111747. [Google Scholar] [CrossRef] [PubMed]
- Heino, A.; Iirola, T.; Raatiniemi, L.; Nurmi, J.; Olkinuora, A.; Laukkanen-Nevala, P.; Virkkunen, I.; Tommila, M. The Reliability and Accuracy of Operational System Data in a Nationwide Helicopter Emergency Medical Services Mission Database. BMC Emerg. Med. 2019, 19, 53. [Google Scholar] [CrossRef] [PubMed]
- Dekker, L.; Daems, J.D.; Duvekot, M.H.C.; Nguyen, T.T.M.; Venema, E.; van Es, A.C.G.M.; Rozeman, A.D.; Moudrous, W.; Dorresteijn, K.R.I.S.; Hensen, J.H.J.; et al. Comparison of Prehospital Assessment by Paramedics and In-Hospital Assessment by Physicians in Suspected Stroke Patients: Results From 2 Prospective Cohort Studies. Stroke 2023, 54, 2279–2285. [Google Scholar] [CrossRef] [PubMed]
- Ramgopal, S.; Sepanski, R.J.; Martin-Gill, C. Empirically Derived Age-Based Vital Signs for Children in the Out-of-Hospital Setting. Ann. Emerg. Med. 2023, 81, 402–412. [Google Scholar] [CrossRef] [PubMed]
- Spaite, D.W.; Barnhart, B.; Jorgenson, D.B.; Burgett, K.; Rice, A.D.; Gaither, J.B.; Keim, S.M.; Hu, C. Abstract Su601: Missed Hypoxia in the Prehospital Care of Major Traumatic Brain Injury: Discrepancies Between Continuous Monitor Data and Clinical Documentation. Circulation 2024, 150. [Google Scholar] [CrossRef]
- Alrawashdeh, A.; Alqahtani, S.; Alkhatib, Z.I.; Kheirallah, K.; Melhem, N.Y.; Alwidyan, M.; Al-Dekah, A.M.; Alshammari, T.; Nehme, Z. Applications and Performance of Machine Learning Algorithms in Emergency Medical Services: A Scoping Review. Prehospital Disaster Med. 2024, 39, 368–378. [Google Scholar] [CrossRef] [PubMed]
- Saban, M.; Hiura, G.; de la Peña, P.; Wozniak, A.; Heiferman, D.; Akbilgic, O.; Cichon, M.; Tootooni, S. Machine Learning Models Powered by Emergency Medical Services Data Enhance Stroke Triage in Prehospital Settings. Sci. Rep. 2026, 16, 7139. [Google Scholar] [CrossRef] [PubMed]
- Agbo Eje, O.; Azim, S.M.; Dehzangi, I. Explainable AI Applications in Healthcare: A Systematic Review. Algorithms 2026, 19, 488. [Google Scholar] [CrossRef]
- Jia, Y.; McDermid, J.; Lawton, T.; Habli, I. The Role of Explainability in Assuring Safety of Machine Learning in Healthcare. IEEE Trans. Emerg. Top. Comput. 2022, 10, 1746–1760. [Google Scholar] [CrossRef]
- Allen, J.; Nickles, A.V.; Ibrahim, G.; Anderson, B.; Quartermus, K.; Oostema, J.A. Abstract WP93: Providing Stroke Reports to Emergency Medical Services (EMS) Agencies Improves Data Quality in Michigan’s Statewide EMS Data Repository. Stroke 2024, 55. [Google Scholar] [CrossRef]
- Allgood, R.A.; Faris, G.W.; Supples, M.; Lardaro, T.; Crowe, R.P. Results of a Quality Improvement Initiative to Increase the Completion Rate of Electronic Health Records for Patient Encounters at a Large Urban Fire-Based Non-Transporting EMS Agency. Prehospital Emerg. Care 2024, 28, 696–702. [Google Scholar] [CrossRef] [PubMed]
- Ward, C.; Zhang, A.; Brown, K.; Simpson, J.; Chamberlain, J. National Characteristics of Non-Transported Children by Emergency Medical Services in the United States. Prehospital Emerg. Care 2022, 26, 537–546. [Google Scholar] [CrossRef] [PubMed]
- Søvsø, M.B.; Zakariassen, E. Nordic-Baltic EMS Benchmarking: Important Progress but Fragile Data Foundations. Scand. J. Trauma Resusc. Emerg. Med. 2026, 34, 7. [Google Scholar] [CrossRef] [PubMed]
- National Emergency Medical Services Information System Technical Assistance Center. 2025 NEMSIS Public-Release Research Dataset Public-release research dataset; restricted access. 2026. Available online: https://nemsis.org/using-ems-data/request-research-data/.
- National Emergency Medical Services Information System Technical Assistance Center. 2024 NEMSIS Public-Release Research Dataset Public-release research dataset; restricted access. 2025. Available online: https://nemsis.org/using-ems-data/request-research-data/.
- Chen, T.; Guestrin, C. XGBoost: A Scalable Tree Boosting System. Proceedings of the Proceedings of the 22nd ACM SIGKDD International Conference on Knowledge Discovery and Data Mining. Association for Computing Machinery 2016, KDD ’16, 785–794. [Google Scholar] [CrossRef]
- Robbins, H.; Monro, S. A Stochastic Approximation Method. Ann. Math. Stat. 1951, 22, 400–407. [Google Scholar] [CrossRef]
Figure 1.
Overview of the proposed reliability-aware EMS AI pipeline for smart-ambulance applications. NEMSIS records are evaluated using the applicability-aware EMS-RRI, followed by contextual prediction of low-reliability records. The resulting reliability signal supports routing to downstream smart-ambulance AI tasks or selective review.
Figure 1.
Overview of the proposed reliability-aware EMS AI pipeline for smart-ambulance applications. NEMSIS records are evaluated using the applicability-aware EMS-RRI, followed by contextual prediction of low-reliability records. The resulting reliability signal supports routing to downstream smart-ambulance AI tasks or selective review.

Figure 2.
NEMSIS data preparation and analysis workflow. Sampled yearly event records were linked across selected NEMSIS tables using PcrKey, consolidated into one event-level record per encounter, and enriched with basic and domain-weighted EMS-RRI scores. The resulting event-level datasets were then used for model development, internal testing, temporal validation, explainability and ablation analyses, and downstream acuity prediction.
Figure 2.
NEMSIS data preparation and analysis workflow. Sampled yearly event records were linked across selected NEMSIS tables using PcrKey, consolidated into one event-level record per encounter, and enriched with basic and domain-weighted EMS-RRI scores. The resulting event-level datasets were then used for model development, internal testing, temporal validation, explainability and ablation analyses, and downstream acuity prediction.
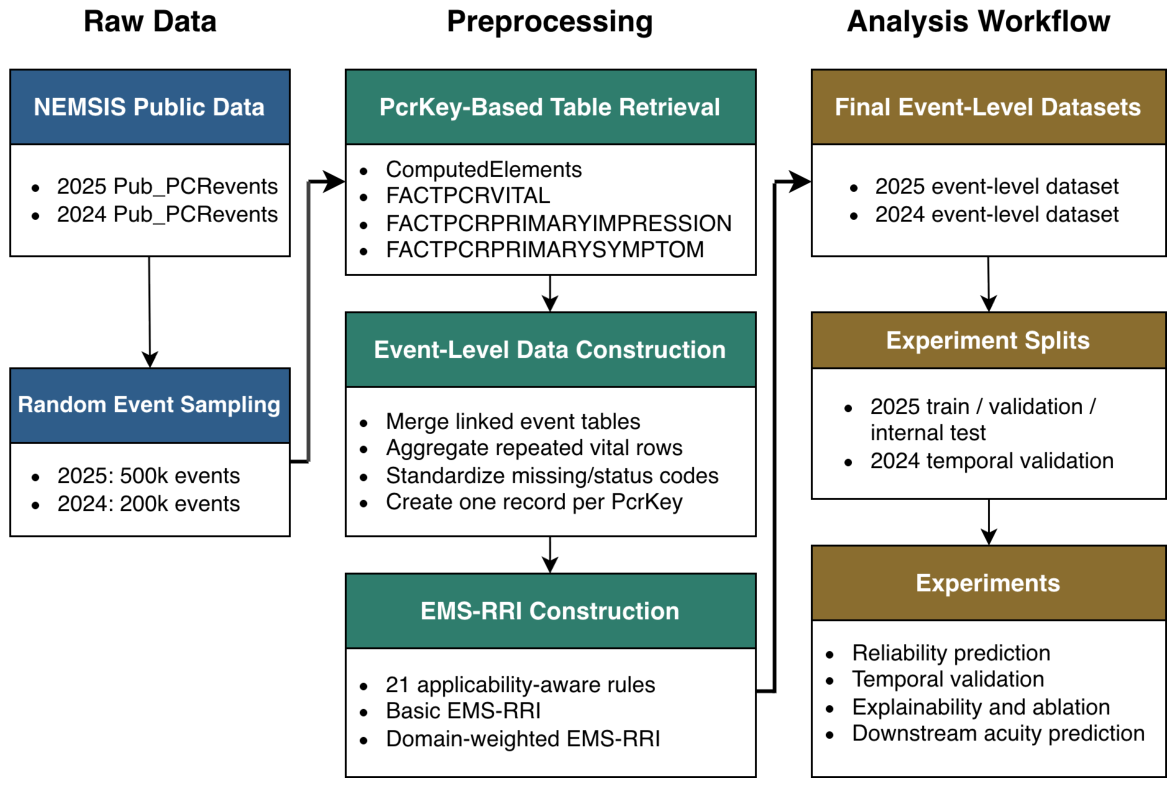
Figure 3.
Domain-level SHAP importance for the final 32-predictor low-reliability model. Values represent the percentage of total mean absolute SHAP importance attributed to predictors within each domain.
Figure 3.
Domain-level SHAP importance for the final 32-predictor low-reliability model. Values represent the percentage of total mean absolute SHAP importance attributed to predictors within each domain.
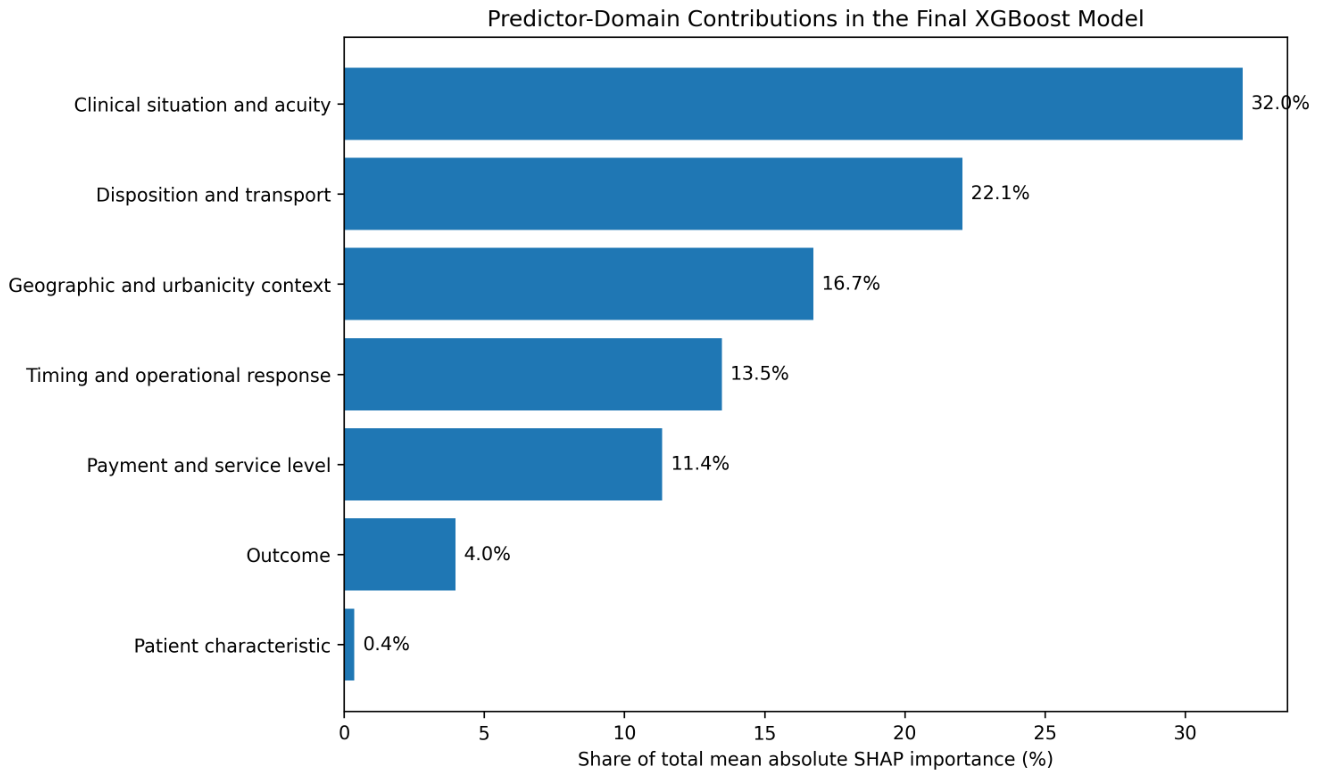
Figure 4.
Subgroup ROC-AUC for the final low-reliability prediction model in the 2025 internal-test and 2024 temporal-validation datasets. Performance is shown across NASEMSO regions, U.S. Census regions, and urbanicity categories using the fixed classification model and predictor specification.
Figure 4.
Subgroup ROC-AUC for the final low-reliability prediction model in the 2025 internal-test and 2024 temporal-validation datasets. Performance is shown across NASEMSO regions, U.S. Census regions, and urbanicity categories using the fixed classification model and predictor specification.
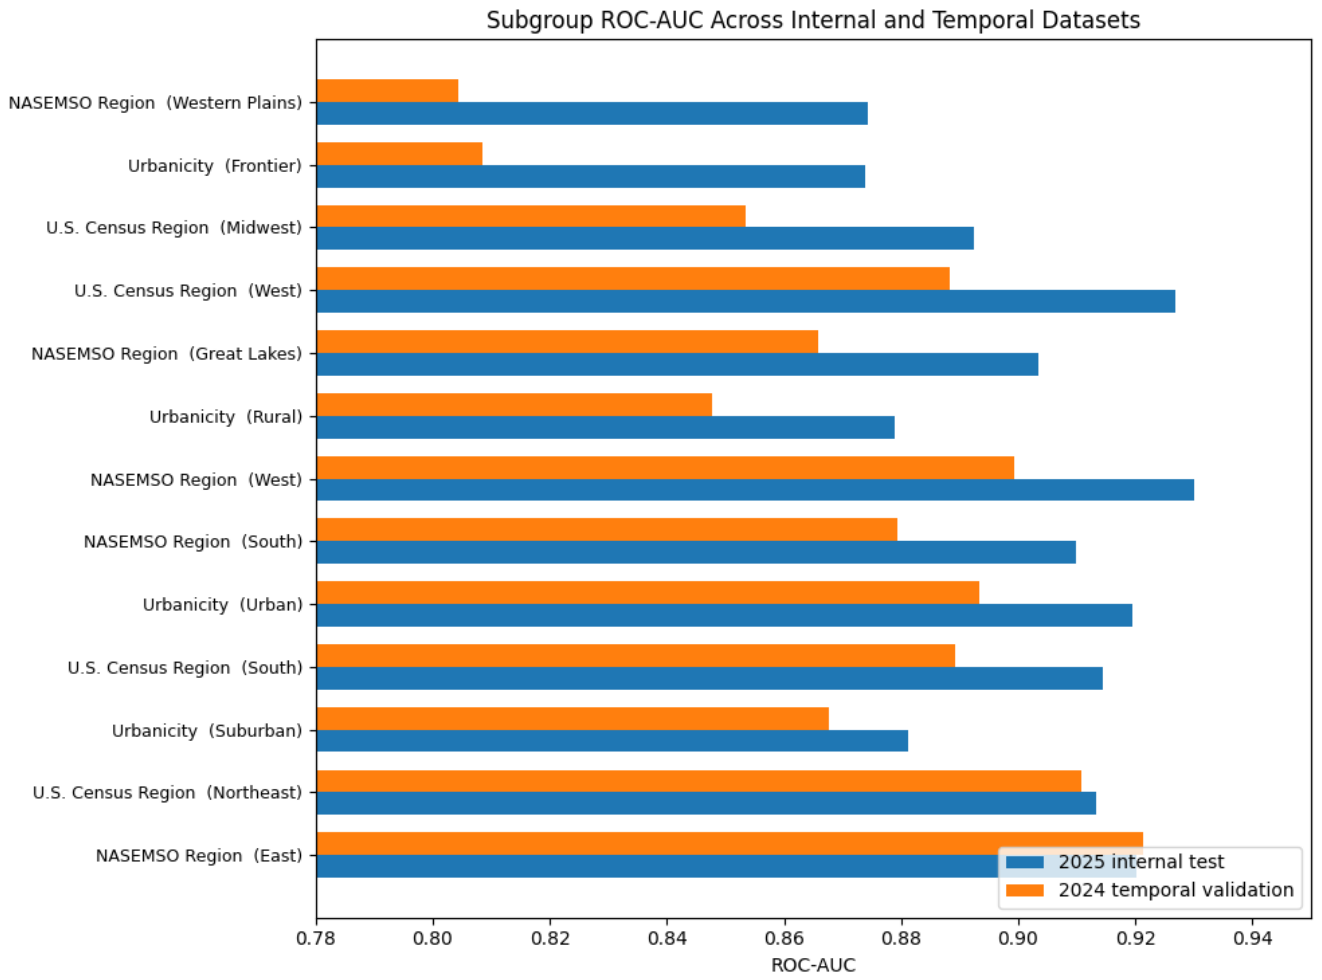

Table 1.
EMS-RRI scoring elements across NEMSIS sections.
| NEMSIS section | Information represented | Elements |
|---|---|---|
| eDispatch | Dispatch information | 2 |
| eDisposition | Disposition and transport outcome | 1 |
| eResponse | Unit response information | 3 |
| eArrest | Cardiac arrest status and details | 10 |
| eScene | Scene and incident information | 5 |
Table 2.
Performance measures used for model evaluation.
| Measure | Purpose |
|---|---|
| ROC-AUC | Overall discrimination between the two classes across all thresholds. |
| PR-AUC | Discrimination with emphasis on the positive class; prioritized because both prediction tasks had unequal class distributions. |
| Accuracy | Proportion of all predictions classified correctly. |
| Balanced accuracy | Average recall across the two classes. |
| Precision | Proportion of positive predictions that were correct. |
| Recall | Proportion of actual positive records correctly identified. |
| F1 score | Harmonic mean of precision and recall. |
Table 3.
EMS-RRI score characteristics across the 2025 and 2024 datasets.
| Year | EMS-RRI measure | Mean | Median | Low reliability, n (%) |
|---|---|---|---|---|
| 2025 | Basic | 88.53 | 90.91 | 168,106 (33.62) |
| 2025 | Domain weighted | 90.65 | 92.31 | 123,369 (24.67) |
| 2024 | Basic | 88.18 | 90.91 | 69,049 (34.52) |
| 2024 | Domain weighted | 90.41 | 92.31 | 51,749 (25.87) |
Table 4.
Validation performance during model and feature-set selection.
| Model specification | Threshold | ROC-AUC | PR-AUC | F1 score |
|---|---|---|---|---|
| SGD, 34 predictors | 0.50 | 0.7842 | 0.6442 | 0.6313 |
| XGBoost, 34 predictors | 0.38 | 0.9061 | 0.8556 | 0.7650 |
| XGBoost, 32 predictors | 0.40 | 0.9138 | 0.8666 | 0.7739 |
Table 5.
Performance of the final XGBoost model for predicting low-reliability EMS records.
| Dataset | ROC-AUC | PR-AUC | F1 score |
|---|---|---|---|
| 2025 validation | 0.9138 | 0.8666 | 0.7739 |
| 2025 internal test | 0.9145 | 0.8659 | 0.7745 |
| 2024 temporal validation | 0.8887 | 0.8407 | 0.7455 |
Table 6.
Documentation-state ablation results for the final 32-predictor model on the 2025 validation set.
Table 6.
Documentation-state ablation results for the final 32-predictor model on the 2025 validation set.
| Predictor representation | ROC-AUC |
|---|---|
| Original representation | 0.9061 |
| Collapsed-state representation | 0.8735 |
| Documentation-blind representation | 0.8194 |
Table 7.
Largest temporal distribution shifts in predictors retained in the final model.
| Predictor type | Predictor | Shift value |
|---|---|---|
| Numeric | computed_EMSSceneToPatientTimeMin | PSI = 0.0010 |
| Categorical | eArrest_05 | JS = 0.208 |
| Categorical | eSituation_20 | JS = 0.203 |
Table 8.
Failure-case characteristics on the internal and temporal evaluation sets.
| Metric | 2025 Internal Test | 2024 Temporal Validation |
|---|---|---|
| False positives, n | 5,618 | 16,203 |
| False negatives, n | 5,728 | 18,385 |
| False-positive rate (%) | 11.28 | 12.37 |
| False-negative rate (%) | 22.72 | 26.63 |
| Median EMS-RRI, false positives | 90.9091 | 90.9091 |
| False positives within 5 points of cutoff (%) | 0.75 | 0.85 |
| Median EMS-RRI, false negatives | 81.8182 | 81.8182 |
| False negatives within 2 points of cutoff (%) | 89.19 | 86.26 |
| False negatives within 5 points of cutoff (%) | 89.54 | 87.29 |
| False negatives with EMS-RRI (%) | 2.83 | 3.02 |
| False negatives with EMS-RRI (%) | 0.73 | 0.53 |
Table 9.
Subgroups with the highest false-negative rates during temporal validation.
| Grouping | Subgroup | 2025 FNR (%) | 2024 FNR (%) | Change (pp) |
|---|---|---|---|---|
| NASEMSO region | Western Plains | 38.03 | 46.83 | +8.80 |
| NASEMSO region | Great Lakes | 33.65 | 37.24 | +3.59 |
| U.S. Census region | Midwest | 36.57 | 40.83 | +4.27 |
| Urbanicity | Frontier | 29.49 | 41.35 | +11.85 |
| Urbanicity | Rural | 34.16 | 36.42 | +2.26 |
| FNR = false-negative rate; pp = percentage points. | ||||
Table 10.
F1 performance of the baseline and EMS-RRI-enhanced models for high-acuity prediction.
| Model | Validation F1 | Test F1 | Temporal F1 |
|---|---|---|---|
| Baseline | 0.8105 | 0.8088 | 0.8054 |
| Baseline + basic EMS-RRI | 0.8119 | 0.8095 | 0.8064 |
Table 11.
Change in high-acuity prediction performance after adding basic EMS-RRI. Positive values indicate improvement over the baseline model.
Table 11.
Change in high-acuity prediction performance after adding basic EMS-RRI. Positive values indicate improvement over the baseline model.
| Dataset | Reliability group | ROC-AUC | PR-AUC | F1 |
|---|---|---|---|---|
| 2025 internal test | Low | 0.0010 | 0.0032 | 0.0007 |
| 2025 internal test | Medium | 0.0013 | 0.0051 | 0.0011 |
| 2025 internal test | High | 0.0009 | 0.0026 | 0.0001 |
| 2024 temporal validation | Low | 0.0012 | 0.0022 | 0.0009 |
| 2024 temporal validation | Medium | 0.0008 | 0.0034 | 0.0017 |
| 2024 temporal validation | High | 0.0011 | -0.0009 | 0.0002 |
Disclaimer/Publisher’s Note: The statements, opinions and data contained in all publications are solely those of the individual author(s) and contributor(s) and not of MDPI and/or the editor(s). MDPI and/or the editor(s) disclaim responsibility for any injury to people or property resulting from any ideas, methods, instructions or products referred to in the content. |
© 2026 by the authors. Licensee MDPI, Basel, Switzerland. This article is an open access article distributed under the terms and conditions of the Creative Commons Attribution (CC BY) license.
Copyright: This open access article is published under a Creative Commons CC BY 4.0 license, which permit the free download, distribution, and reuse, provided that the author and preprint are cited in any reuse.