

Submitted:
04 September 2026
Posted:
07 September 2026
You are already at the latest version
Abstract
Background. In the final steps of the coagulation cascade, thrombin converts fibrinogen to fibrin, which polymerizes into a fibrin network that stabilizes blood clots. The concentration of these two proteins can affect network structure. The fibrin network is dissolved by plasmin, by cleaving fibrin peptide chains. In internal fibrinolysis, tissue plasminogen activator (tPA) activates endogenous plasminogen to plasmin, with activation efficiency much enhanced when tPA and plasminogen are bound to fibrin. The effect of varying fibrinogen and thrombin concentrations and the effect of the resulting varying network structure on fibrinolysis are convoluted, with contradictory trends reported in the literature. Objectives. Investigate how fibrinogen and thrombin concentration quantitatively affect fibrin network structure, and how fibrinogen, thrombin concentrations and the resulting, altered network structure affect fibrinolysis, at a given, rate-limiting tPA concentration. Methods. Fibrin clots were generated from diluted, platelet-poor plasma and purified PEAK 1 fibrinogen, at varying fibrinogen and exogenous thrombin concentrations. The effects of varying fibrinogen and thrombin concentrations on network structure were quantified using non-linear power-law equations derived from confocal images. Internal clot lysis time (CLT) was determined using turbidity-based assays as a function of fibrinogen and thrombin concentrations and network structure at fixed, rate-limiting tPA, and therefore fixed plasmin concentration. Results and Conclusions. Network structural features (fiber density, pore size) and CLT fit well to empirical equations of the form k([Fgn]α× [Thr]β). Generally, increasing fibrinogen resulted in higher fiber density and thicker fibers, whereas increasing thrombin resulted in higher fiber density and thinner fibers. Internal CLT showed strong dependence on fibrinogen, and negligible dependence on thrombin. This implies that fibrinogen is the main determinant of internal CLT in these systems, while thrombin and, thus, thrombin-dependent formation kinetics and network structure, per se, have a near-negligible effect.
Keywords:
plasma clot structure
; internal lysis
; fibrinogen
; thrombin
1. Introduction
1.1. Fibrin Fiber Formation
One of the main structural components of a blood clot is a mesh of fibrin fibers. This fibrin network stabilizes the clot, and traps red blood cells and other blood components, as blood flow is halted. The fibrin network is formed at the end of the coagulation cascade, when thrombin converts soluble fibrinogen to insoluble fibrin by enzymatically cleaving a pair of fibrinopeptides A, and a pair of fibrinopeptides B, from the central E domain of fibrinogen [1]. Removal of these fibrinopeptides exposes amino acid sequences, termed ‘knob A’ and ‘knob B’, which can bind to binding pockets termed ‘hole a’ and ‘hole b’, respectively, in the distal D domains of fibrin [1,2]. Knob-hole binding between fibrin molecules results in the initial formation of fibrin multimers, half-staggered protofibrils, and fibrin aggregates [3,4]. These initial, smaller fibrin structures then further assemble into a branched network of thicker fibrin fibers [5] (Figure 1).
Human fibrinogen is a 340 kDa plasma glycoprotein composed of two sets of three polypeptide chains (Aα, Bβ, and γ), arranged into a trinodular structure consisting of a central E region and two terminal D regions connected by coiled coils (Figure 1A). Extending from the coiled coils are the flexible αC regions, which are thought to contribute significantly to interactions between protofibrils and stabilization of mature fibrin fibers [6,7]. Mature fibrin fibers contain approximately one hundred protofibrils per cross-section and exhibit a dense core surrounded by a less dense periphery (Figure 1B, C). In addition, activated factor XIII strengthens fibrin fibers through covalent crosslinking between fibrin molecules, thereby increasing clot stiffness and resistance to fibrinolysis [8,9,10,11].
Although the basic thrombin-mediated fibrin activation steps and early fibrin multimer formation are well established, intermediate and later structures of fibrin assembly have not been fully characterized, and the key interactions that control lateral assembly, fiber thickening and branching are also not understood [5,12,13]. A quantitative analysis of how the two main contributors of fibrin assembly – fibrinogen and thrombin – affect network structure would, therefore, advance our understanding of fibrin network formation [14].
1.2. Network Structure
Fibrin network structure is typically characterized by structural parameters, such as fiber density (e.g., fibers/volume or fibers/area), pore size, branchpoints, and fiber diameter [19]. Network structure can be profoundly altered by several variables, such as the concentration of the building block, fibrinogen, and its enzymatic activator, thrombin, as well as salt concentration and molecules that interact with fibrinogen, fibrin and thrombin [5,14,19]. In general, increasing fibrinogen results in higher fiber density and thicker fibers, while increasing thrombin results in higher fiber density and thinner fibers [14,20,21]. Variations in fibrinogen and thrombin concentrations are physiologically relevant in various scenarios. Fibrinogen concentration in healthy individuals ranges from 2-4 mg/mL (6-12 μM) [13]. However, fibrinogen concentration can decrease to near-zero, e.g., in trauma, which may result in dilutional coagulopathy. In this case, severe blood loss is compensated for by increasing blood volume with fluid (without coagulation factors), essentially resulting in a dilution of blood and all plasma components [22,23]. Fibrinogen levels can increase severalfold in inflammation, disease or obesity, often resulting in thrombotic complications. Thrombin concentration is highly dynamic and can vary by over two orders of magnitude, from 1 nM to 500 nM, depending on temporal and spatial coagulation activation [24,25].
Despite the known, important physiological variations in fibrinogen and thrombin concentrations, the relationships between structural parameters and fibrinogen/thrombin concentrations have mostly been described as trendlines or linear regressions [14]. Moreover, these relationships have often been reported using the ratio of fibrinogen and thrombin concentrations ([Fgn]/[Thr]), which results in inconclusive trendlines. This is because the effect of [Fgn] and [Thr] on structural features is likely non-linear and may have opposing effects on some structural parameters (e.g., increasing fibrinogen causes the fiber diameter to increase, while increasing thrombin causes diameter to decrease). Non-linear equations of the form [Fgn]α× [Thr]β (product of power law functions), rather than the simple linear regressions or ratios of the two, may, therefore, be a better choice to characterize structural parameters as a function of fibrinogen and thrombin concentrations. Such power law functions are more flexible and provide accurate fits with a low number of fitting parameters. This approach yields quantitative expressions describing the effect of thrombin and fibrinogen on structure [26]. Additionally, such equations would lay the baseline for concentration-structure relationships, which will enable accurate modeling and testing of the effect of additional extraneous factors on structure against this baseline.
Moreover, having a way to quantitatively control network structure by varying fibrinogen and thrombin concentrations will make it possible to test the effect of these enzyme concentrations, and the effect of the resulting, altered network structure on fibrinolysis.
1.3. Lysis and Clot Lysis Time
Blood clots are transient structures by design, as they carry within them the agents of their dissolution. Plasmin, the activated form of plasminogen, breaks down blood clots by transversely cleaving the fibrin fibers that stabilize a clot [27,28,29]. Plasmin cuts the fibrin peptide chains at numerous sites, mostly in the αC region and across the coiled coils, which ultimately dissolves fibrin into fibrin degradation products (Figure 1) [30]. Plasminogen is activated by tissue plasminogen activator (tPA) under typical physiological conditions. When plasminogen and tPA are both bound to fibrin, tPA-mediated plasminogen activation is at least 1000x faster compared to when these enzymes are free in solution [27,31,32]. In internal fibrinolysis, endogenous plasminogen and tPA bind to fibrin fibers as they form; plasminogen and tPA are, therefore, incorporated into the clot. In vitro, internal lysis can be mimicked by forming plasma clots in the presence of small, rate-limiting amounts of tPA, which activates plasminogen that is already present in plasma [33,34]. In contrast, in external fibrinolysis, tPA is added externally to the outside of the clot, after the clot has been formed. External fibrinolysis is important for clinical treatment of pathological clots but is not investigated in the current work.
The effect of clot structure on internal lysis has been examined previously [29,31,35,36,37], suggesting that internal clot lysis time may depend on structure; specifically, that clots consisting of more, thinner fibers lyse slower than clots with fewer, thicker fibers.
However, experimental conditions varied widely among these studies, making it difficult to distinguish the effects of fibrin network structure from those of fibrinogen and thrombin concentrations, which themselves influence clot structure. Therefore, it is possible that internal CLT depends primarily on fibrinogen concentration rather than on fibrin network structure per se. In this case, network structure would not be an independent determinant of internal CLT, but rather a secondary consequence of changes in fibrinogen concentration.
Prior studies on internal clot lysis have yielded mixed conclusions regarding the role of fibrin network structure. Turbidimetry, confocal microscopy, and qualitative assays suggest that, while individual fiber thickness can affect fibrin cleavage rates, network structure alone does not consistently determine overall clot lysis time when fibrinogen concentration is controlled [29,31,35,36,37,38]. Although case-control studies consistently associate prolonged clot lysis times with thrombotic risk, findings regarding fibrin network structure are contradictory, with some studies reporting thicker fibers and others reporting thinner, denser fibers in thrombotic conditions [39,40,41,42,43,44,45,46,47,48,49,50,51,52]. These studies are limited by potential confounding variables and their inability to establish a causal relationship between fibrin network structure and clot lysis time.
To isolate these factors, the current work systematically quantifies the individual effects of fibrinogen and thrombin concentrations on both network structure and internal lysis time. Experiments utilize a purified fibrinogen system and a dilutional, platelet-poor plasma system with a constant, rate-limiting concentration of tPA to ensure plasminogen activation remains the primary rate-determining step.
2. Materials & Methods
2.1. Clot Formation
Pooled normal human plasma (George King Bio-Medical, Product No. 0020, LOT 7716, Overland Park, KS; stock concentration, 3.25 mg/mL) was aliquoted and stored at –80 °C until use. This is pooled, well-characterized, platelet-poor plasma collected by plasmapheresis from over 30 healthy, non-smoker donors. Prior to experiments, aliquots were thawed at 37 °C for 10 min. Fluorescently labeled fibrinogen (Alexa Fluor™ 488 conjugate (AF488 fibrinogen), Thermo Fisher Scientific) was added to plasma at 6.5% of the total fibrinogen concentration. All fluorescently labeled samples, therefore, contained the same final concentration of 6.5% AF488 fibrinogen. The highest possible final fibrinogen concentration was 2.9 mg/mL. To achieve lower fibrinogen concentrations, plasma was serially diluted by a factor of 2 with Tris-buffered saline (TBS; 20 mM Tris, 150 mM NaCl, pH 7.4) to get final fibrinogen concentrations of 2.9 (starting), 1.45, 0.73, and 0.36 mg/mL. Clotting was activated by adding activation mixture containing Tris-buffer saline, CaCl2, and thrombin (Enzyme Research Laboratories, South Bend, IN) to final thrombin concentrations of 0.05, 0.1, 0.2 and 1.0 NIH units/mL (U/mL; 1.0 U/mL = 10 nM) and 20 mM CaCl2. 30 μL of the clotting reactions were assembled in microtubes and then quickly loaded into microscopy channel slides (ibidi μ-Slide VI 0.4, Thermo Fisher Scientific) for confocal microscopy imaging. Samples were protected from light and incubated at room temperature for 2 hours before imaging. 36 images were collected for each condition.
Clots formed from purified fibrinogen (PEAK 1 fibrinogen, Enzyme Research Laboratories) were prepared and analyzed using the same protocol described above. Detailed results on the network structure of these clots, as a function of fibrinogen and thrombin, have been reported previously by our group [26], and the corresponding data are shown here for comparison.
2.2. Thrombin Activity
Thrombin activity (for 1 U/mL, 0.1 U/mL and 0 added thrombin (baseline)) in plasma was determined using the Abcam Thrombin Activity Assay Kit (ab234620-1001), which enables colorimetric detection of thrombin activity by measuring the absorption of the cleaved substrate at 405 nm in various sample types, including human plasma (Supplement S1).
2.3. Confocal Microscopy and Image Analysis
Confocal imaging was performed on a laser-scanning confocal microscope (Zeiss LSM 710) using a 40x oil immersion objective and a 488 nm excitation wavelength. For fiber density and bubble diameter, 36 image-level replicates were analyzed per condition. Image stacks covered an x-y area of 212 μm × 212 μm with a z-stack depth of 15 μm, acquired in 33 slices at 0.47 μm intervals. Images were collected at 8-bit resolution. The master gain was adjusted to visualize fibers while minimizing background noise.
2.4. Fiber Density
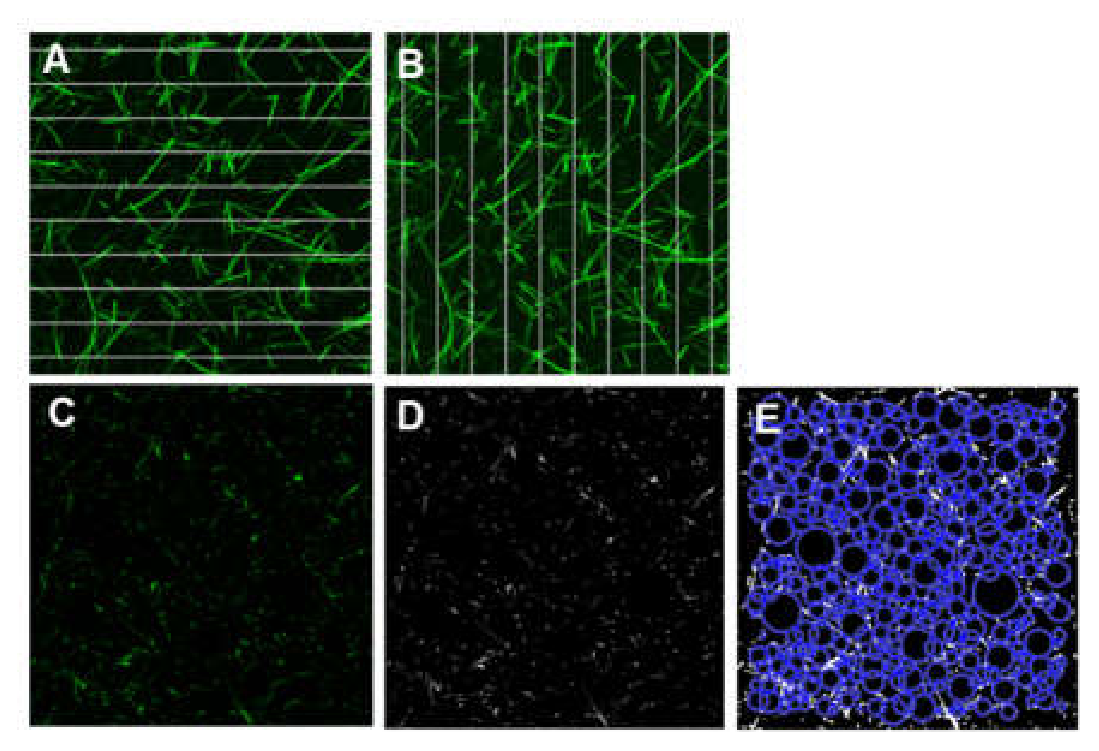
Image stacks were converted into 2D maximum-intensity projections in ImageJ, followed by binarization. Twenty horizontal and twenty vertical equidistant lines were superimposed on each image (Figure 2A-B), and the number of fibers intersecting each line was counted (script, see supplement S7). Fiber density was calculated as the mean number of crossings per 100 µm line length. It should be noted that the image has a depth of 15 µm; therefore, each line is 15 µm deep. Thus, the proper unit for fiber density is lines/1500 µm2. A depth of 15 µm gave images with a good number of fibers, and little background fluorescence.
Figure 2.
Illustration of the methods used to determine fiber density and bubble diameter. (A) Maximum-intensity projection image with horizontal and (B) vertical equidistant lines superimposed for fiber density analysis. (C) Representative fibrin fiber image slice, (D) corresponding binarized image, (E) resulting bubble analysis output [53,54].
2.5. Bubble Analysis
Image slices were exported to multi-TIFF format and binarized in MATLAB using a threshold of 3x the average image intensity. A custom script (Supplement S8) fits circles (“bubbles”) into fiber-free regions on each slice. Bubbles overlapping with fibers, other larger bubbles, or image boundaries were excluded. The diameters of the remaining bubbles were recorded, providing a measure of network porosity, with larger bubble diameters reflecting more porous structures (Figure 2C-E) [53,54].
2.6. SEM Analysis
Plasma clots were prepared for SEM imaging, and fiber diameter was analyzed as described in [26,55]. Plasma clots were processed using a standardized wash–fix–dehydrate–dry protocol described previously [55]. After polymerization, clots formed in Eppendorf tube lids were washed three times with sodium cacodylate buffer (50 mM sodium cacodylate, 100 mM NaCl) and fixed by immersion in 2 mL of 2% glutaraldehyde prepared in the same buffer for 6 hours. Following fixation, samples were washed three more times with sodium cacodylate buffer, dehydrated through a graded ethanol series (30%–100%), and dried using hexamethyldisilazane (HMDS). The dried samples were then sputter-coated with gold for 45 seconds using a Cressington Model 108 coater. SEM Imaging was performed using a Zeiss Gemini 300 SEM operated under high vacuum at 30,000× magnification. Two independent clot preparations (biological replicates) were analyzed for each condition. Eight micrographs were collected from each replicate, resulting in a total of 16 images per condition. Images were acquired from widely separated, non-overlapping regions across each clot at a fixed magnification of 30,000×, while avoiding the film region, as previously described [55].
2.7. Internal Clot Lysis Time
Clot formation and lysis were assessed by turbidity in a SpectraMax Microplate Reader at 405 nm every 7 seconds for 3 hours in 96 well Microplate (Corning flat clear-bottom white polystyrene, TC-treated). The final reaction volume in each well was 100 μL. Clots were prepared using nine fibrinogen/thrombin concentration combinations: fibrinogen at 0.73, 1.45, or 2.9 mg/mL, and thrombin at 0.1, 0.2, or 1.0 U/mL. Before initiating clotting with the activation mixture, human tPA (Sigma-Aldrich, 70 ng/mL, final concentration), was added to the fibrinogen solution. Lysis time was defined as the time interval between 50% maximum absorbance in clot formation and clot dissolution, as prescribed in Pieters et al. [56].
The same procedure was followed for purified fibrinogen samples, adding 10 ng/mL tPA and 2 µM human plasminogen (Enzyme Research Laboratories, Cat# HPg 2001) to the reactions; experimental details are provided in supplement S2.
2.8. Plasmin Activity Assay
To verify that the 70 ng/mL tPA concentration generated the same level of plasmin under all plasma experimental conditions, a plasmin generation assay was performed. Experimental details and results are provided in supplement S3.
2.9. Statistical Analysis
All statistical analyses were conducted in R version 4.5.1 (open source) using the base “stats” package. The relationship between each response variable and the two experimental factors (fibrinogen and thrombin concentrations) was modeled using a power-function of the form Y = k([Fgn]α× [Thr]β) where Y represents either fiber density or bubble diameter, and k, α, and β are model parameters. Parameters were estimated by non-linear least squares, minimizing the sum of squared differences between the observed and predicted responses. Standard errors were obtained from the covariance matrix of the fitted model. Two-sided t-tests were used to assess whether each parameter estimate differed significantly from zero, and corresponding p-values were reported. The units used in the fitting routines were mg/mL for [Fgn] and U/mL for [Thr].
3. Results
3.1. Clot Structure as a Function of Fibrinogen and Thrombin Concentrations
Confocal microscopy was used to visualize how the fibrin network structure changes with varying fibrinogen and thrombin concentrations. Fibrinogen concentration was adjusted by diluting platelet-poor plasma, and exogenous thrombin was added to these diluted plasmas. Maximum-intensity projection confocal images taken of plasma clots, in which fibrinogen and added thrombin concentration were varied in a 4×4 matrix from [Fgn] = 0.36, 0.73, 1.45, 2.9 mg/mL and [Thr] = 0.05, 0.1, 0.2, 1.0 U/mL, are shown in Figure 3. Confocal images of clots formed from purified PEAK 1 fibrinogen at [Fgn] = 0.36, 0.73, and 1.45 mg/mL and [Thr] = 0.05, 0.1, and 0.2 U/mL are shown in Figure 4. Fibrinogen concentration increases along the x-axis, while added thrombin concentration increases along the y-axis. In these images, overall fluorescence intensity scales with fibrinogen concentration, and it also depends on imaging parameters, such as gain. The images show a progressive increase in fiber density and a decrease in pore size as both fibrinogen and added thrombin concentrations rise. At lower concentrations, the fibrin network appears sparse, whereas higher concentrations result in dense, highly interconnected networks.
To quantitatively assess the effect of fibrinogen and added thrombin concentrations on the structure of the fibrin network, we analyzed bubble diameter and fiber density. Plots of these quantities versus concentration reveal a non-linear relationship (Figure 5 and Figure 6). To further quantify these non-linear relationships, we fit a power-law model to these data (Table 1 and Table 2). We selected a power law as an empirical fitting equation since it is a simple and versatile mathematical equation with a minimal number of fitting parameters. A power law equation for fibrin structural parameters was derived in our lab by Cai et al. [26]. The results show a clear trend of increasing fiber density with higher fibrinogen and added thrombin concentrations, indicating a denser fibrin network. In contrast, the bubble diameter decreased as the concentrations increased, reflecting the formation of smaller pores within the denser network structure.
For fiber density, all three parameters were highly statistically significant (p < 0.001), indicating that both fibrinogen and added thrombin concentrations are positively associated with network structure. The positive exponents imply that fiber density increases with increasing concentrations of both components. For bubble diameter, all parameters were again highly significant (p < 0.001). The negative exponents indicate an inverse relationship, demonstrating that increasing fibrinogen or added thrombin concentrations leads to smaller bubble diameters.
3.2. Clots Lysis Time
Plasma clots were formed at various concentrations of fibrinogen (via plasma dilution) and added thrombin in the presence of 70 ng/mL tPA. Similarly, clots formed from purified PEAK 1 fibrinogen at varying fibrinogen and thrombin concentrations were prepared in the presence of 10 ng/mL tPA and 2 μM human plasminogen. In both cases, clot formation and subsequent internal lysis were monitored by absorbance measurements [21,33,56]. In these measurements, absorbance is dominated by light scattering, which depends mainly on fibrinogen concentration, [Fgn], fiber length/mass ratio, μ, and fiber diameter, D [21]. As fibers form, μ and D increase, resulting in increasing absorbance; as the clot is lysed and fibers are dissolved, the absorbance decreases back to baseline. For both plasma and PEAK 1 fibrinogen samples, clot formation was examined in the absence and presence of tPA (Supplement S2). At this concentration, tPA is rate-limiting, implying that the same amount of plasmin was generate[21,33,56d in all reactions. For plasma samples, plasmin activity was confirmed to be similar across all reactions using a plasmin activity assay (Supplement S3). Subsequently, internal CLT was analyzed as a function of fibrinogen and added thrombin concentrations for both plasma and PEAK 1 samples (Figure 7). For plasma samples, CLT was also analyzed in relation to structural characteristics of the clots, including bubble diameter, fiber density, and fiber diameter (Figure 8). The results show that internal lysis time strongly depends on fibrinogen concentration, regardless of added thrombin concentration (Figure 7). In contrast, clot lysis time has near-negligible dependence on added thrombin concentration for a given, fixed fibrinogen concentration. These results imply that thrombin-induced kinetics and clot structure have a near-negligible direct effect on internal clot lysis time. Fitting an empirical power law model of the form k([Fgn]α × [Thr]β) to these data yields CLT = 1.4∙103∙([Fgn]1.54 × [Thr]−0.07) for plasma, and 1.2∙103∙([Fgn]0.82 × [Thr]0.005) for PEAK 1 fibrinogen, with CLT in seconds.
Although these results indicate that fibrinogen concentration is the fundamental underlying determinant of internal plasma clot lysis time, it is instructive to also plot lysis time as a function of fibrinogen- and added thrombin-induced structural features (Figure 8). These plots show that clot lysis apparently varies as a function of structural features, namely bubble diameter, fiber density and fiber diameter. However, there is no clear trend. For example, for the same structural feature, e.g., a bubble diameter of about 6.8 μm, or a fiber diameter of 100 nm, the lysis time can vary by a factor of 9, ranging from 1000 s to 9000 s, (Figure 8A, F). Moreover, the same lysis time can be observed for clots with different structural features. Thus, structure by itself is an insufficient, and uncorrelated predictor of internal clot lysis time.
4. Discussion
The main goal of our work was to determine if internal clot lysis time directly depends on the structure of the fibrin network, in a diluted plasma system and a purified fibrinogen system (to avoid effects by coagulation factors in plasma). This main goal was divided into two sub aims: 1) Determine and quantify the network structure as a function of fibrinogen and added thrombin. 2) Determine internal clot lysis time as a function of fibrinogen, added thrombin and the resulting network structure as determined in the first sub aim.
Our main findings were:
- 1)
- Quantitative analysis and model for network structural features. We found empirical, non-linear power-law equations that quantitatively describe network structural features as a function of fibrinogen and added thrombin concentrations, as also described in [26]. In general, increasing added thrombin results in more and thinner fibers, whereas increasing fibrinogen results in more and thicker fibers. This general trend is in line with previous studies [14,20]. However, here we also cast these relationships in equation form. These equations can be used as the baseline for future studies, in which additional variables, such as clotting factors, molecules that bind to fibrin or clot components, or flow, are added, and their effects on clot structure can be determined. The equations are also useful for modeling work, as comparing modeling and experimental results requires quantifiable outcomes.
- 2)
- Lysis. The main outcome of the internal lysis experiments was that internal lysis time depends strongly (as power +1.5 in plasma, 0.82 in PEAK 1 fibrinogen) on fibrinogen concentration, and it does not, or only very weakly (as power -0.07 in plasma, 0.005 in PEAK 1 fibrinogen), depend on added thrombin concentration. Because thrombin proteolytically modifies fibrinogen, this implies that internal clot lysis time does not depend on the thrombin-induced kinetics of formation (in the two systems we tested). Moreover, this also implies that internal clot lysis time does not depend on thrombin-induced structure. It only depends on fibrinogen-induced structure, which is not a truly independent variable, as it depends on the independent variable, fibrinogen concentration.
CLT dependence on fibrinogen and not added thrombin. Kim et al. [34] showed a linear relationship between internal clot lysis time and fibrinogen concentration, which is in reasonably good agreement with our observed dependence of CLT on fibrinogen. In our experiments, we observed an approximately linear dependence of CLT on fibrinogen in both the purified fibrinogen system and the dilutional plasma system. Kim et al. derived this relationship from fundamental kinetic principles and validated it experimentally using a purified fibrinogen system and diluted plasma supplemented with fibrinogen, which differs from our dilutional plasma system (Kim et al. fibrinogen varied, other plasma factors were constant [34]; our work, fibrinogen and other plasma factors were equally diluted). Overall, both Kim’s work and our results support an approximately linear dependence of CLT on fibrinogen concentration.
Some previous work suggested that internal clot lysis time depends on fibrin network structure. This may be a pseudo-dependence as our work indicates that network structure is not a truly independent variable of internal clot lysis time. Network structure depends on fibrinogen and thrombin concentration (and likely other variables). However, only fibrinogen concentration is an independent variable of internal clot lysis time, but not thrombin, and thrombin-induced network structure. Below, we discuss some of the previous work in this context.
Turbidimetry studies on a purified fibrinogen system [35,36] investigating internal and external lysis rates suggested that denser clots composed of thinner fibers have a slower internal lysis rate. However, the data on internal lysis used very limited experimental conditions, and a closer inspection and normalization of the data on internal lysis time reveals that the lysis rate is the same for clots with thinner and thicker fibers, at a given fibrinogen concentration.
At times, internal and external lysis time may have been used interchangeably in the literature; however, they need to be clearly distinguished. There is good evidence that clot structure directly influences external lysis, in which tPA is applied to the surface of a clot [38,39,57,58,59]. In this case, tPA needs to diffuse into the clot. A denser clot might impede this diffusional motion, and, therefore, result in increased external lysis time. For internal lysis, however, tPA is already incorporated into the fibers of a clot and does not need to diffuse into the clot. Therefore, diffusional impediment of tPA motion due to clot structure should not play a role in internal lysis time. However, the internal structure of individual fibrin fibers may affect tPA diffusion and thereby influence fibrinolysis.
In case-control studies [39], associations between thrombotic disease, altered clot structure and increased clot lysis time were found. Some of these studies looked at external lysis and, thus, cannot be compared to internal lysis. For internal lysis studies, increased clot lysis time did often, but not consistently, have an association with denser clots consisting of thinner fibers, as some studies showed an association with denser clots consisting of thicker fibers. While case control studies can establish associations, they have some limitations. In many diseases or conditions, numerous variables are altered, and it is, thus, difficult to isolate a particular variable. Moreover, while associations between observables can be made, definite causation cannot be established. Thus, case-control studies are not inconsistent with our findings.
Our finding that internal clot lysis time depends on fibrinogen concentration aligns with the work by Risman et al. [37] investigating internal lysis of plasma clots using turbidity, confocal microscopy and modeling. Increasing fibrinogen concentration at a constant tPA concentration resulted in increased lysis time, consistent with our findings, whereas maintaining a constant [Fgn]/[tPA] ratio resulted in nearly constant lysis time. Thrombin concentration was not varied in this work; thus, the effect of thrombin-induced structural changes was not investigated.
Power law equations for network structural features. For the structural characterization of clots, we focused on fiber density and bubble diameter (pore size) and also used fiber diameter measurements from the same samples from [26]. The error due to limitations in measurement precision are estimated to be around 10%.
We selected empirical power laws of the form k([Fgn]α × [Thr]β) for the following reasons. These equations are more versatile than linear relationships, and the exponents can be negative or positive, which allows for increasing or decreasing dependencies. This versatility can be accomplished with few modeling parameters. We also tried exponential fits, but the fits were less accurate. In addition, a derivation of the power law is given in Cai et al. showing that an approximate multiplicative power-law form can arise from a coarse-grained kinetic framework involving thrombin-mediated fibrinogen activation, substrate depletion, and finite-window fiber growth [26]. Although this derivation is not a complete mechanistic model of fibrin assembly, it provides a rationale for why separable power-law-like dependencies can emerge for network structural features over the finite experimental range studied here.
Selection of fibrinogen and added thrombin concentrations. We selected fibrinogen concentrations (0.36 mg/mL to 2.9 mg/mL) that are physiologically relevant. Below 0.36 mg/mL it was difficult to form stable clots, and our upper limit was set by the maximum fibrinogen concentration of the pooled normal plasma. Added thrombin concentrations were in the range of 0.05 to 1.0 U/mL (0.5 to 10 nM). Physiologically, thrombin concentration is highly dynamic depending on spatial and temporal coagulation status during thrombin generation [24]. Before activation (coagulation initiation), available thrombin is near zero (sub-pM). During coagulation, thrombin concentration can range from 1 nM to 500 nM [24,25]. We were unable to use concentrations higher than 10 nM because clotting was too rapid so that clots formed in the pipette.
Rate-limiting tPA and plasmin Activity. A tPA concentration of 70 ng/mL was selected for the plasma samples for several reasons. This concentration is reasonably close to physiological levels (3–10 ng/mL), while remaining sufficiently low for tPA-mediated plasminogen activation to be rate-limiting for fibrinolysis [34]. It was also low enough to permit proper clot formation, as indicated by the development of a plateau phase in the absorbance curves (Supplement S2), yet sufficiently high to ensure complete lysis of all samples within a practical experimental time (≲4 h), before appreciable sample evaporation occurred.
To verify that tPA remained rate-limiting across experimental conditions, plasmin activity was measured using a colorimetric plasmin substrate (Supplement S3). Plasmin activity remained essentially constant across conditions, indicating comparable plasmin generation despite variations in fibrinogen and thrombin concentrations. Thus, differences in clot lysis time were not attributable to differences in plasmin generation.
The experimental system therefore provided controlled conditions for examining the effects of fibrinogen and added thrombin on fibrin formation and internal fibrinolysis within a plasma background. As an additional validation, results from the dilutional plasma system were compared with those obtained using a purified fibrinogen system. The two systems produced consistent trends: fibrin network structure followed similar power-law relationships [26], and clot lysis time depended strongly on fibrinogen concentration while showing little or no dependence on thrombin concentration (Figure 7).
Added AF488 fibrinogen, network formation and structure. Previous work showed that fluorescently labeled fibrinogen (AF546) can affect fibrin network formation [18]. Optimally, the fluorophore concentration is used that is low enough to interfere minimally with fiber formation, but high enough to render fibers visible, and label fibers evenly. Since fiber density and fiber diameter both depend on fibrinogen and thrombin concentration, creating a network with fibers that all have equal fluorophore density is impossible in practice. Our approach was to keep the numbers of fluorophores per fiber approximately constant by keeping the percentage of fluorescently labeled fibrinogen constant. We used 6.5% AF488 fibrinogen in all reactions because this amount was sufficiently high to give good visibility of the fibers in all samples, but it was low enough to not interfere with fibrin network formation. We tested higher amounts of AF488 fibrinogen, and it resulted in aggregates and artefacts like star-like shapes. In addition, we performed turbidity experiments with different amounts of fluorescently labeled fibrinogen (0%, 1.5%, 3%, 6%, 12%) and showed that maximum absorbance and clot formation rate were minimally affected by 0% - 6% AF488 fibrinogen. More significant differences in maximum absorbance were observed at 12% AF488 fibrinogen (Supplement S4). Therefore, adding 6.5% AF488 fibrinogen is a good compromise between having bright, evenly labeled fibers while, at the same time, not affecting network formation and structure.
Dilutional Plasma System. We selected a system in which we adjusted the fibrinogen concentration by diluting plasma. This implies that all coagulation factors also get diluted. While this system has this limiting feature, it also has physiological relevance, and key results were corroborated in the purified fibrinogen system. Diluting plasma implies that all plasma components, including clotting factors and inhibitors, were diluted alongside fibrinogen (to achieve the desired fibrinogen concentrations). Diluting plasma, as was done in the current work, mimics dilutional coagulopathy, in which blood is diluted with fluid, which may occur during significant blood loss and other situations [22,23]. The diluted plasma system keeps the ratio of fibrinogen to clotting factors constant.
Another option to adjust fibrinogen concentration in a plasma background could have been to dilute plasma and then add exogenous fibrinogen and thrombin [34] to the desired concentration. However, in this case, all cofactors and inhibitors are diluted with respect to the given fibrinogen concentration, which puts fibrinogen and clotting factors and inhibitors at an imbalance. A third option could have been to use fibrinogen-free plasma and then add exogenous fibrinogen and thrombin. The latter option could be a good choice to mimic conditions with low fibrinogen concentrations, which can occur genetically or in case of massive clotting in the body.
In both the dilutional plasma and purified fibrinogen systems, CLT was primarily determined by fibrinogen concentration, whereas thrombin concentration had a negligible effect. The consistency between these two systems indicates that the observed dependence of CLT on fibrinogen is not primarily influenced by the presence of other plasma coagulation factors. Although the dilutional plasma system provides a more physiologically relevant environment, interpretation of the results can be complicated by the presence of multiple coagulation factors. Therefore, the purified fibrinogen system, containing only fibrinogen and thrombin with controlled concentrations, provides a simplified model to isolate the specific contributions of these two components. The key findings obtained in the dilutional plasma system were reproduced in the purified fibrinogen system.
Limitations regarding thrombin concentration in plasma samples. A potential caveat of working with plasma and adding small amounts of thrombin is that the addition of exogenous thrombin may trigger delayed, further endogenous thrombin generation, resulting in uncertainty of the ultimate total thrombin concentration within the system. At very low added thrombin concentrations (≤ 0.04 U/mL), additional thrombin may be generated through a factor XI (FXI)-dependent pathway. At higher thrombin concentrations (≥ 0.8 U/mL), this pathway is effectively bypassed [25]. In our work, however, there is evidence that the added thrombin is the dominant contributor to the thrombin-dependent structural effects. First, we determined thrombin activity using a colorimetric thrombin activity assay (Supplement S1). The results show thrombin activity increases with added thrombin (0.1 U/mL and 1 U/mL) at three different fibrinogen concentrations (0.7, 1.4, 2.5 mg/mL). These thrombin activities are also higher than plasma plus activation mix (no thrombin baseline), which is higher than plasma without activation mix (no thrombin, no re-calcification). Second, the confocal images show that added thrombin has a dose-dependent effect on structure. The added thrombin, therefore, appears to be dominant over the possibly subsequently generated thrombin. Third, in the purified fibrinogen system, in which fibrinogen and thrombin are constant and exactly known, thrombin shows a similar effect on network structure and on clot lysis time. The key findings in the dilutional plasma system and the purified plasma system are consistent. Therefore, while we cannot be certain of the ultimate total thrombin concentration in the dilutional plasma system, these lines of evidence suggest that the added thrombin is dominant and has a dose-dependent effect on structure. The thrombin term in the equations should, therefore strictly be considered ‘added thrombin’ (and not total thrombin). The key result is that added thrombin has an effect on structure but has a negligible effect on lysis.
5. Conclusions
We investigated plasma clot fibrin network structure as a function of fibrinogen and added exogenous thrombin concentrations. Using confocal microscopy, we quantified fiber density and pore size, revealing that increasing concentrations of both fibrinogen and thrombin led to denser networks and smaller pores. A power-law relationship of the form k([Fgn]α × [Thr]β) fit the data well. Fibrinolysis results demonstrated that the rate of internal lysis is primarily determined by fibrinogen concentration, rather than thrombin. Although internal clot lysis time ostensibly depends on clot structure, within the thrombin concentration we tested (1-10 nM), further evaluation indicated that fibrinogen is the primary determinant governing clot lysis time, independent of thrombin-mediated structural variations and formation kinetics.
Future work will extend these findings to patient-derived plasma samples and modified experimental conditions, to improve our understanding of fibrin fiber mechanics and contribute to advances in the diagnosis and treatment of thrombosis- and hemostasis-related disorders.
Supplementary Materials
The following supporting information can be downloaded at the website of this paper posted on Preprints.org
Author Contributions
AN, ADS, CC, ZZ, SRB, KB, NEH, BEB, MG designed the research, performed experiments, and analyzed the data; AN, ZZ, MG wrote the manuscript. All authors read and approved the final manuscript.
Funding
This research was funded by National Institutes of Health, grant number 2R15HL148842-02A1.
Institutional Review Board Statement
Not applicable.
Informed Consent Statement
Not applicable.
Data Availability Statement
The original contributions presented in this study are included in the article/supplementary material. Further inquiries can be directed to the corresponding author(s).
Acknowledgments
This work was supported by National Institutes of Health grants 2R15HL148842-02. The content is solely the responsibility of the authors and does not necessarily represent the official views of the National Institutes of Health. We are grateful to Glen Marrs for his assistance with confocal imaging, and to Daniel Kim-Shaprio for assistance with the absorbance measurements, and to Saeed Movahedi for his assistance with the statistical analysis.
Conflicts of Interest
The authors declare no conflicts of interest.
References
- Mosesson, M.W. Fibrinogen and fibrin structure and functions. J. Thromb. Haemost. 2005, 3(8), 1894–1904. [Google Scholar] [CrossRef]
- Litvinov, R.I.; Gorkun, O.V.; Owen, S.F.; Shuman, H.; Weisel, J.W. Polymerization of fibrin: specificity, strength, and stability of knob-hole interactions studied at the single-molecule level. Blood 2005, 106(9), 2944–2951. [Google Scholar] [CrossRef]
- Rocco, M.; Molteni, M.; Ponassi, M.; Giachi, G.; Frediani, M.; Koutsioubas, A.; Profumo, A.; Trevarin, D.; Cardinali, B.; Vachette, P.; Ferri, F.; Perez, J. A Comprehensive Mechanism of Fibrin Network Formation Involving Early Branching and Delayed Single- to Double-Strand Transition from Coupled Time-Resolved X-ray/Light-Scattering Detection. J. Am. Chem. Soc. 2014, 136(14), 5376–5384. [Google Scholar] [CrossRef]
- Chernysh, I.N.; Nagaswami, C.; Weisel, J.W. Visualization and identification of the structures formed during early stages of fibrin polymerization. Blood 2011, 117(17), 4609–4614. [Google Scholar] [CrossRef]
- Weisel, J.W.; Litvinov, R.I. Mechanisms of fibrin polymerization and clinical implications. Blood 2013, 121(10), 1712–1719. [Google Scholar] [CrossRef]
- Houser, J.R.; Hudson, N.E.; Ping, L.; O’Brien, E.T., Iii; Superfine, R.; Lord, S.T.; Falvo, M.R. Evidence that [alpha]C Region Is Origin of Low Modulus, High Extensibility, and Strain Stiffening in Fibrin Fibers. Biophys. J. 2010, 99(9), 3038–3047. [Google Scholar] [CrossRef]
- Collet, J.P.; Moen, J.L.; Veklich, Y.I.; Gorkun, O.V.; Lord, S.T.; Montalescot, G.; Weisel, J.W. The alpha C domains of fibrinogen affect the structure of the fibrin clot, its physical properties, and its susceptibility to fibrinolysis. Blood 2005, 106(12), 3824–3830. [Google Scholar] [CrossRef]
- Duval, C.; Allan, P.; Connell, S.D.A.; Ridger, V.C.; Philippou, H.; Ariens, R.A.S. Roles of fibrin alpha- and gamma-chain specific cross-linking by FXIIIa in fibrin structure and function. Thromb. Haemost. 2014, 111(5), 842–850. [Google Scholar] [CrossRef]
- L. Lorand, Factor XIII: Structure, Activation, and Interactions with Fibrinogen and Fibrin. Ann. NY Acad. Sci. 2001, 936(1), 291–311. [CrossRef]
- Liu, W.; Carlisle, C.R.; Sparks, E.A.; Guthold, M. The mechanical properties of single fibrin fibers. J. Thromb. Haemost. 2010, 8(5), 1030–6. [Google Scholar] [CrossRef]
- Helms, C.C.; Ariens, R.A.S.; de Willige, S.U.; Standeven, K.F.; Guthold, M. alpha-alpha Cross-Links Increase Fibrin Fiber Elasticity and Stiffness. Biophys. J. 2012, 102(1), 168–175. [Google Scholar] [CrossRef]
- Duval, C.; Profumo, A.; Aprile, A.; Salis, A.; Millo, E.; Damonte, G.; Sandrin-Gauer, J.; Ariëns, R.A.S.; Rocco, M. Fibrinogen αC-regions are not directly involved in fibrin polymerization as evidenced by a “Double-Detroit” recombinant fibrinogen mutant and knobs-mimic peptides. J. Thromb. Haemost. 2020, 18(4), 802–814. [Google Scholar] [CrossRef]
- Pieters, M.; Wolberg, A.S. Fibrinogen and fibrin: An illustrated review. Res. Pract. Thromb. Haemost. 2019, 3(2), 161–172. [Google Scholar] [CrossRef]
- Risman, R.A.; Belcher, H.A.; Ramanujam, R.K.; Weisel, J.W.; Hudson, N.E.; Tutwiler, V. Comprehensive Analysis of the Role of Fibrinogen and Thrombin in Clot Formation and Structure for Plasma and Purified Fibrinogen. Biomolecules 2024, 14(2). [Google Scholar] [CrossRef]
- Li, W.; Lucioni, T.; Li, R.Z.; Bonin, K.; Cho, S.S.; Guthold, M. Stretching single fibrin fibers hampers their lysis. Acta Biomater. 2017, 60, 264–274. [Google Scholar] [CrossRef]
- Kollman, J.M.; Pandi, L.; Sawaya, M.R.; Riley, M.; Doolittle, R.F. Crystal Structure of Human Fibrinogen. Biochemistry 2009, 48(18), 3877–3886. [Google Scholar] [CrossRef]
- Tsurupa, G.; Pechik, I.; Litvinov, R.I.; Hantgan, R.R.; Tjandra, N.; Weisel, J.W.; Medved, L. On the Mechanism of alpha C Polymer Formation in Fibrin. Biochemistry 2012, 51(12), 2526–2538. [Google Scholar] [CrossRef]
- Li, W.; Sigley, J.; Baker, S.R.; Helms, C.C.; Kinney, M.T.; Pieters, M.; Brubaker, P.H.; Cubcciotti, R.; Guthold, M. Nonuniform Internal Structure of Fibrin Fibers: Protein Density and Bond Density Strongly Decrease with Increasing Diameter; Biomed Research International, 2017. [Google Scholar]
- Risman, R.A.; Sen, M.; Tutwiler, V.; Hudson, N.E. Deconstructing fibrin(ogen) structure. J. Thromb. Haemost. 2025, 23(2), 368–380. [Google Scholar] [CrossRef]
- Belcher, H.A.; Guthold, M.; Hudson, N.E. What is the diameter of a fibrin fiber? Res. Pract. Thromb. Haemost. 2023, 7(5). [Google Scholar] [CrossRef]
- Belcher, H.A.; Litwa, K.; Guthold, M.; Hudson, N.E. The Applicability of Current Turbidimetric Approaches for Analyzing Fibrin Fibers and Other Filamentous Networks. Biomolecules 2022, 12(6). [Google Scholar] [CrossRef]
- Levy, J.H.; Welsby, I.; Goodnough, L.T. Fibrinogen as a therapeutic target for bleeding: a review of critical levels and replacement therapy. Transfusion 2014, 54(5), 1389–1405. [Google Scholar] [CrossRef]
- Spinella, P.C.; Holcomb, J.B. Resuscitation and transfusion principles for traumatic hemorrhagic shock. Blood Rev. 2009, 23(6), 231–240. [Google Scholar] [CrossRef]
- Wolberg, A.S. Thrombin generation and fibrin clot structure. Blood Rev. 2007, 21(3), 131–142. [Google Scholar] [CrossRef]
- He, S.; Cao, H.L.; Thålin, C.; Svensson, J.; Blombäck, M.; Wallén, H. The Clotting Trigger Is an Important Determinant for the Coagulation Pathway In Vivo or In Vitro-Inference from Data Review. Semin. Thromb. Hemost. 2021, 47(01), 63–73. [Google Scholar] [CrossRef]
- Cai, C.; Zhang, Z.; Nameny, A.; Bonin, K.; Bannish, B.E.; Hudson, N.E.; Marrs, G.; S. Baker, R.; Guthold, M. Nonlinear relationships of Fibrin Network Structure as a Function of Fibrinogen and Thrombin Concentration for Purified Fibrinogen and Plasma Clots. Acta Biomater. 2026, 219, 236–248. [Google Scholar] [CrossRef]
- Risman, R.A.; Kirby, N.C.; Bannish, B.E.; Hudson, N.E.; Tutwiler, V. Fibrinolysis: an illustrated review. Res. Pract. Thromb. Haemost. 2023, 7(2). [Google Scholar] [CrossRef]
- Chapin, J.C.; Hajjar, K.A. Fibrinolysis and the control of blood coagulation. Blood Rev. 2015, 29(1), 17–24. [Google Scholar] [CrossRef]
- Collet, J.P.; Lesty, C.; Montalescot, G.; Weisel, J.W. Dynamic changes of fibrin architecture during fibrin formation and intrinsic fibrinolysis of fibrin-rich clots. J. Biol. Chem. 2003, 278(24), 21331–21335. [Google Scholar] [CrossRef]
- Hudson, N.E. Biophysical Mechanisms Mediating Fibrin Fiber Lysis. BioMed Res. Int. 2017, 2748340. [Google Scholar] [CrossRef]
- Longstaff, C.; Thelwell, C.; Williams, S.C.; Silva, M.; Szabó, L.; Kolev, K. The interplay between tissue plasminogen activator domains and fibrin structures in the regulation of fibrinolysis: kinetic and microscopic studies. Blood 2011, 117(2), 661–668. [Google Scholar] [CrossRef]
- Longstaff, C.; Kolev, K. Basic mechanisms and regulation of fibrinolysis. J. Thromb. Haemost. 2015, 13, S98–S105. [Google Scholar] [CrossRef]
- Zheng, Z.; Mukhametova, L.; Boffa, M.B.; Moore, E.E.; Wolberg, A.S.; Urano, T.; Kim, P.Y. Assays to quantify fibrinolysis: strengths and limitations. Communication from the International Society on Thrombosis and Haemostasis Scientific and Standardization Committee on fibrinolysis, J. Thromb. Haemost. 2023, 21(4), 1043–1054. [Google Scholar] [CrossRef]
- Kim, P.Y.; Stewart, R.J.; Lipson, S.M.; Nesheim, M.E. The relative kinetics of clotting and lysis provide a biochemical rationale for the correlation between elevated fibrinogen and cardiovascular disease. J. Thromb. Haemost. 2007, 5(6), 1250–1256. [Google Scholar] [CrossRef]
- Gabriel, D.A.; Muga, K.; Boothroyd, E.M. The effect of fibrin structure on fibrinolysis. J. Biol. Chem. 1992, 267(34), 24259–24263. [Google Scholar] [CrossRef]
- Carr, M.E., Jr.; Alving, B.M. Effect of fibrin structure on plasmin-mediated dissolution of plasma clots. Blood Coagul. Fibrinolysis 1995, 6(6). [Google Scholar] [CrossRef]
- Risman, R.A.; Paynter, B.; Percoco, V.; Shroff, M.; Bannish, B.E.; Tutwiler, V. Internal fibrinolysis of fibrin clots is driven by pore expansion. Sci. Rep. 2024, 14(1). [Google Scholar] [CrossRef]
- Collet, J.P.; Park, D.; Lesty, C.; Soria, J.; Soria, C.; Montalescot, G.; Weisel, J.W. Influence of fibrin network conformation and fibrin fiber diameter on fibrinolysis speed: dynamic and structural approaches by confocal microscopy. Arterioscler. Thromb. Vasc. Biol. 2000, 20(5), 1354–61. [Google Scholar]
- Undas, R.A.S. Ariens, Fibrin Clot Structure and Function A Role in the Pathophysiology of Arterial and Venous Thromboembolic Diseases. Arterioscler. Thromb. Vasc. Biol. 2011, 31(12), E88–E99. [Google Scholar]
- Siniarski; Baker, S.R.; Duval, C.; Malinowski, K.P.; Gajos, G.; Nessler, J.; Ariens, R.A.S. Quantitative analysis of clot density, fibrin fiber radius, and protofibril packing in acute phase myocardial infarction. Thromb. Res. 2021, 205, 110–119. [Google Scholar] [CrossRef]
- Undas; Slowik, A.; Wolkow, P.; Szczudlik, A.; Tracz, W. Fibrin clot properties in acute ischemic stroke: relation to neurological deficit. Thromb. Res. 2010, 125(4), 357–361. [Google Scholar] [CrossRef]
- Undas; Nowakowski, T.; Ciesla-Dul, M.; Sadowski, J. Abnormal plasma fibrin clot characteristics are associated with worse clinical outcome in patients with peripheral arterial disease and thromboangiitis obliterans. Atherosclerosis 2011, 215(2), 481–486. [Google Scholar] [CrossRef]
- Undas; Podolec, P.; Zawilska, K.; Pieculewicz, M.; Jedlinski, I.; Stepien, E.; Konarska-Kuszewska, E.; Weglarz, P.; Duszynska, M.; Hanschke, E.; Przewlocki, T.; Tracz, W. Altered Fibrin Clot Structure/Function in Patients With Cryptogenic Ischemic Stroke. Stroke 2009, 40(4), 1499–1501. [Google Scholar] [CrossRef]
- Undas; Plicner, D.; Stepien, E.; Drwila, R.; Sadowski, L. Altered fibrin clot structure in patients with advanced coronary artery disease: a role of C-reactive protein, lipoprotein(a) and homocysteine. J. Thromb. Haemost. 2007, 5(9), 1988–1990. [Google Scholar] [CrossRef]
- Undas; Zawilska, K.; Ciesla-Dul, M.; Lehmann-Kopydlowska, A.; Skubiszak, A.; Ciepluch, K.; Tracz, W. Altered fibrin clot structure/function in patients with idiopathic venous thromboembolism and in their relatives. Blood 2009, 114(19), 4272–4278. [Google Scholar] [CrossRef]
- Sjoland, J.A.; Sidelmann, J.J.; Brabrand, M.; Pedersen, R.S.; Pedersen, J.H.; Esbensens, K.; Standeven, K.F.; Ariens, R.A.S.; Gram, J. Fibrin clot structure in patients with end-stage renal disease. Thromb. Haemost. 2007, 98(2), 339–345. [Google Scholar] [CrossRef]
- Collet, J.P.; Allali, Y.; Lesty, C.; Tanguy, M.L.; Silvain, J.; Ankri, A.; Blanchet, B.; Dumaine, R.; Gianetti, J.; Payot, L.; Weisel, J.W.; Montalescot, G. Altered fibrin architecture is associated with hypofibrinolysis and premature coronary atherothrombosis. Arterioscler. Thromb. Vasc. Biol. 2006, 26(11), 2567–2573. [Google Scholar] [CrossRef]
- Bhasin, N.; Ariëns, R.A.S.; West, R.M.; Parry, D.J.; Grant, P.J.; Scott, D.J.A. Altered fibrin clot structure and function in the healthy first-degree relatives of subjects with intermittent claudication. J. Vasc. Surg. 2008, 48(6), 1497–1503. [Google Scholar] [CrossRef]
- Dunn, E.J.; Ariëns, R.A.S.; Grant, P.J. The influence of type 2 diabetes on fibrin structure and function. Diabetologia 2005, 48(6), 1198–1206. [Google Scholar] [CrossRef]
- Dunn, E.J.; Philippou, H.; Ariens, R.A.S.; Grant, P.J. Molecular mechanisms involved in the resistance of fibrin to clot lysis by plasmin in subjects with type 2 diabetes mellitus. Diabetologia 2006, 49(5), 1071–1080. [Google Scholar] [CrossRef]
- Meltzer, M.E.; Lisman, T.; Doggen, C.J.M.; de Groot, P.G.; Rosendaal, F.R. Synergistic effects of hypofibrinolysis and genetic and acquired risk factors on the risk of a first venous thrombosis. PLoS Med. 2008, 5(5), 751–759. [Google Scholar] [CrossRef]
- Guimaraes, A.H.C.; de Bruijne, E.L.E.; Lisman, T.; Dippel, D.W.J.; Deckers, J.W.; Poldermans, D.; Rijken, D.C.; Leebeek, F.W.G. Hypofibrinolysis is a risk factor for arterial thrombosis at young age. Br. J. Haematol. 2009, 145(1), 115–120. [Google Scholar] [CrossRef]
- Molteni, M.; Magatti, D.; Cardinali, B.; Rocco, M.; Ferri, F. Fast Two-Dimensional Bubble Analysis of Biopolymer Filamentous Networks Pore Size from Confocal Microscopy Thin Data Stacks. Biophys. J. 2013, 104(5), 1160–1169. [Google Scholar] [CrossRef]
- Muenster, S.; Fabry, B. A Simplified Implementation of the Bubble Analysis of Biopolymer Network Pores. Biophys. J. 2013, 104(12), 2774–2775. [Google Scholar] [CrossRef]
- Cai; De Lange-Loots, Z.; Baker, S.R.; Litvinov, R.I.; Swanepoel, A.C.; Nagaswami, C.; Weisel, J.W.; Marchi, R.; Casini, A.; Neerman-Arbez, M.; Duval, C.; Ariens, R.A.S.; Risman, R.A.; Tutwiler, V.; Belcher, H.A.; Elangovan, A.; Hudson, N.E.; Undas, A.; Zabczyk, M.; Guthold, M.; Pieters, M. Standardization of scanning electron microscopy analysis of fibrin fiber diameter measurement: communication from the ISTH SSC subcommittee on FXIII and fibrinogen. J. Thromb. Haemost. 2026, 24(1), 318–328. [Google Scholar] [CrossRef]
- Pieters, M.; Undas, A.; Marchi, R.; De Maat, M.P.; Weisel, J.; Ariens, R.A. An international study on the standardization of fibrin clot permeability measurement: methodological considerations and implications for healthy control values. J. Thromb. Haemost. 2012, 10(10), 2179–81. [Google Scholar] [CrossRef]
- Bannish, B.E.; Chernysh, I.N.; Keener, J.P.; Fogelson, A.L.; Weisel, J.W. Molecular and Physical Mechanisms of Fibrinolysis and Thrombolysis from Mathematical Modeling and Experiments. Sci. Rep. 2017, 7. [Google Scholar] [CrossRef]
- Risman, R.A.; Abdelhamid, A.; Weisel, J.W.; Bannish, B.E.; Tutwiler, V. Effects of clot contraction on clot degradation: A mathematical and experimental approach. Biophys. J. 2022, 121(17), 3271–3285. [Google Scholar] [CrossRef]
- Weisel, J.W.; Litvinov, R.I. The biochemical and physical process of fibrinolysis and effects of clot structure and stability on the lysis rate. Cardiovasc Hematol. Agents Med. Chem. 2008, 6(3), 161–80. [Google Scholar] [CrossRef]
Figure 1.
Schematic of fibrin fiber assembly (adapted from [15]). (A) Fibrinogen is composed of two sets of Aα (yellow), Bβ (magenta), and γ (cyan) chains that form a trinodular structure with a central E domain and two outer D domains connected by coiled coils (based on crystal structure [16]). The Aα chains extend into flexible αC regions, which include an unstructured αC-connector and a folded αC-domain (drawn in by hand). Multiple plasmin cleavage sites, indicated by spheres, are located within the coiled coils and αC regions at αLys 81, βLys122, γLys58, and αArg104, βLys133, γLys62. The numerous possible plasmin cleavage sites in the αC-connector are indicated by black dots (lysine), or gray dots (arginine). The blue crosses mark four glutamine residues within the αC-connector that function as donor sites for α-α glutamine–lysine crosslinking. (B) Schematic illustration of two double-stranded protofibrils linked through interactions between αC regions [17]. Mature fibrin fibers (~100 nm diameter) contain approximately 100 protofibrils per cross-section connected by an extensive αC network. Selected plasmin cleavage sites are indicated on the lower protofibril by red triangles. (C) Longitudinal cross-section of a fibrin fiber showing assembled protofibrils organized into a dense inner core and a less dense outer periphery [18]. (D) SEM image of fibrin fiber network formed from human plasma (fibrinogen and thrombin concentration are 0.73 mg/mL and 0.1 U/mL, respectively).
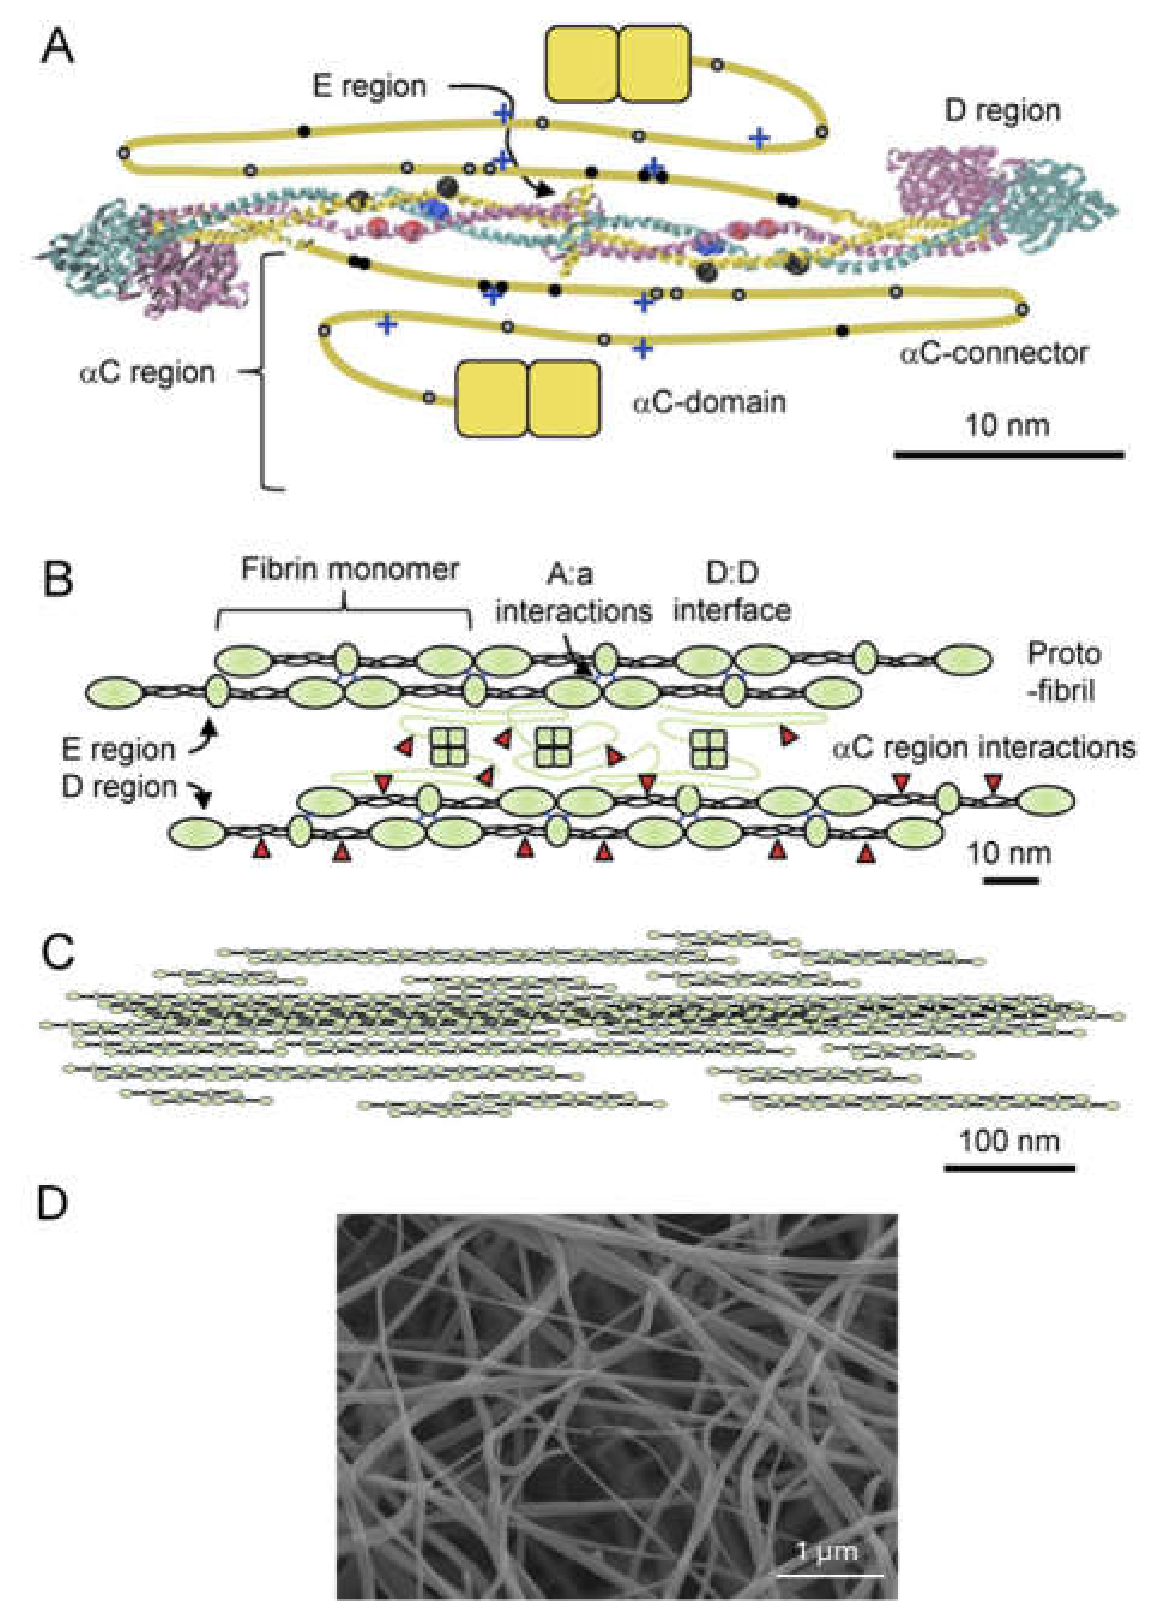
Figure 3.
Matrix of maximum-intensity projection confocal images showing plasma clot structures formed at varying fibrinogen (x-axis) and added thrombin (y-axis) concentrations. Each image represents the fibrin network corresponding to a specific combination of fibrinogen and thrombin levels. Increasing either fibrinogen or added thrombin concentration leads to an increase in fiber density. Scale bar: 50 µm. .
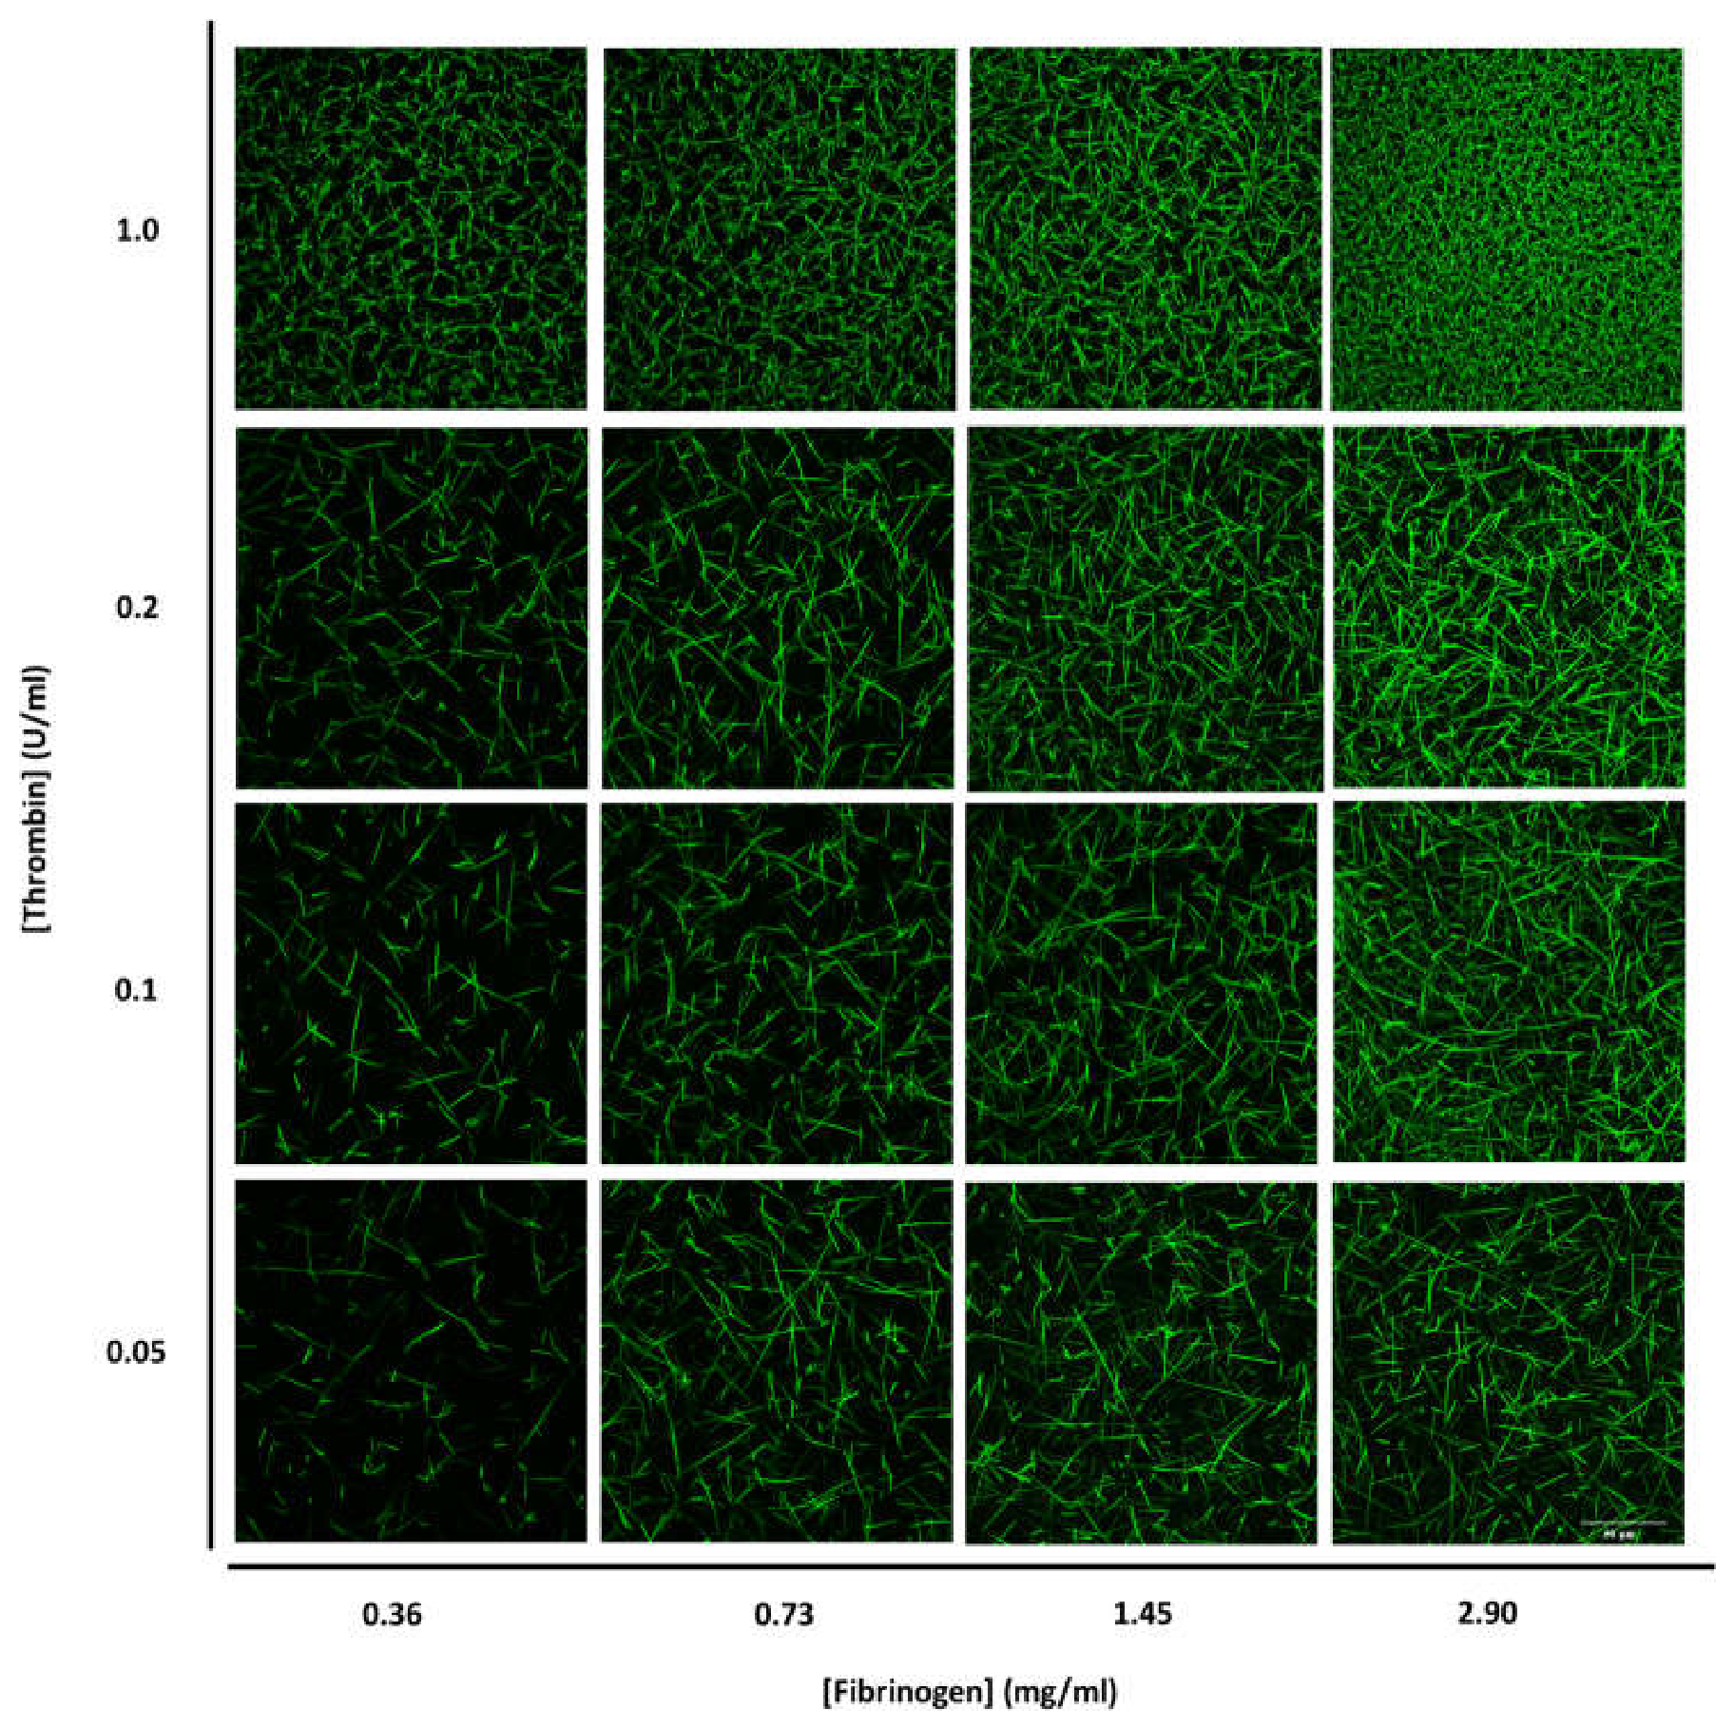
Figure 4.
Matrix of representative confocal images showing purified fibrin network structure across fibrinogen (x-axis) and thrombin (y-axis) concentrations. Each panel corresponds to a specific fibrinogen–thrombin condition. Scale bar: 50 µm. Adapted from [26].
Figure 4.
Matrix of representative confocal images showing purified fibrin network structure across fibrinogen (x-axis) and thrombin (y-axis) concentrations. Each panel corresponds to a specific fibrinogen–thrombin condition. Scale bar: 50 µm. Adapted from [26].
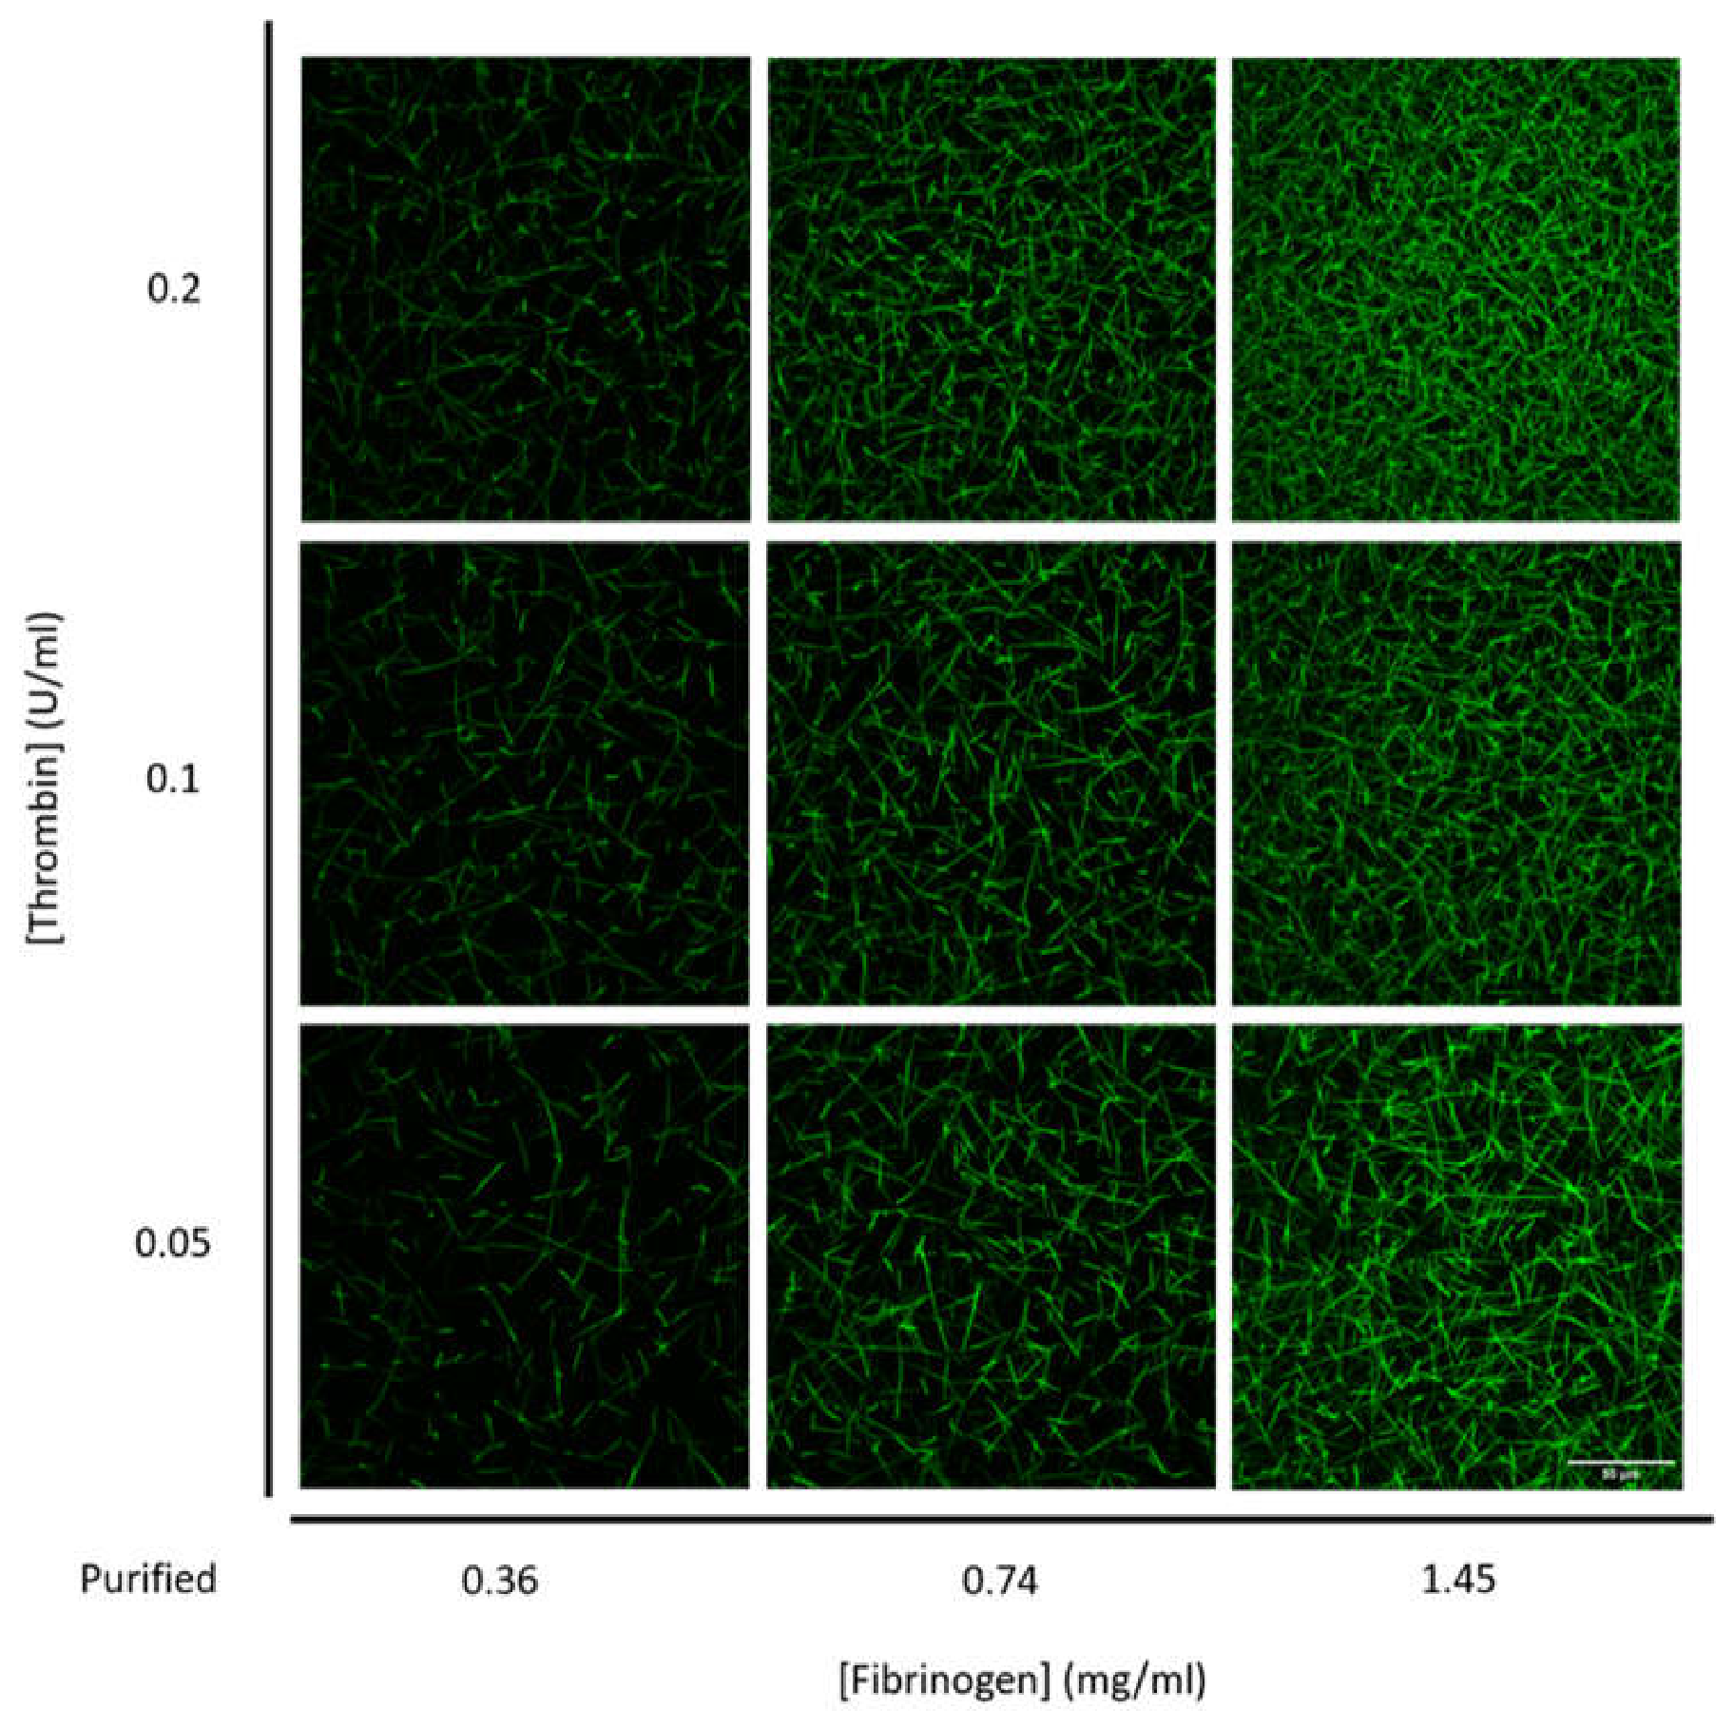
Figure 5.
Plasma quantitative analysis of fibrin network structure as a function of fibrinogen and thrombin concentrations and fits by power-law equations (solid lines). (A) Bubble diameter versus fibrinogen concentrations, (B) bubble diameter versus added thrombin concentrations, (C) fiber density versus fibrinogen concentrations, (D) fiber density versus added thrombin concentrations. Median values and standard deviations are plotted. Box & whisker plots, the distributions, and data statistics are shown in supplement S5.
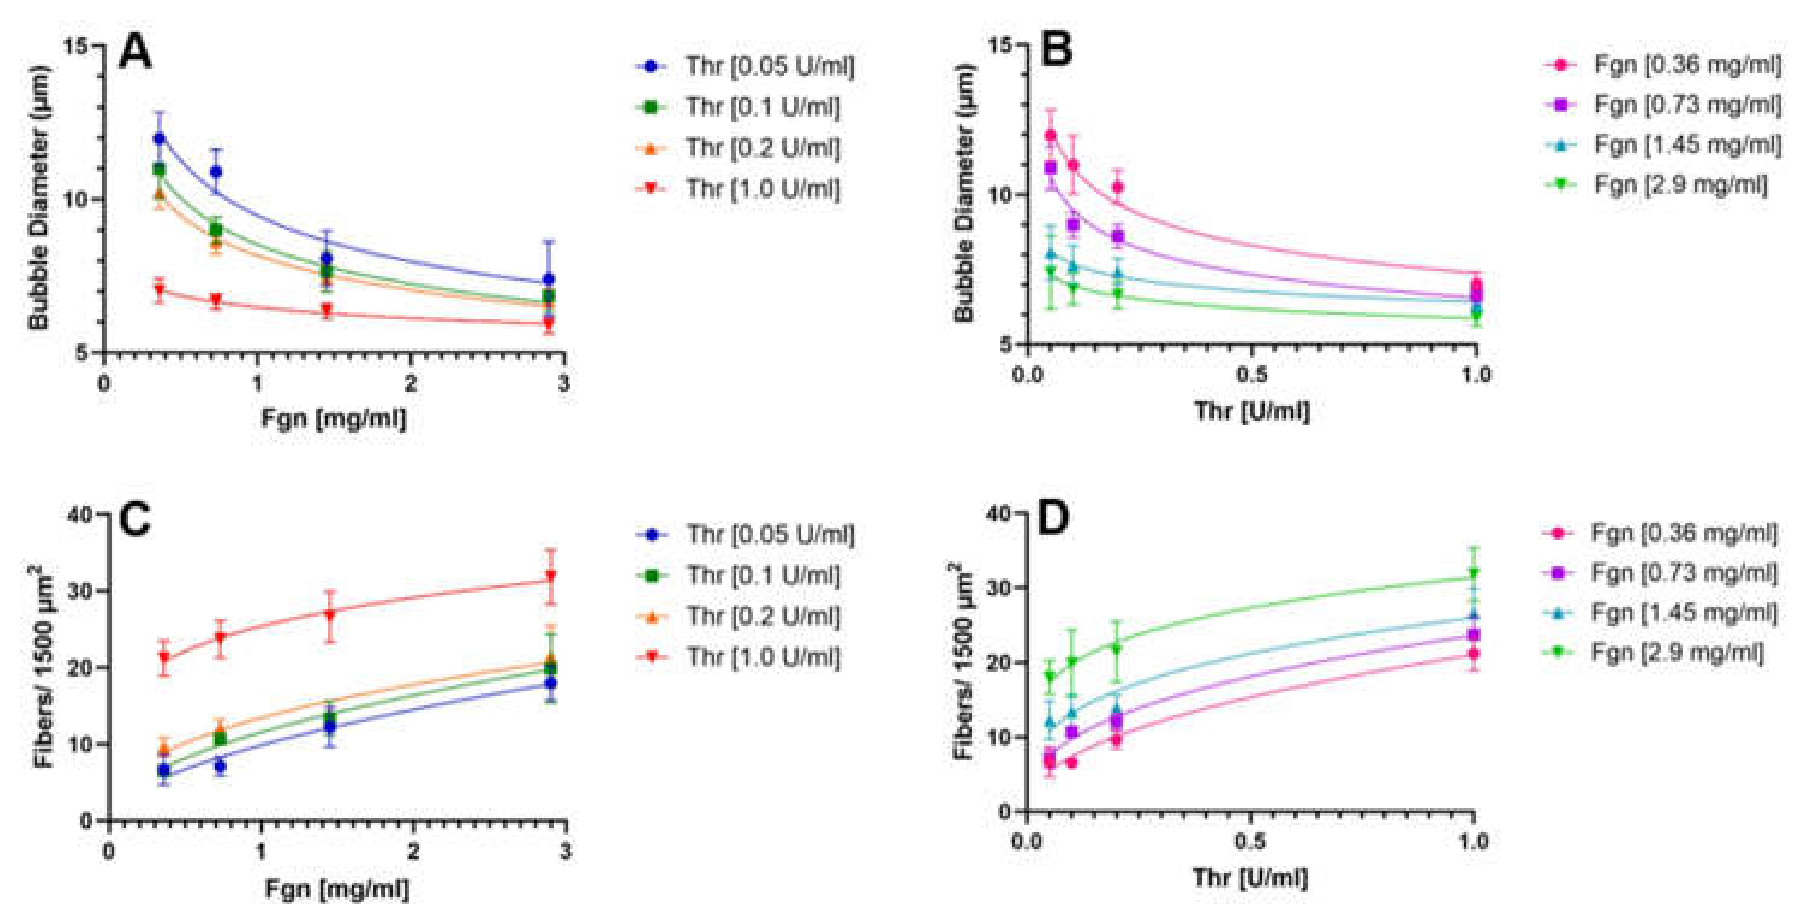
Figure 6.
PEAK 1 fibrinogen quantitative analysis of fibrin network structure as a function of fibrinogen and thrombin concentrations and fits by power-law equations (solid lines). (A) Bubble diameter versus fibrinogen concentrations, (B) bubble diameter versus added thrombin concentrations, (C) fiber density versus fibrinogen concentrations, (D) fiber density versus added thrombin concentrations. Data are adapted from [26].
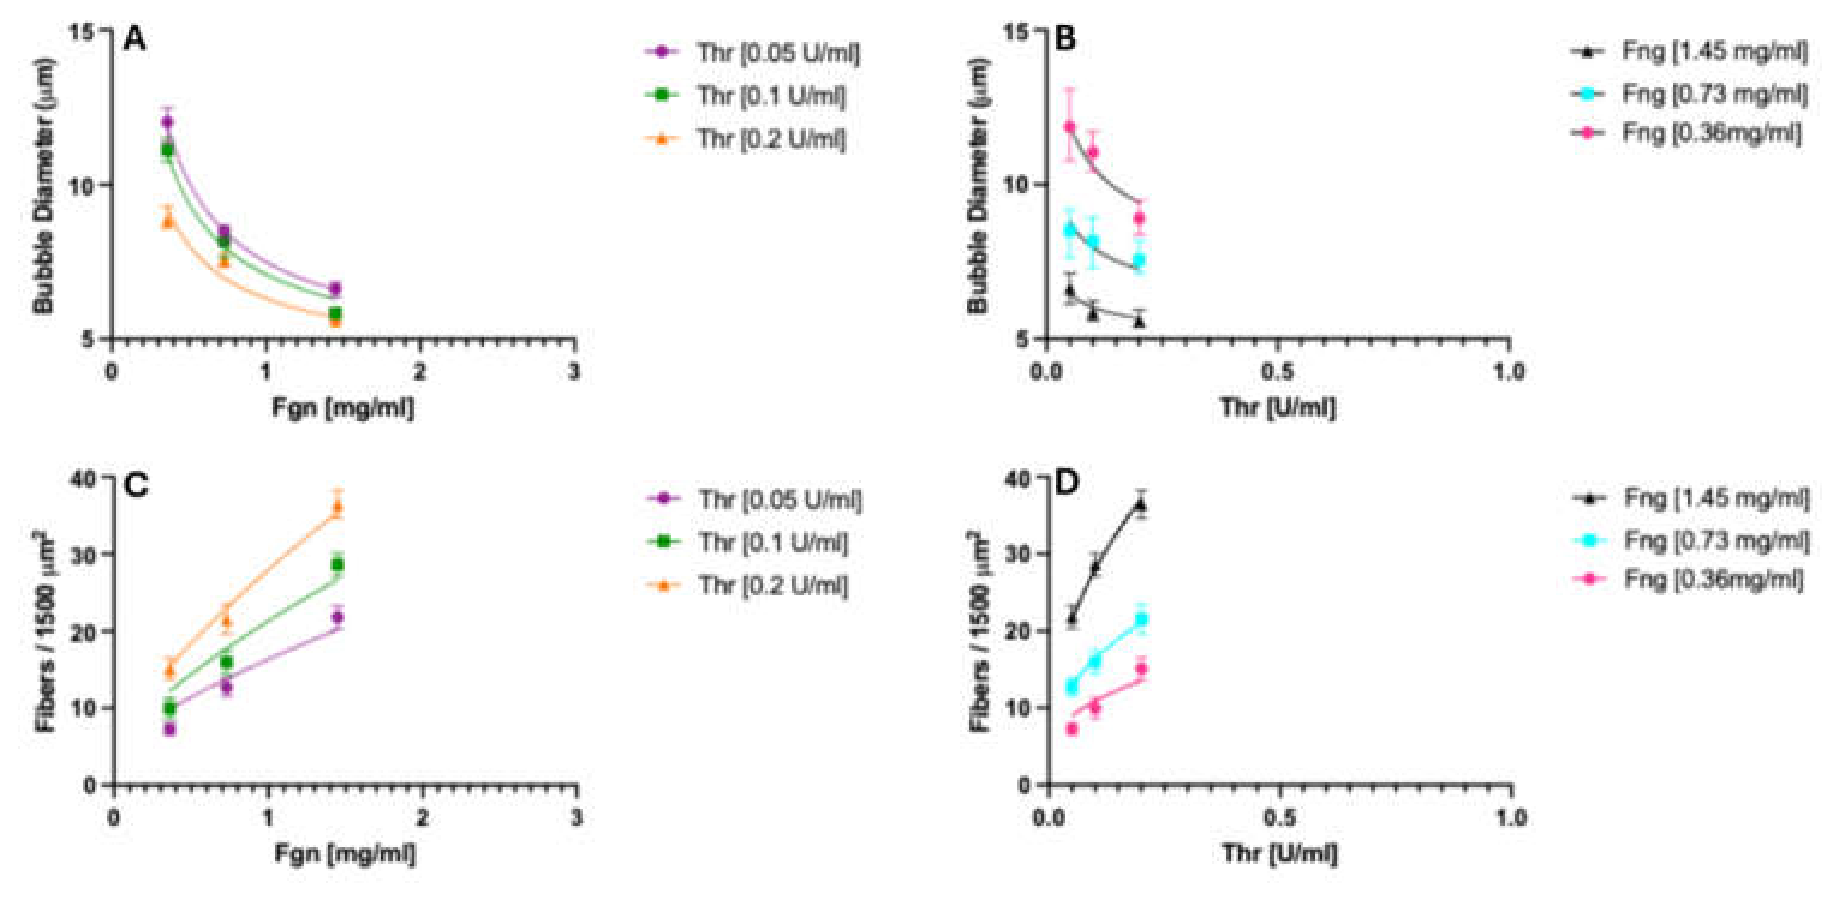
Figure 7.
Quantitative analysis of clot lysis time. As a function of fibrinogen concentration in plasma (A), in PEAK 1 fibrinogen samples (C). As a function of added thrombin concentration in plasma (B), in PEAK 1 fibrinogen samples (D). See text for fitting using an empirical power-law model of the form k([Fgn]α × [Thr]β).
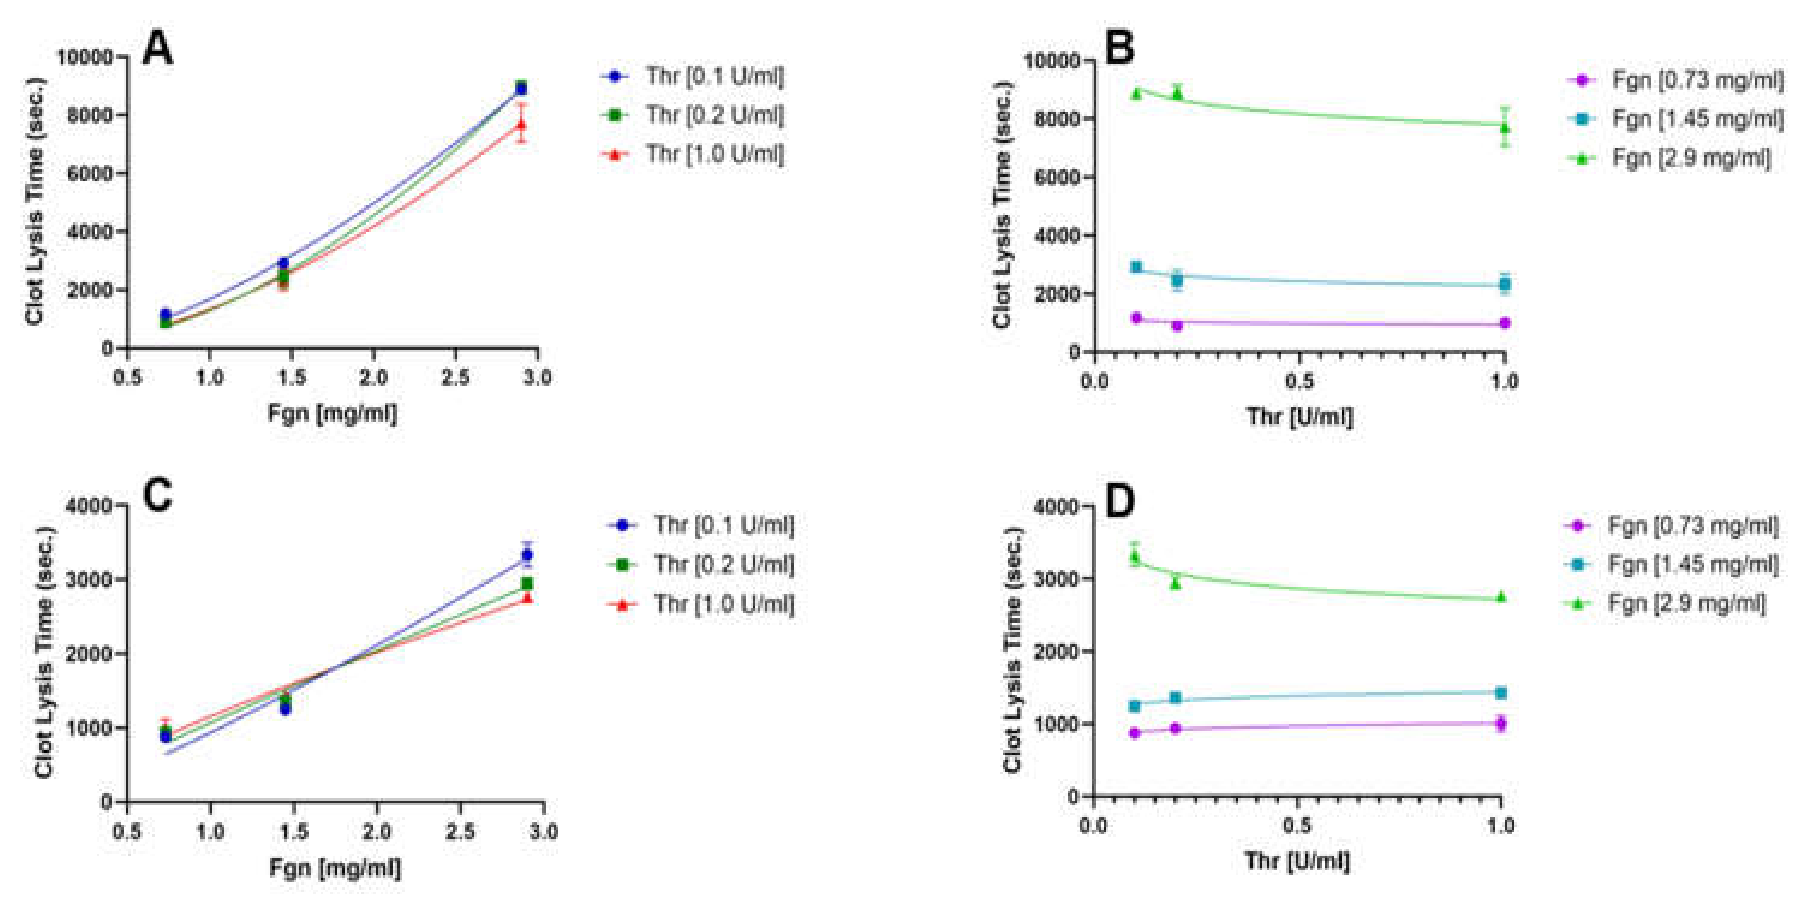
Figure 8.
Quantitative analysis of clot lysis time as a function of structural parameters in plasma. Solid lines fit to a power-law equation, CLT = 1.4∙103∙([Fgn]1.54 × [Thr]−0.07. (A, C, E) Clot lysis time at three fixed added thrombin concentrations (blue, green, red lines), versus bubble diameter (A), versus fiber density (C), and versus fiber diameter (E). (B, D, F) Clot lysis time at three fixed fibrinogen concentrations (purple, blue, green lines), versus bubble diameter (B); versus fiber density (D), and versus fiber diameter (F). Data points are means of six experiments +/- standard deviation.
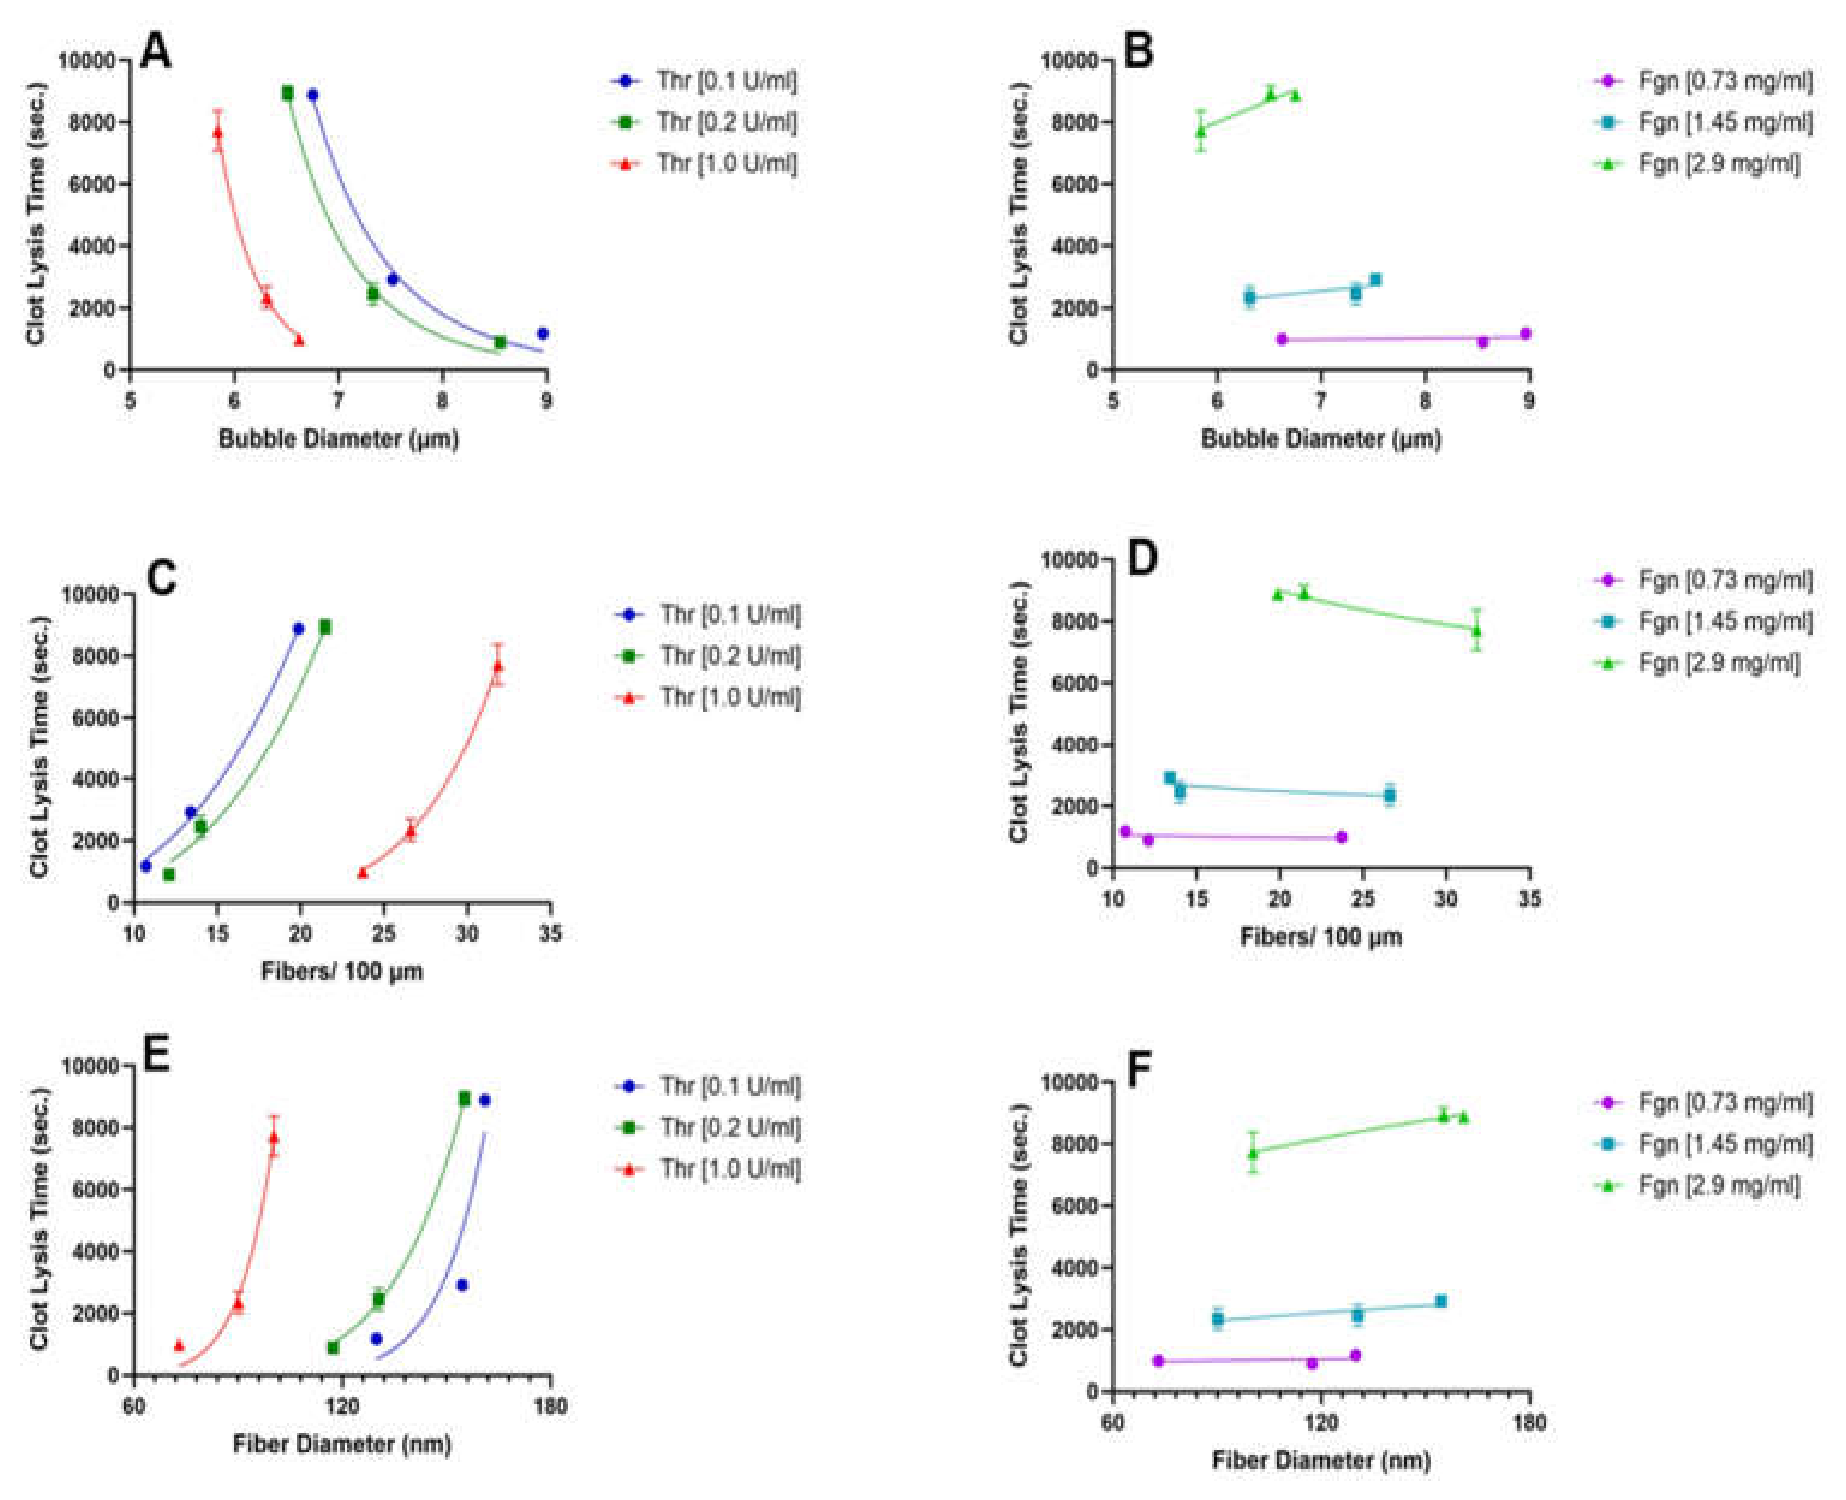

Table 1.
Fitting parameters and statistical results for bubble diameter, fiber density and clot lysis time for the non-linear modelk([Fgn]α × [Thr]β) in plasma.
Table 1.
Fitting parameters and statistical results for bubble diameter, fiber density and clot lysis time for the non-linear modelk([Fgn]α × [Thr]β) in plasma.
| Value | Std. Error | P-Value | R2 | ||
|---|---|---|---|---|---|
| Parameters for Bubble diameter | k | 6.4 | 0.2 | 8.06e-13 | 0.93 |
| α | - 0.22 | 0.02 | 1.55e-07 | ||
| β | - 0.13 | 0.02 | 2.43e-06 | ||
| Parameters for Fiber density | k | 24 | 1.0 | 1.65e-11 | 0.92 |
| α | 0.31 | 0.04 | 1.11e-05 | ||
| β | 0.29 | 0.03 | 2.25e-07 | ||
| Parameters for Clot Lysis Time | k | 1.4e3 | 1.0 | <2e-16 | 0.98 |
| α | 1.5 | 0.04 | <2e-16 | ||
| β | -0.07 | 0.03 | 0.01 | ||
Table 2.
Fitting parameters and statistical results for bubble diameter, fiber density and clot lysis time for the non-linear modelk([Fgn]α × [Thr]β) in PEAK 1 fibrinogen. Data for bubble diameter and fiber density, adapted from [26].
Table 2.
Fitting parameters and statistical results for bubble diameter, fiber density and clot lysis time for the non-linear modelk([Fgn]α × [Thr]β) in PEAK 1 fibrinogen. Data for bubble diameter and fiber density, adapted from [26].
| Value | Std. Error | P-Value | R2 | ||
|---|---|---|---|---|---|
| Parameters for Bubble diameter | k | 5.1 | 1.0 | 1.2e-07 | 0.98 |
| α | - 0.41 | 0.02 | 2.6e-06 | ||
| β | - 0.14 | 0.02 | 0.001 | ||
| Parameters for Fiber density | k | 57 | 1.0 | 3.2e-06 | 0.99 |
| α | 0.73 | 0.03 | 3.5e-06 | ||
| β | 0.43 | 0.02 | 0.0005 | ||
| Parameters for Clot Lysis Time | k | 1.2e3 | 1.0 | <2e-10 | 0.93 |
| α | 0.82 | 0.1 | <8e-5 | ||
| β | 0.005 | 0.05 | 0.9 | ||
Disclaimer/Publisher’s Note: The statements, opinions and data contained in all publications are solely those of the individual author(s) and contributor(s) and not of MDPI and/or the editor(s). MDPI and/or the editor(s) disclaim responsibility for any injury to people or property resulting from any ideas, methods, instructions or products referred to in the content. |
© 2026 by the authors. Licensee MDPI, Basel, Switzerland. This article is an open access article distributed under the terms and conditions of the Creative Commons Attribution (CC BY) license.
Copyright: This open access article is published under a Creative Commons CC BY 4.0 license, which permit the free download, distribution, and reuse, provided that the author and preprint are cited in any reuse.