

Submitted:
06 September 2026
Posted:
08 September 2026
You are already at the latest version
Abstract
Ayurveda is increasingly investigated using genomics, pharmacology and systems biology, yet its global scientific landscape remains quantitatively underexplored. We conducted a bibliometric and scientometric analysis of 2,027 Scopus-indexed articles (1991–2024), identifying 7,541 authors, 762 sources and 51,735 citations. Publication growth followed a Gompertz trajectory (R² = 0.998), indicating consolidation rather than exponential expansion, with declining relative growth and increasing doubling time. Author productivity deviated from Lotka’s law, while source distribution followed Bradford’s law. Citation inequality was high (Gini = 0.728). Network analysis revealed eight thematic clusters, with antioxidant pharmacology, COVID-19-related network pharmacology and complementary medicine as major motor themes; molecular docking and network pharmacology emerged as the newest topics. India dominated output but exhibited limited international collaboration. No significant open-access citation advantage was observed. Overall, Ayurveda research is shifting toward mechanistic and translational science but remains structurally concentrated and insufficiently internationalized.
Keywords:
Ayurveda
; Ayurgenomics
; Prakriti
; bibliometric analysis
; growth modelling
; thematic mapping
; reference publication year spectroscopy
1. Introduction
Ayurveda, one of the oldest and most comprehensive systems of medicine, emerged over 5,000 years ago in India [1]. It offers a distinctive understanding of health and disease, emphasising a harmonious balance between body (shareer), mind (mana) and spirit (atma) [2]. At the core of Ayurvedic philosophy lies the proposition that the body functions optimally in a state of equilibrium in which physical, mental and spiritual elements are balanced [3]. Ayurvedic principles emphasise the individualised nature of health and disease, holding that each person is born with a unique constitution, or Prakriti, which shapes susceptibility to disease, mental and physical traits, and responses to environmental and lifestyle factors.
Prakriti refers to an individual’s inherent constitution or biological makeup [4] and is held to be determined at conception by the specific combination of the three doshas, Vata, Pitta and Kapha [5]. These doshas derive from five elements and govern physiological and psychological function [6]. Ayurveda holds that Prakriti is established at conception and remains largely stable through life, although modifiable by diet (ahara), lifestyle (vihar), place (desh) and time (kala) [5]. This framework parallels the modern concept of personalised medicine, in which treatment is designed around an individual’s genetic, environmental and lifestyle profile rather than a uniform standard [6].
The principle of Tridosha forms the cornerstone of Ayurvedic physiology [7]. Vata, comprising space and air, governs movement, communication and elimination [8]; Pitta, comprising fire and water, governs metabolism, digestion and transformation; and Kapha, comprising earth and water, governs stability, growth and strength [9]. Health and disease are interpreted through doshic imbalance, with each dosha contributing to homeostasis [11]. The framework also accounts for why individuals of differing constitution respond differently to identical environmental or lifestyle exposures [12].
The Ayurvedic concept of Shoth (inflammation) is of particular contemporary relevance [11]. Shoth represents the body’s response to doshic imbalance [13], and is classified as Nij Shoth, arising from internal vitiation and associated with chronic conditions including arthritis, autoimmune disease and metabolic disorders, and Aagantuj Shoth, arising from external causes such as infection or trauma [11]. Modern immunology describes inflammation as a complex process involving immune cell activation and cytokine release [12], and the correspondence between these frameworks has motivated substantial mechanistic investigation.
Despite this rich foundation, integration of Ayurvedic concepts with modern molecular biology has been limited [14]. Advances in Ayurgenomics, applying genomic methods to the correlation between Prakriti and molecular phenotype, have begun to bridge this gap [12]. Studies by Prasher et al. and Govindaraj et al. have reported that individuals of differing Prakriti exhibit distinct gene expression profiles, particularly in genes associated with metabolism and inflammation, suggesting a molecular basis for classical constitutional classification [15].
Bibliometric and scientometric methods provide a quantitative means of characterising how a research field is structured and how it evolves. Beyond descriptive counts of publications and citations, formal bibliometric analysis permits testing of specific structural hypotheses: whether growth is exponential or saturating, whether author productivity conforms to Lotka’s inverse power law, whether sources scatter according to Bradford’s law, whether output concentration satisfies Price’s law, and where thematic clusters sit on the centrality–density plane that distinguishes motor from peripheral research themes. These methods have been applied extensively across biomedical disciplines but have not previously been applied with this level of formality to the intersection of Ayurveda and molecular science.
The present study therefore undertakes a comprehensive bibliometric and scientometric analysis of Ayurveda–genomics research indexed in Scopus between 1991 and 2024. The objectives are: (i) to characterise the temporal development of the field and to determine, by formal model selection, whether its growth is exponential or saturating; (ii) to test conformity to the classical bibliometric laws of Lotka, Bradford and Price; (iii) to quantify citation concentration and the distribution of scholarly impact; (iv) to characterise collaboration structure at author and country level, including the degree of internationalisation; (v) to reconstruct the conceptual structure of the field through network-based community detection and thematic mapping; (vi) to identify emerging and declining research themes through temporal keyword analysis; and (vii) to identify the historical intellectual foundations of the field through reference publication year spectroscopy.
2. Materials and Methods
2.1. Search Strategy and Corpus Construction
A structured literature search was conducted in Scopus. The Boolean query combined Ayurvedic terminology in the title, abstract or keyword fields (TITLE-ABS-KEY: "Ayurveda" OR "Prakriti" OR "Deha-Prakriti" OR "Tridosha" OR "Vata" OR "Pitta" OR "Kapha") with biomedical descriptors (TITLE-ABS-KEY: "inflammation" OR "genomics" OR "Ayurgenomics" OR "pharmacogenomics" OR "systems biology" OR "gene expression" OR "phenotype" OR "genotype" OR "biomarkers" OR "personalized medicine" OR "pharmacology" OR "herbal medicine" OR "phytopharmacology" OR "drug efficacy" OR "drug safety" OR "cytochrome P450"), constrained by PUBYEAR > 1990 AND PUBYEAR < 2025. Records were retrieved on 24 January 2026 and exported in full, comprising bibliographic metadata, abstracts, author and index keywords, affiliations, funding information and cited references.
Screening and selection followed the PRISMA framework (Figure 1). Identification returned 3,488 records; 27 duplicates were removed during screening; and the eligibility stage retained document type "Article" only, on the grounds that original research articles are citable, methodologically consistent primary contributions. The final corpus comprised 2,027 research articles published between 1991 and 2024, corresponding exactly to the PUBYEAR constraint of the search string. Records in languages other than English were retained where they carried English-language metadata sufficient for bibliometric processing; these represent 1.9% of the corpus (38 records, predominantly Chinese and German).
2.2. Network Construction and Visualisation
Co-citation, bibliographic coupling and co-authorship networks at the source, author, institution and country levels were constructed in VOSviewer version 1.6.20 [16] using full counting, with the thresholds reported in the corresponding figure legends. These networks underpin Figures 4 to 9.
2.3. Quantitative Bibliometric Analysis
All quantitative indicators reported in Section 3.4 onwards were computed directly from the exported record set in Python 3.12 using NumPy, pandas, SciPy, scikit-learn and NetworkX. The complete analysis script is provided as Supplementary File S1 and reproduces every table and figure from the exported dataset without modification.
Growth modelling. Cumulative publication output was fitted to exponential, three-parameter logistic and Gompertz models by non-linear least squares. Models were compared by the Akaike information criterion, with ΔAIC values reported relative to the best-supported model. The logistic carrying capacity K was taken as the modelled asymptote. Relative growth rate was computed as the difference in natural logarithm of cumulative output across each period divided by its duration, and doubling time as ln(2) divided by the relative growth rate. Developmental phases were delimited by binary segmentation changepoint detection on the annual output series using a variance-based cost function, rather than by visual inspection.
Bibliometric laws. Author productivity was tested against Lotka’s inverse power law by log–log regression of the frequency distribution, with the fitted exponent compared to the idealised value of 2 and goodness of fit assessed by the Kolmogorov–Smirnov statistic against the critical value 1.36/√N. Price’s law was evaluated by determining whether the √A most productive authors account for at least half of all authorships. Bradford’s law was assessed by partitioning ranked sources into three zones of approximately equal document yield and computing the Bradford multipliers between successive zones.
Citation structure. The h-index was computed as the largest h for which h documents each received at least h citations, the g-index as the largest g for which the top g documents jointly received at least g² citations, and the m-index as h divided by the number of years elapsed. Citation inequality was quantified by the Gini coefficient and visualised as a Lorenz curve. Distributional shape was characterised by skewness and excess kurtosis.
Collaboration. The degree of collaboration was computed as the proportion of multi-authored documents, the collaborative coefficient following Ajiferuke, and the collaboration index as mean authors per document. Country attribution was obtained by parsing the Scopus affiliation field against a controlled country vocabulary, achieving attribution for 98.9% of records. Documents were classified as single-country (SCP) or multi-country (MCP) publications according to whether more than one distinct country appeared among the affiliations.
Conceptual structure. An author keyword co-occurrence network was constructed over the 60 most frequent keywords after removal of the search terms themselves and generic indexing terms, retaining edges of weight ≥ 3. Communities were detected using the Louvain algorithm with modularity reported. For each community, Callon centrality was computed as the sum of external link weights and Callon density as the mean internal link weight scaled by community size; communities were assigned to quadrants of the thematic map relative to the median of each axis. Trend topics were characterised by the first quartile, median and third quartile of the publication years of documents carrying each keyword.
Reference publication year spectroscopy. Publication years were extracted from all cited references in the corpus by regular expression, yielding 18,862 dated references. The annual frequency distribution was computed and the deviation of each year from the five-year running median was plotted, following the standard RPYS procedure, in which positive deviations identify years disproportionately represented among cited references and therefore constitute the historical foundations of the field.
Open access analysis. Documents were classified by the presence of a Scopus open-access designation. Citation counts of open-access and non-open-access documents were compared by the Mann–Whitney U test with the rank-biserial correlation reported as effect size.
3. Results and Discussion
3.1. Corpus Characteristics
The final corpus comprised 2,027 research articles published between 1991 and 2024 across 762 distinct sources, authored by 7,541 unique individuals contributing 10,067 authorships. The corpus accumulated 51,735 citations at a mean of 25.52 and a median of 9 citations per document, with a field h-index of 97 and g-index of 168. Only 5.8% of documents were single-authored, and mean team size was 4.97 authors. Cited references numbered 19,494 in total, and 44.8% of documents carried an open-access designation. Full descriptive indicators are given in Table 1.
3.2. Temporal Distribution and Subject Composition
Figure 2 presents documents published per year disaggregated by constituent search keyword, and Figure 3 the distribution across Scopus subject areas. Medicine is the leading contributor at 24.3%, underscoring the clinical orientation of Ayurveda-based translational research and reflecting sustained effort to position constitutional concepts such as Prakriti within evidence-based frameworks. Biochemistry, Genetics and Molecular Biology follow at 20.3%, indicating the central role of molecular investigation in decoding the biological basis of Prakriti phenotypes through gene expression signatures, epigenetic modulation, cytokine profiling and cytochrome P450 variability. Agricultural and Biological Sciences account for 15.5%, reflecting the importance of plant-based therapeutics and phytochemical characterisation, while Pharmacology, Toxicology and Pharmaceutics contribute 14.0%, underscoring emphasis on drug metabolism, safety profiling and herb–drug interaction. Immunology and Microbiology (4.9%) reflect growing attention to immune modulation in constitution-based disease predisposition. Contributions from Multidisciplinary Sciences (2.5%), Computer Science (2.2%), Environmental Science (2.1%), Chemistry (1.8%) and Engineering (1.7%) demonstrate the expanding methodological scope of the field, the computational component in particular reflecting increasing use of bioinformatics, machine learning and network biology.
3.3. Networks of Literature, Institutions, Countries, Keywords, Authors and Journals
Co-citation analysis (Figure 4) reveals an intellectual architecture anchored by foundational complementary and alternative medicine scholarship, surrounded by a dense cluster of classical botanical compendia and Indian medicinal plant documentation, with translational bridges formed by integrative medicine researchers. Institutional analysis (Figure 5) identifies Banaras Hindu University as the most prolific contributor, followed by affiliated institutes and Patanjali Yog Peeth, with substantial representation from AIIMS, Savitribai Phule Pune University, Manipal Academy of Higher Education and the Ministry of AYUSH, the latter functioning as a bridging node between academic institutions and policy-driven initiatives. Country-level networks (Figure 6) show India as the central hub with dense connections to the United Kingdom, China, Malaysia, Saudi Arabia and several European nations. The author keyword network (Figure 7) places Ayurveda at the centre, surrounded by herbal medicine, inflammation, antioxidant activity and COVID-19. Author-level networks (Figure 8) identify a productive core including Balkrishna, Varshney, Patwardhan, Mukherjee and Prasher, with Patwardhan occupying a bridging position across clusters. Journal-level networks (Figure 9) place the Journal of Ayurveda and Integrative Medicine at the centre of the coupling network and the Journal of Ethnopharmacology at the centre of the co-citation network, with high-impact biomedical and clinical journals forming distinct peripheral clusters.
3.4. Growth Dynamics: The Field Is Consolidating, Not Expanding Exponentially
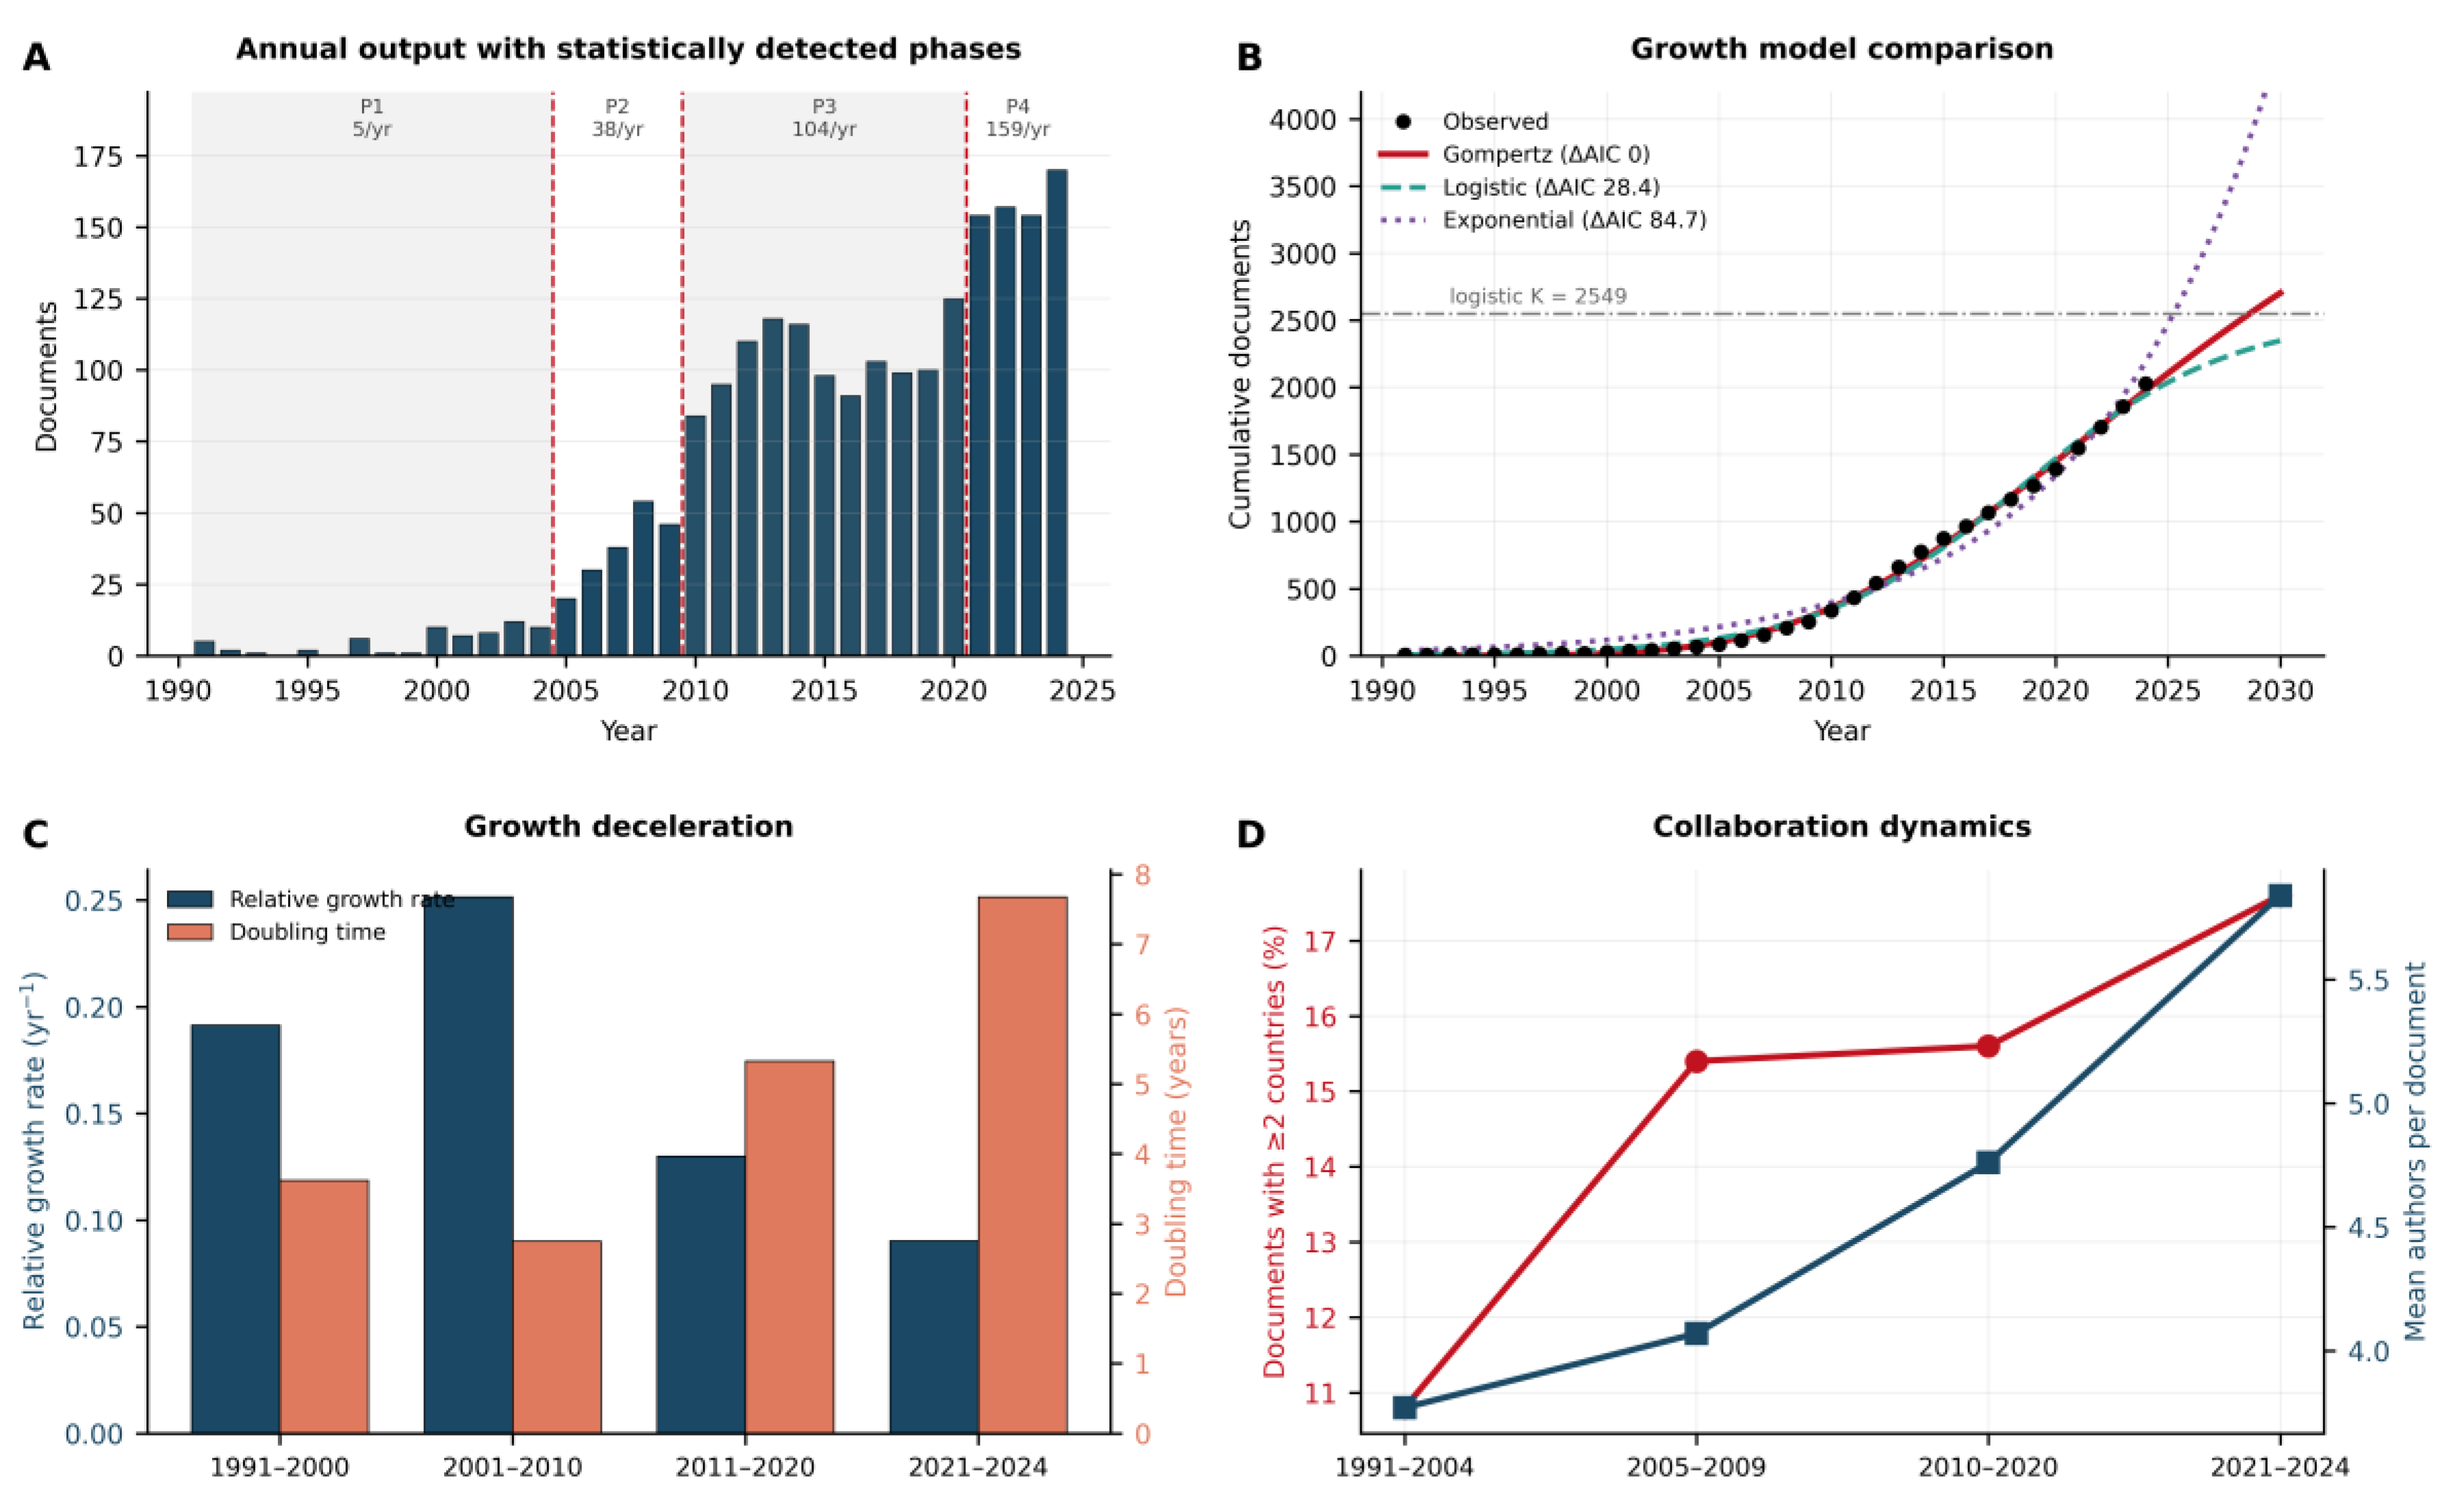
Annual output rose from 5 documents in 1991 to 170 in 2024 (Figure 10A). Binary segmentation changepoint detection identified three statistically supported breakpoints, at 2005, 2010 and 2021, delimiting four developmental phases (Table 4). Phase 1 (1991–2004) comprises 65 documents at 4.6 per year and 3.2% of the corpus, representing a foundational period of sparse, largely descriptive scholarship. Phase 2 (2005–2009) comprises 188 documents at 37.6 per year, marking the emergence of interdisciplinary engagement. Phase 3 (2010–2020) is the dominant expansion period, comprising 1,139 documents at 103.5 per year and 56.2% of the entire corpus. Phase 4 (2021–2024) comprises 635 documents at 158.8 per year, the highest absolute intensity of the series.
Formal model selection substantially revises the interpretation of this trajectory. Cumulative output was fitted to exponential, logistic and Gompertz models (Table 2; Figure 10B). The Gompertz model provides the best fit (R² = 0.998), the logistic model is materially worse (ΔAIC = 28.4), and the exponential model is decisively rejected (ΔAIC = 84.7). Both saturating models therefore outperform unbounded exponential growth by a wide margin. The fitted logistic carrying capacity is 2,549 documents, of which the observed corpus represents 79.5%, and the modelled inflexion point falls at 2018.6. On this evidence the field passed its maximum rate of expansion in the late 2010s and is now in a decelerating, consolidating regime.
Growth rate analysis corroborates this directly (Table 3; Figure 10C). The relative growth rate peaked at 0.252 yr⁻¹ during 2001–2010 and has since fallen to 0.130 yr⁻¹ in 2011–2020 and 0.090 yr⁻¹ in 2021–2024. Correspondingly, the doubling time has lengthened from 2.75 years to 5.33 and then 7.68 years. This is a monotonic and substantial deceleration. It is important to note that this does not indicate decline: absolute annual output remains at its highest recorded level, and the compound annual growth rate across the full series is 11.28%. Rather, it indicates that the field has matured past its phase of explosive expansion into one of sustained high-volume production, a pattern characteristic of research domains approaching institutional consolidation.

Table 2.
Comparison of growth models fitted to cumulative publication output.
| Model | Parameters | R² | AIC | ΔAIC |
| Gompertz | 4473, 11.69, 0.08063 | 0.9982 | 228.3 | 0.0 |
| Logistic | 2549, 0.215, 27.57 | 0.9959 | 256.7 | 28.4 |
| Exponential | 38.76, 0.1222 | 0.9771 | 313.0 | 84.7 |
Models were fitted by non-linear least squares and compared by the Akaike information criterion. Logistic parameters are the carrying capacity K, the intrinsic rate r and the inflexion point x₀ expressed in years from 1991. ΔAIC is the difference from the best-supported model; differences exceeding 10 are conventionally regarded as decisive.
Table 3.
Relative growth rate and doubling time by period.
| Period | Documents | Share of corpus (%) | Relative growth rate (yr⁻¹) | Doubling time (years) |
| 1991 –2000 | 28 | 1.4 | 0.1914 | 3.62 |
| 2001–2010 | 309 | 15.2 | 0.2516 | 2.75 |
| 2011–2020 | 1055 | 52.0 | 0.13 | 5.33 |
| 2021–2024 | 635 | 31.3 | 0.0903 | 7.68 |
Relative growth rate is the difference in natural logarithm of cumulative output across the period divided by its duration; doubling time is ln(2) divided by the relative growth rate.
Table 4.
Developmental phases identified by binary segmentation changepoint detection.
| Phase | Years | Documents | Mean per year | Share of corpus (%) |
| Phase 1 | 1991–2004 | 65 | 4.6 | 3.2 |
| Phase 2 | 2005–2009 | 188 | 37.6 | 9.3 |
| Phase 3 | 2010–2020 | 1139 | 103.5 | 56.2 |
| Phase 4 | 2021–2024 | 635 | 158.8 | 31.3 |
Changepoints were detected on the annual output series using a variance-based cost function, without reference to prior expectations regarding phase boundaries.
Figure 10.
Quantitative growth analysis of the corpus. (A) Annual output with the four developmental phases identified by binary segmentation; dashed lines mark detected changepoints at 2005, 2010 and 2021. (B) Comparison of exponential, logistic and Gompertz models fitted to cumulative output, with the logistic carrying capacity indicated. (C) Relative growth rate and doubling time by period. (D) International collaboration rate and mean authors per document across the four phases. Model selection used the Akaike information criterion; the Gompertz model is preferred (ΔAIC = 0) over the logistic (ΔAIC = 28.4) and exponential (ΔAIC = 84.7) alternatives. Numerical parameters are given in Table 2, Table 3, Table 4 and Table 9.
Figure 10.
Quantitative growth analysis of the corpus. (A) Annual output with the four developmental phases identified by binary segmentation; dashed lines mark detected changepoints at 2005, 2010 and 2021. (B) Comparison of exponential, logistic and Gompertz models fitted to cumulative output, with the logistic carrying capacity indicated. (C) Relative growth rate and doubling time by period. (D) International collaboration rate and mean authors per document across the four phases. Model selection used the Akaike information criterion; the Gompertz model is preferred (ΔAIC = 0) over the logistic (ΔAIC = 28.4) and exponential (ΔAIC = 84.7) alternatives. Numerical parameters are given in Table 2, Table 3, Table 4 and Table 9.
3.5. Conformity to the Classical Bibliometric Laws
Lotka’s law. The distribution of author productivity was fitted by log–log regression, yielding an exponent of n = 2.615 (standard error 0.184, R² = 0.914) against the idealised inverse-square value of 2. The Kolmogorov–Smirnov statistic D = 0.064 exceeds the critical value of 0.016 at the 5% level, indicating statistically significant deviation from the idealised distribution (Figure 11A). The direction of this deviation is informative: an exponent above 2 denotes a steeper decline than Lotka predicted, meaning the field contains proportionally more transient contributors and proportionally fewer sustained ones than a canonical scientific discipline. Consistent with this, 6,304 of 7,541 authors (83.6%) contributed exactly one article.
Price’s law. Price’s law posits that the square root of the author population produces half of all output. Here the 86 most prolific authors, corresponding to √7,541, account for 842 of 10,067 authorships, or 8.4%. Price’s law is therefore not merely unmet but missed by a very wide margin. Taken together with the Lotka result, this establishes that Ayurveda–genomics research is not structured around a small elite of dominant producers. It is instead a highly dispersed field with an unusually large periphery of occasional contributors. This finding materially qualifies the common characterisation of the field as driven by a core group of leading scholars: while such a core exists and is visible in the co-authorship networks of Figure 8, it accounts for a small minority of total output.
Bradford’s law. Source scattering conforms well to Bradford’s law (Table 5; Figure 11B). Partitioning the 762 sources into three zones of approximately equal document yield gives a core of 23 journals publishing 33.3% of all articles, a second zone of 150 journals and a third of 589 journals. The Bradford multipliers between successive zones are 6.52 and 3.93. The core is led by the Journal of Ayurveda and Integrative Medicine (136 documents) and the Journal of Ethnopharmacology (102 documents), the latter carrying markedly higher citation impact (mean 65.0 versus 11.7 citations, h-index 36 versus 21). A pronounced impact heterogeneity exists within the core: several high-output journals, including the International Journal of Research in Ayurveda and Pharmacy and the Journal of Natural Remedies, exhibit mean citation counts below 2, indicating that publication volume and scholarly influence are only loosely coupled in this field (Table 6).
3.6. Citation Structure and Impact Concentration
Citation distribution is extremely unequal (Table 7; Figure 11C). The Gini coefficient is 0.728, comparable to the most unequal national income distributions. The top 1% of documents capture 24.0% of all citations, the top 5% capture 44.8%, the top 10% capture 59.0%, and the top 25% capture 80.1%. Meanwhile 12.4% of documents remain entirely uncited. The distribution is severely right-skewed (skewness 14.36, excess kurtosis 279.22), and the mean of 25.52 citations exceeds the median of 9 by a factor of 2.8, confirming that mean citation counts are a poor summary statistic for this field and that median-based reporting is preferable.
The most cited document is Goel et al. (2008) in Biochemical Pharmacology with 2,057 citations, followed by Grover et al. (2002) in the Journal of Ethnopharmacology with 1,485 and Ahmad et al. (2013) with 1,134 (Table 12). Normalising by document age identifies Goel et al. as also the highest-intensity paper at 121.0 citations per year, indicating that its influence is not merely an artefact of seniority.
3.7. Geographical Structure and Internationalisation
Country attribution succeeded for 98.9% of records. India dominates output by a very wide margin (Table 8; Figure 12A). Beyond raw counts, the single- and multi-country publication decomposition reveals a structural feature not visible in the network visualisations of Figure 6: India exhibits one of the lowest international collaboration rates among leading contributors, whereas smaller contributors such as Saudi Arabia, the United Kingdom, Germany and Australia derive a much larger proportion of their output from cross-national teams (Figure 12B). The field is therefore geographically concentrated and, at its centre, comparatively inward-facing.
The relationship between productivity and impact is inverse at the country level (Figure 12C). Countries with lower output frequently exhibit higher mean citation counts, a pattern consistent with selective international participation in higher-visibility work. Longitudinal analysis (Table 9; Figure 10D) nevertheless shows steady internationalisation: the proportion of multi-country documents rose across the four phases, and mean team size rose in parallel from 3.99 to 5.71 authors per document. Both trends indicate a field becoming progressively more collaborative even as its geographical centre of gravity remains stable.
The collaboration indices confirm a strongly collaborative field overall: the degree of collaboration is 0.942, the Ajiferuke collaborative coefficient 0.681 and the collaboration index 4.97 authors per document.
Table 8.
Fifteen most productive countries with collaboration and impact indicators.
| Country | Documents | SCP | MCP | MCP ratio (%) | Total citations | Mean citations | h-index |
| India | 1429 | 1242 | 187 | 13.1 | 30148 | 21.1 | 75 |
| United States | 215 | 102 | 113 | 52.6 | 12981 | 60.4 | 55 |
| China | 125 | 87 | 38 | 30.4 | 3738 | 29.9 | 30 |
| United Kingdom | 69 | 14 | 55 | 79.7 | 2327 | 33.7 | 26 |
| Germany | 49 | 22 | 27 | 55.1 | 1506 | 30.7 | 21 |
| Malaysia | 39 | 12 | 27 | 69.2 | 1765 | 45.3 | 14 |
| Australia | 39 | 16 | 23 | 59.0 | 1479 | 37.9 | 20 |
| Italy | 35 | 14 | 21 | 60.0 | 1334 | 38.1 | 20 |
| Saudi Arabia | 32 | 3 | 29 | 90.6 | 1903 | 59.5 | 14 |
| Japan | 32 | 16 | 16 | 50.0 | 1150 | 35.9 | 14 |
| Bangladesh | 24 | 10 | 14 | 58.3 | 509 | 21.2 | 12 |
| South Korea | 23 | 7 | 16 | 69.6 | 703 | 30.6 | 15 |
| Russia | 18 | 7 | 11 | 61.1 | 519 | 28.8 | 10 |
| Sri Lanka | 17 | 14 | 3 | 17.6 | 594 | 34.9 | 8 |
| Thailand | 16 | 5 | 11 | 68.8 | 395 | 24.7 | 9 |
SCP denotes single-country publications and MCP multi-country publications. The MCP ratio is the proportion of a country’s output involving international co-authorship. Country attribution was derived by parsing Scopus affiliation strings.
Table 9.
Collaboration indicators across the four developmental phases.
| Period | Documents | International collaboration (%) | Mean authors per document | Mean countries per document |
| 1991 –2004 | 65 | 10.8 | 3.77 | 1.12 |
| 2005–2009 | 182 | 15.4 | 4.07 | 1.22 |
| 2010–2020 | 1119 | 15.6 | 4.76 | 1.22 |
| 2021–2024 | 630 | 17.6 | 5.84 | 1.27 |
3.8. Conceptual Structure and Thematic Mapping
Louvain community detection on the author keyword co-occurrence network resolved eight communities with a modularity of Q = 0.394 (Figure 13A). A modularity in this range indicates genuine but moderate thematic partitioning: the field is organised into recognisable subdomains, yet these remain substantially interconnected rather than fragmented into isolated specialties. The communities correspond to inflammation and oxidative stress; antioxidant and anti-inflammatory pharmacology; herbal and traditional medicine; analytical standardisation; COVID-19 and computational pharmacology; complementary and integrative medicine; phytochemistry; and cancer biology.
Positioning these communities on the Callon centrality–density plane (Table 11; Figure 13B) identifies three motor themes, characterised by both high external connectivity and high internal development. The first comprises antioxidant, anti-inflammatory, analgesic and antimicrobial activity, the pharmacological core of the field. The second comprises COVID-19, Withania somnifera, molecular docking and network pharmacology, a computationally oriented cluster of recent origin that has achieved unusually high internal density (6.29) despite its youth. The third comprises complementary, alternative and integrative medicine, reflecting the field’s continuing engagement with the broader integrative healthcare discourse.
Inflammation and oxidative stress, together with herbal and traditional medicine, occupy the basic and transversal quadrant: they are highly central to the field but comparatively less internally developed, which is the expected position for foundational themes that supply shared vocabulary across many subdomains. Phytochemistry constitutes a niche theme, internally coherent but weakly connected to the wider network. Analytical standardisation and cancer biology fall in the emerging or declining quadrant, with low centrality and low density.
3.9. Temporal Evolution of Research Themes
Trend analysis based on the median publication year of documents carrying each keyword identifies a clear generational sequence (Table 10; Figure 14A). The newest themes are molecular docking and network pharmacology, both with median year 2023, followed by COVID-19 (2022) and SARS-CoV-2 (2022). The appearance of molecular docking and network pharmacology at the leading edge is notable: it indicates that the computational turn in Ayurveda research is not merely an adjunct to experimental work but currently the fastest-growing methodological front. Intermediate themes include ashwagandha (2021), Prakriti (2020), traditional medicine (2020) and phytochemical analysis (2020). The oldest themes are antioxidants (2012), Ayurvedic medicine (2012), arthritis (2013), Siddha (2014), antimicrobial activity (2014) and analgesic activity (2014).
This sequence provides quantitative support for the qualitative claim that the field has shifted from descriptive characterisation toward mechanistic and computational investigation. It also indicates that Prakriti, the concept most central to Ayurgenomics, entered the mainstream literature comparatively recently, with a median year of 2020 and an interquartile range of 2014 to 2021.
Table 10.
Trend topics ranked by median publication year.
| Keyword | Occurrences | Q1 year | Median year | Q3 year |
| molecular docking | 28 | 2022 | 2023 | 2024 |
| network pharmacology | 25 | 2021 | 2023 | 2024 |
| covid-19 | 39 | 2021 | 2022 | 2023 |
| sars-cov-2 | 18 | 2022 | 2022 | 2022 |
| ashwagandha | 16 | 2018 | 2021 | 2023 |
| traditional medicine | 40 | 2015 | 2020 | 2022 |
| prakriti | 16 | 2014 | 2020 | 2021 |
| obesity | 15 | 2013 | 2020 | 2022 |
| phytochemical | 15 | 2013 | 2020 | 2021 |
| natural products | 12 | 2015 | 2020 | 2021 |
| ethnopharmacology | 12 | 2014 | 2020 | 2021 |
| inflammation | 63 | 2014 | 2019 | 2021 |
| oxidative stress | 38 | 2014 | 2019 | 2022 |
| hptlc | 33 | 2012 | 2019 | 2023 |
| apoptosis | 14 | 2014 | 2019 | 2020 |
| magnaporthe oryzae | 13 | 2015 | 2019 | 2021 |
| flavonoids | 13 | 2013 | 2019 | 2020 |
| rice blast | 12 | 2016 | 2019 | 2022 |
| rheumatoid arthritis | 33 | 2011 | 2018 | 2022 |
| standardization | 23 | 2013 | 2018 | 2020 |
Q1 and Q3 denote the first and third quartiles of the publication years of documents carrying each keyword. Only keywords occurring in at least eight documents are shown.
Table 11.
Thematic clusters with Callon centrality and density.
| Cluster | Representative keywords | Keywords | Total occurrences | Callon centrality | Callon density | Quadrant |
| 1 | inflammation; oxidative stress; rheumatoid arthritis; antioxidants | 6 | 179 | 3 | 3.0 | Basic/Transversal |
| 2 | antioxidant; anti-inflammatory; analgesic; antimicrobial | 4 | 118 | 9 | 4.25 | Motor |
| 3 | herbal medicine; traditional medicine; ayurvedic medicine; ethnopharmacology | 5 | 131 | 7 | 3.2 | Basic/Transversal |
| 4 | hptlc; standardization | 2 | 56 | 0 | 1.5 | Emerging/Declining |
| 5 | covid-19; withania somnifera; molecular docking; network pharmacology | 7 | 175 | 3 | 6.29 | Motor |
| 6 | complementary and alternative medicine; alternative medicine; complementary medicine; integrative medicine | 5 | 109 | 4 | 5.2 | Motor |
| 7 | phytochemistry; pharmacology | 2 | 44 | 0 | 4.0 | Niche |
| 8 | apoptosis; breast cancer | 2 | 26 | 0 | 1.5 | Emerging/Declining |
Communities were detected by the Louvain algorithm (modularity Q = 0.394). Callon centrality measures external connectivity and Callon density internal development. Quadrant assignment is relative to the median of each axis.
3.10. Historical Foundations: Reference Publication Year Spectroscopy
Reference publication year spectroscopy across 18,862 dated cited references identifies the historical strata on which the field rests (Figure 14B). Beyond the expected recent maxima reflecting ordinary citation recency, the deviation spectrum reveals distinct positive peaks at 1935, 1956, 1969, 1971, 1976 and 1984. These peaks are substantial relative to the low absolute reference volume of those years, indicating specific foundational works that continue to be cited disproportionately. Their distribution across the mid-twentieth century corresponds to the period of systematic pharmacognostic documentation of Indian medicinal plants and the compilation of the classical botanical compendia that recur prominently in the co-citation network of Figure 4. Among more recent years, 2000 and 2005 show elevated deviations consistent with the foundational Ayurgenomics and integrative medicine literature.
This analysis makes explicit a structural feature that citation counts alone obscure. The field draws simultaneously on two temporally distinct intellectual bases: a mid-twentieth-century pharmacognostic and botanical literature, and a twenty-first-century molecular and integrative medicine literature. The relative sparsity of peaks between these strata indicates limited continuous intellectual transmission between them, and suggests that the modern field has reconnected with its documentary foundations rather than developing from them without interruption.
3.11. Open Access and the Absence of a Citation Advantage
Of the corpus, 908 documents (44.8%) carry an open-access designation. Comparison of citation counts between open-access and non-open-access documents found no statistically significant difference (Mann–Whitney U = 505,553; p = 0.850), with a negligible rank-biserial effect size of 0.005. Median citations were 8 for open-access and 9 for non-open-access documents. The frequently asserted open-access citation advantage is therefore not detectable in this field. This null result is reported explicitly because it is informative: it suggests that in a domain where readership is concentrated within a specialist community with established access pathways, open-access status confers little additional visibility. It also cautions against advocating open-access publication in this field on citation-maximisation grounds.
3.12. Author-Level Structure
The most productive authors are Kumar, A. (33 documents), Balkrishna, A. (31) and Varshney, A. (30), the latter two publishing exclusively since 2019 and reflecting concentrated recent institutional output (Table 13). Productivity and influence are, however, only weakly coupled. Patwardhan, B. contributes 21 documents but attracts 1,267 citations at a mean of 60.3 and an h-index of 17, the highest among the leading authors, while Mukherjee, P.K. attains a mean of 48.8 citations across 16 documents. By contrast, several of the most prolific contributors exhibit mean citation counts near 15. This divergence between volume and influence mirrors the pattern observed at journal level in Section 3.5 and is consistent with the low concentration indicated by the failure of Price’s law.
Table 12.
Fifteen most cited documents in the corpus.
| First author | Year | Source | Citations | Citations per year |
| Goel , A. et al. | 2008 | Biochemical Pharmacology | 2057 | 121.0 |
| Grover, J.K. et al. | 2002 | Journal of Ethnopharmacology | 1485 | 64.6 |
| Ahmad, A. et al. | 2013 | Asian Pacific Journal of Tropical Biomedicine | 1134 | 94.5 |
| Chainani-Wu, N. et al. | 2003 | Journal of Alternative and Complementary Medicine | 999 | 45.4 |
| Jia, Y. et al. | 2000 | EMBO Journal | 916 | 36.6 |
| Aparna, V. et al. | 2012 | Chemical Biology and Drug Design | 707 | 54.4 |
| Dugasani, S. et al. | 2010 | Journal of Ethnopharmacology | 641 | 42.7 |
| Ji, H.-F. et al. | 2009 | EMBO Reports | 564 | 35.2 |
| Muthu, C. et al. | 2006 | Journal of Ethnobiology and Ethnomedicine | 524 | 27.6 |
| Kronenberg, F. et al. | 2002 | Annals of Internal Medicine | 511 | 22.2 |
| Saper, R.B. et al. | 2008 | JAMA | 434 | 25.5 |
| Naik, G.H. et al. | 2003 | Phytochemistry | 376 | 17.1 |
| Dharmasiri, M.G. et al. | 2003 | Journal of Ethnopharmacology | 303 | 13.8 |
| Bhattacharya, S.K. et al. | 2000 | Phytomedicine | 300 | 12.0 |
| Bag, A. et al. | 2013 | Asian Pacific Journal of Tropical Biomedicine | 292 | 24.3 |
Citations per year normalises total citations by the number of years elapsed since publication, and identifies sustained rather than merely accumulated influence.
Table 13.
Fifteen most productive authors with impact indicators.
| Author | Documents | Total citations | Mean citations | h-index | First publication | Latest publication |
| Kumar , A. | 33 | 483 | 14.6 | 12 | 1995 | 2024 |
| Balkrishna, A. | 31 | 470 | 15.2 | 13 | 2019 | 2024 |
| Varshney, A. | 30 | 466 | 15.5 | 13 | 2019 | 2024 |
| Kumar, S. | 21 | 256 | 13.5 | 11 | 2008 | 2024 |
| Patwardhan, B. | 21 | 1267 | 60.3 | 17 | 2000 | 2022 |
| Singh, S. | 17 | 248 | 14.6 | 6 | 2000 | 2024 |
| Singh, R. | 16 | 200 | 13.3 | 10 | 2012 | 2024 |
| Singh, A. | 16 | 268 | 16.8 | 9 | 1991 | 2024 |
| Mukherjee, P.K. | 16 | 781 | 48.8 | 14 | 2006 | 2024 |
| Sharma, V. | 16 | 491 | 30.7 | 10 | 2011 | 2024 |
| Kumar, V. | 15 | 455 | 30.3 | 10 | 2002 | 2024 |
| Sharma, S. | 15 | 160 | 10.7 | 6 | 2011 | 2024 |
| Kumar, D. | 14 | 149 | 10.6 | 6 | 2010 | 2024 |
| Verma, S. | 13 | 183 | 15.2 | 9 | 2007 | 2023 |
| Tillu, G. | 13 | 418 | 32.2 | 10 | 2012 | 2022 |
The h-index is computed within the corpus only and is therefore not the author’s overall h-index. Author names are as indexed in Scopus; homonym disambiguation was not performed, and common surnames may aggregate multiple individuals.
4. Limitations
Several limitations should be borne in mind. The analysis relies exclusively on Scopus; coverage differences between Scopus, Web of Science, PubMed and Dimensions are well documented, and a substantial body of Ayurveda research published in regional and non-indexed journals falls outside this corpus. Restriction to document type "Article" excludes reviews, conference papers and book chapters, which in this field carry appreciable intellectual weight. Author names were used as indexed by Scopus without homonym disambiguation; given the prevalence of common surnames in the dominant national contributor, the author-level indicators in Table 13 may aggregate distinct individuals, and this affects the Lotka and Price analyses to an unknown but probably modest degree. Country attribution was derived by parsing affiliation strings and, although successful for 98.9% of records, remains subject to parsing error. Citation counts are cumulative to the export date and disadvantage recent publications; age-normalised measures were reported alongside raw counts to mitigate this. The growth models are extrapolations beyond the observed range and the carrying capacity estimate in particular should be treated as indicative rather than predictive. Finally, keyword-based conceptual mapping depends on author-supplied terms, available for 86.4% of records, and inherits any inconsistency in indexing practice.
5. Conclusion
This study provides a quantitative characterisation of the intellectual, thematic, institutional and geographical structure of Ayurveda–genomics research across 2,027 articles published between 1991 and 2024. Four principal findings emerge. First, the field is no longer in exponential expansion: formal model selection decisively favours saturating growth, the relative growth rate has fallen by nearly two-thirds since its peak, doubling time has lengthened from 2.75 to 7.68 years, and the corpus stands at approximately 79.5% of its modelled carrying capacity. The field is consolidating rather than accelerating. Second, output is far less concentrated among elite authors than is typical: Price’s law fails by a wide margin and Lotka’s exponent of 2.615 indicates an unusually large periphery of single-contribution authors, so the field is better described as broadly dispersed than as elite-driven. Third, citation impact is nevertheless extremely concentrated, with a Gini coefficient of 0.728 and a quarter of all citations accruing to 1% of documents, and volume and influence are only loosely coupled at both journal and author level. Fourth, thematic mapping identifies computational pharmacology, comprising molecular docking and network pharmacology, as simultaneously the newest and one of the most internally developed themes in the field, marking a decisive methodological turn.
Reference publication year spectroscopy further reveals that the field draws on two temporally separated intellectual foundations, a mid-twentieth-century pharmacognostic literature and a twenty-first-century molecular one, with limited continuous transmission between them. Together with the finding that the dominant national contributor exhibits among the lowest international collaboration rates, and that no open-access citation advantage is detectable, these results identify the specific structural constraints that will shape the field’s next phase. Strengthening cross-national collaboration, improving the coupling between publication volume and scholarly influence, and consolidating the emerging computational front represent the most tractable routes to continued maturation of Ayurveda within integrative and precision medicine.
Supplementary Materials
The following supporting information can be downloaded at the website of this paper posted on Preprints.org.
Author contributions
Dyumn Dwivedi: Writing - Original Draft, Writing - Review & Editing, Visualization, Supervision; Uddalak Das: Visualization, Writing - Review & Editing; Shruti Mishra: Supervision, Writing - review & editing; Reenu Singh: Writing - Review & Editing; N Srikanth: Writing - Review & Editing; Rana Pratap Singh: Conceptualization, Funding acquisition, Project administration, Supervision, Writing - review & editing; Rupesh Chaturvedi: Conceptualization, Funding acquisition, Project administration, Supervision, Writing - review & editing.
Data and Materials Availability: The complete set of computed indicators is provided as Supplementary Table S1–S2 and in the accompanying source data files. The analysis script implementing every quantitative procedure described in Section 2.3 is provided as Supplementary File S1 and reproduces Figure 10, Figure 11, Figure 12, Figure 13 and Figure 14 and Table 1, Table 2, Table 3, Table 4, Table 5, Table 6, Table 7, Table 8, Table 9, Table 10, Table 11, Table 12 and Table 13 directly from the Scopus export without modification. The underlying bibliographic records are available from Scopus under institutional subscription using the search string reported in Section 2.1 and Figure 1.
Acknowledgments
The author(s) acknowledge the funds received by Rupesh Chaturvedi from the Central Council for Research in Ayurvedic Sciences (Grant No: HQ-PROJ011/33/2024-PROJ), and also the funds received by Rana Pratap Singh from the Central Council for Research in Ayurvedic Sciences (Grant No: PAC/SCSM/RPS/CCRAS/1616).
Conflicts of Interest
Declare any potential conflicts per standard forms.
Further Disclosure
The writing of this meta-analysis paper involved the use of generative AI and AI-assisted technologies only to enhance the clarity, coherence, and overall quality of the manuscript. The authors acknowledge the contributions of AI in the writing process while ensuring that the final content reflects the author’s insights and interpretations of the literature. All interpretations and conclusions drawn in this manuscript are the author’s sole responsibility.
References
- Bhargav, H.; Chikkanna, U.; Holla, B.; Arya, R.; Daga, R.; Jasti, N.; Amlani, S.; Santhosh, C.; Sanker, V.; Soman, A.; Unnikrishnan, K.; Shivakumar, V.; Varambally, S.; Ramakrishna, K.K. The Brief Prakriti Inventory: Latent structure, reliability, and validity. Wellcome Open Res. 2026, 10, 669. [Google Scholar] [CrossRef]
- Huang, Z.; Chavda, V.P.; Bezbaruah, R.; Uversky, V.N.P.S.; Patel, A.B.; Chen, Z.S. An Ayurgenomics Approach: Prakriti-Based Drug Discovery and Development for Personalized Care. Front Pharmacol. 2022, 13, 866827. [Google Scholar] [CrossRef]
- Govindaraj, P.; Nizamuddin, S.; Sharath, A.; Jyothi, V.; Rotti, H.; Raval, R.; Nayak, J.; Bhat, B.K.; Prasanna, B.V.; Shintre, P.; Sule, M.; Joshi, K.S.; Dedge, A.P.; Bharadwaj, R.; Gangadharan, G.G.; Nair, S.; Gopinath, P.M.; Patwardhan, B.; Kondaiah, P.; Satyamoorthy, K.; Valiathan, M.V.S.; Thangaraj, K. Genome-wide analysis correlates Ayurveda Prakriti. Sci. Rep. 2015, 5(1), 15786. [Google Scholar] [CrossRef]
- Bhalerao, S.; Deshpande, T.; Thatte, U. Prakriti (Ayurvedic concept of constitution) and variations in platelet aggregation. BMC Complement Altern. Med. 2012, 12(1), 248. [Google Scholar] [CrossRef]
- Dey, S.; Pahwa, P. Prakriti and its associations with metabolism, chronic diseases, and genotypes: Possibilities of new born screening and a lifetime of personalized prevention. J. Ayurveda Integr. Med. 2014, 5(1), 15. [Google Scholar] [CrossRef]
- Juyal, R.C.; Negi, S.; Wakhode, P.; Bhat, S.; Bhat, B.; Thelma, B.K. Potential of Ayurgenomics Approach in Complex Trait Research: Leads from a Pilot Study on Rheumatoid Arthritis. In PLoS ONE; Novelli, G., Ed.; 26 Sep 2012; Volume 7, 9. [Google Scholar] [CrossRef]
- Venkatesh, A.; Johansson, L.; Sivanandan, P.V.; Gopakumar, S.P.; Sankaranarayanan, K.; Kessler, C.S.; Ravani, S.; Puthiyedath, R. Prakriti (constitutional typology) in Ayurveda: a critical review of Prakriti assessment tools and their scientific validity. Front Med. 2025, 12, 1656249. [Google Scholar] [CrossRef]
- Dwivedi, J. A Review of Vata, Pitta, and Kapha Doshas in Ayurveda. SGS-Eng. Sci. [Internet] 2025, 1(1). Available online: https://spast.org/techrep/article/view/5284.
- Chaturvedi, S.; Tillu, G. Jarachikitsa and Gerosciences for healthy ageing – A public health perspective. J. Ayurveda Integr. Med. 2022, 13(1), 100567. [Google Scholar] [CrossRef]
- Konjengbam, H.; Leona Devi, Y.; Meitei, S.Y. Correlation of body composition parameters and anthropometric somatotypes with Prakriti body types among the Meitei adults of Manipur, India. Ann. Hum. Biol. 2021, 48(2), 160–5. [Google Scholar] [CrossRef]
- *1Chaithrashree, S. 2Shrinath M.; Vaidya. NIJA AND AGANTU VYADHI: CONCEPTUAL FRAMEWORK AND CLINICAL RELEVANCE IN AYURVEDA [Internet]. 2025. [Google Scholar] [CrossRef]
- Mukerji, M. Ayurgenomics-based frameworks in precision and integrative medicine: Translational opportunities. Camb. Prism. Precis Med. 2023, 1, e29. [Google Scholar] [CrossRef]
- Kawale, S.M.; Mhaske, R. A literary Review of Nidanapanchaka of Chhardi Vyadhi. Natl. J. Res. Ayurved Sci. 2018, 6(5th). [Google Scholar] [CrossRef]
- Ranade, M.A. Ayurgenomics – A narrative review. BLDE Univ. J. Health Sci. 2024, 9(1), 91–4. [Google Scholar] [CrossRef]
- Ghodke, Y.; Joshi, K.; Patwardhan, B. Traditional Medicine to Modern Pharmacogenomics: Ayurveda Prakriti Type and CYP2C19 Gene Polymorphism Associated with the Metabolic Variability. Evid. Based Complement Altern. Med. 2011, 2011(1), 249528. [Google Scholar] [CrossRef]
- Van Eck, N.J.; Waltman, L. Software survey: VOSviewer, a computer program for bibliometric mapping. Scientometrics 2010, 84(2), 523–38. [Google Scholar] [CrossRef]
- Dey, S.; Pahwa, P. Prakriti and its associations with metabolism, chronic diseases, and genotypes: Possibilities of new born screening and a lifetime of personalized prevention. J. Ayurveda Integr. Med. 2014, 5(1), 15. [Google Scholar] [CrossRef]
- Hankey, A. Establishing the Scientific Validity of Tridosha part 1: Doshas, Subdoshas and Dosha Prakritis. In Anc Sci Life; PubMed; PubMed Central, Jan 2010; Volume 29, 3, pp. 6–18. [Google Scholar] [PubMed] [PubMed Central]
- Maske, V.; Manwatkar, M. A review on analysis of Dosha predominance in patient of Shotha (oedema) with the help of Rupa (symptoms). J. Ayurveda Integr. Med. Sci. 2023, 8(5), 135–9. [Google Scholar] [CrossRef]
- Nagashayana, N.; Sankarankutty, P.; Nampoothiri, M.R.V.; Mohan, P.K.; Mohanakumar, K.P. Association of l-DOPA with recovery following Ayurveda medication in Parkinson’s disease. J. Neurol. Sci. 2000, 176(2), 124–7. [Google Scholar] [CrossRef]
- Mukherjee, P.K.; Harwansh, R.K.; Bahadur, S.; Banerjee, S.; Kar, A.; Chanda, J.; Biswas, S.; Ahmmed, SkM; Katiyar, C.K. Development of Ayurveda – Tradition to trend. J. Ethnopharmacol. 2017, 197, 10–24. [Google Scholar] [CrossRef]
- Kumar Verma, A.; Kumar, V.; Singh, S.; Goswami BCh; Camps, I.; Sekar, A.; Yoon, S.; Lee, K.W. Repurposing potential of Ayurvedic medicinal plants derived active principles against SARS-CoV-2 associated target proteins revealed by molecular docking, molecular dynamics and MM-PBSA studies. BioMed Pharmacother. 2021, 137, 111356. [Google Scholar] [CrossRef]
- Eisenberg, D.M.; Davis, R.B.; Ettner, S.L.; Appel, S.; Wilkey, S.; Van Rompay, M.; Kessler, R.C. Trends in Alternative Medicine Use in the United States, 1990-1997: Results of a Follow-up National Survey. JAMA 1998, 280(18), 1569. [Google Scholar] [CrossRef]
- Glossary of Indian Medicinal Plants. R. N. Chopra, S. L. Nayar, I. C. Chopra. Q Rev Biol. 1958 Jun;33(2):156–156. [CrossRef]
- Chopra, A.; Doiphode, V.V. Ayurvedic medicine: core concept, therapeutic principles, and current relevance. Med. Clin. North Am. 2002, 86(1), 75–89. [Google Scholar] [CrossRef]
- Patwardhan, B.; Mashelkar, R.A. Traditional medicine-inspired approaches to drug discovery: can Ayurveda show the way forward? Drug Discov. Today 2009, 14(15–16), 804–11. [Google Scholar] [CrossRef]
- Patwardhan, B.; Warude, D.; Pushpangadan, P.; Bhatt, N. Ayurveda and Traditional Chinese Medicine: A Comparative Overview. Evid. Based Complement Altern. Med. 2005, 2(4), 465–73. [Google Scholar] [CrossRef]
- Morandi, A.; Minniti, M.C.; Nambi, A.N. Translating Ayurvedic concepts to modern drug structures: A novel paradigm. J. Ayurveda Integr. Med. 2025, 16(5), 101203. [Google Scholar] [CrossRef]
- Gogte, V.M. Ayurvedic Pharmacology and Therapeutic Uses of Medicinal Plants (dravyagunavignyan). 2000. [Google Scholar]
- Balkrishna, A.; Sinha, S.; Bhattacharya, K.; Varshney, A. Twenty-eight days of repeated dose sub-acute toxicological evaluation of polyherbal Ayurvedic medicine BPGrit in Sprague–Dawley rats. J. Appl. Toxicol. 2024, 44(9), 1372–87. [Google Scholar] [CrossRef]
- Balkrishna, A.; Sinha, S.; Pandey, A.; Singh, S.; Joshi, M.; Singh, R.; Varshney, A. In mouse model of mixed granulocytic asthma with corticosteroid refractoriness, Bronchom mitigates airway hyperresponsiveness, inflammation and airway remodeling. Mol. Med. 2024, 30(1), 120. [Google Scholar] [CrossRef]
- Balkrishna, A.; Tiwari, A.; Maity, M.; Tomer, M.; Varshney, Y.; Dev, R.; Sinha, S.; Varshney, A. Co-administration of Ayurvedic medicines Arshogrit and Jatyadi Ghrit, attenuate croton oil-induced hemorrhoids in rat model of recto-anal inflammation by modulating TNF-α and IL-1β levels. Drug Dev. Ind. Pharm. 2024, 50(11), 938–51. [Google Scholar] [CrossRef]
- Saggam, A.; Kale, P.; Shengule, S.; Patil, D.; Gautam, M.; Tillu, G.; Joshi, K.; Gairola, S.; Patwardhan, B. Ayurveda-based Botanicals as Therapeutic Adjuvants in Paclitaxel-induced Myelosuppression. Front Pharmacol. 2022, 13, 835616. [Google Scholar] [CrossRef]
- Balkrishna, A.; Sinha, S.; Karumuri, S.; Maity, M.; Dev, R.; Varshney, A. Bronchom assuages airway hyperresponsiveness in house dust mite-induced mouse model of allergic asthma and moderates goblet cell metaplasia, sub-epithelial fibrosis along with changes in Th2 cytokines and chemokines. Front Immunol. 2024, 15, 1384697. [Google Scholar] [CrossRef]
- Banerjee, S.; Kar, A.; Mukherjee, P.K.; Haldar, P.K.; Sharma, N.; Katiyar, C.K. Immunoprotective potential of Ayurvedic herb Kalmegh ( Andrographis paniculata ) against respiratory viral infections – LC–MS/MS and network pharmacology analysis. Phytochem Anal. 2021, 32(4), 629–39. [Google Scholar] [CrossRef]
- Khatua, D.; Sekh, A.A.; Kutum, R.; Mukherji, M.; Prasher, B.; Kar, S. Classification of Ayurveda constitution types: a deep learning approach. Soft Comput 2023, 27(9), 5309–17. [Google Scholar] [CrossRef]
Figure 1.
PRISMA flow diagram illustrating the identification, screening, eligibility and inclusion stages of the bibliometric corpus. The Boolean strategy combined Ayurvedic terminology with biomedical descriptors under the constraint PUBYEAR > 1990 AND PUBYEAR < 2025, yielding a final corpus of 2,027 research articles spanning 1991–2024.
Figure 1.
PRISMA flow diagram illustrating the identification, screening, eligibility and inclusion stages of the bibliometric corpus. The Boolean strategy combined Ayurvedic terminology with biomedical descriptors under the constraint PUBYEAR > 1990 AND PUBYEAR < 2025, yielding a final corpus of 2,027 research articles spanning 1991–2024.
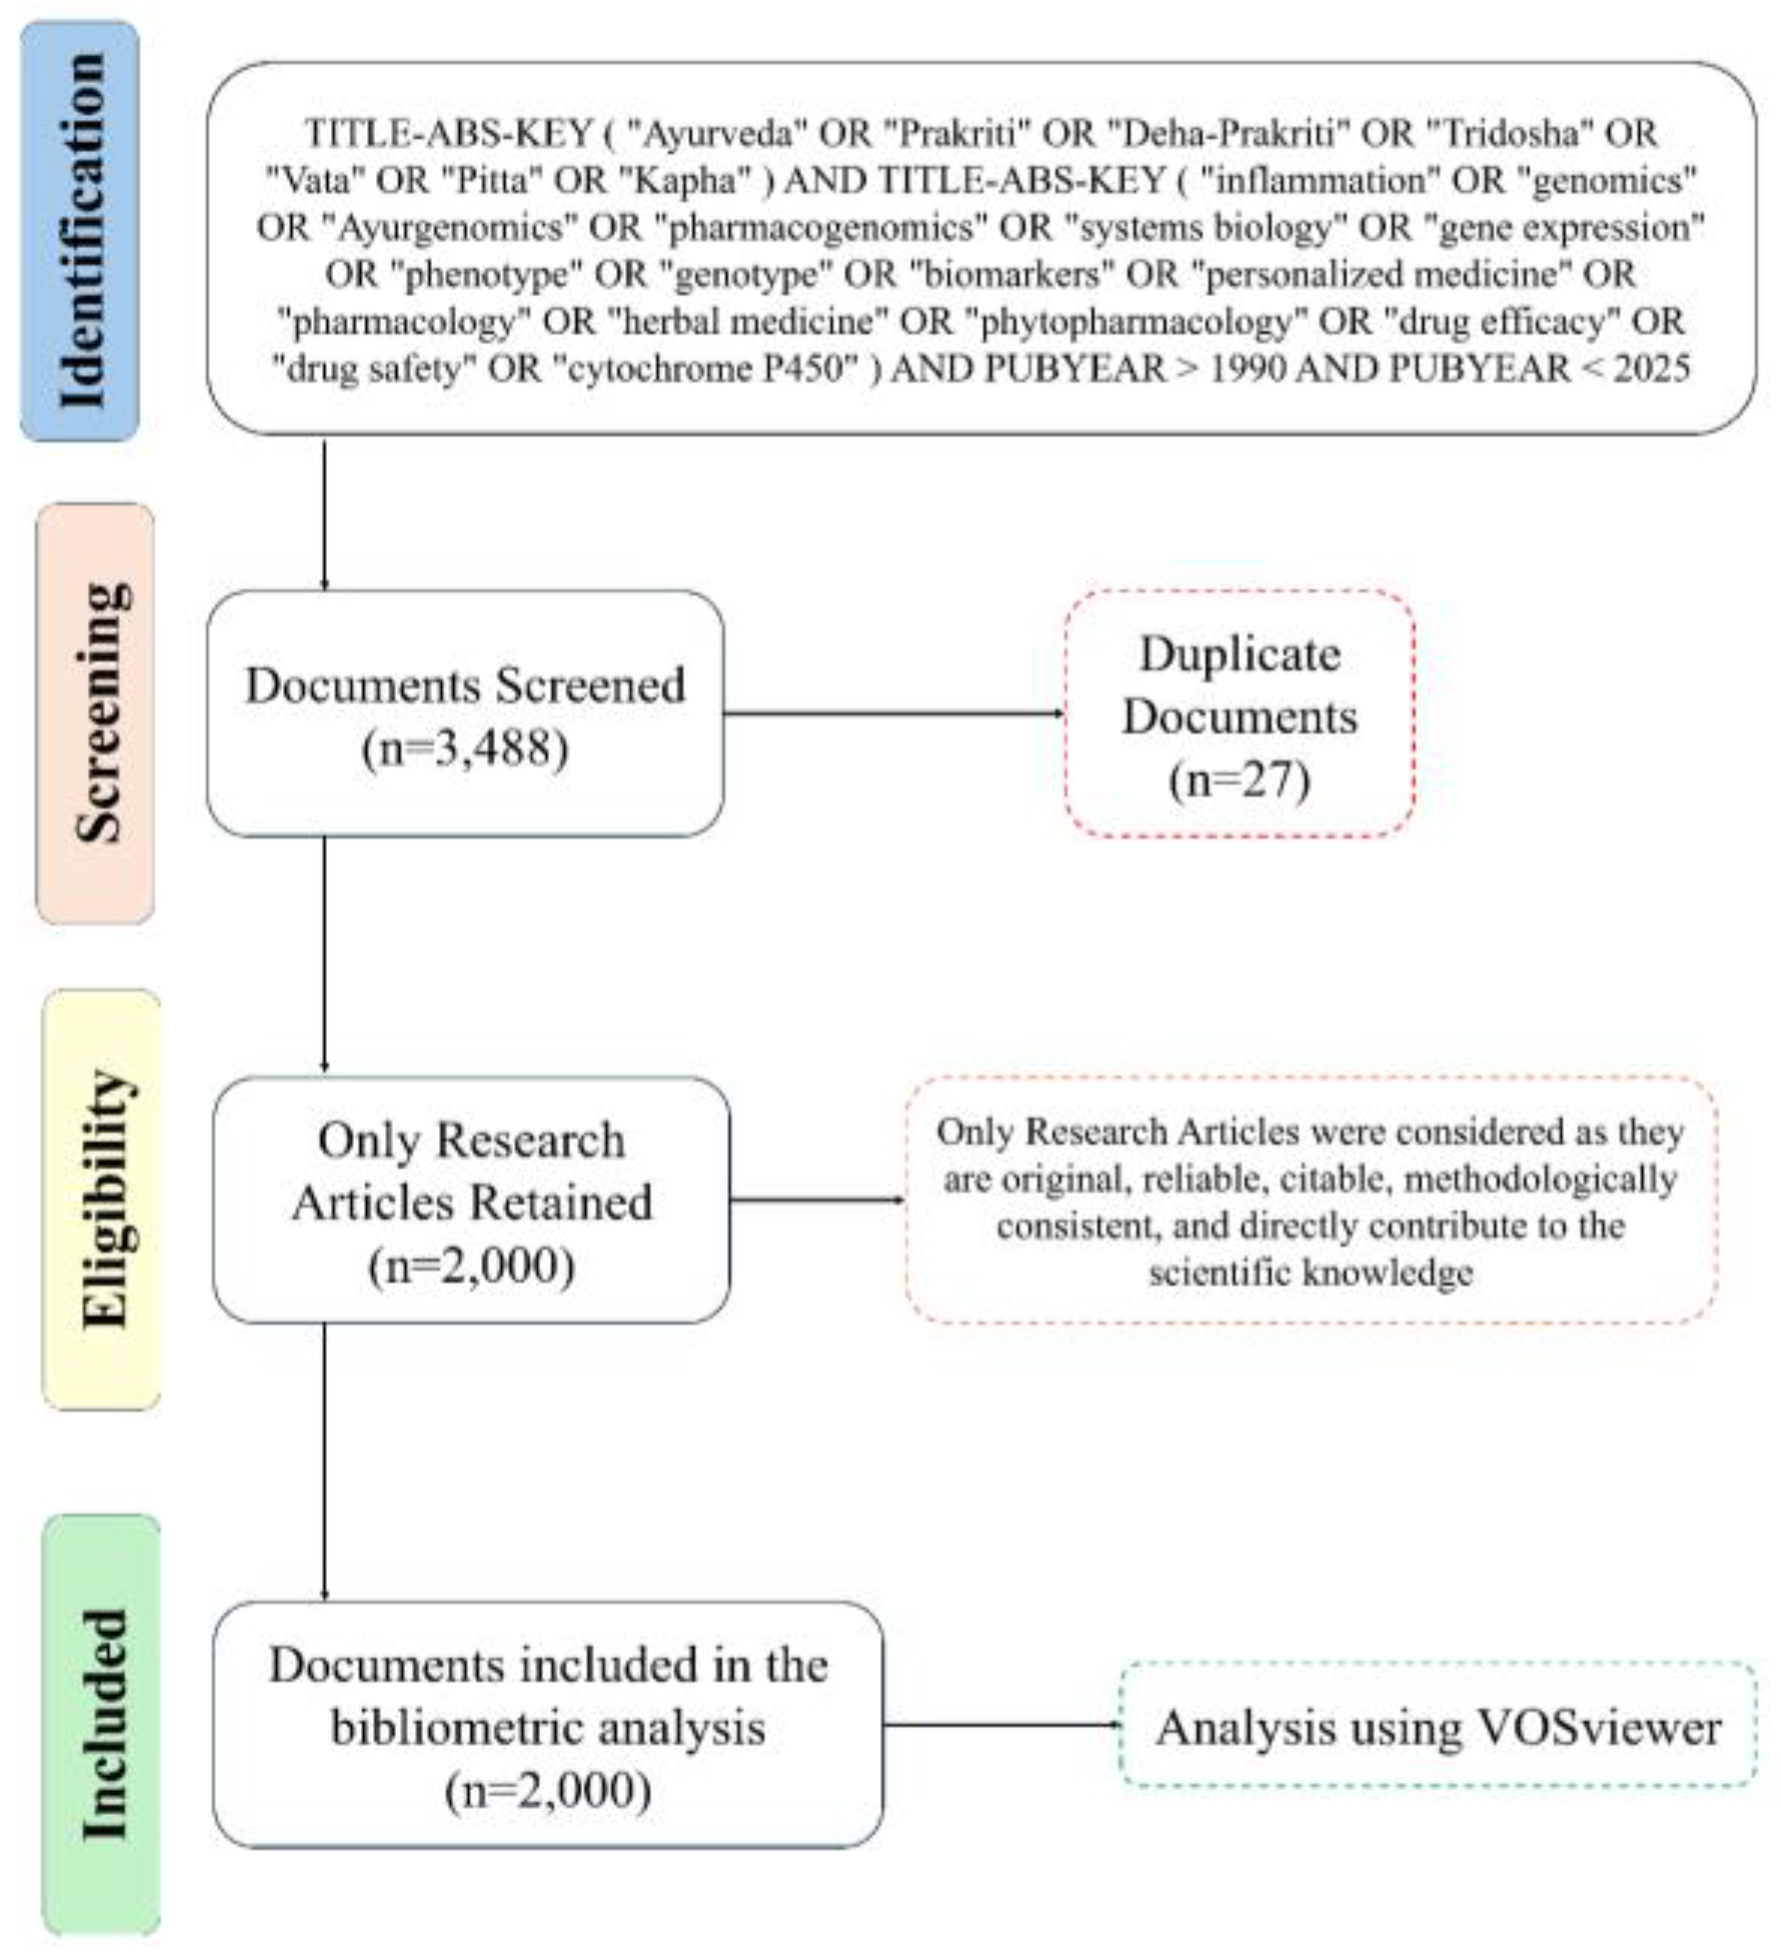
Figure 2.
Documents published per year disaggregated by constituent search keyword. This panel reports per-keyword counts; aggregate annual output for the full corpus is presented in Figure 10A.
Figure 2.
Documents published per year disaggregated by constituent search keyword. This panel reports per-keyword counts; aggregate annual output for the full corpus is presented in Figure 10A.
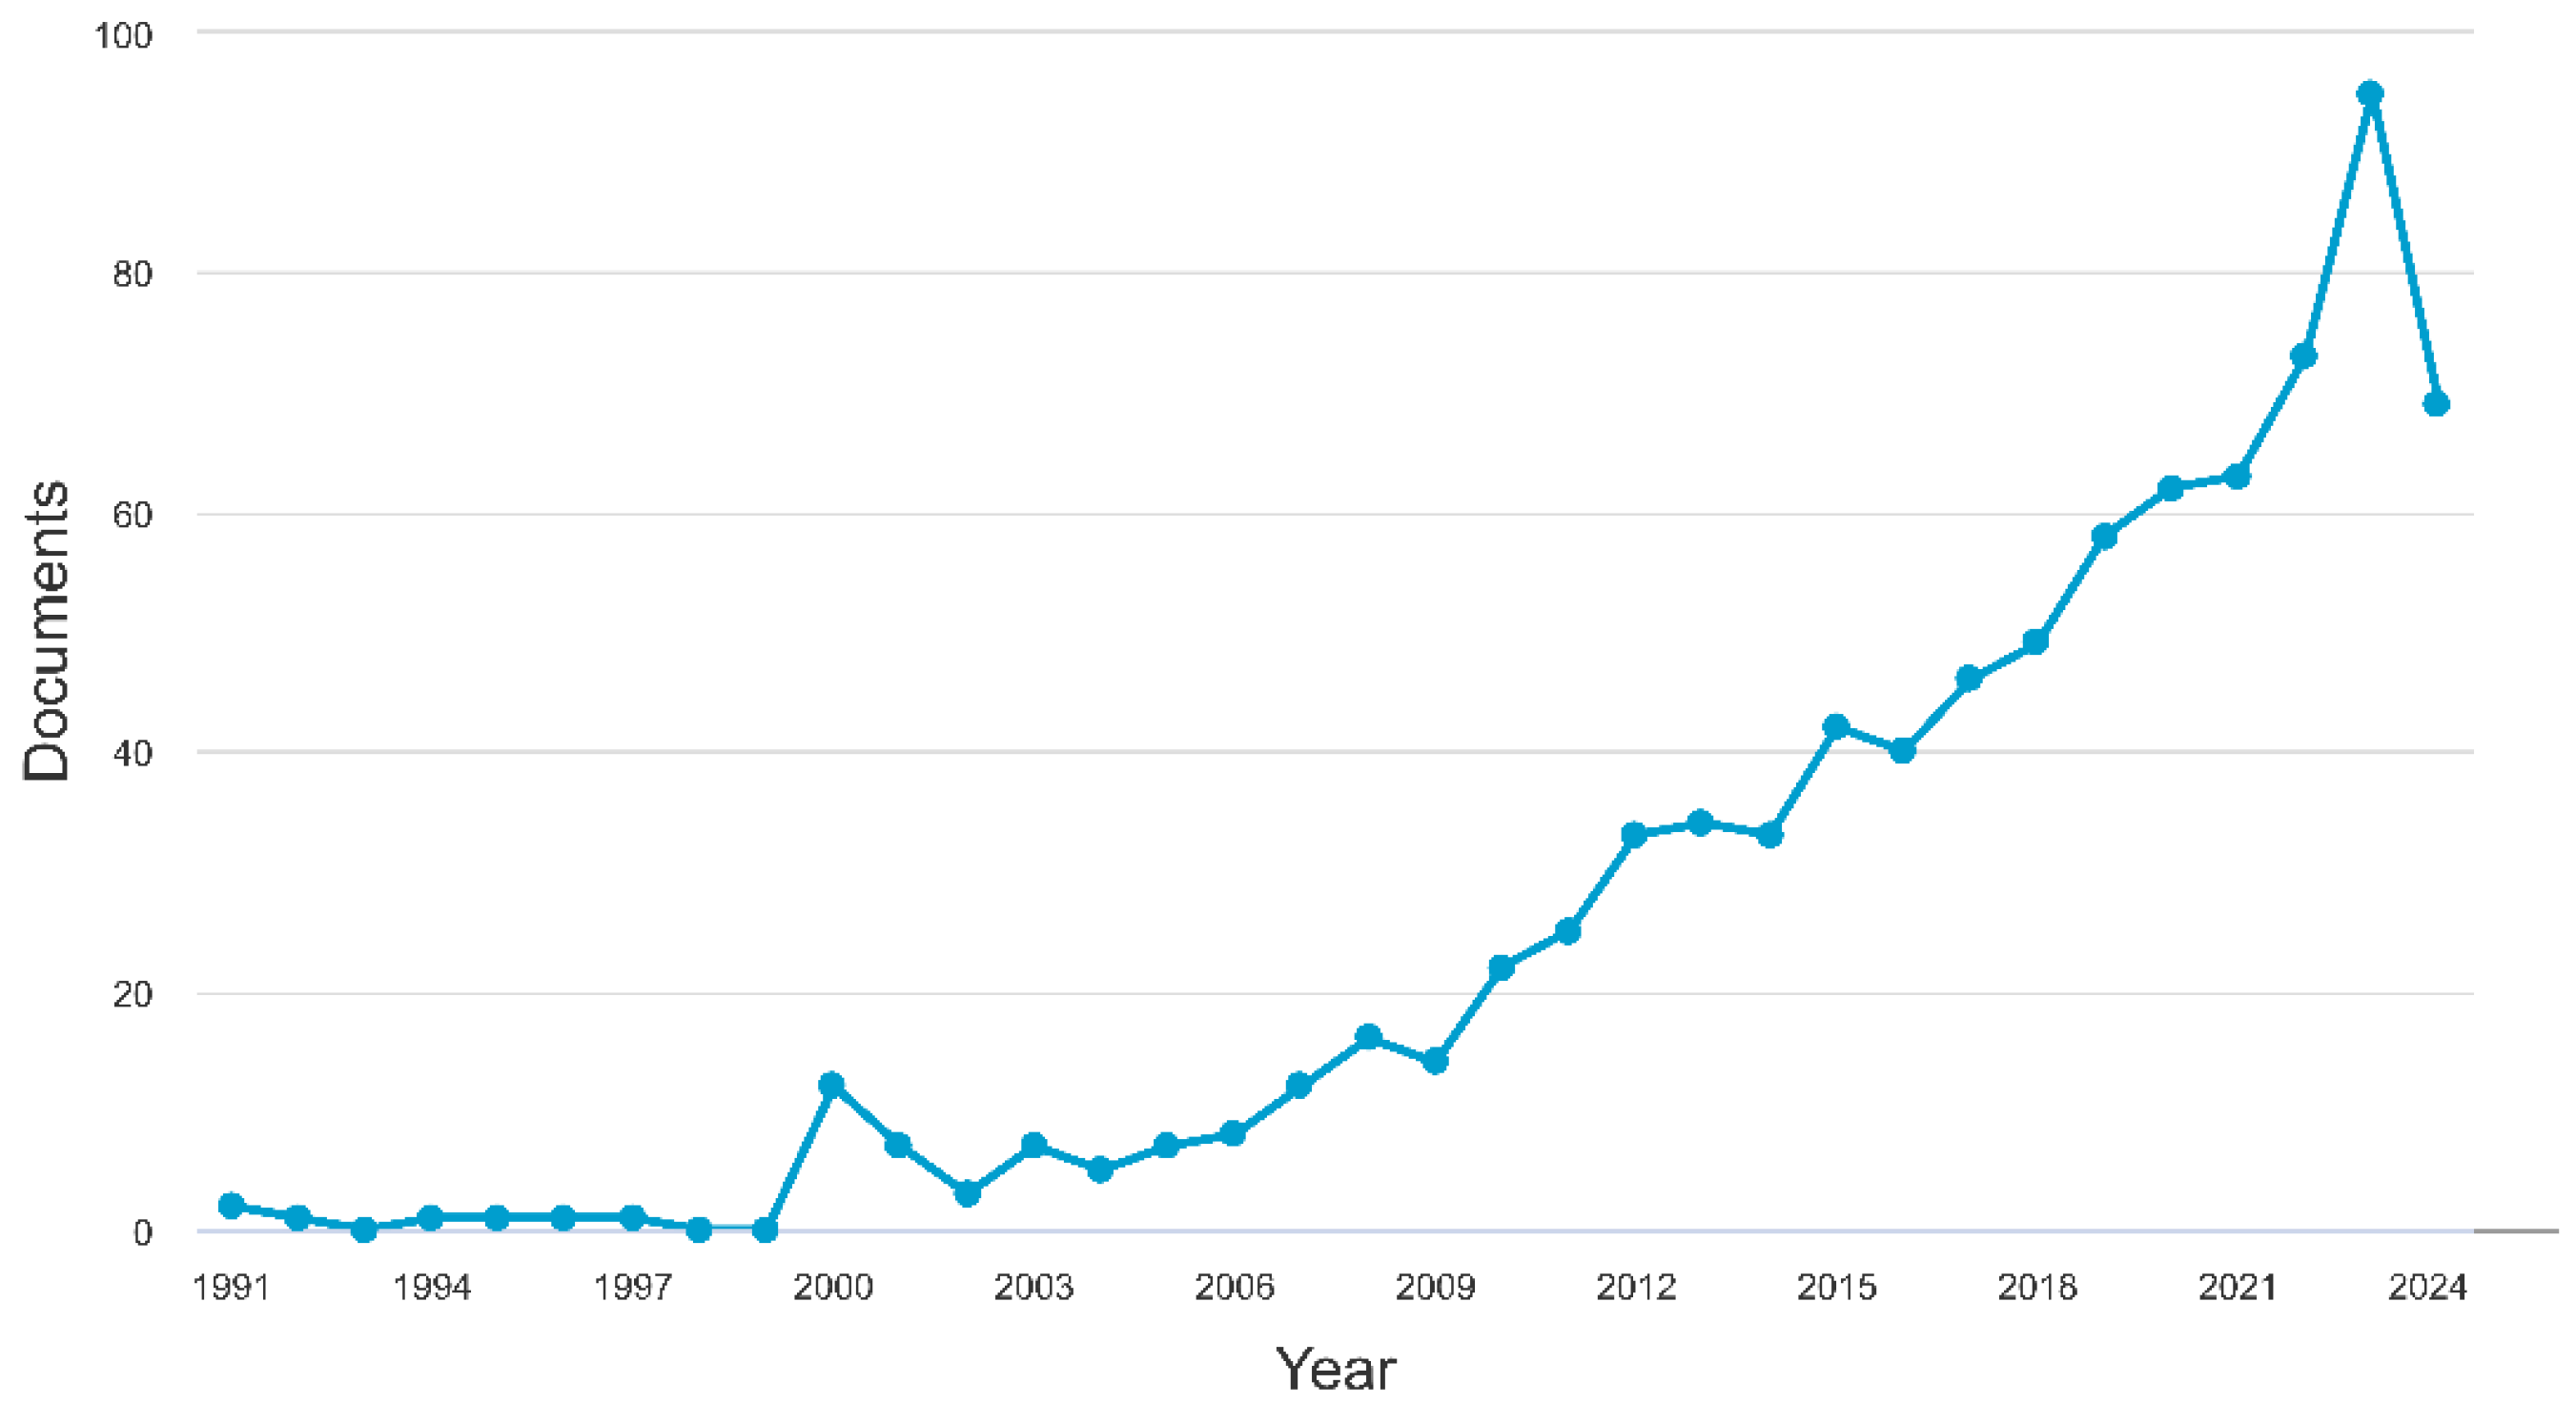
Figure 3.
Distribution of the corpus across Scopus subject areas. Percentages are computed on subject-area assignments, which are non-exclusive; a single document may be classified under multiple areas.
Figure 3.
Distribution of the corpus across Scopus subject areas. Percentages are computed on subject-area assignments, which are non-exclusive; a single document may be classified under multiple areas.
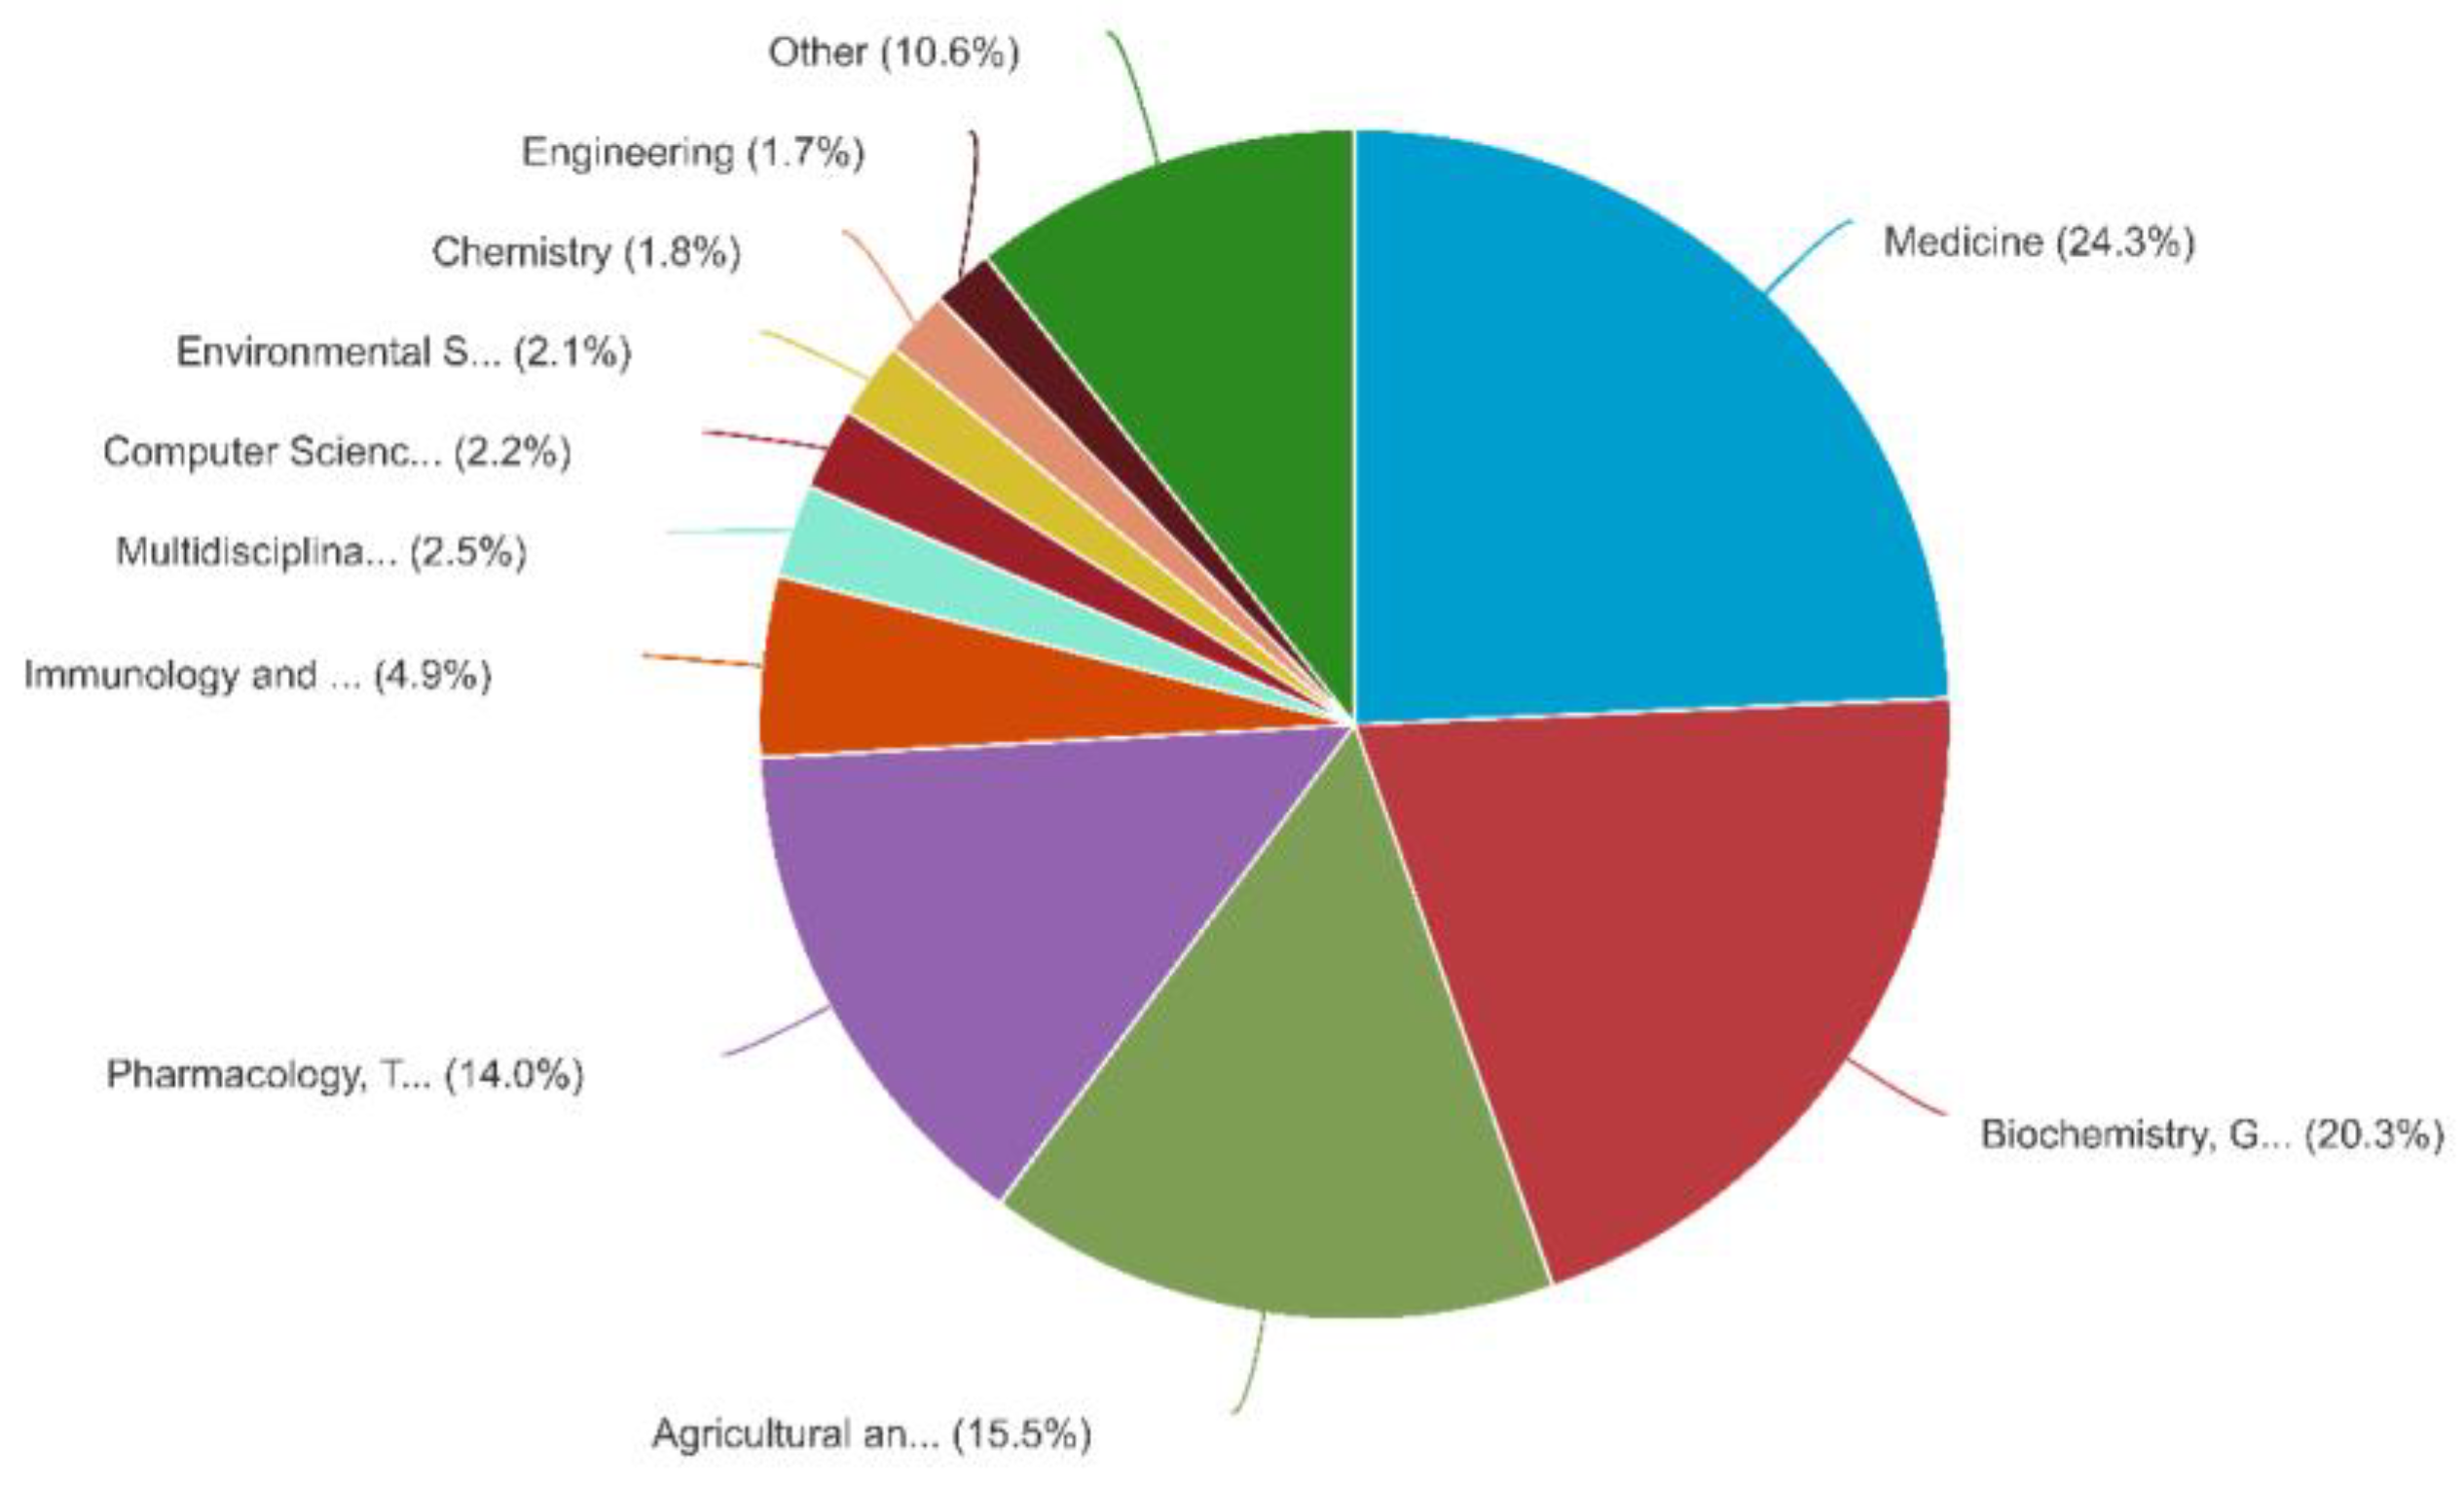
Figure 4.
Co-citation network of the most frequently co-cited sources. Node size reflects citation impact and link thickness the strength of co-citation. Colour-coded clusters denote thematic groupings.
Figure 4.
Co-citation network of the most frequently co-cited sources. Node size reflects citation impact and link thickness the strength of co-citation. Colour-coded clusters denote thematic groupings.
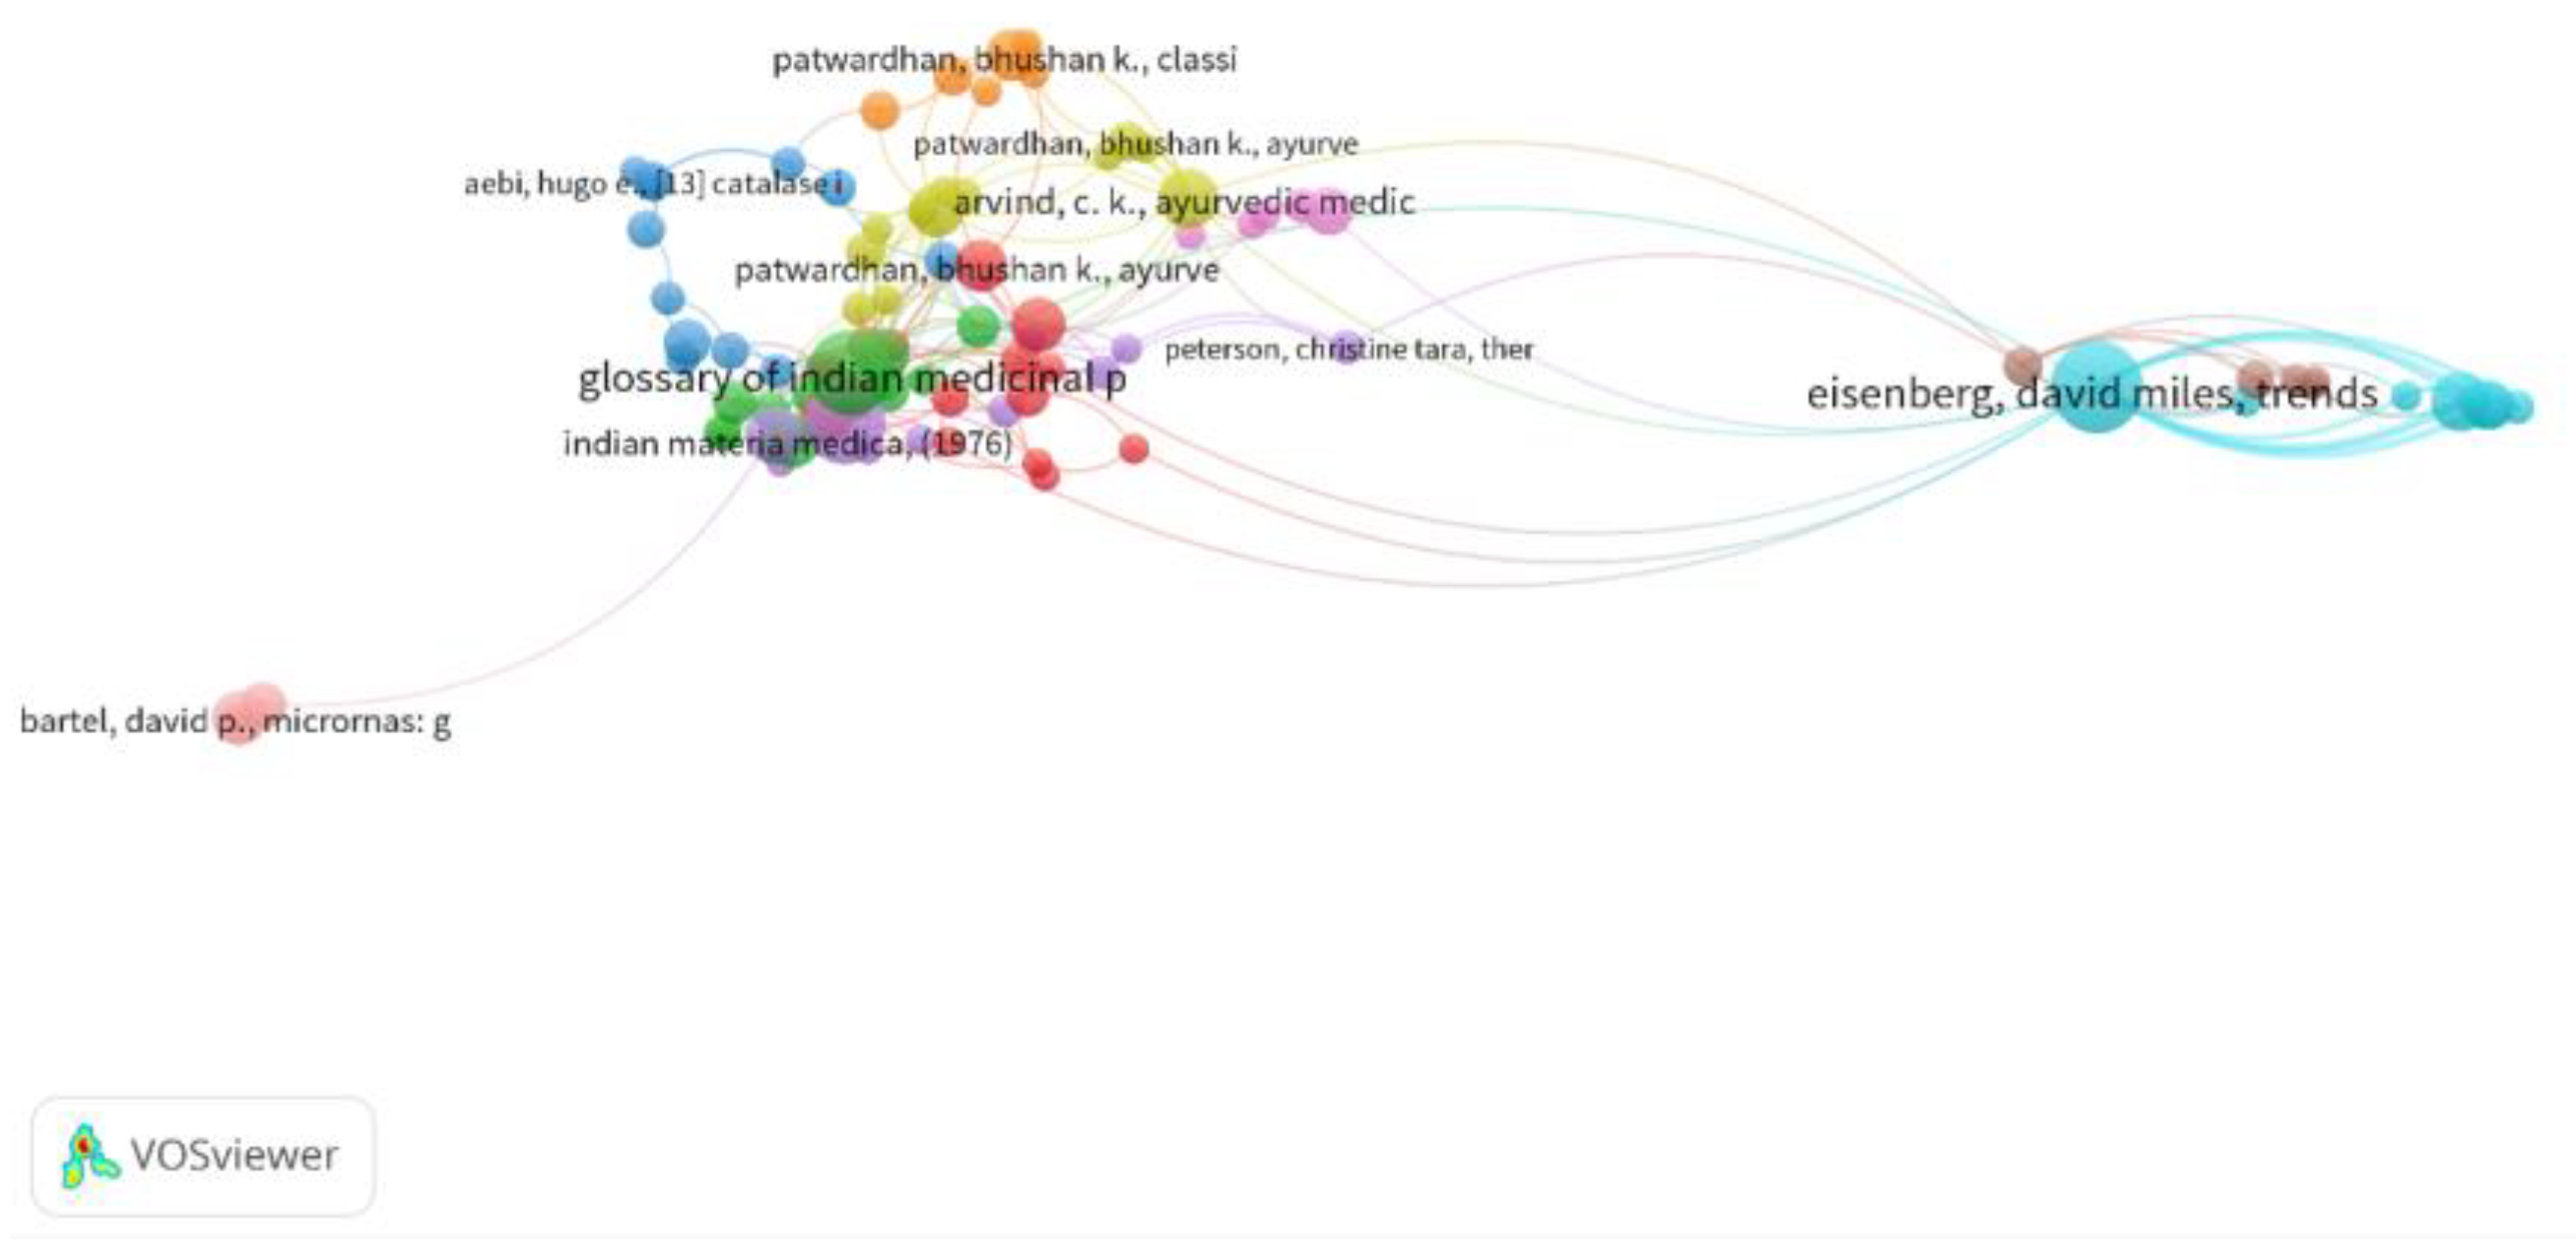
Figure 5.
Institutional landscape: (A) top 15 contributing institutions by publication output; (B) co-authorship network of inter-institutional and departmental collaborations; (C) bibliographic coupling network showing thematic alignment. Networks were constructed in VOSviewer using full counting.
Figure 5.
Institutional landscape: (A) top 15 contributing institutions by publication output; (B) co-authorship network of inter-institutional and departmental collaborations; (C) bibliographic coupling network showing thematic alignment. Networks were constructed in VOSviewer using full counting.
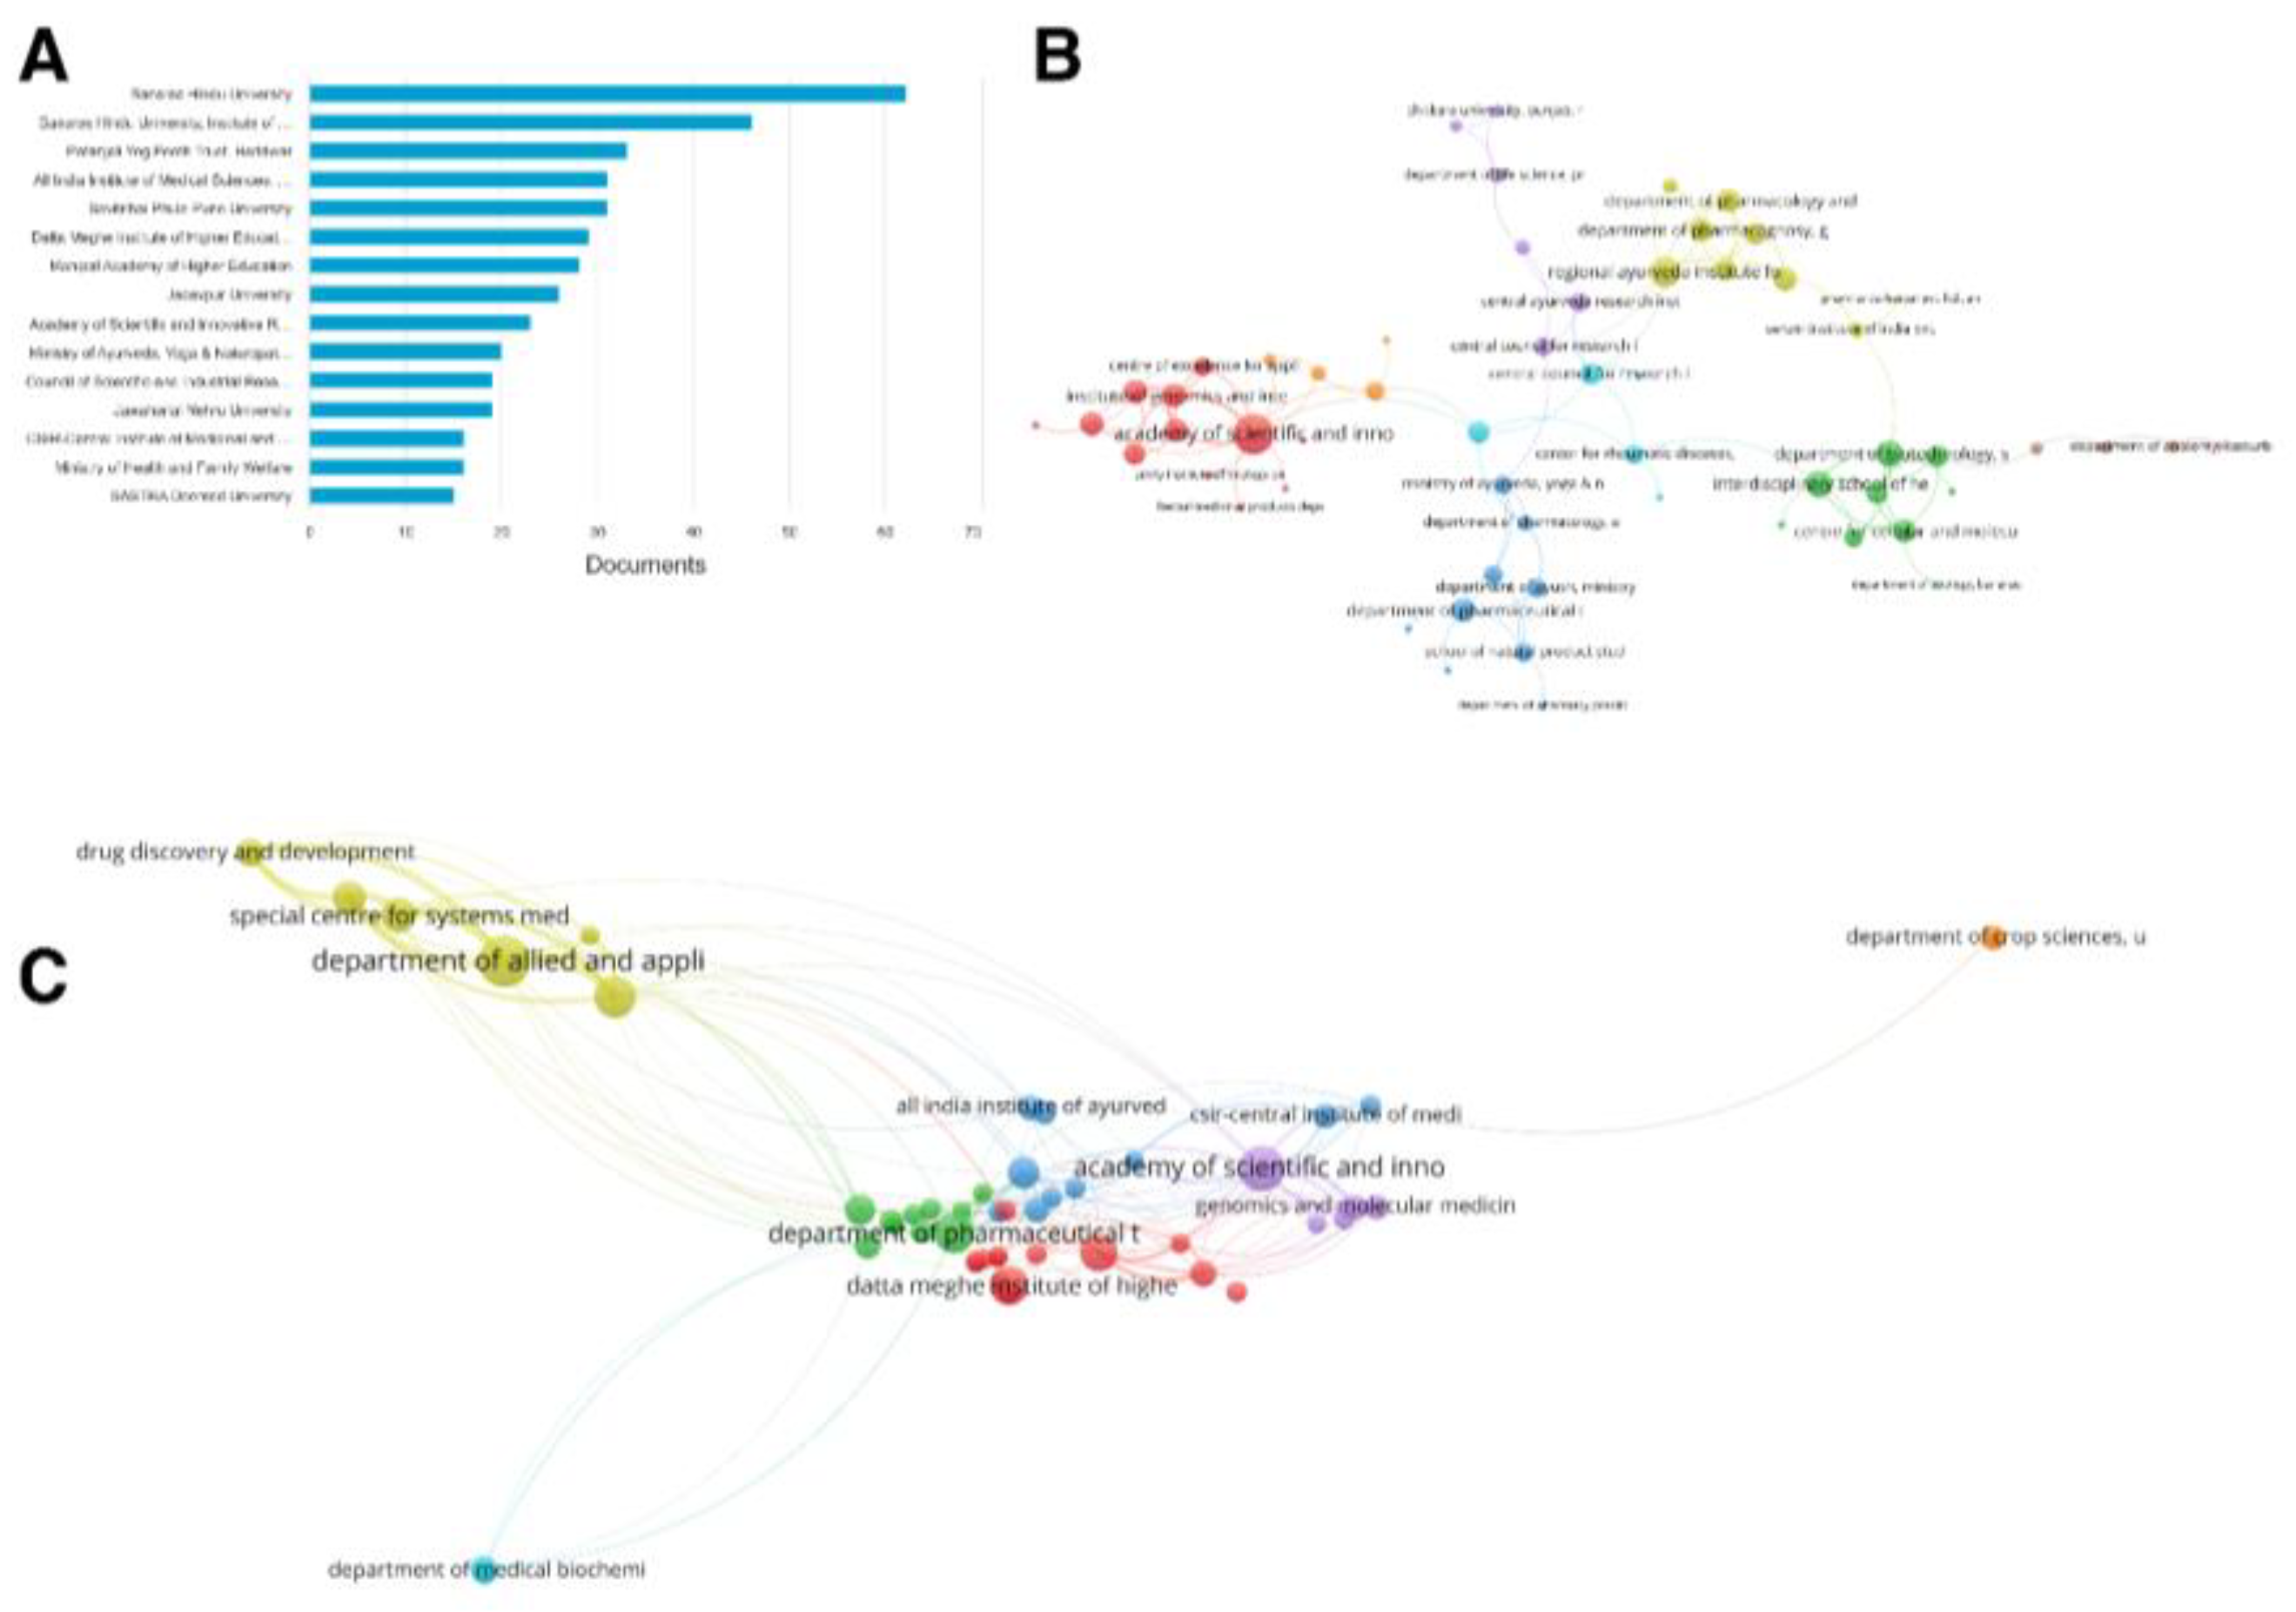
Figure 6.
Global collaboration patterns: (A) top 15 countries by publication output; (B) country-level citation network; (C) bibliographic coupling network of contributing nations. Networks were constructed in VOSviewer using full counting. Quantitative country-level indicators, including single- and multi-country publication counts, are given in Table 8 and Figure 12.
Figure 6.
Global collaboration patterns: (A) top 15 countries by publication output; (B) country-level citation network; (C) bibliographic coupling network of contributing nations. Networks were constructed in VOSviewer using full counting. Quantitative country-level indicators, including single- and multi-country publication counts, are given in Table 8 and Figure 12.
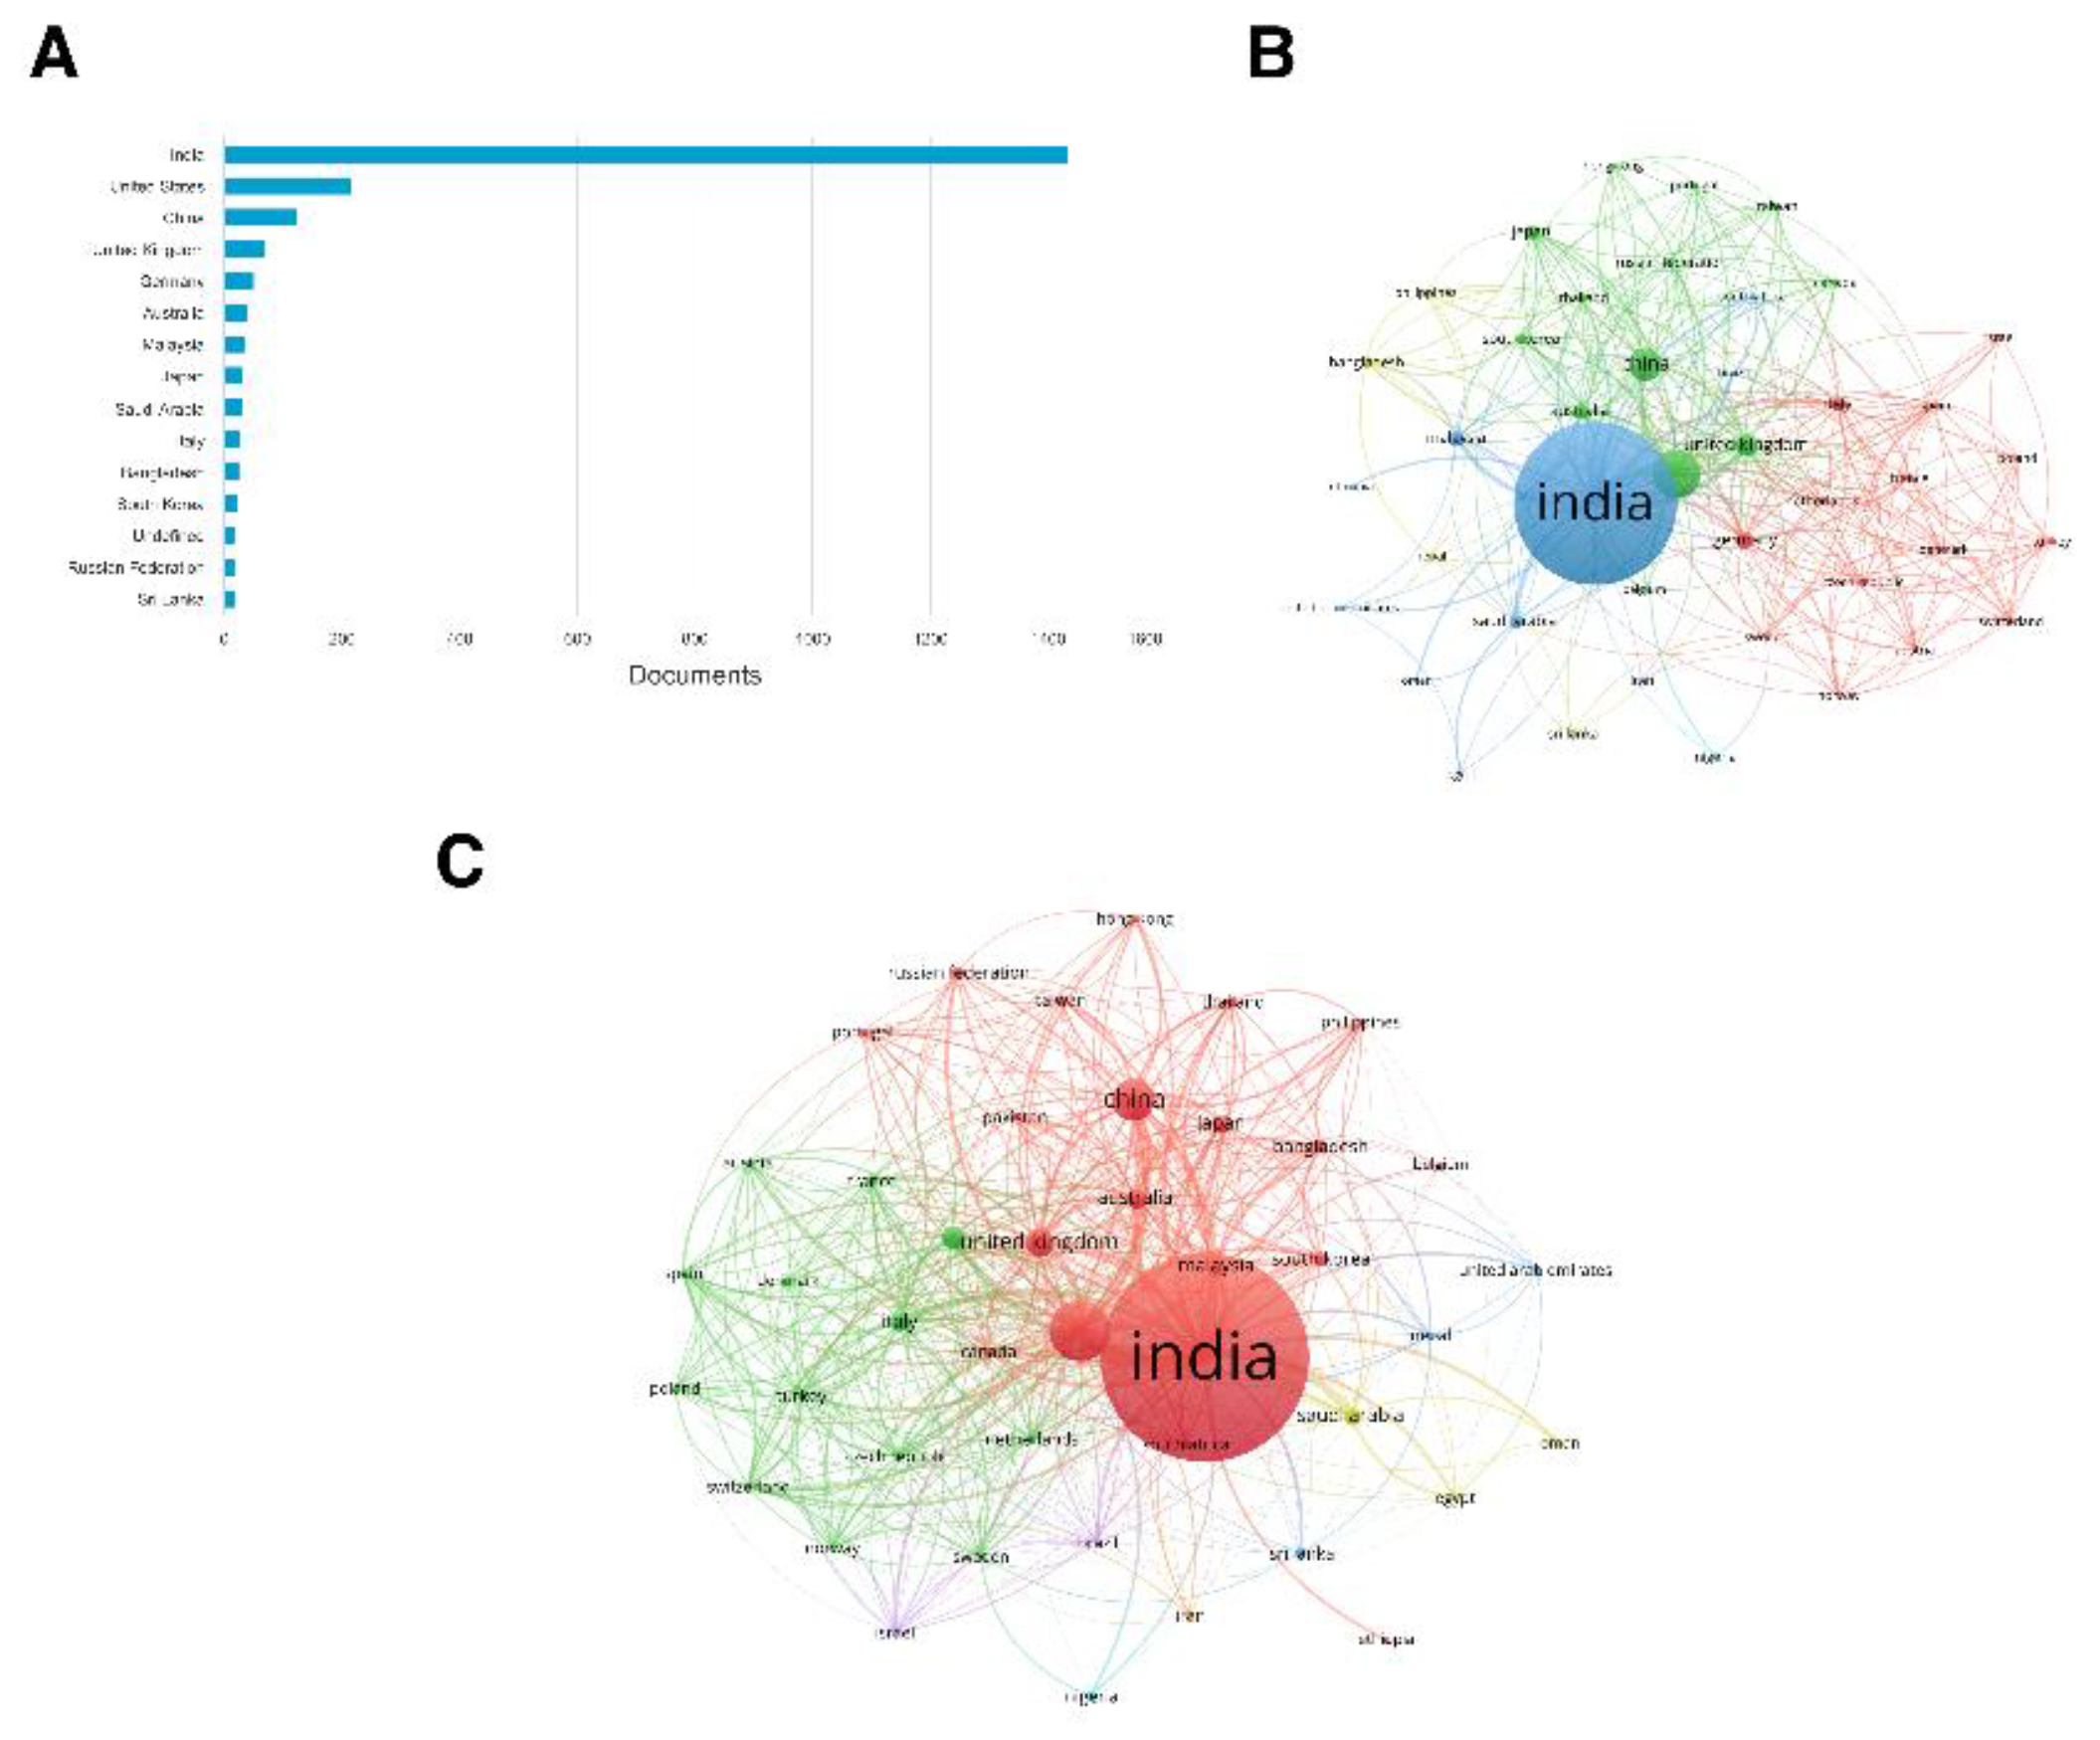
Figure 7.
Author keyword co-occurrence network constructed in VOSviewer. A quantitative reconstruction of this network with Louvain community detection and centrality statistics is presented in Figure 13A.
Figure 7.
Author keyword co-occurrence network constructed in VOSviewer. A quantitative reconstruction of this network with Louvain community detection and centrality statistics is presented in Figure 13A.
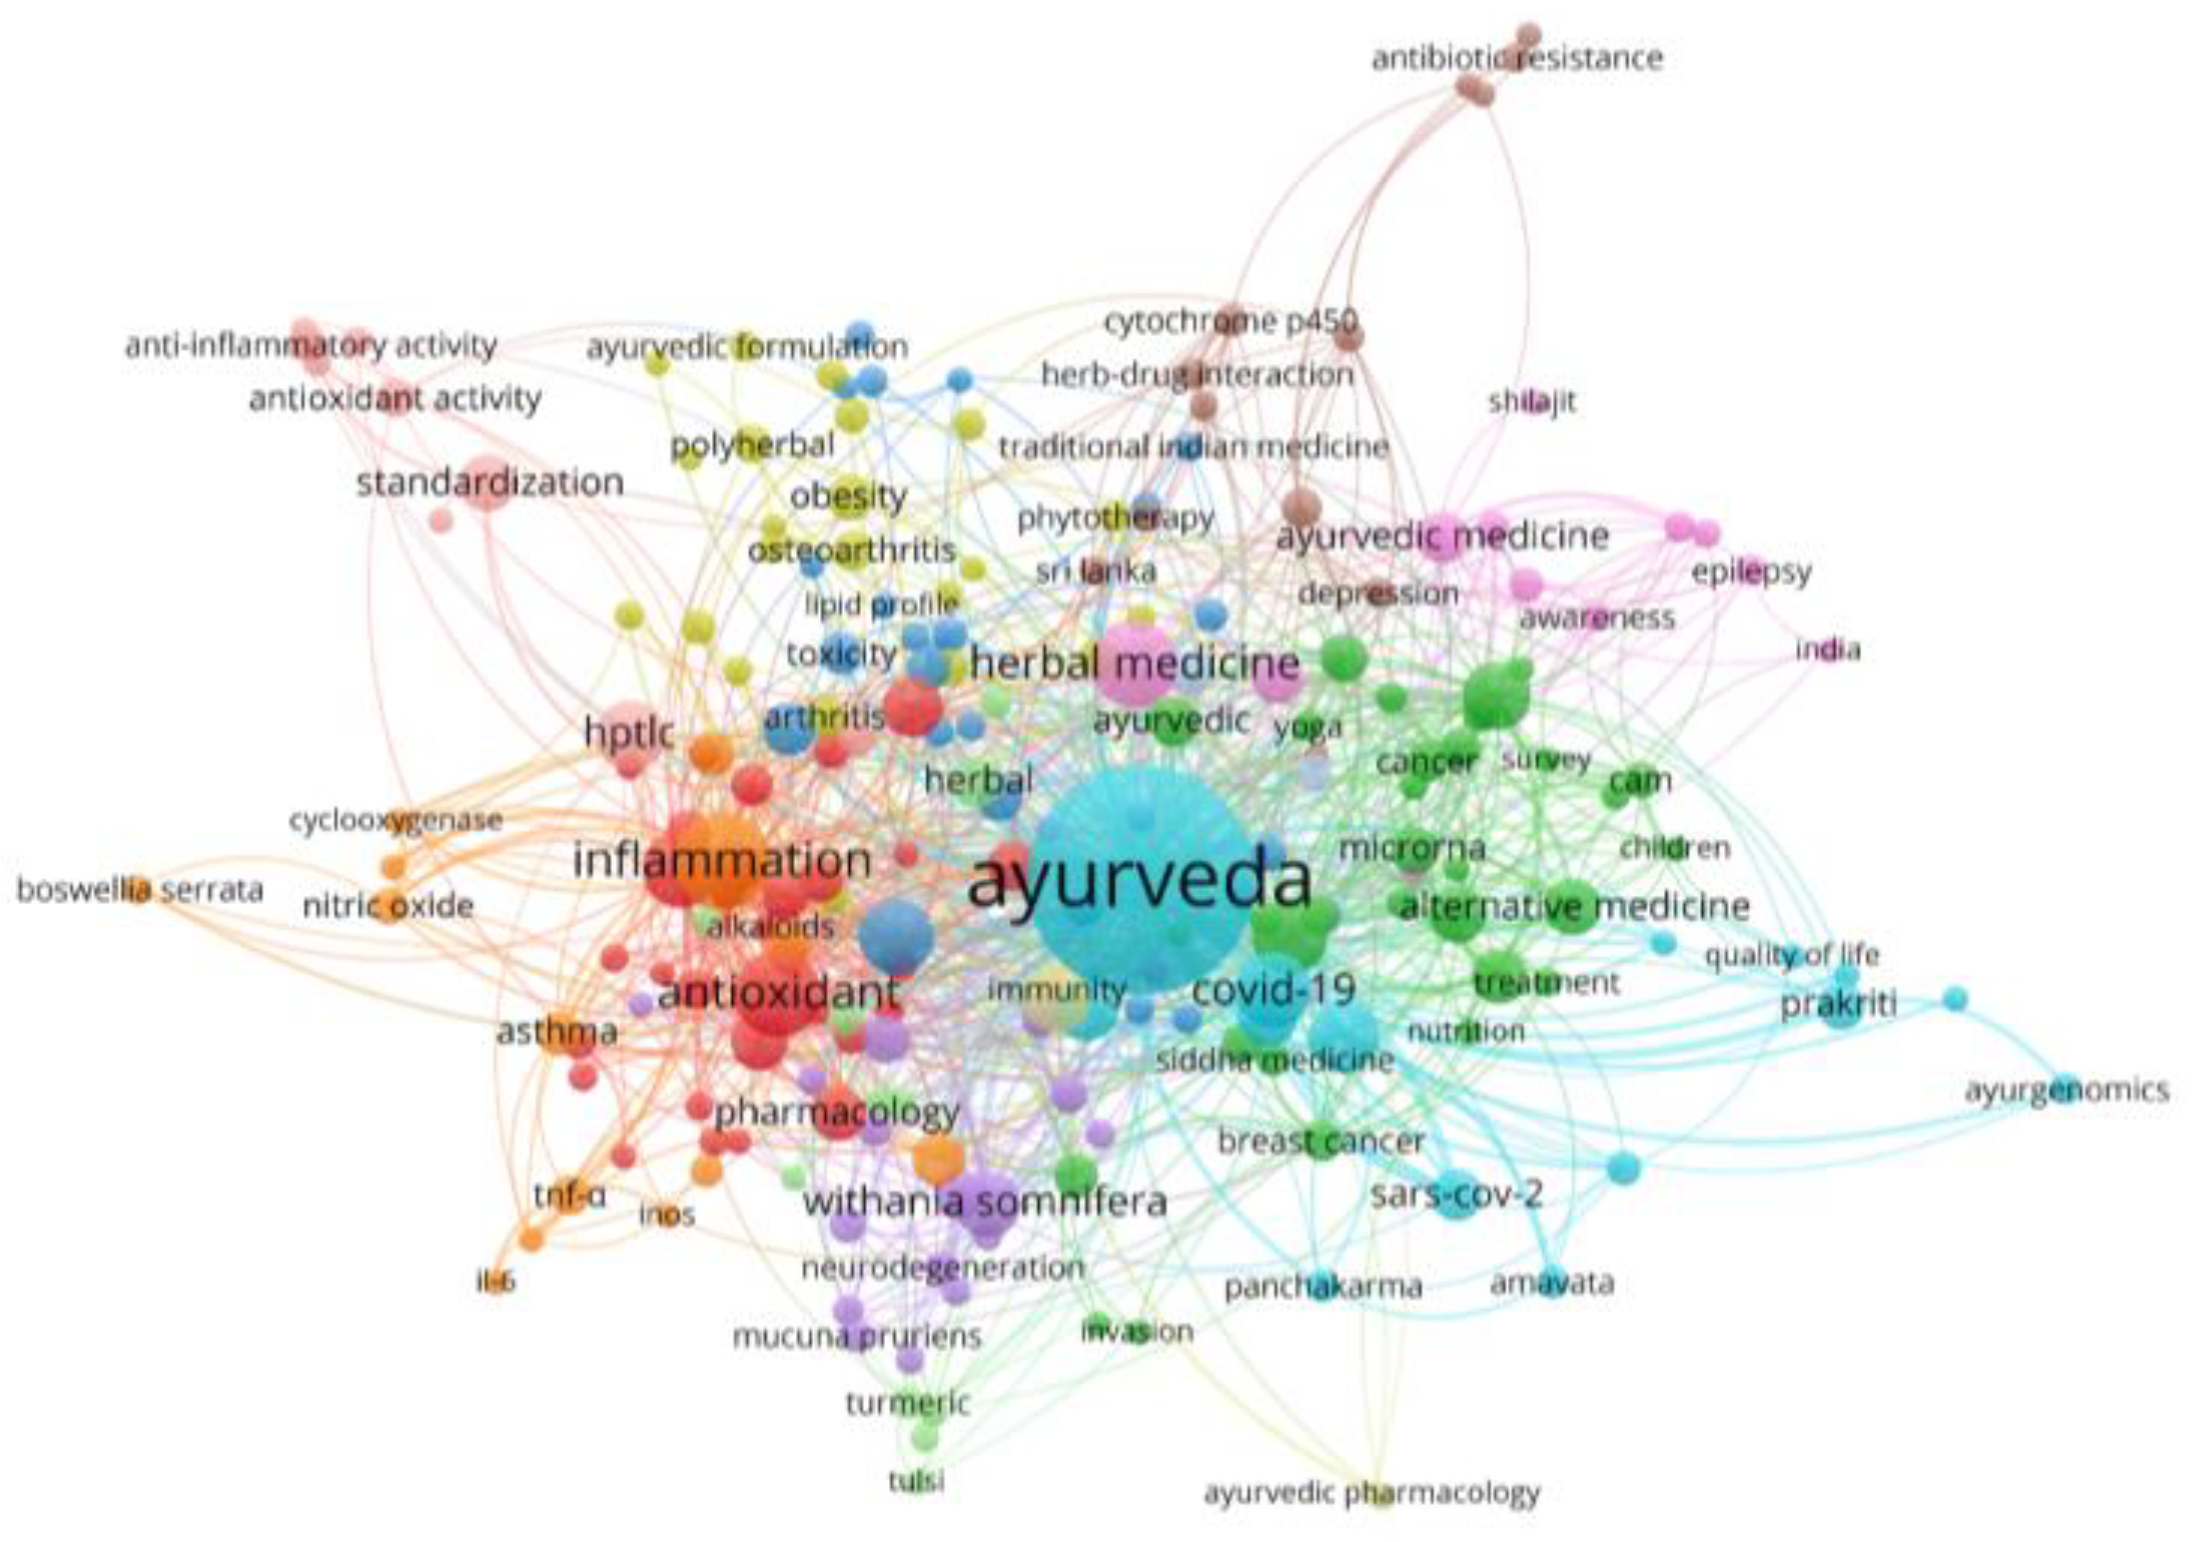
Figure 8.
Author-level networks: (A) productivity; (B) co-authorship; (C) bibliographic coupling; (D) co-citation. A minimum threshold of five publications per author was applied using full counting.
Figure 8.
Author-level networks: (A) productivity; (B) co-authorship; (C) bibliographic coupling; (D) co-citation. A minimum threshold of five publications per author was applied using full counting.
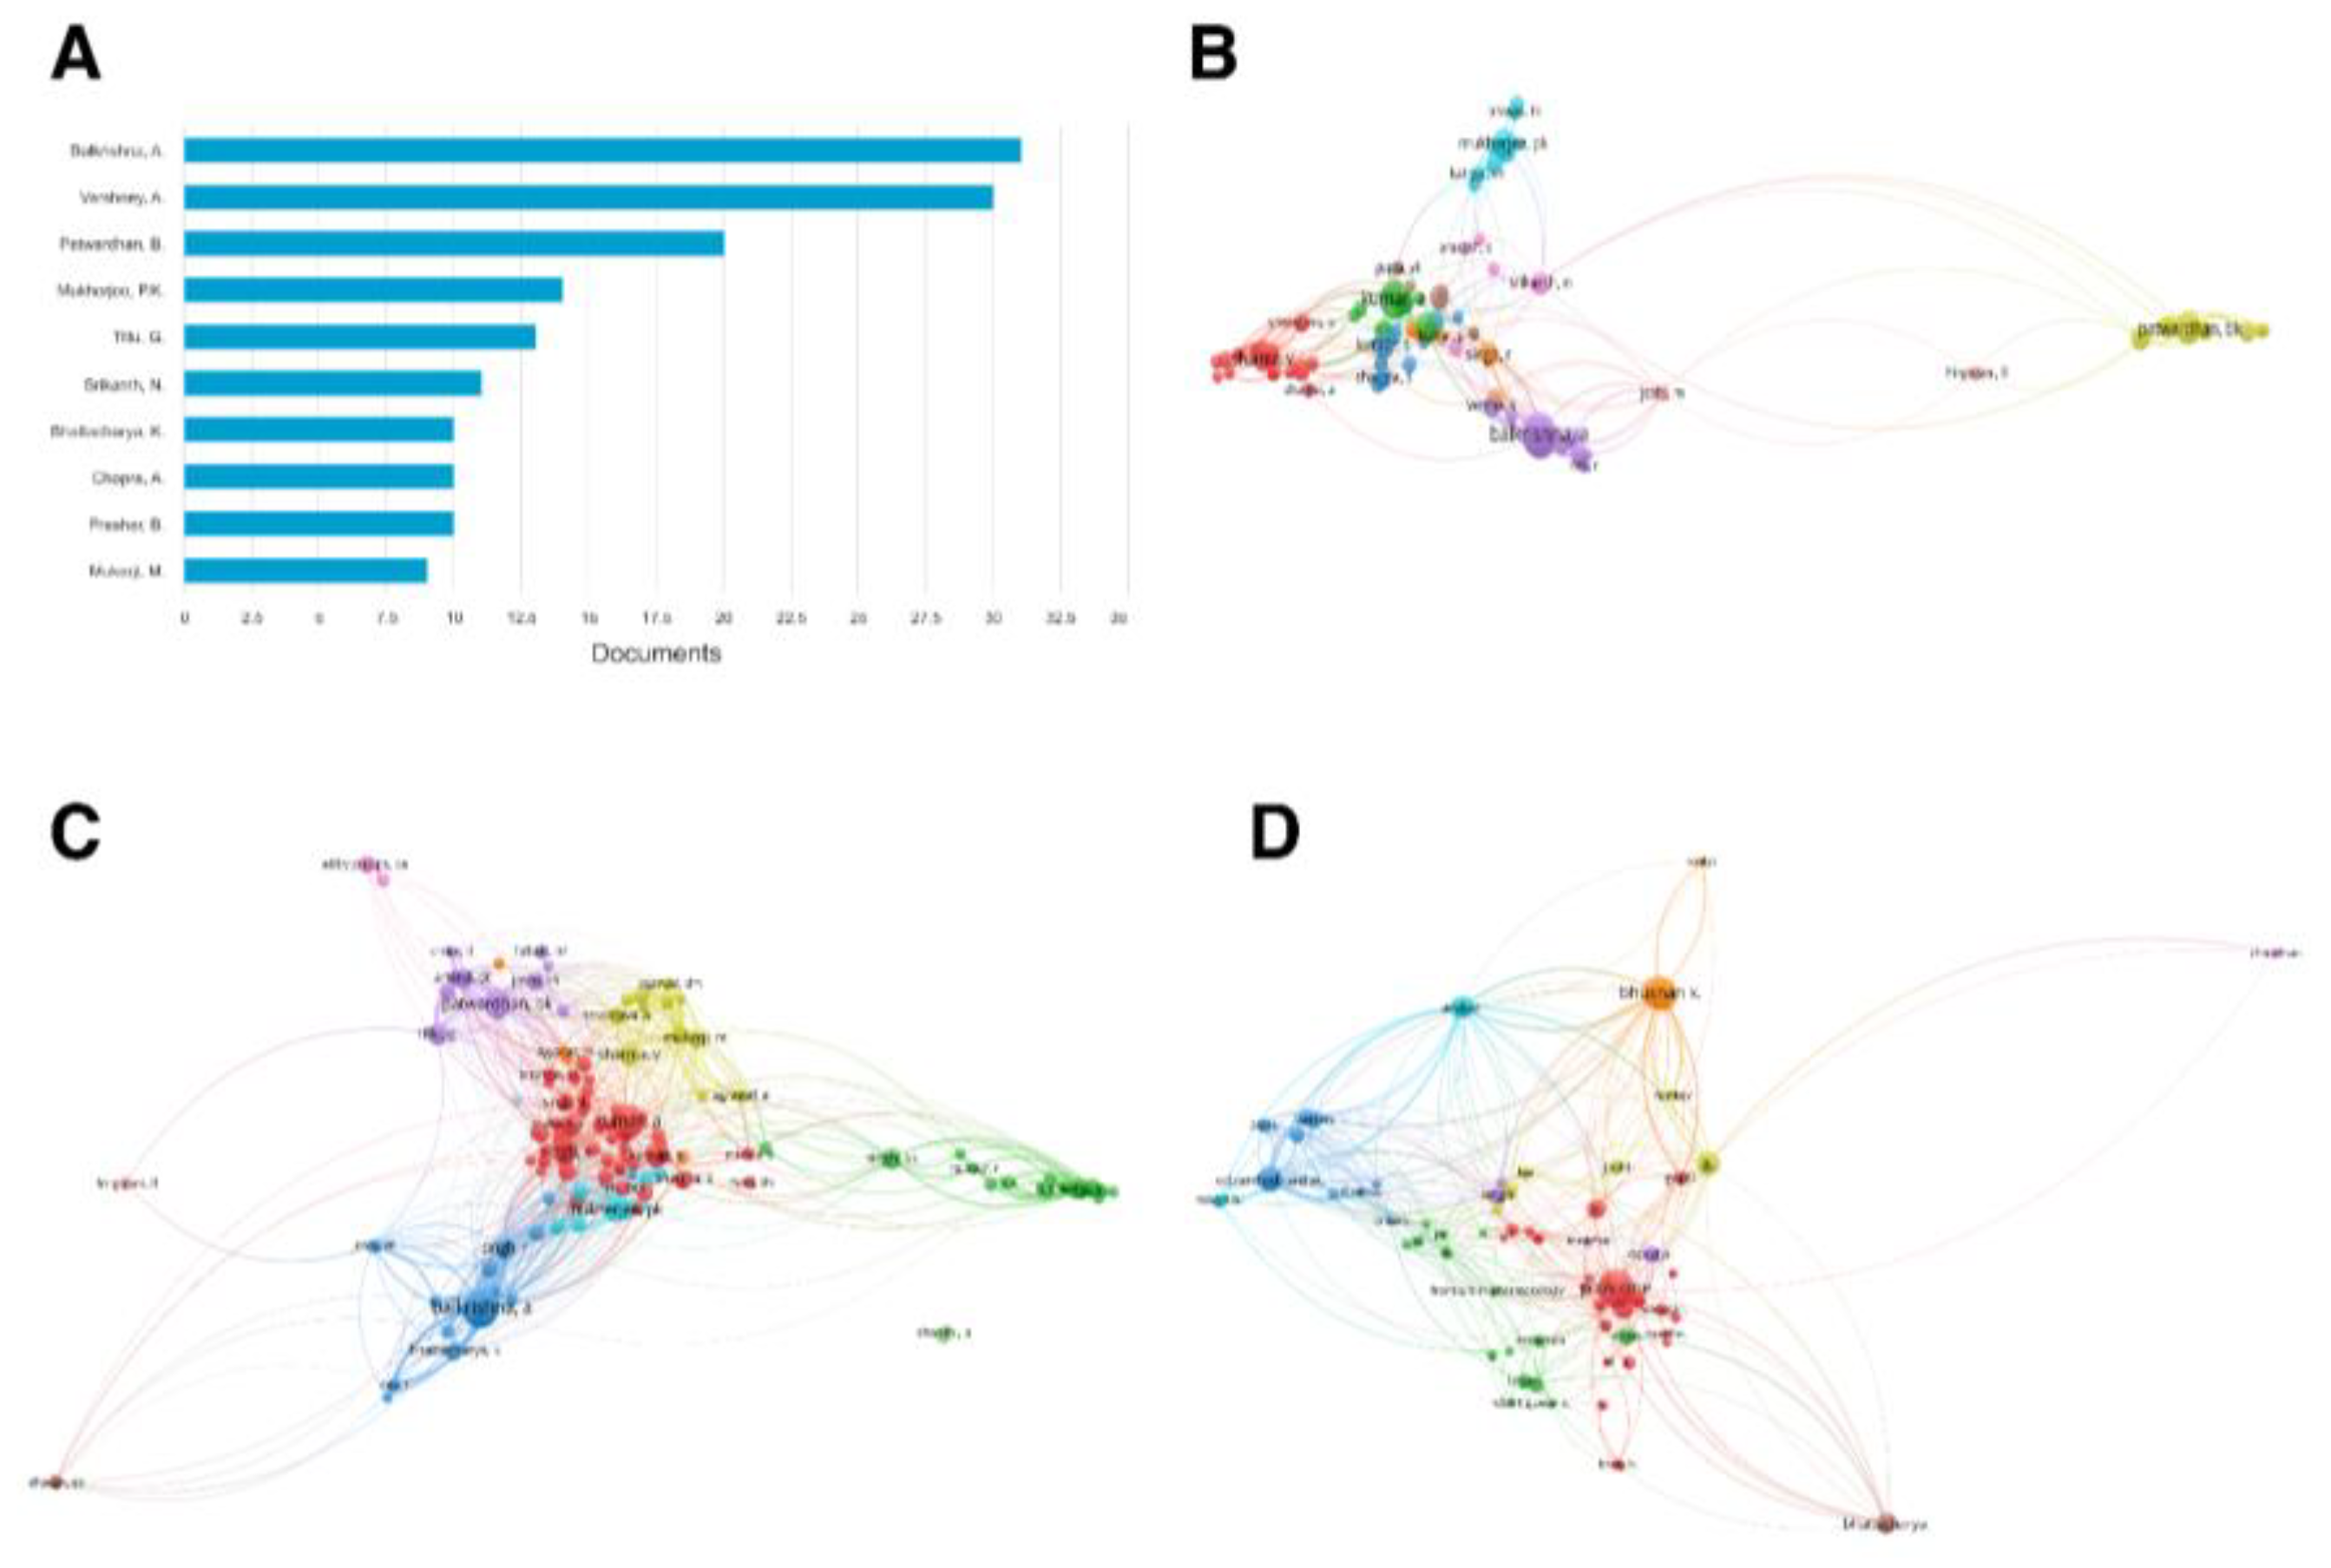
Figure 9.
Journal-level networks: (A) bibliographic coupling; (B) co-citation. Networks were constructed in VOSviewer using full counting across the corpus.
Figure 9.
Journal-level networks: (A) bibliographic coupling; (B) co-citation. Networks were constructed in VOSviewer using full counting across the corpus.
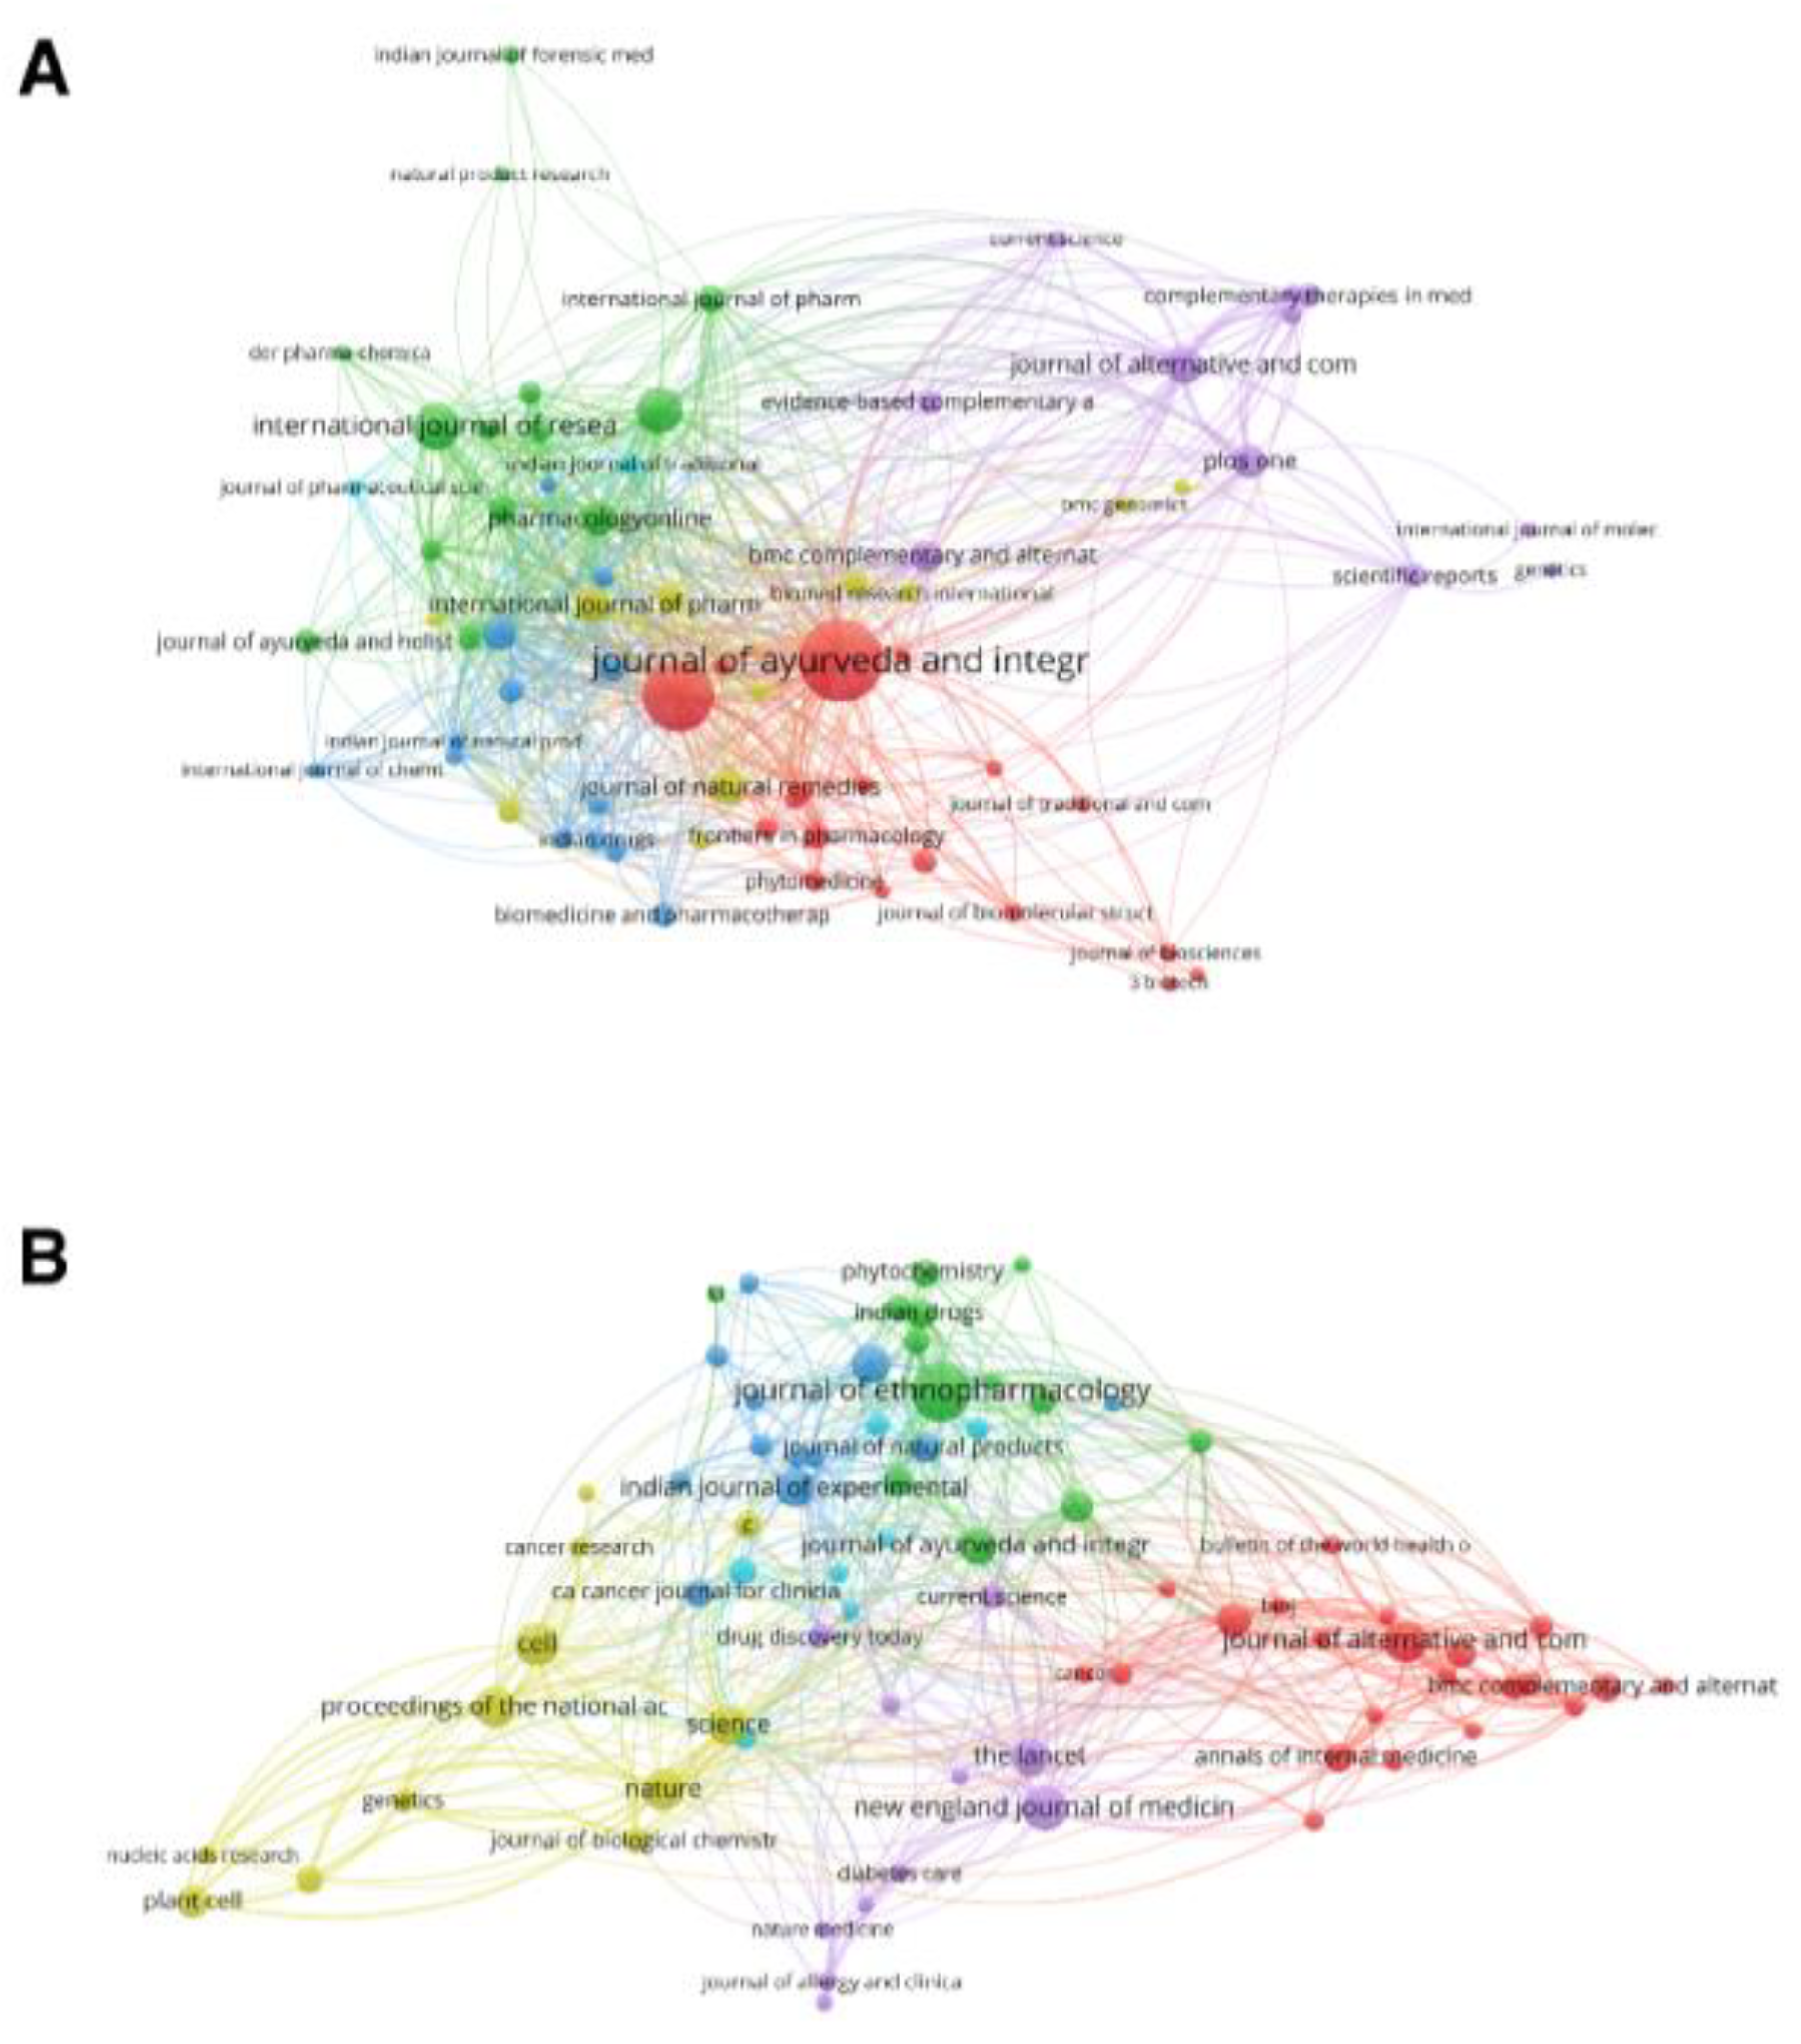
Figure 11.
Classical bibliometric distributions. (A) Lotka’s law of author productivity, showing observed proportions against the fitted inverse power law. (B) Bradford’s law of source scattering, with the three zones of equal document yield marked. (C) Lorenz curve of citation distribution with the corresponding Gini coefficient. The fitted Lotka exponent is n = 2.615 (R² = 0.914); the Kolmogorov–Smirnov statistic D = 0.064 exceeds the critical value 0.016, indicating significant deviation from the idealised inverse-square distribution.
Figure 11.
Classical bibliometric distributions. (A) Lotka’s law of author productivity, showing observed proportions against the fitted inverse power law. (B) Bradford’s law of source scattering, with the three zones of equal document yield marked. (C) Lorenz curve of citation distribution with the corresponding Gini coefficient. The fitted Lotka exponent is n = 2.615 (R² = 0.914); the Kolmogorov–Smirnov statistic D = 0.064 exceeds the critical value 0.016, indicating significant deviation from the idealised inverse-square distribution.
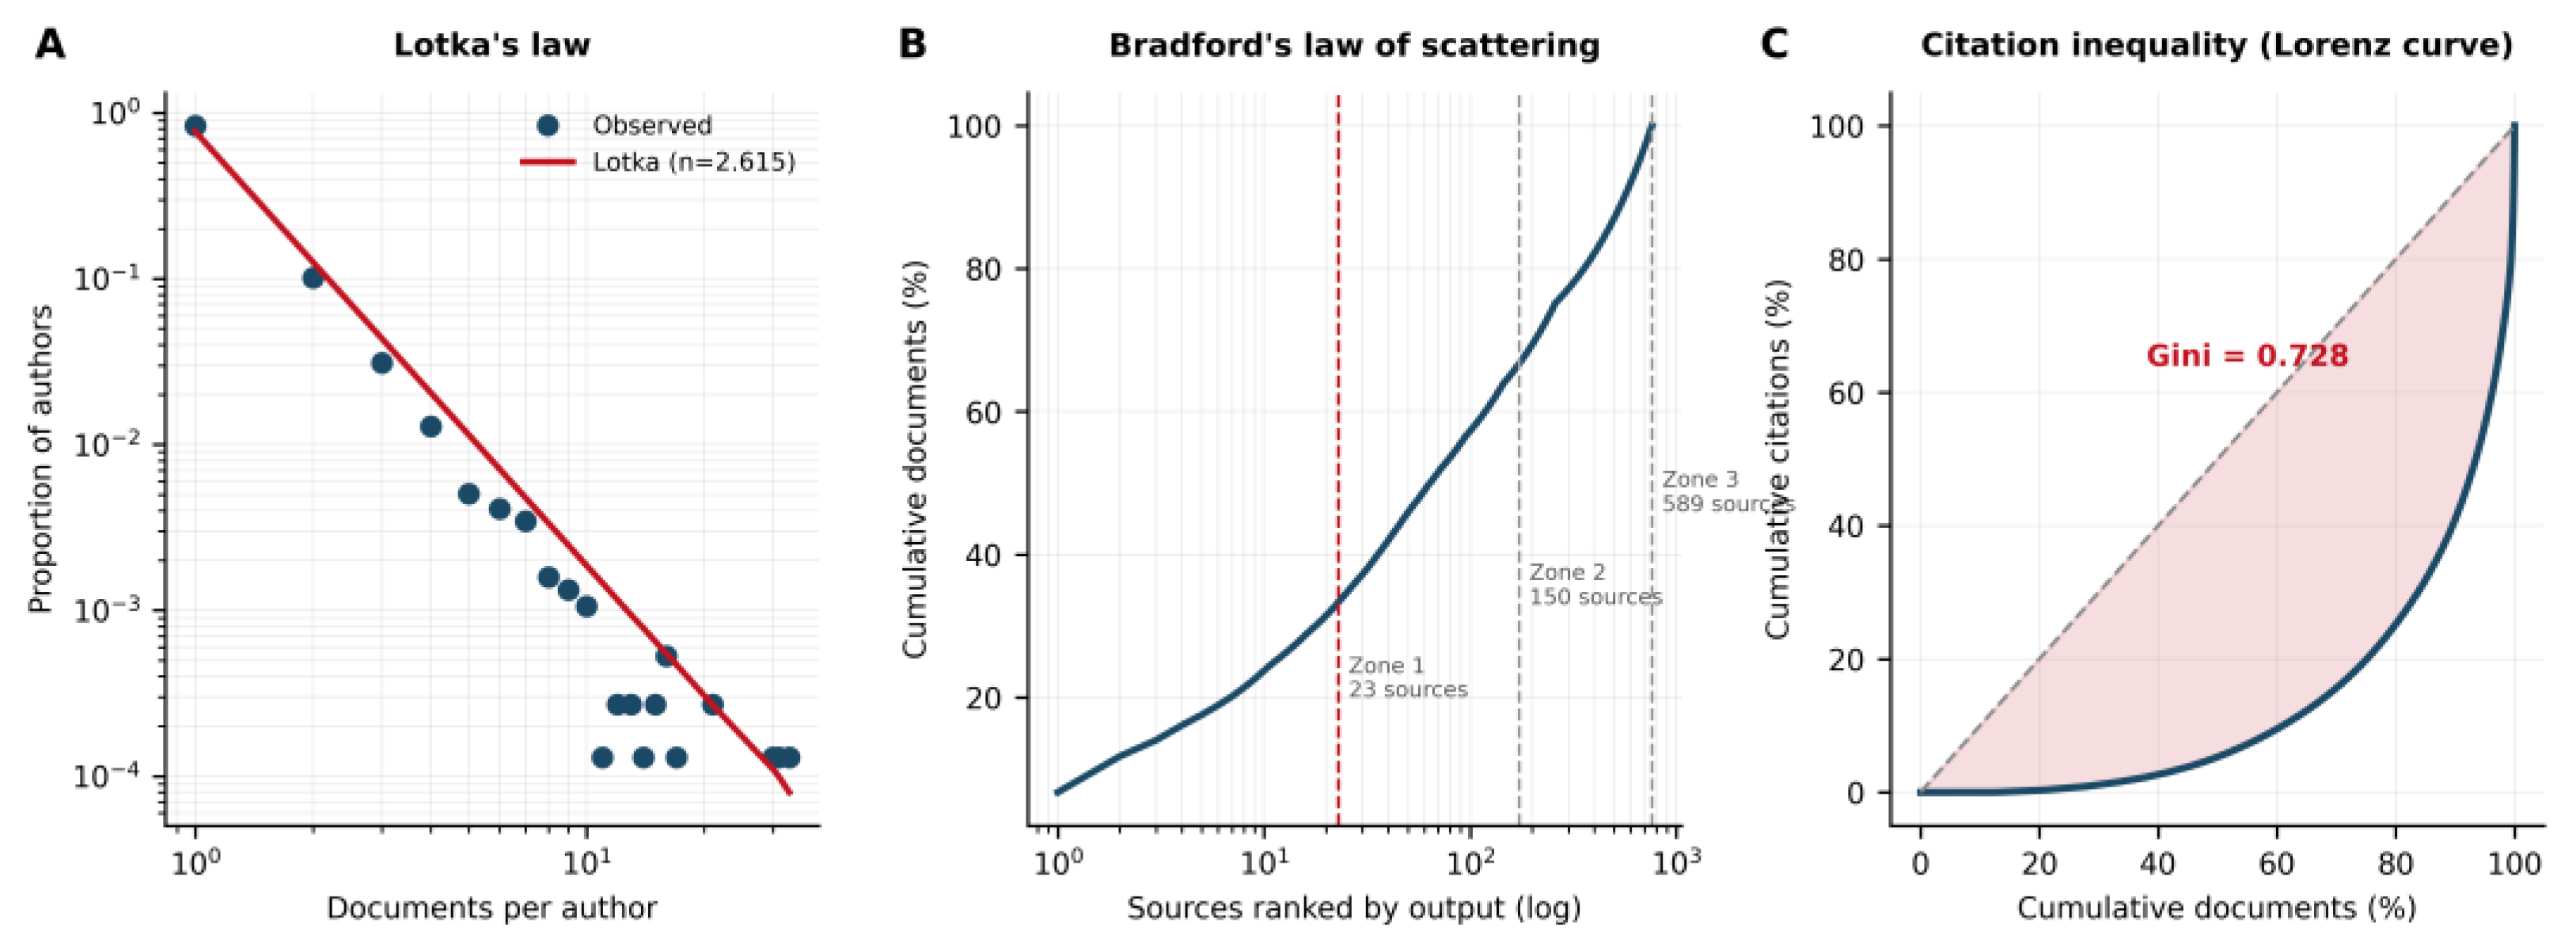
Figure 12.
Geographical structure of the field. (A) Top 15 countries by output, partitioned into single-country (SCP) and multi-country (MCP) publications. (B) International collaboration rate by country, with the median across leading contributors marked. (C) Productivity against mean citation impact; point area is proportional to country h-index. Country attribution was derived by parsing the Scopus affiliation strings, which were available for 98.9% of records.
Figure 12.
Geographical structure of the field. (A) Top 15 countries by output, partitioned into single-country (SCP) and multi-country (MCP) publications. (B) International collaboration rate by country, with the median across leading contributors marked. (C) Productivity against mean citation impact; point area is proportional to country h-index. Country attribution was derived by parsing the Scopus affiliation strings, which were available for 98.9% of records.
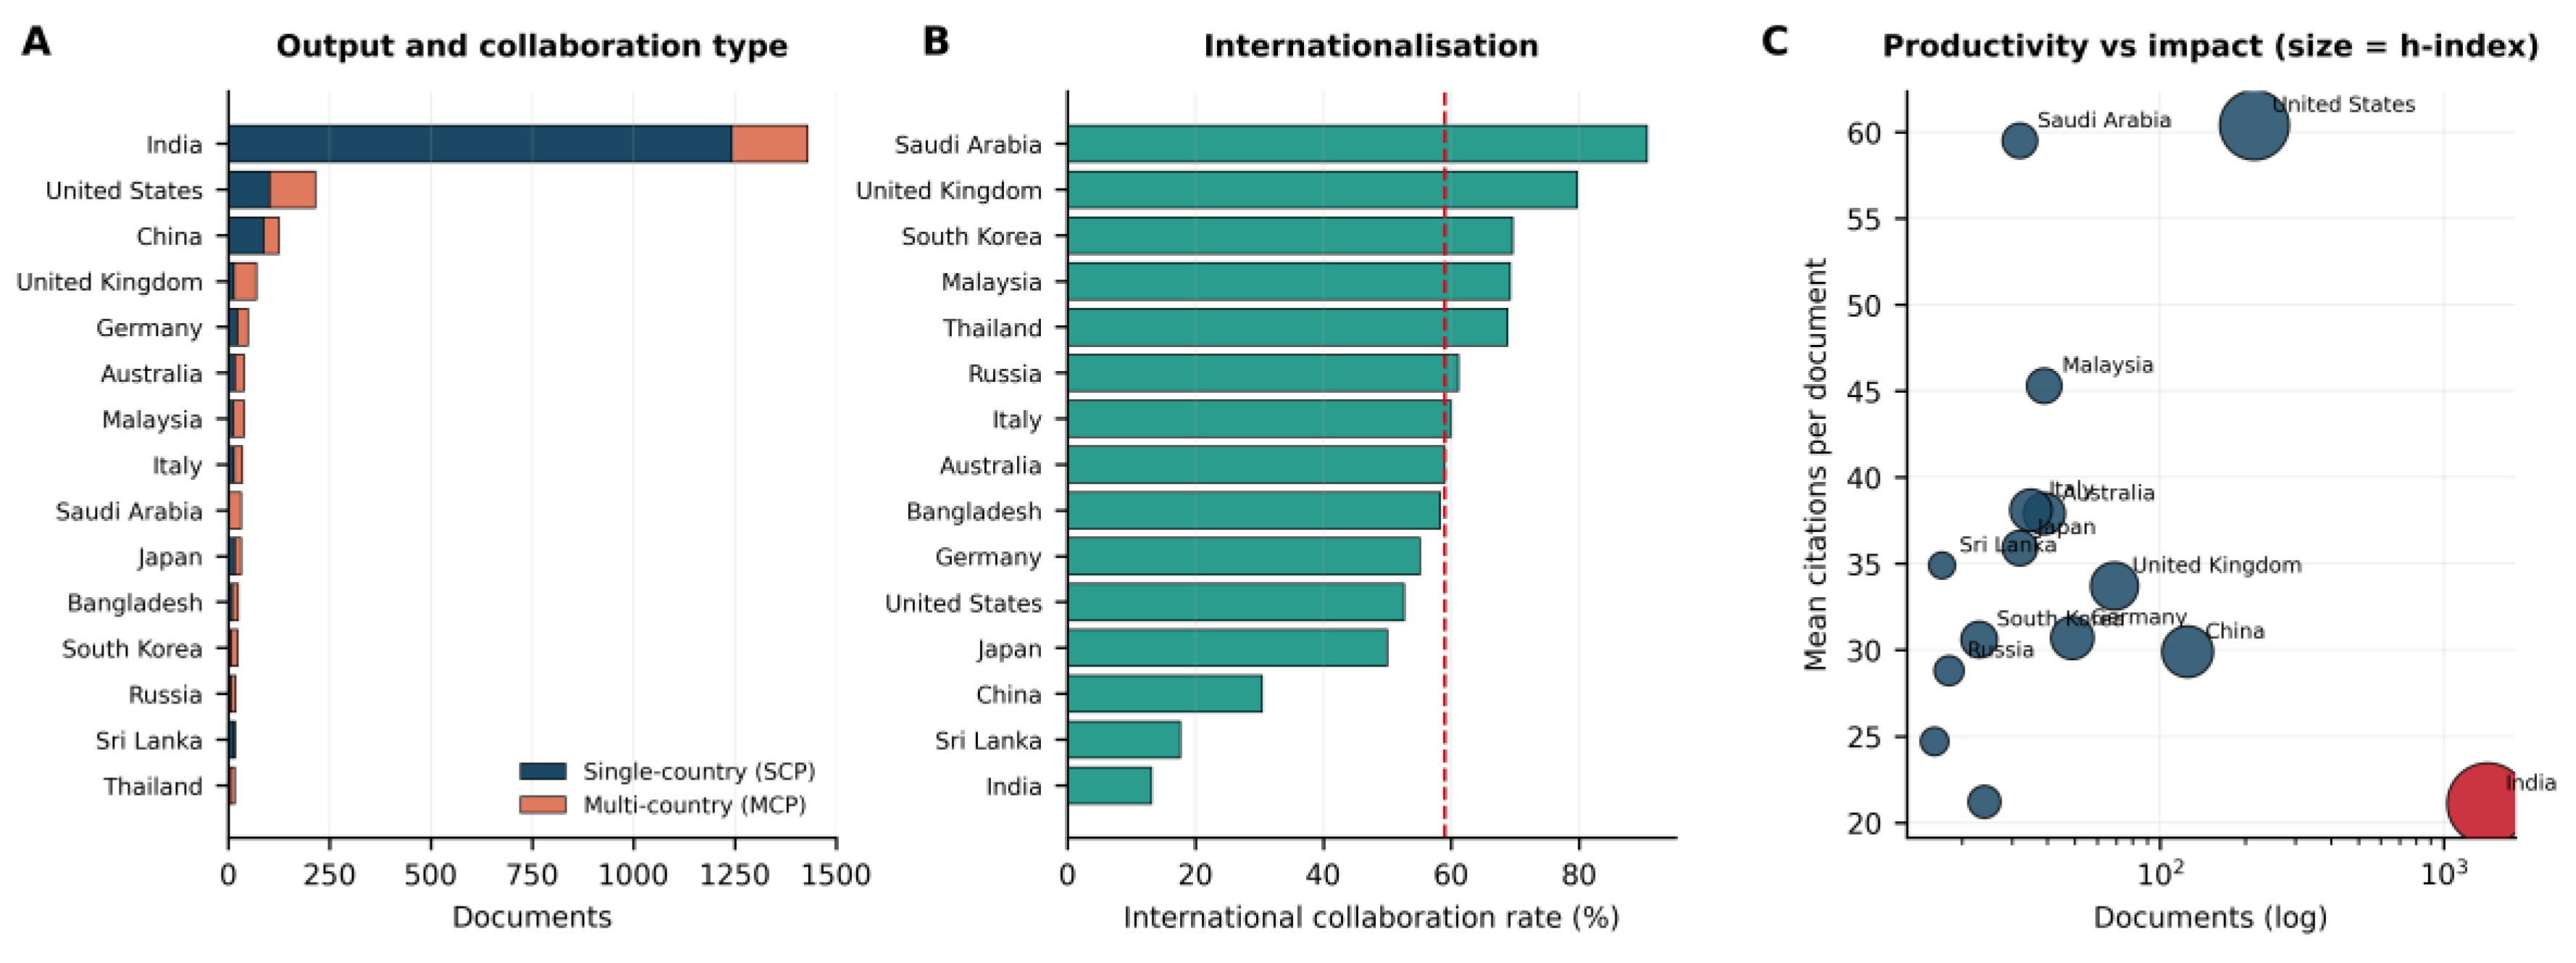
Figure 13.
Conceptual structure of the field. (A) Author keyword co-occurrence network restricted to the largest connected component, with communities identified by the Louvain algorithm (modularity Q = 0.394); node size is proportional to keyword frequency. (B) Callon thematic map positioning each community by centrality and density. Quadrants denote motor themes (high centrality, high density), niche themes (low centrality, high density), emerging or declining themes (low centrality, low density) and basic or transversal themes (high centrality, low density). Cluster statistics are given in Table 11.
Figure 13.
Conceptual structure of the field. (A) Author keyword co-occurrence network restricted to the largest connected component, with communities identified by the Louvain algorithm (modularity Q = 0.394); node size is proportional to keyword frequency. (B) Callon thematic map positioning each community by centrality and density. Quadrants denote motor themes (high centrality, high density), niche themes (low centrality, high density), emerging or declining themes (low centrality, low density) and basic or transversal themes (high centrality, low density). Cluster statistics are given in Table 11.
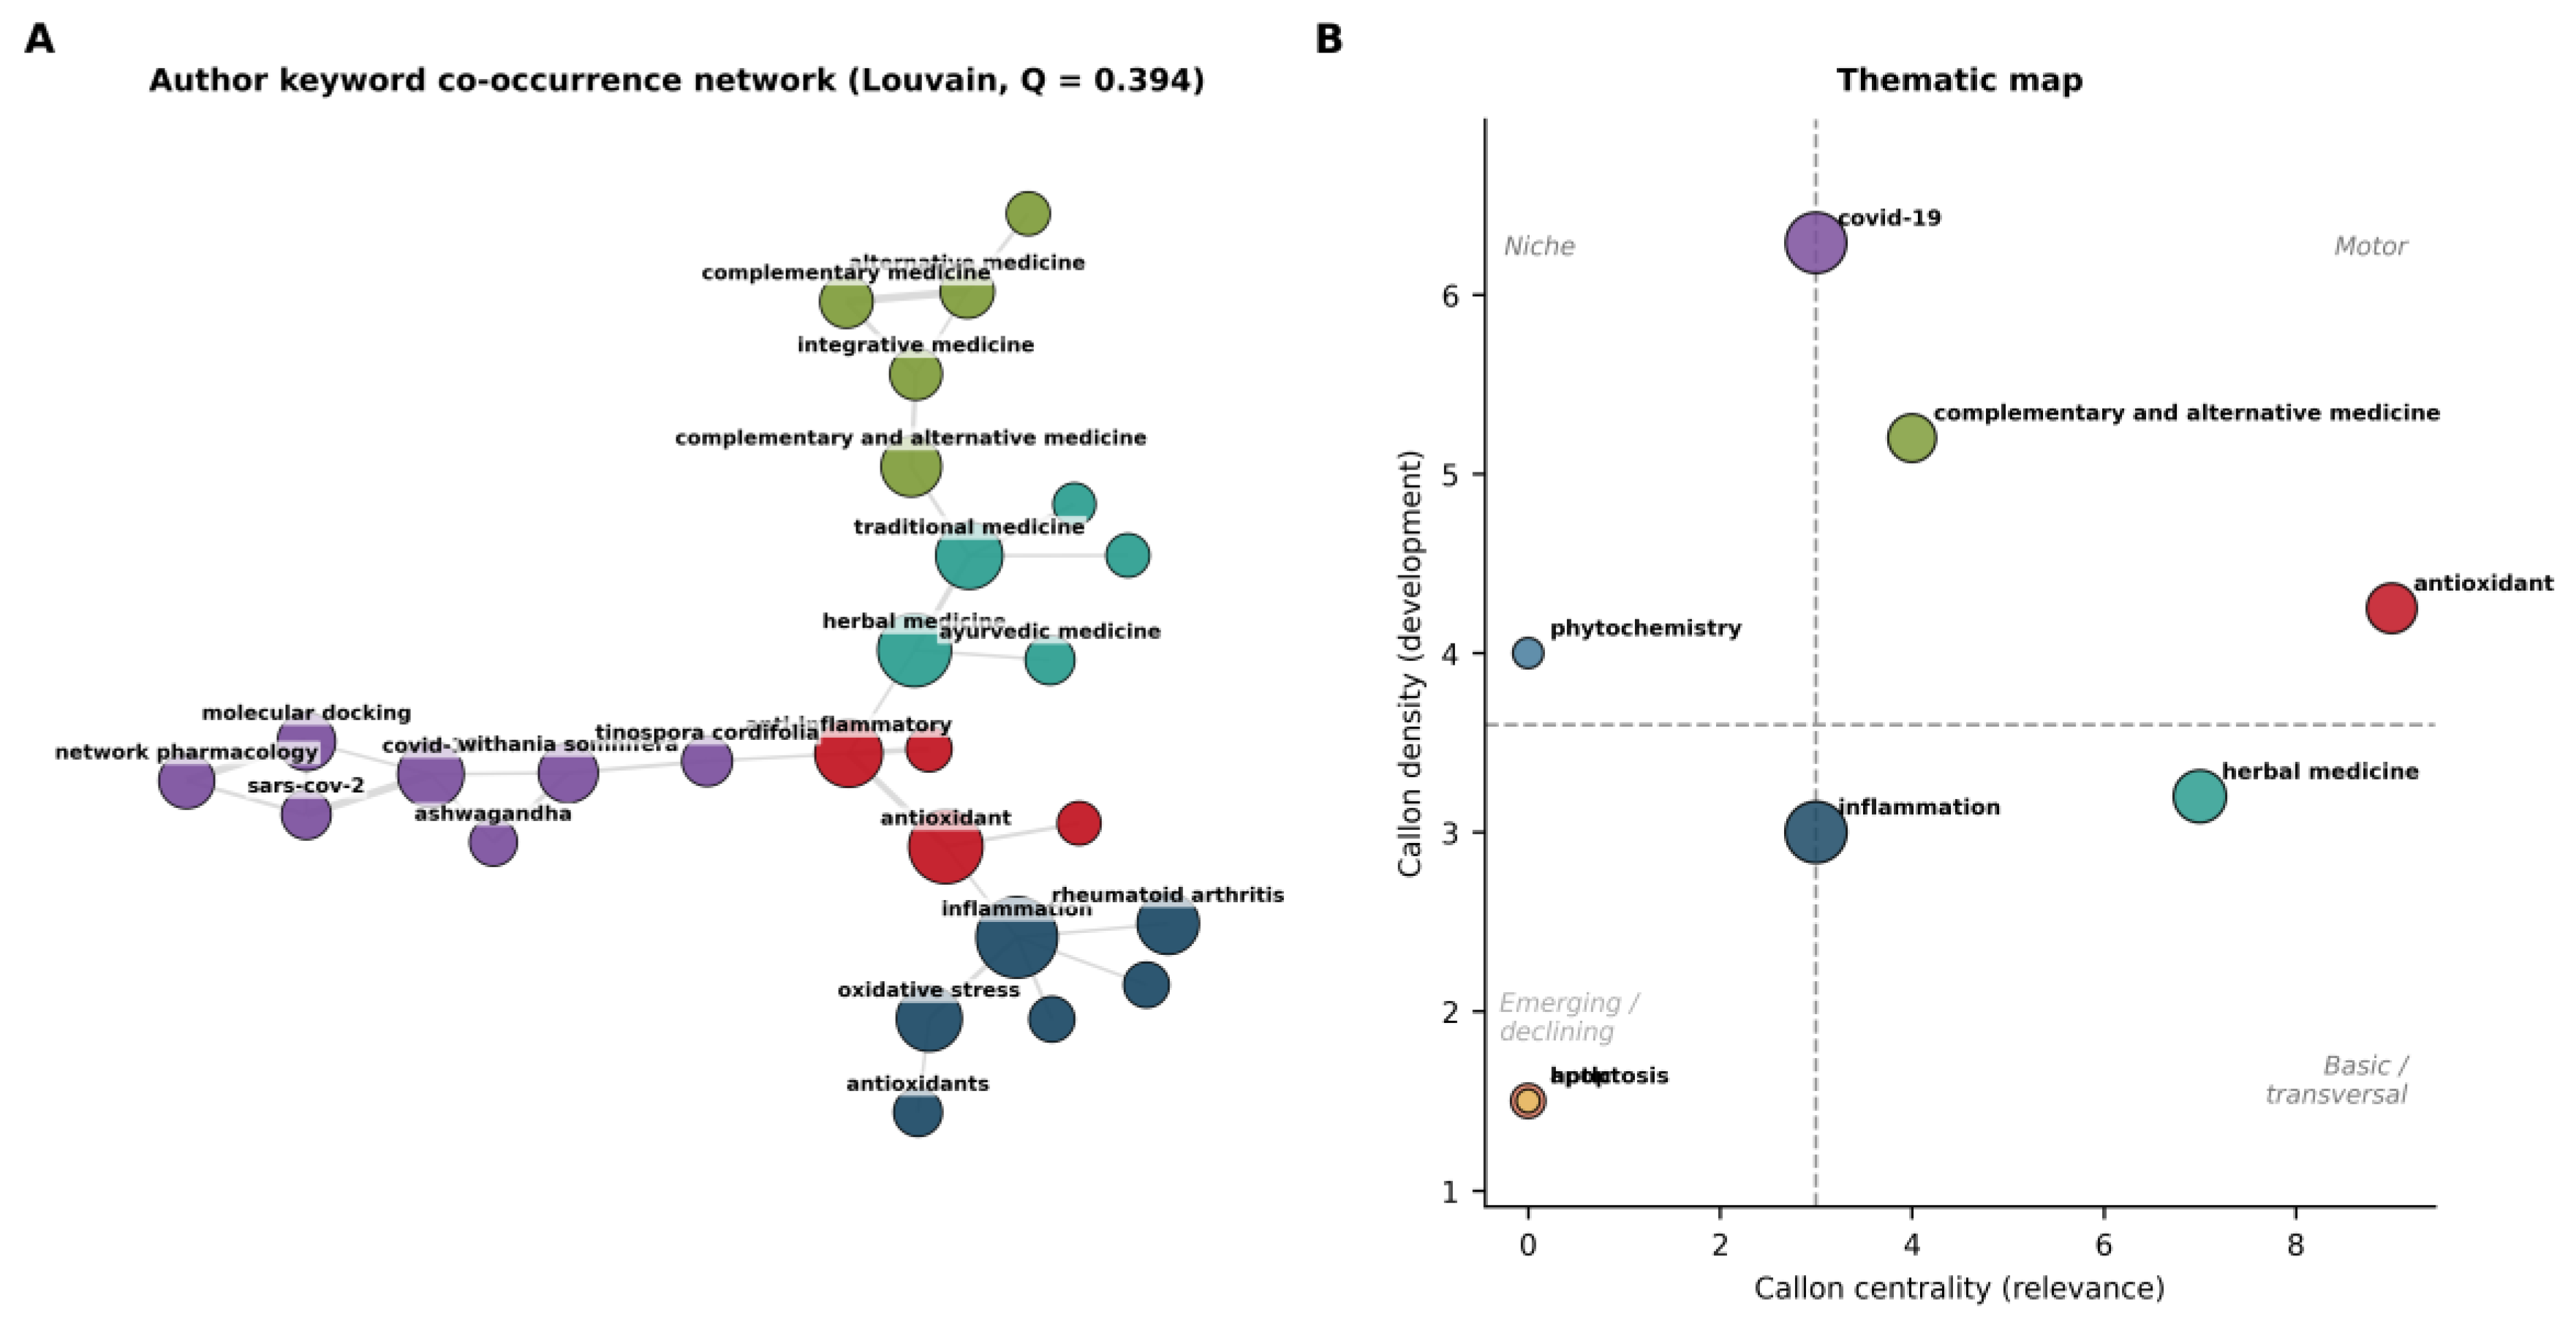
Figure 14.
Temporal structure of the field. (A) Trend topics, showing the interquartile range and median publication year of each keyword; point area is proportional to occurrence count. (B) Reference publication year spectroscopy across 18,862 dated cited references, plotting the deviation of each year from the five-year running median. In panel B, positive deviations (red) identify publication years disproportionately represented among cited references and therefore constitute the historical foundations of the field.
Figure 14.
Temporal structure of the field. (A) Trend topics, showing the interquartile range and median publication year of each keyword; point area is proportional to occurrence count. (B) Reference publication year spectroscopy across 18,862 dated cited references, plotting the deviation of each year from the five-year running median. In panel B, positive deviations (red) identify publication years disproportionately represented among cited references and therefore constitute the historical foundations of the field.
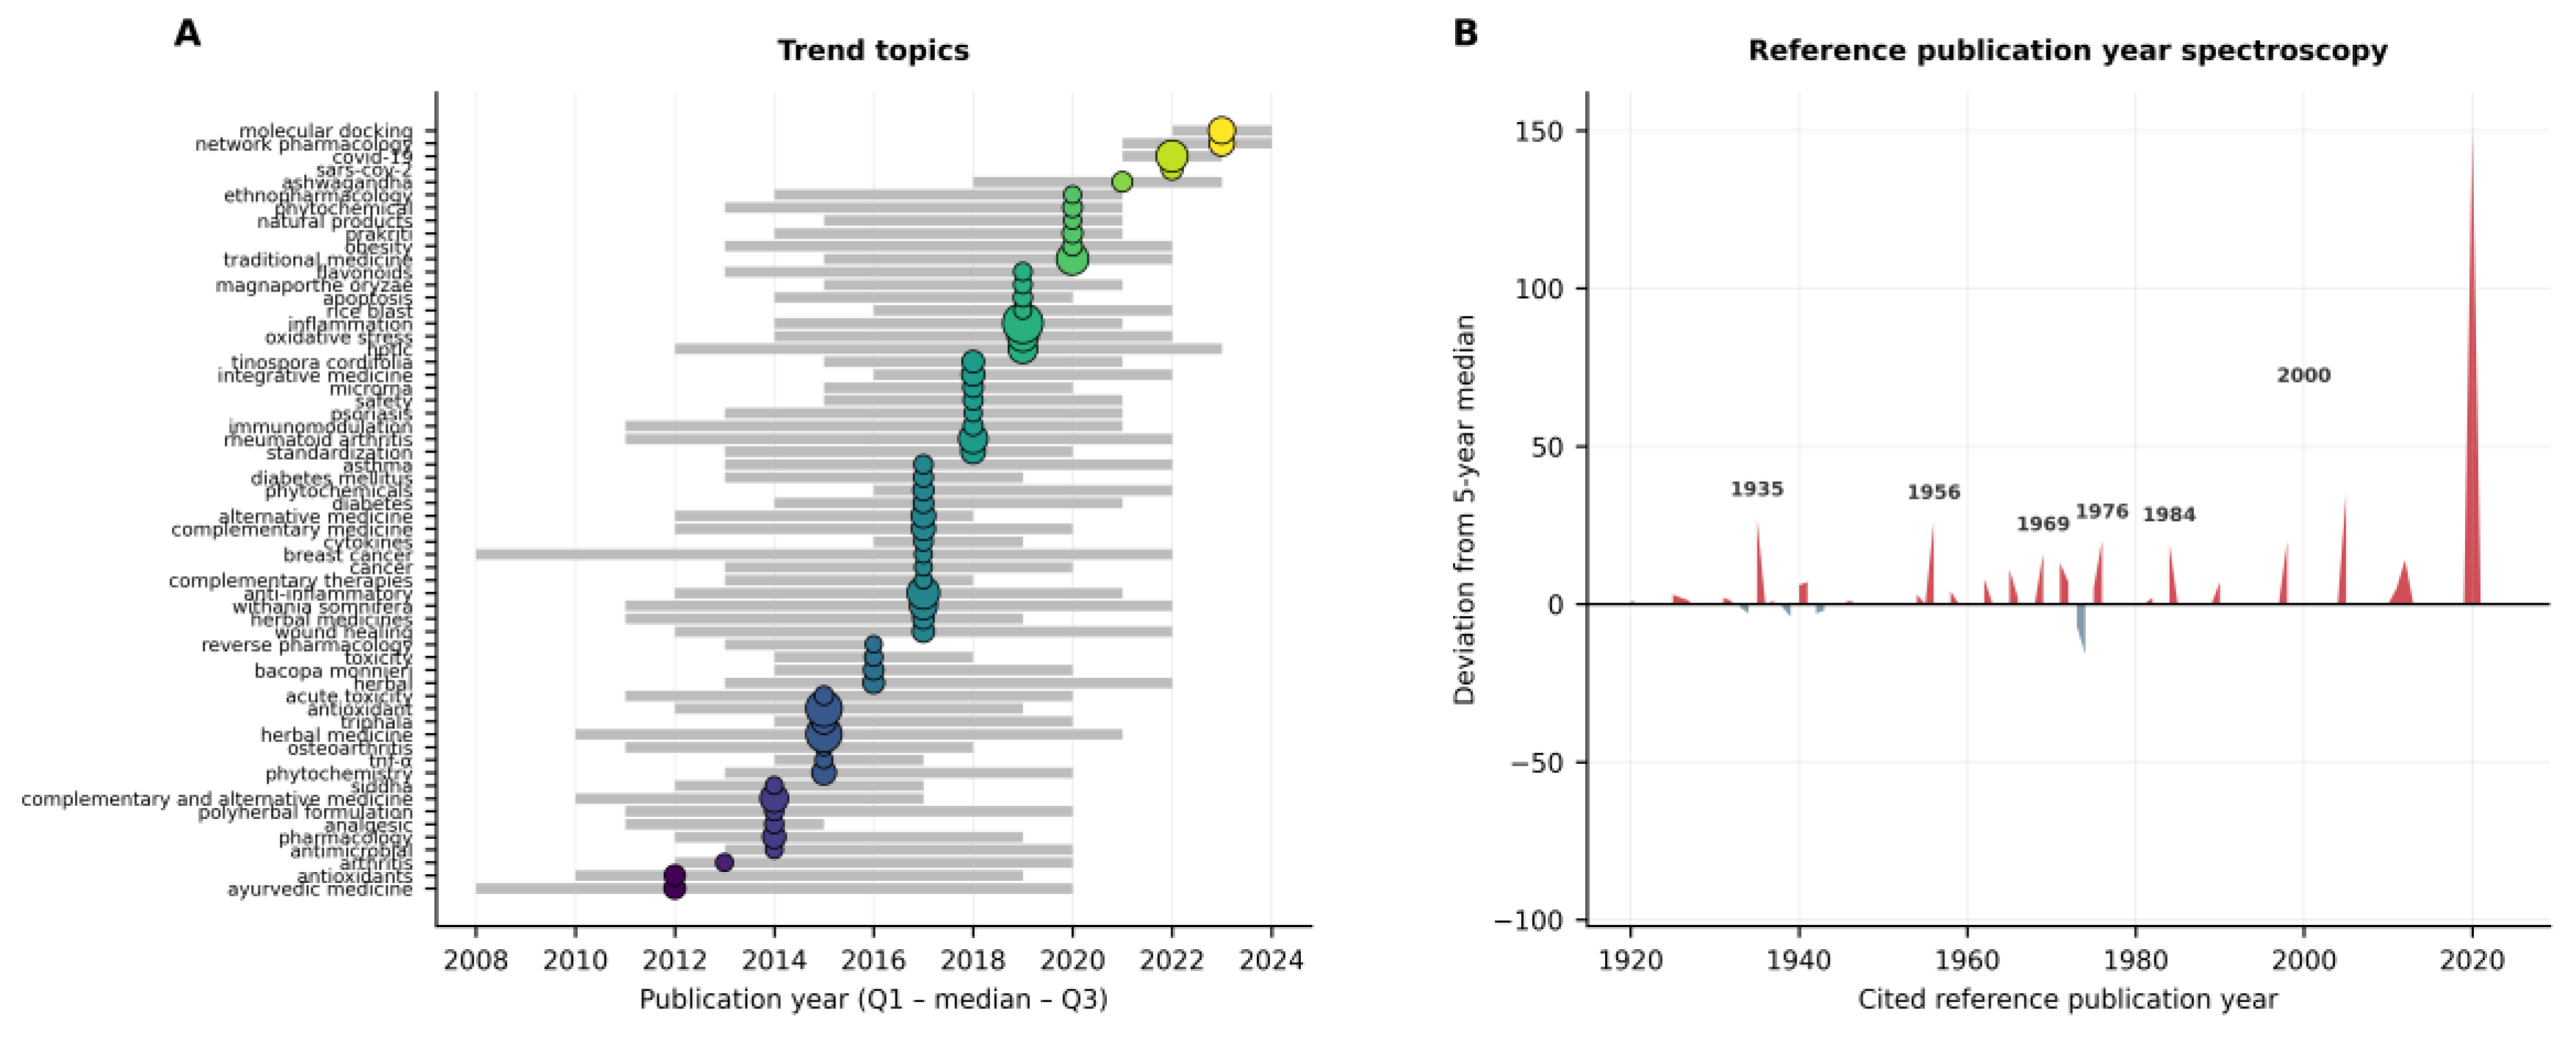
Table 1.
Principal bibliometric characteristics of the corpus.
| Metric | Value |
| Timespan | 1991–2024 (34 years) |
| Documents | 2,027 |
| Document type | Article (100%) |
| Sources (journals) | 762 |
| Authors (unique) | 7,541 |
| Author appearances | 10,067 |
| Single-authored documents | 118 (5.8%) |
| Co-authors per document | 4.97 |
| Total citations | 51,735 |
| Mean citations per document | 25.52 |
| Median citations per document | 9 |
| Uncited documents | 252 (12.4%) |
| Field h-index | 97 |
| Field g-index | 168 |
| Total cited references | 19,024 |
| References per document | 9.4 |
| Author keywords (unique) | 5,564 |
| Open access documents | 908 (44.8%) |
Indicators were computed directly from the Scopus export. The h-index is the largest h for which h documents each received at least h citations; the g-index is the largest g for which the top g documents jointly received at least g² citations.
Table 5.
Bradford zone analysis of source scattering.
| Zone | Sources | Documents | Share of documents (%) |
| Zone 1 | 23 | 676 | 33.3 |
| Zone 2 | 150 | 676 | 33.3 |
| Zone 3 | 589 | 675 | 33.3 |
Sources were ranked by output and partitioned into three zones of approximately equal document yield.
Table 6.
Fifteen most productive sources with citation impact indicators.
| Source | Documents | Total citations | Mean citations | h-index | Zone |
| Journal of Ayurveda and Integrative Medicine | 136 | 1591 | 11.7 | 21 | Zone 1 |
| Journal of Ethnopharmacology | 102 | 6632 | 65.0 | 36 | Zone 1 |
| International Journal of Research in Ayurveda and Pharmacy | 46 | 78 | 1.7 | 5 | Zone 1 |
| Research Journal of Pharmacy and Technology | 42 | 152 | 3.6 | 7 | Zone 1 |
| Journal of Alternative and Complementary Medicine | 30 | 1891 | 63.0 | 18 | Zone 1 |
| Journal of Natural Remedies | 27 | 23 | 0.9 | 2 | Zone 1 |
| PLoS ONE | 25 | 671 | 26.8 | 15 | Zone 1 |
| International Journal of Pharma and Bio Sciences | 25 | 210 | 8.4 | 10 | Zone 1 |
| Pharmacologyonline | 24 | 100 | 4.2 | 6 | Zone 1 |
| Research Journal of Pharmaceutical, Biological and Chemical Sciences | 24 | 141 | 5.9 | 7 | Zone 1 |
| BMC Complementary and Alternative Medicine | 21 | 699 | 33.3 | 14 | Zone 1 |
| Asian Journal of Pharmaceutical and Clinical Research | 17 | 82 | 4.8 | 5 | Zone 1 |
| International Journal of Pharmaceutical Sciences Review and Research | 17 | 230 | 13.5 | 7 | Zone 1 |
| Frontiers in Pharmacology | 16 | 231 | 14.4 | 9 | Zone 1 |
| International Journal of Green Pharmacy | 16 | 74 | 4.6 | 5 | Zone 1 |
Zone 1 denotes membership of the Bradford core. The h-index is computed within each source across the corpus only, and is therefore not the journal’s overall h-index.
Table 7.
Citation distribution and concentration indicators.
| Metric | Value |
| Total citations | 51,735 |
| Mean | 25.52 |
| Median | 9 |
| Standard deviation | 81.51 |
| Skewness | 14.36 |
| Kurtosis | 279.22 |
| Maximum | 2,057 |
| Uncited (%) | 12.4 |
| Gini coefficient | 0.728 |
| Share held by top 1% of documents (%) | 24.0 |
| Share held by top 5% of documents (%) | 44.8 |
| Share held by top 10% of documents (%) | 59.0 |
| Share held by top 25% of documents (%) | 80.1 |
| h-index | 97 |
| g-index | 168 |
| m-index (h / years active) | 2.85 |
The Gini coefficient ranges from 0 (perfect equality) to 1 (maximum concentration). The m-index normalises the h-index by the number of years elapsed since the first publication in the corpus.
Disclaimer/Publisher’s Note: The statements, opinions and data contained in all publications are solely those of the individual author(s) and contributor(s) and not of MDPI and/or the editor(s). MDPI and/or the editor(s) disclaim responsibility for any injury to people or property resulting from any ideas, methods, instructions or products referred to in the content. |
© 2026 by the authors. Licensee MDPI, Basel, Switzerland. This article is an open access article distributed under the terms and conditions of the Creative Commons Attribution (CC BY) license (http://creativecommons.org/licenses/by/4.0/).
Copyright: This open access article is published under a Creative Commons CC BY 4.0 license, which permit the free download, distribution, and reuse, provided that the author and preprint are cited in any reuse.