

Submitted:
04 September 2026
Posted:
07 September 2026
You are already at the latest version
Abstract
Research on gas hydrate accumulation in the Shenhu Gas Hydrate Formation in the northern part of the South China Sea has been conducted, determining a vertical distribu-tion pattern with gas hydrates at the top and free gas at the bottom, with both coexisting in the middle of the formation. To address the challenge of quantitative evaluation arising from the interaction between coexisting gas hydrates and free gas in the hydrate-bearing zone during well logging, we established an identification method based on the intersec-tion of three porosity logs that can intuitively display the vertical distribution pattern of the hydrate reservoirs. To quantitatively evaluate coexisting gas hydrates and free gas, we first constructed a model for calculating gas saturation based on the resistivity increase rate and gas content through sedimentary core experiments in the target interval. Based on this, we utilized the neutron density normalization difference to calculate the gas satura-tion in the coexisting zone. By determining the relative contents of bound water and free gas, we obtained the hydrate saturation in the coexisting zone. The hydrate saturation ob-tained using the above methods was consistent with the results of the core experiments, indicating the reliability of the method. The research results can determine the hydrate content in the coexistence zone and provide a reliable basis for the accurate assessment of natural gas hydrate resources in the area.
Keywords:
marine gas hydrate
; logging response characteristics
; hydrate and free gas in the coexistence zone
; core experiment
; quantitative evaluation
1. Introduction
Natural gas hydrates are solid compounds formed by hydrocarbon gas, such as methane, and water molecules at low-temperature and high-pressure conditions. Previous research has suggested that gas sources in marine hydrates can be categorized as biogenic or thermogenic (Collett, 1993, 2002, 2011), with the corresponding migration methods being slow diffusion within geological layers and rapid ascent along tectonic zones, leading to accumulation and storage models, including biogenic gas diffusion, thermogenic gas leakage, and hybrid types (Liang et al., 2016; Su et al., 2011). All storage models indicated that gas sources migrated from the bottom to the top, accumulated, and were stored in suitable locations (with appropriate temperature, pressure, and pore space) during hydrate formation. Consequently, as the gas hydrates continued to form, the geological pore space was filled with solid hydrates, thereby providing a sealing effect on the lower gas source. With abundant gas sources, it is possible to observe a vertical distribution, where the hydrates are at the top, free gas is at the bottom, and both coexist in the middle. The coexistence of hydrates and free gas in hydrate drilling in the Black Sea in the western Atlantic, the Oregon coast of the United States, and the Shenhu Sea area in the South China Sea (Guerin et al., 1999; Lee and Collett, 2006). In 2018, the Guangzhou Marine Geological Survey found evidence of an abnormal reduction in the chloride ion concentration in the mixed zone of the Shenhu Sea area (Qin et al., 2020; Xie et al., 2021), which was due to the decrease in formation water salinity caused by hydrate decomposition to produce fresh water (Mo et al., 2012), further confirming the existence of a coexistence zone.
The above statements indicate that coexistence zones are universal for Marine gas hydrates. How to intuitively identify and how to calculate the relative content of gas hydrate and free gas are the problems to be solved in this study. What was the difficulty of the study? We know that various methods have been developed to calculate hydrate saturation in pure hydrate formations because the presence of hydrates in geological formations leads to significant changes in resistivity and acoustic travel time. Existing methods include the Willy equation method (Lee, 2000), dual-parameter saturation calculation models (Li et al., 2022a), and density-nuclear magnetic resonance joint methods (Sun et al., 2018), which effectively address the hydrate saturation parameters in pure hydrate formations. However, in intermediate coexistence zones and lower free gas layers, evaluating the relative contents of hydrates and free gas is challenging because of the significant differences in the physical properties of the different components and the special characteristics of unconsolidated formations.
In this study, qualitative identification methods for vertical hydrate zoning were proposed based on the logging response characteristics in intermediate coexistence zones and lower free gas layers. Additionally, a calculation method for the relative contents of coexisting hydrates and free gas was established based on unconsolidated sediment–rock physics experiments.
2. Logging Response Characteristics and Qualitative Identification of Hydrate and Free Gas
Currently, the coexistence state of hydrates and free gas is derived from the reasoning of the accumulation model (Roland et al., 1999; Buffett, et al., 2000), and evidence is obtained from the change in the chloride ion concentration in coring wells (Lee, et al., 2011). However, whether this coexistence zone is stable in the region and how well it has developed requires further investigation.
2.1. Logging Response Characteristics
For marine gas, whether they consist of pure hydrates, pure natural gas, or coexisting zones, the physical properties of each component do not change and exhibit the well-logging response. Pure water layers show low resistivity, and the porosity calculated from the density, neutron, and acoustic travel time measurements is consistent. For hydrate layer, as it is a solid, its density has little difference with that of water, so its logging characteristics are as follows: compared with the formation with saturated water, the resistivity increases and acoustic travel time decreases, but the neutron and density are less affected (Lu et al., 2008; Ning et al., 2013), which can reflect the real porosity of the formation. Therefore, the intersection of density and acoustic travel time logs can be used to identify hydrate. Free-gas layers are influenced by their physical properties. Consequently, they exhibit well-logging characteristics such as increased resistivity, potentially longer acoustic travel time (influenced by gas saturation and formation looseness) (Malinverno et al., 2008; Kang et al., 2023), larger calculated porosity from density, and smaller neutron porosity. Therefore, the intersection of the density and neutron logs can be used to accurately identify free-gas layers.
2.2. Well Logging Identification of Hydrate and Free Gas in Coexistence Zone Based on the Three-Porosity Intersection Method
Based on the well-logging response patterns described above, the presence and state of hydrates could be identified based on the intersection characteristics of the three porosity logs, providing a visual representation of the coexistence of hydrates and free gas. To match the characteristics of hydrate formations in the target area, the scaling for the neutron log is set from 0 to 100%, the density log is set from 1 to 2.7 g/cm3, and the acoustic travel time log is set from 800 to 300 μs/m. allows the three porosity logs to overlap in non-hydrate-bearing sections. In hydrate formations, the density and acoustic travel time logs clearly intersect, forming a distinct intersection zone. In the free gas formation, because the hydrogen content index of natural gas is much smaller than that of formation water, when the formation contains natural gas, part of the water in the pore space is replaced by natural gas, and the hydrogen content index decreases, which also reduces the deceleration ability of the rock to fast neutrons, equivalent to excavating a partial volume skeleton. This effect is called “excavation effect” (Lawson., 1987). The “excavation effect” causes the intersection of neutron and density logs to be obvious.Therefore, by marking different types of intersection zones, the presence and state of hydrates and free gas in the formation can be visualized. As shown in Figure 1, Condition 1of the result indicates a hydrate layer, with the blue intersection zone between the density and acoustic travel time logs representing hydrate development. Conclusion 2 of the result suggests the coexistence of hydrates and free gas with hydrates dominating the upper section and free gas dominating the lower section. Conclusion 3 of the result indicates a free-gas layer, with the yellow intersection zone between the neutron and density logs indicating the presence of free gas in the formation. These features provide a visual representation of the vertical distribution pattern of hydrate accumulation, offer clear evidence of the coexistence of hydrates and free gas, and serve as a basis for further research into quantitative evaluation methods.
3. Calculation of Relative Hydrate And Free Gas Content in the Coexistence Zone
Because of the solid-state nature of hydrates in unconsolidated formations, their nonconductivity leads to an increase in the electrical resistivity of hydrate-bearing formations. However, hydrates can exist in various forms in geological formations, and the rate of resistivity increase not only depends on the hydrate content, but is also influenced by their form. Because hydrate deposits are mostly fine grained material with a large proportion of small pores. Moreover, it has strong anisotropy characteristics (Chen et al., 2013), and the complex internal structure will lead to the diversity of the microscopic distribution forms of hydrate, and thus its electrical characteristics will show significant “non-Archie” law in most cases (Li et al., 2022b; Lin et al., 2014). Therefore, it is challenging to accurately determine hydrate saturation in geological formations using Archie’s equation. Previous research proposed a dual-parameter calculation model based on resistivity and acoustic travel time from well-logging data (Li et al., 2022a). This model can effectively determine hydrate saturation in geological formations when the baseline values of non-hydrate-bearing formations in the target interval are accurately selected. However, for formations with high carbonate content, such as in the Xisha Sea area (Chen et al., 2007), the dual-parameter calculation model can lead to erroneous results.
The calculation of gas saturation of the pure free gas layer commonly developed under the hydrate formation also has problems. Although the resistivity increase rate of the pure gas layer conforms to the Archie law, since the formation is loose and unconsolidated, if the Archie formula is used to calculate gas saturation for this special formation, there are several empirical coefficients related to the formation that need to be determined by core experiments.
In this study, we first solve the gas saturation calculation problem of pure free gas reservoir through core experiment, and then gradually solve the calculation method of gas saturation and hydrate saturation in coexisting zone through the relationship between gas saturation and well-logs.
3.1. Calculation of gas Saturation Based on Core Sample Resistivity Increase Rate
Using ten sediment samples obtained from hydrate drilling in the Shenhu Sea area as subjects, the samples were first reduced to their original geological state based on in situ temperature and pressure conditions. The specific procedures were as follows:Firstly, the sediment samples were exposed to a humid environment to maximize water absorption. Secondly, the water-saturated sample was placed in an experimental vessel under original formation temperature (16℃) and pressure (15Mpa) conditions (Zeng et al., 2013). Thirdly, based on the accumulation mode of hydrate gas rising from the bottom, an appropriate gas injection method at the bottom was selected for experimentation. As gas injection increased, originally saturated pore water gradually discharged with a volume equal to that of injected gas saturation. Using this approach, changes in resistivity increase rate of each sample under different gas saturation conditions were measured at regular time intervals (Table 1; Figure 2). Figure 3 shows the relationship between the resistivity increase rate and water saturation for all the samples, exhibiting a good linear pattern. Accordingly, a gas saturation calculation model was established based on the rate of increase in core sample resistivity for the target geological formation in the study area (Equation 1, 2).
The rate of resistivity increase indicates that an increase in the gas content in the formation leads to an increase in the resistivity. For the same lithology and physical properties, the resistivity of the pure water layer was selected as the initial value, and the resistivity increase rate was calculated using Equation (1).
In the equation, is the rate of resistivity accretion, t is the gas bearing layer resistivity; and is the pure water layer resistivity.
In the equation, represents water saturation and is the rate of resistivity accretion.
Gas saturation was calculated based on the obtained formation water saturation (Equation 3):
In the equation, denotes the free gas saturation.
3.2. Calculation of Gas Saturation in Coexistence Section
In the coexistence zone, it is difficult to calculate the porosity from the three porosity logs because they are influenced by both hydrates and free gas. The resistivity does not reflect the increase in resistance caused by hydrates or free gases as individual components. Therefore, Archie’s equation is unsuitable in this context. Further analysis from the logging response characteristics shows that the density of water is 1g/cm3 and the hydrogen-containing index is 1; the density of structure I hydrate is 0.92g/cm3 and the hydrogen-containing index is 1.06 (Collett et al.,2012). It can be seen that the neutron and density of hydrate are close to that of water, and the formation with similar lithology and physical properties has little influence on the neutron and density. However, the gas content in the formation, especially in the shallow layer, will cause the neutron and density logging values to decrease significantly, and an obvious envelope area will be formed between the reverse calibration logs, that is, the yellow area where the neutron and density logs intersect in the fourth channel in Figure 1. Therefore, by normalizing the units of the neutron density log and utilizing the correlation between the difference between the two logs and the gas saturation, the relative content of free gas in the coexistence zone can be obtained.
3.2.1. Quantitative Characterization the Difference Between Neutron and Density Logs
Because the neutron and density log values have different scales and units (neutron log ranging from 0 to 100%, and density log ranging from 1 to 2.7 g/cm3), it is not possible to measure changes in gas content based on the difference between the logs. Therefore, a neutron log (TNPH) was used as the reference porosity, ranging from 0 to 100%. To achieve consistency for both scale and units, Equation (4) was constructed to convert the density log (RHON) to a scale ranging from 0 to 100, and the converted log is denoted as RHONB. The density log scale-conversion equation is as follows.
In the equation, RHONB is the scale-conversion density log, and RHON is raw density log
As illustrated in Figure 4, Track 6 shows the raw density log alongside its scale-normalized version. The two logs possess identical morphological characteristics, which validates the reliability of the scale-normalization procedure. Track 7 juxtaposes the scale-normalized density log and the neutron log. The two logs share a unified scale, and their cross-over zone is consistent with that of the original logs. On this basis, the magnitude of the cross-over zone can be quantified by the residual between these two processed logs. The above formula is valid for all wells within the target study area.
3.2.2. Calculate Gas Saturation from the Neutron-Density Log Difference
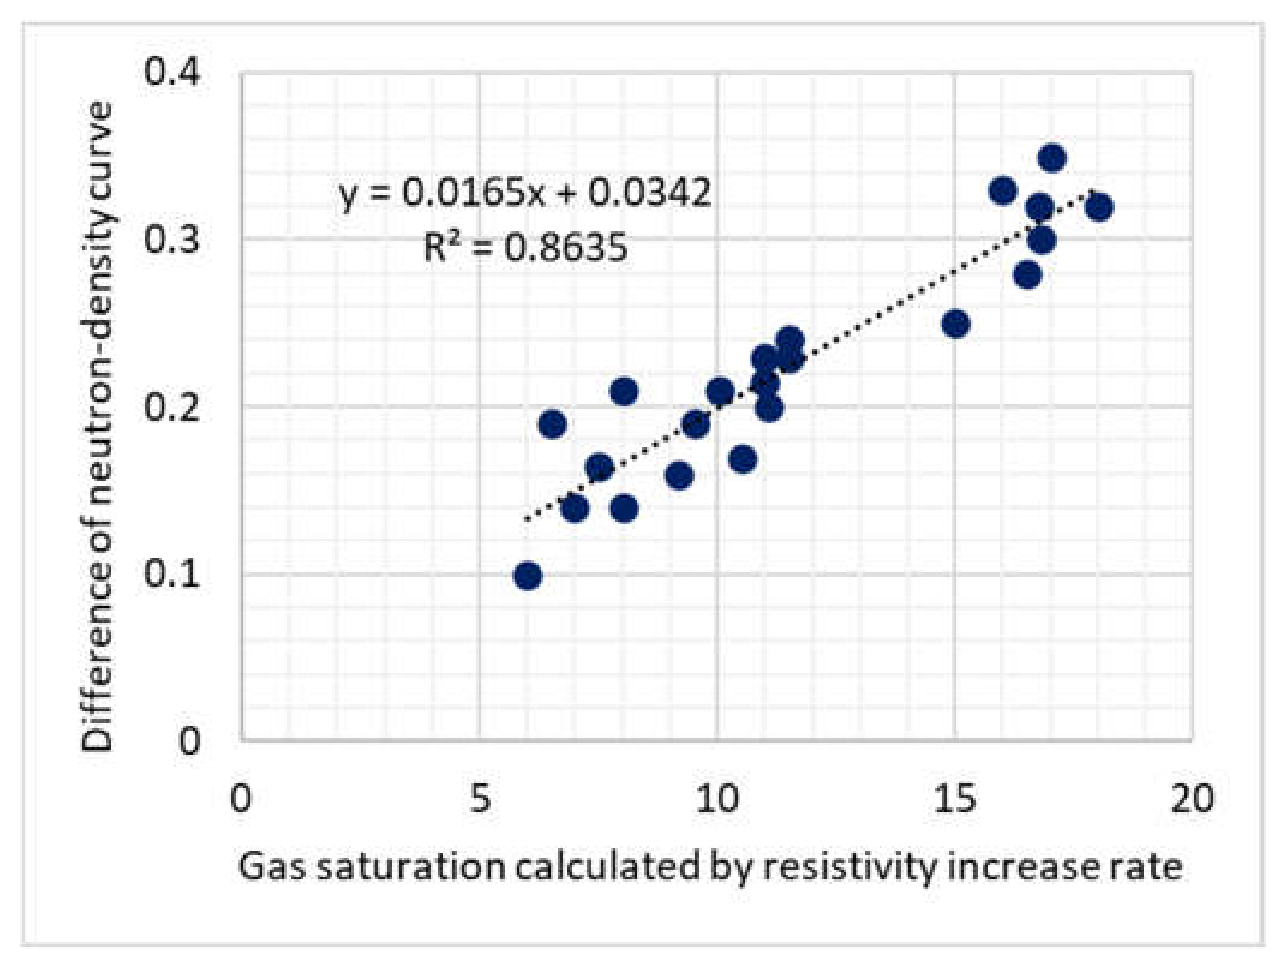
In formations with similar lithologies and physical properties, an increase in the gas content leads to a decrease in the neutron and density values. A relationship was established between the dimension-normalized neutron and density log differences and the gas saturation calculated from the dimension-normalized differences between the neutron and density logs exhibited a strong linear correlation with the gas saturation. Therefore, in the coexistence zone, Equations (5) and (6) can be used to calculate the saturation of free gas in a geological formation.
Figure 5.
Correlation between neutron- density log difference and gas saturation.
The neutron-density log difference is given by:
∆∅=RHONB-TNPH
In the equation, ∆∅ is the difference between the neutron and density logs; RHONB is the scale-conversion density log; TNPH is the neutron log.
The gas saturation of free gas layer is:
In the equation, ∆∅ is the difference between the neutron and density logs; and is the free gas saturation in the coexistence section.
3.3. Calculation of Hydrate Saturation in the Coexistence Section Based on the Formation Model
The coexistence zone, containing both hydrates and free gas, indicates the presence of external conditions conducive to hydrate formation. The simultaneous presence of free gas suggests that the pore space in the geological formation was in a state of gas oversaturation. This zone is composed of bound water, hydrates, and free gas and represents a dynamic equilibrium system formed by the gradual plugging of hydrates at the top and continuous injection of gas sources at the bottom.
To calculate bound water saturation in hydrate formations, Sun et al. (2019) used experimental data to obtain the T2 spectra for saturated and bound water states in core samples from the Shenhu Sea area hydrate reservoir. Based on the calculated saturation, a model for calculating the bound-water saturation was established using principal component analysis and multivariate regression (Sun and Ge, 2019; Ge, 2020) (Equation 7).
In the equation, is the irreducible water saturation, %; is the porosity, calculated by the neutron density log intersection, %; is the specific surface area, based on the lithology to take the regional average 14.86, m2 / g-1; is the mud content, calculated by natural gamma log, %; and is the formation water salinity, with a regional experience value of 3.5, %.
Based on the calculated gas and irreducible water saturations of the coexistence section, the hydrate saturation was calculated using Equation 8.
In the equation, is the hydrate saturation; is the irreducible water saturation; and is the free gas saturation.
4. Application Effect
4.1. Qualitative Identification of Hydrate and Free Gas in Coexistence Section
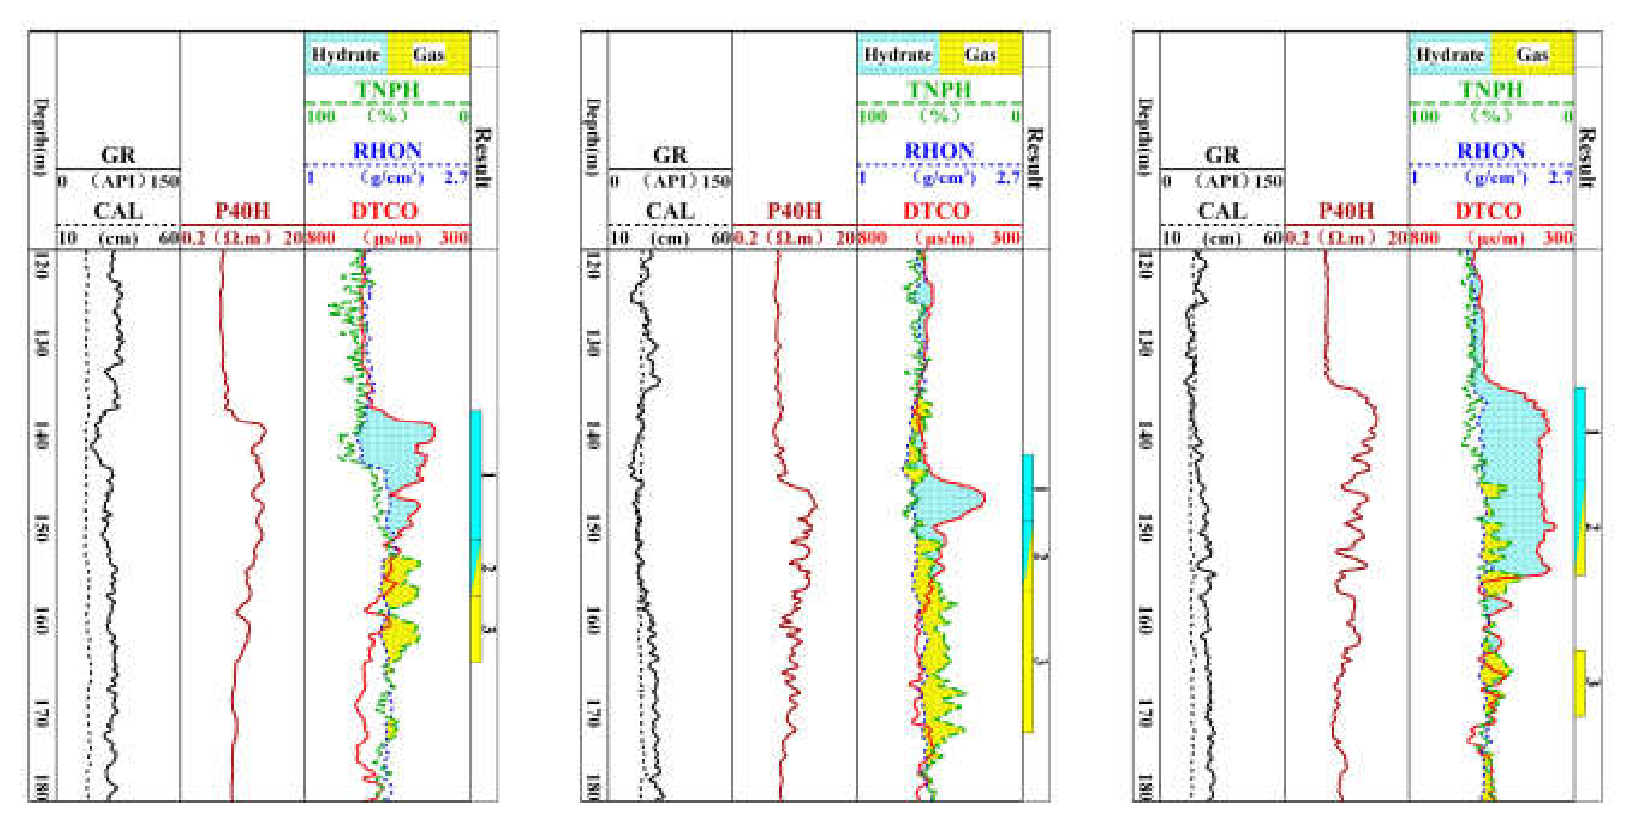
Using well-logging data from multiple wells in the region and intersecting the three porosity logs provided a visual representation of the vertical distribution pattern of hydrate formation. At the top, where hydrates are present, where the acoustic travel time significantly increased and intersected with the density log. At the bottom, where free gas was present, a yellow zone was formed where the neutron and density log values significantly decreased and intersected. In the middle of the coexistence zone, both intersection zones occur simultaneously. The intersecting features from multiple wells confirmed that this vertical distribution pattern is common in the hydrate formation in the Shenhu Area.
Figure 6.
Vertical distribution pattern of hydrate formation in multiple wells in the Shenhu sea area.
Figure 6.
Vertical distribution pattern of hydrate formation in multiple wells in the Shenhu sea area.
4.2. Quantitative Calculation of Hydrate and Free Gas in Coexistence Section
Calculations were performed for the hydrate reservoir in well XX in the Shenhu area to determine the relative contents of coexisting hydrates and free gas. First, Equation (4) was used to transform the density log, unifying the scale and units using the neutron log. As shown in Track 6 of Figure 7, the scale-normalized density log (RHONB) shares identical morphological features with the raw density log (RHON). Accordingly, gas saturation was then calculated using the difference between the neutron and density logs, and the coexistence zone (144.75–163.25m) was found to have a free gas saturation (Sg) 11–35%, with an average of 23%, according to the gas saturation model based on the resistivity increase rate. Based on the bound-water calculation, the bound-water content in the formation was between 21–68%, with an average value of 35%. The hydrate saturation (Sh) in the coexistence zone, calculated using Equation (8) (10th panel), ranged between 31–65%, with an average of 52%. These calculated results were close to the hydrate saturation results obtained from the core experiments, indicating the reliability of the method for determining the relative contents of coexisting hydrates and free gas in the coexistence zone.
5. Conclusion
In response to the inferred vertical distribution pattern of gas hydrates in the Shenhu Sea area, which consists of hydrates at the top, free gas at the bottom, and a coexistence zone in between, we developed methods for the identification and quantitative evaluation of coexisting hydrates and free gas based on conventional well-logging data and core experiments.
(1) Intersection of Three Porosity Logs: The method of intersecting three porosity logs in well-logging data was established to provide a visual representation of the vertical distribution pattern of the hydrate reservoirs. This method effectively identifies the coexistence zone of hydrates and free gas, offering well-logging evidence for reservoir studies.
(2) Quantitative Evaluation of the Coexistence Zone: Addressing the quantitative evaluation challenge posed by the coexistence of hydrates and free gas, a method for dimension-normalized neutron-density difference-based gas saturation calculation was developed. The gas saturation used for calibration was obtained through a resistivity increase rate-gas saturation model constructed based on core experiments.
(3) Calculation of Hydrate Saturation in the Coexistence Zone: By combining the calculation of bound-water saturation using an existing multivariate regression model with the dimension-normalized neutron density difference-based gas saturation calculation method, the hydrate saturation in the coexistence zone can be determined. The results closely aligned with the hydrate saturation values obtained from the core experiments, demonstrating the reliability of the method for calculating the relative content of coexisting hydrates and free gas in the coexistence zone.
(4) The research results can determine the hydrate content in the coexistence zone and provide an important basis for the accurate assessment of natural gas hydrate resources in the sea area. In the future research, the calculation accuracy of the method can be further improved by optimizing the hydrate core experiment scheme, adding various types of sediment lithology, irreducible water and gas content-resistance increase rate experiments.
Author Contributions
Conceptualization, H.L.; Methodology, C.Q.; Validation, J.L.; Formal analysis, Y.X. and Y.Z.; Investigation, B.W.; Resources, D.K.; Supervision, C.Z. All authors have read and agreed to the published version of the manuscript.
Funding
This research received no external funding.
Data Availability Statement
The original contributions presented in this study are included in the article. Further inquiries can be directed to the corresponding author.
Conflicts of Interest
The authors declare no conflict of interest.
References
- Buffett, B. A.; Zatsepina, O. Y. Formation of gas hydrate from dissolved gas in natural porous media[J]. Mar. Geol. 2000, 164(1), 69–77. [Google Scholar] [CrossRef]
- Chen, Y. F.; Li, D. L.; Liang, D. Q.; et al. Relationship between gas hydrate saturation and resistivity in sediments of the South China Sea[J]. Acta Pet. Sin. 2013, 34(3), 509–512. [Google Scholar]
- Chen, Z.; Huang, C. Y.; Yan, W.; et al. Authigenic carbonates as evidence for seeping fluids in Xisha Trough of South China Sea[J]. J. Trop. Oceanogr. 2007, 26(2), 26–32. [Google Scholar]
- Collett, T. S.; Lee, M. W.; Zyrianova, M. V.; et al. Gulf of Mexico Gas Hydrate Joint industry Project Leg II: logging-while-drilling data acquisition and analysis[J]. Mar. Pet. Geol. 2012, 34(1), 41–61. [Google Scholar] [CrossRef]
- Collett, T. S. Natural gas hydrates of the Prudhoe Bay and Kuparuk River area, north slope, Alask[J]. AAPG Bull. 1993, 77(5), 793–812. [Google Scholar] [CrossRef]
- Collett, T. S.; Dallimore, S. R. Detailed analysis of gas hydrate induced drilling and production hazards[C]. In Proceedings of the 4th International Conference on Gas Hydrates, 2002; pp. 47–52. [Google Scholar]
- Collett, T. S.; Lewis, R.; Winters, W. J.; et al. Downhole well log and core montages from the Mount Elbert gas hydrate stratigraphic test we1l, Alaska North Slope[J]. Mar. Pet. Geol. 2011, 28(2), 561–577. [Google Scholar] [CrossRef]
- Ge, C. H. Study on Irreducible Water Saturation in Silty Sand Reservoirs Containing Hydrate[D]; China University of Petroleum, 2020. [Google Scholar]
- Guerin, G.; Goldberg, D.; Meltser, A. Characterization of in situ elastic properties of gas hydrate-bearing sediments on the Blake Ridge[J]. J. Geophys. Res. 1999, 104(8), 17781–17795. [Google Scholar] [CrossRef]
- Kang, D. J.; Liu, J. D.; Li, H. Y.; et al. Establishing Quantitative Evaluation Method for Natural Gas Hydrate Reservoir Parameters in the Shenhu Area, South China Sea[J]. Geoscience 2023. [Google Scholar] [CrossRef]
- Lawson, B. L. Gamma, neutron and density logging[M]; Petroleum Industry Press: Beijing.
- Lee, M. W. Gas hydrates amount estimated from acoustic logs at the Black Ridge, Site 994, 995 and 997[J]. Proc. Ocean Drill. Program (Scientific Results) 2000, 164, 193–198. [Google Scholar]
- Lee, M. W.; Collett, T. S. Gas hydrate and free gas saturations estimated from velocity logs on hydrate Ridge, offshore Oregon, USA[J]. Proc. Ocean Drill. Program Sci. Results 2006, 204, 1–25. [Google Scholar]
- Lee, M. W.; Collett, T. S. In-situ gas hydrate saturation estimated from various well logs at the Mount Elbert Gas Hydrate Stratigraphic Test Well,Alaska North Slope [J]. Mar. Pet. Geol. 2011, 28(2), 439–449. [Google Scholar] [CrossRef]
- Li, H. Y.; Liu, J. D.; Qu, C. X.; et al. A method for calculating gas hydrate saturation by dual parameters of logging[J]. In Frontiers in Earth Science; 2022a. [Google Scholar]
- Li, N.; Sun, W. J.; Li, X. T.; et al. Gas hydrate saturation model and equation for logging interpretation[J]. Pet. Explor. Dev. 2022b, 49(6), 1073–1079. [Google Scholar] [CrossRef]
- Liang, J. Q.; Zhang, G. X.; Lu, J. A.; et al. Accumulation characteristics and genetic models of natural gas hydrate reservoirs in the NE slope of the South China Sea[J]. Nat. Gas. Ind. 2016, 36(10), 157–162. [Google Scholar]
- Lin, L.; Liang, J.; Guo, Y. Q.; et al. Estimating Saturation of Gas Hydrates Within Marine Sediments Using Sonic Log Data[J]. Well Logging Technol. 2014, 38(2), 234–238. [Google Scholar]
- Lu, J. A.; Yang, S. X.; Wu, N. Y.; et al. Well Logging Evaluation of Gas Hydrates in Shenhu Area, South China Sea[J]. Geoscience 2008, 22(3), 447–451. [Google Scholar]
- Malinverno, A.; Kastner, M.; Torres, M. E.; et al. Gas hydrate occurrence from pore water chlorinity and downhole logs in a transect across the northern Cascadia margin (Integrated Ocean Drilling Program Expedition 311) [J]. J. Geophys. Res. 2008, 113(B8), B08103. [Google Scholar] [CrossRef]
- Mo, X. W.; Lu, J. A.; Sha, Z. B.; et al. A new method for gas hydrate saturation estimation using well logging data[J]. J. Jilin Univ. (Earth Science Edition) 2012, 42(4), 921–927. [Google Scholar]
- Ning, F. L.; Liu, L.; Li, S.; et al. Well logging assessment of natural gas hydrate reservoirs and relevant influential factors[J]. Acta Pet. Sin. 2013, 3, 591–606. [Google Scholar]
- Qin, X. W.; Lu, J. G.; Lu, H. L.; et al. Coexistence of natural gas hydrate, free gas and water in the gas hydrate system in the Shenhu Area, South China Sea[J]. China Geol. 2020, 3(2), 210–220. [Google Scholar] [CrossRef]
- Roland, V. H.; Pecher, I. A. Vertical tectonics and the origins of BSRs along the Peru margin [J]. Earth Planet. Sci. Lett. 1999, 166(1), 47–55. [Google Scholar] [CrossRef]
- Su, P. B.; Liang, J. Q.; Sha, Z. B.; et al. Dynamic simulation of gas hydrate reservoirs in the Shenhu area the northern South China Sea[J]. Acta Pet. Sin. 2011, 32(2), 226–232. [Google Scholar]
- Sun, J. M.; Luo, H.; Jiao, T.; et al. Review of the well logging assessment of natural gas hydrate reservoir parameters[J]. Prog. Geophys. 2018, 33(2), 715–723. [Google Scholar]
- Sun, Z. X.; Ge, C. H. Study on the Main Control Factors of Bound Water in Shaly Siltstone Reservoirs[C]. IFEDC 2019. [Google Scholar]
- Xie, Y. F.; Lu, J. A.; Kuang, Z. G.; et al. Well Logging Evaluation for Three - Phase Zone with Gas Hydrate in the Shenhu Area, South China Sea[J]. Geoscience 2022, 36(1), 182–192. [Google Scholar]
- Zeng, X. M.; Yu, X. H.; Wang, Z. G.; et al. Controlling factors of natural gas hydrate in the north of Shenhu area, South China sea[J]. Mar. Geol. Front. 2013, 29(10), 31–40. [Google Scholar]
Figure 1.
Three porosity log intersection diagram of a natural gas hydrate coexistence zone in the Shenhu sea area. GR, gamma ray; CAL, hole diameter; P40H, phase resistivity; TNPH, neutron; RHON, density; DTCO, acoustic interval transit time; and results, interpretation.
Figure 1.
Three porosity log intersection diagram of a natural gas hydrate coexistence zone in the Shenhu sea area. GR, gamma ray; CAL, hole diameter; P40H, phase resistivity; TNPH, neutron; RHON, density; DTCO, acoustic interval transit time; and results, interpretation.
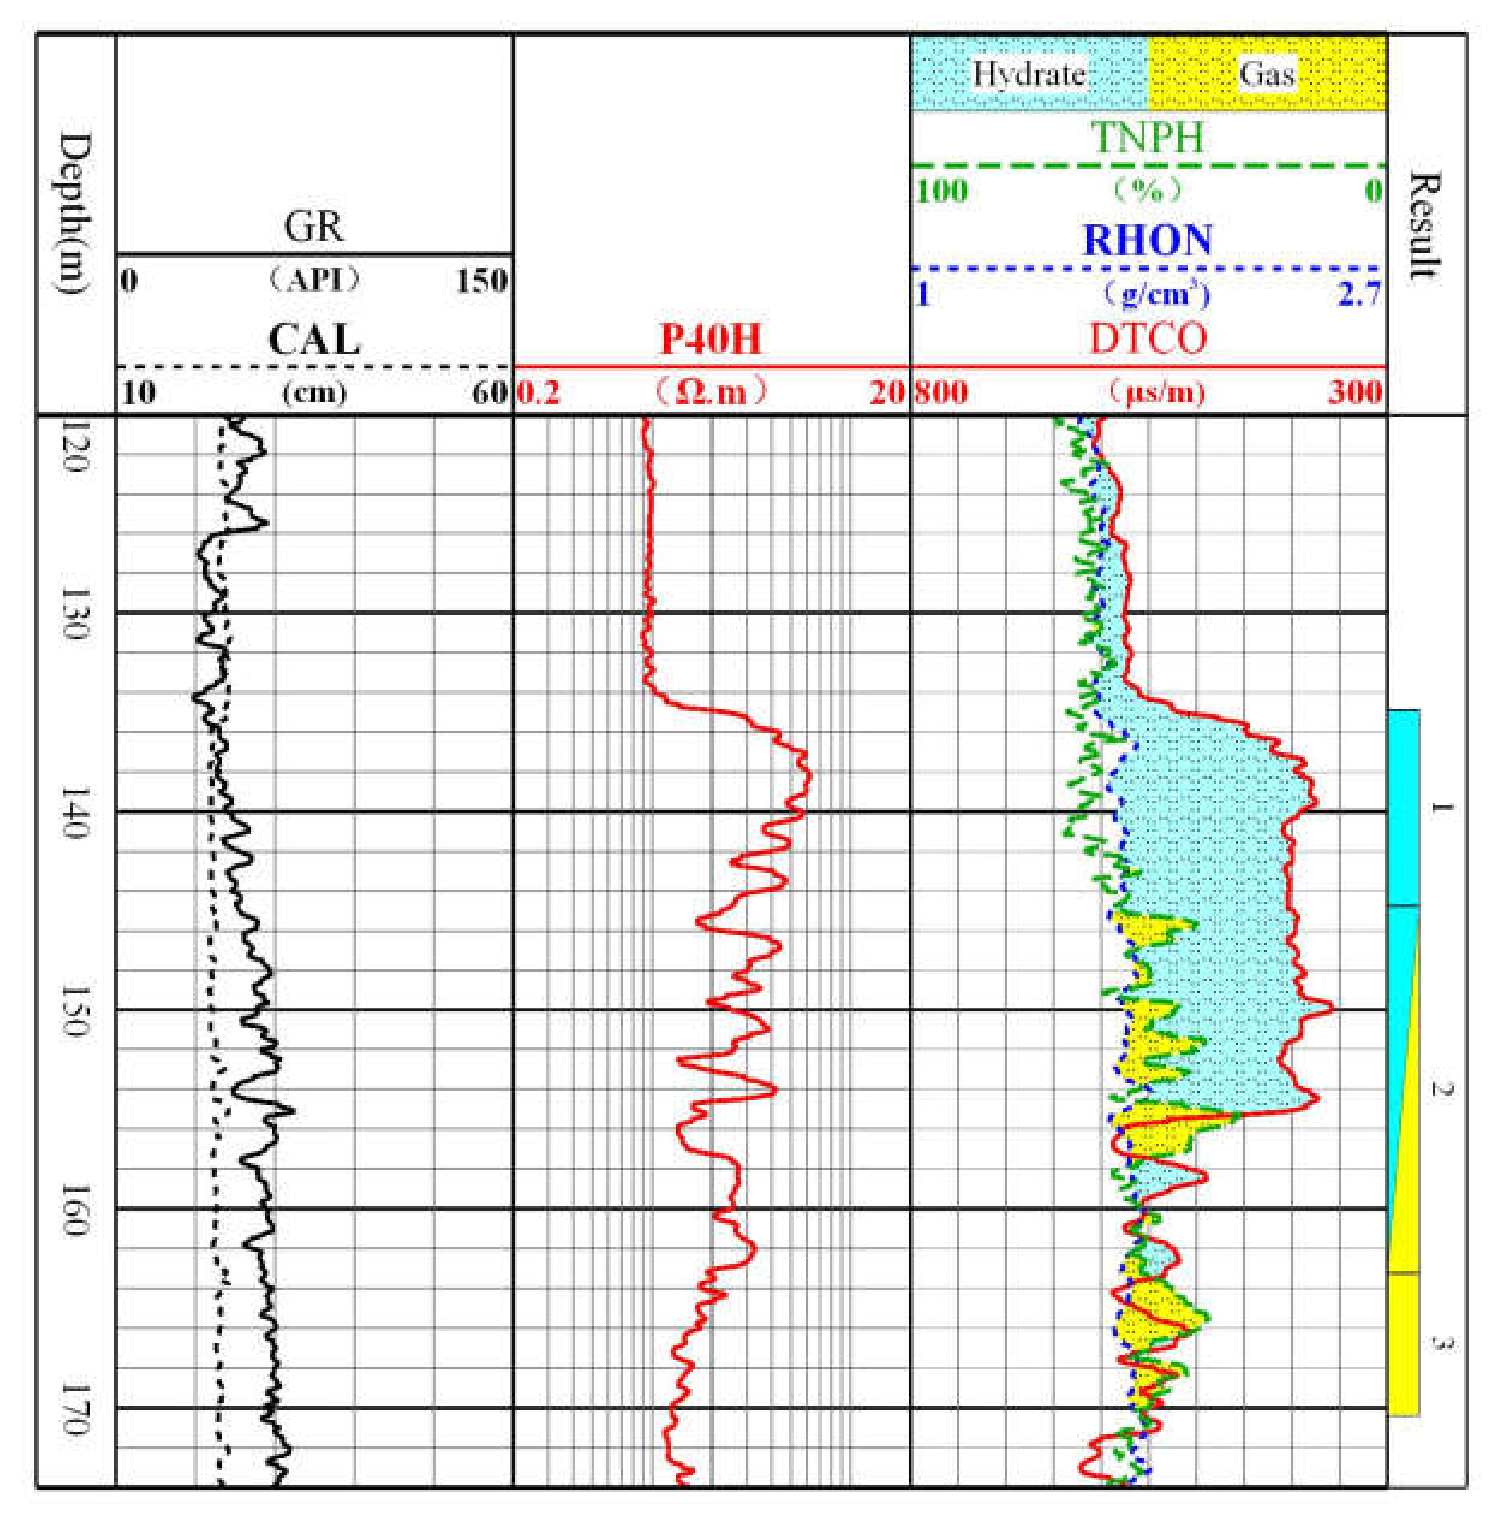
Figure 2.
Correlation of water saturation-resistivity increase rate of sample No.1–4 Sw—water saturation; RI—rate of resistivity accretion.
Figure 2.
Correlation of water saturation-resistivity increase rate of sample No.1–4 Sw—water saturation; RI—rate of resistivity accretion.
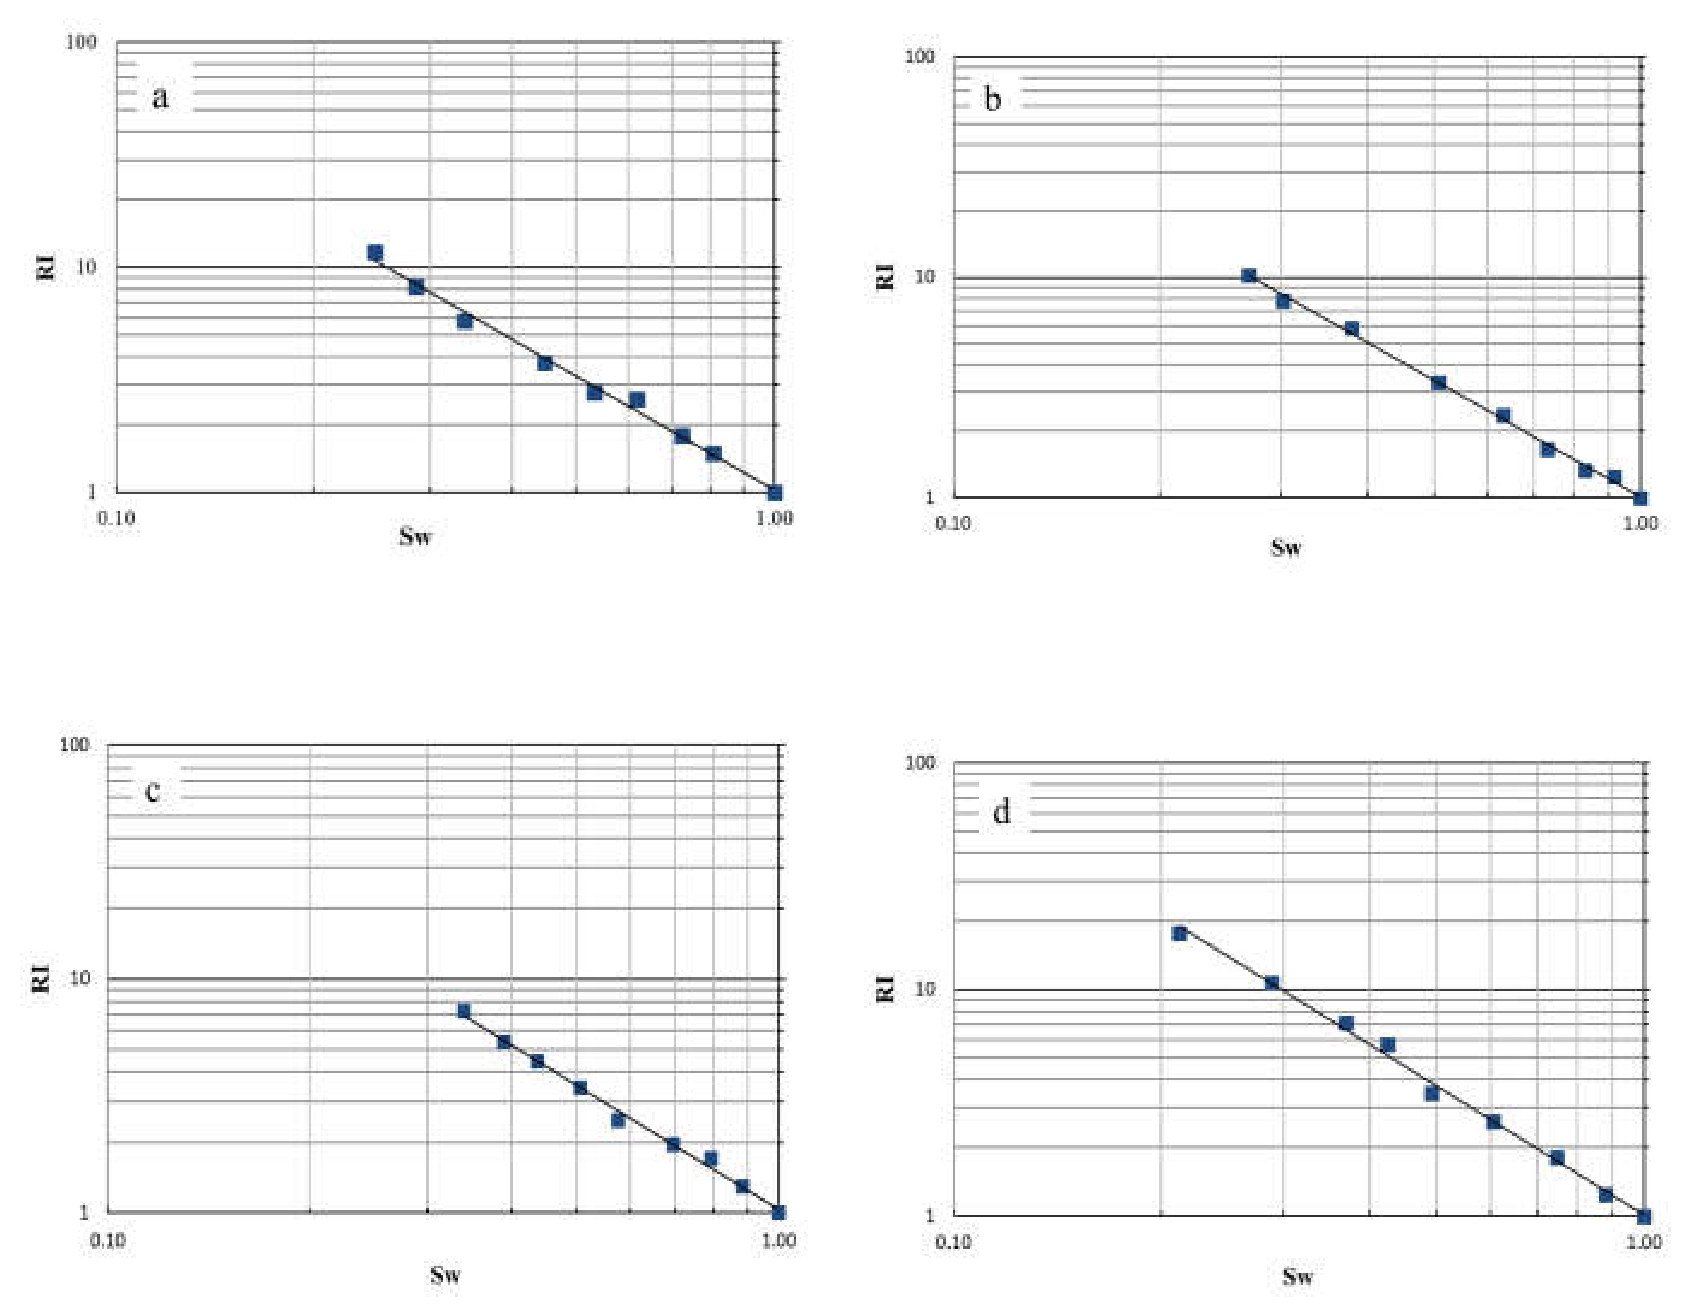
Figure 3.
Correlation of water saturation-resistivity increase rate Sw—water saturation; RI—rate of resistivity accretion.
Figure 3.
Correlation of water saturation-resistivity increase rate Sw—water saturation; RI—rate of resistivity accretion.
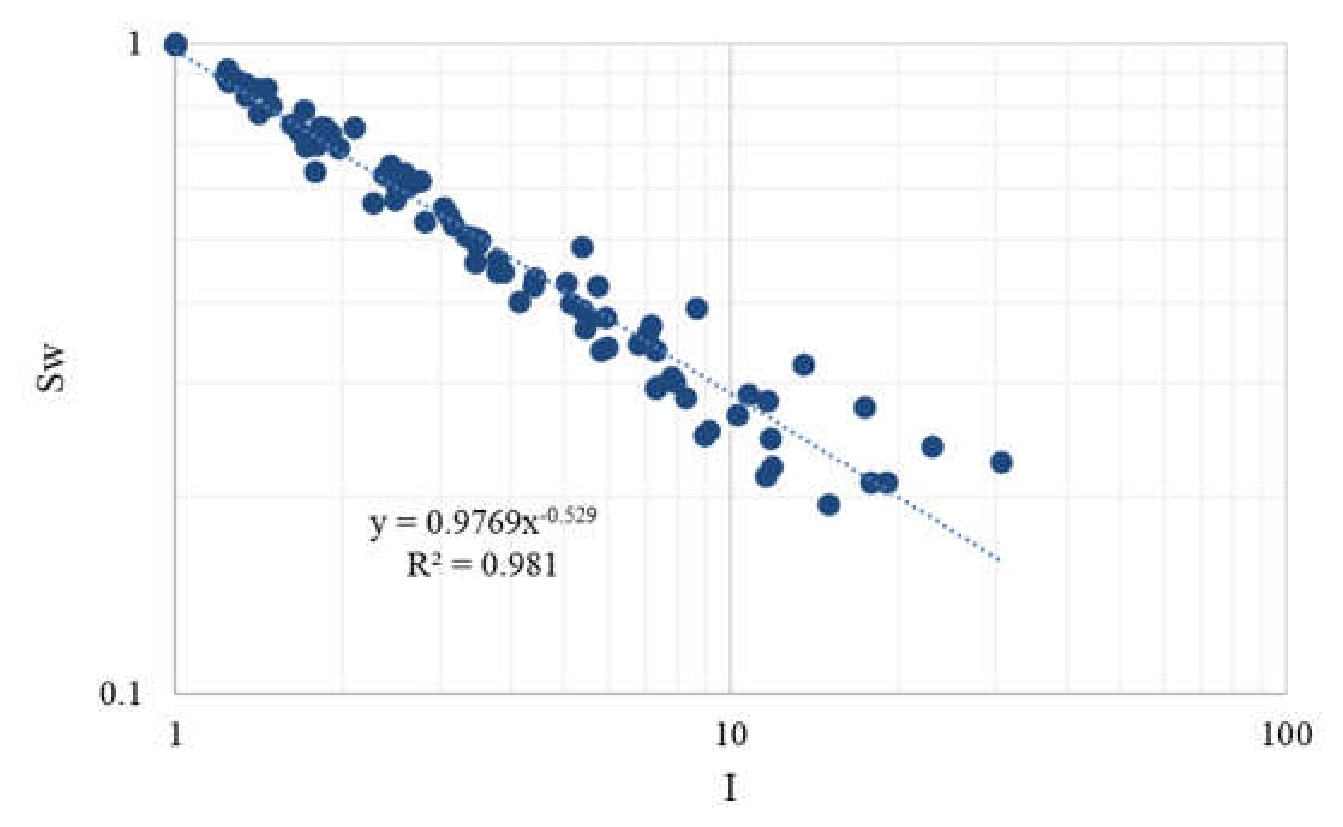
Figure 4.
The well-log plot after scale normalization. GR—gamma ray log; CAL—hole diameter log; P40H—phase resistivity log; TNPH—neutron log; RHON—density log; DTCO—acoustic interval transit time log; Result—interpretation; RHONB—the scale-conversion density log.
Figure 4.
The well-log plot after scale normalization. GR—gamma ray log; CAL—hole diameter log; P40H—phase resistivity log; TNPH—neutron log; RHON—density log; DTCO—acoustic interval transit time log; Result—interpretation; RHONB—the scale-conversion density log.
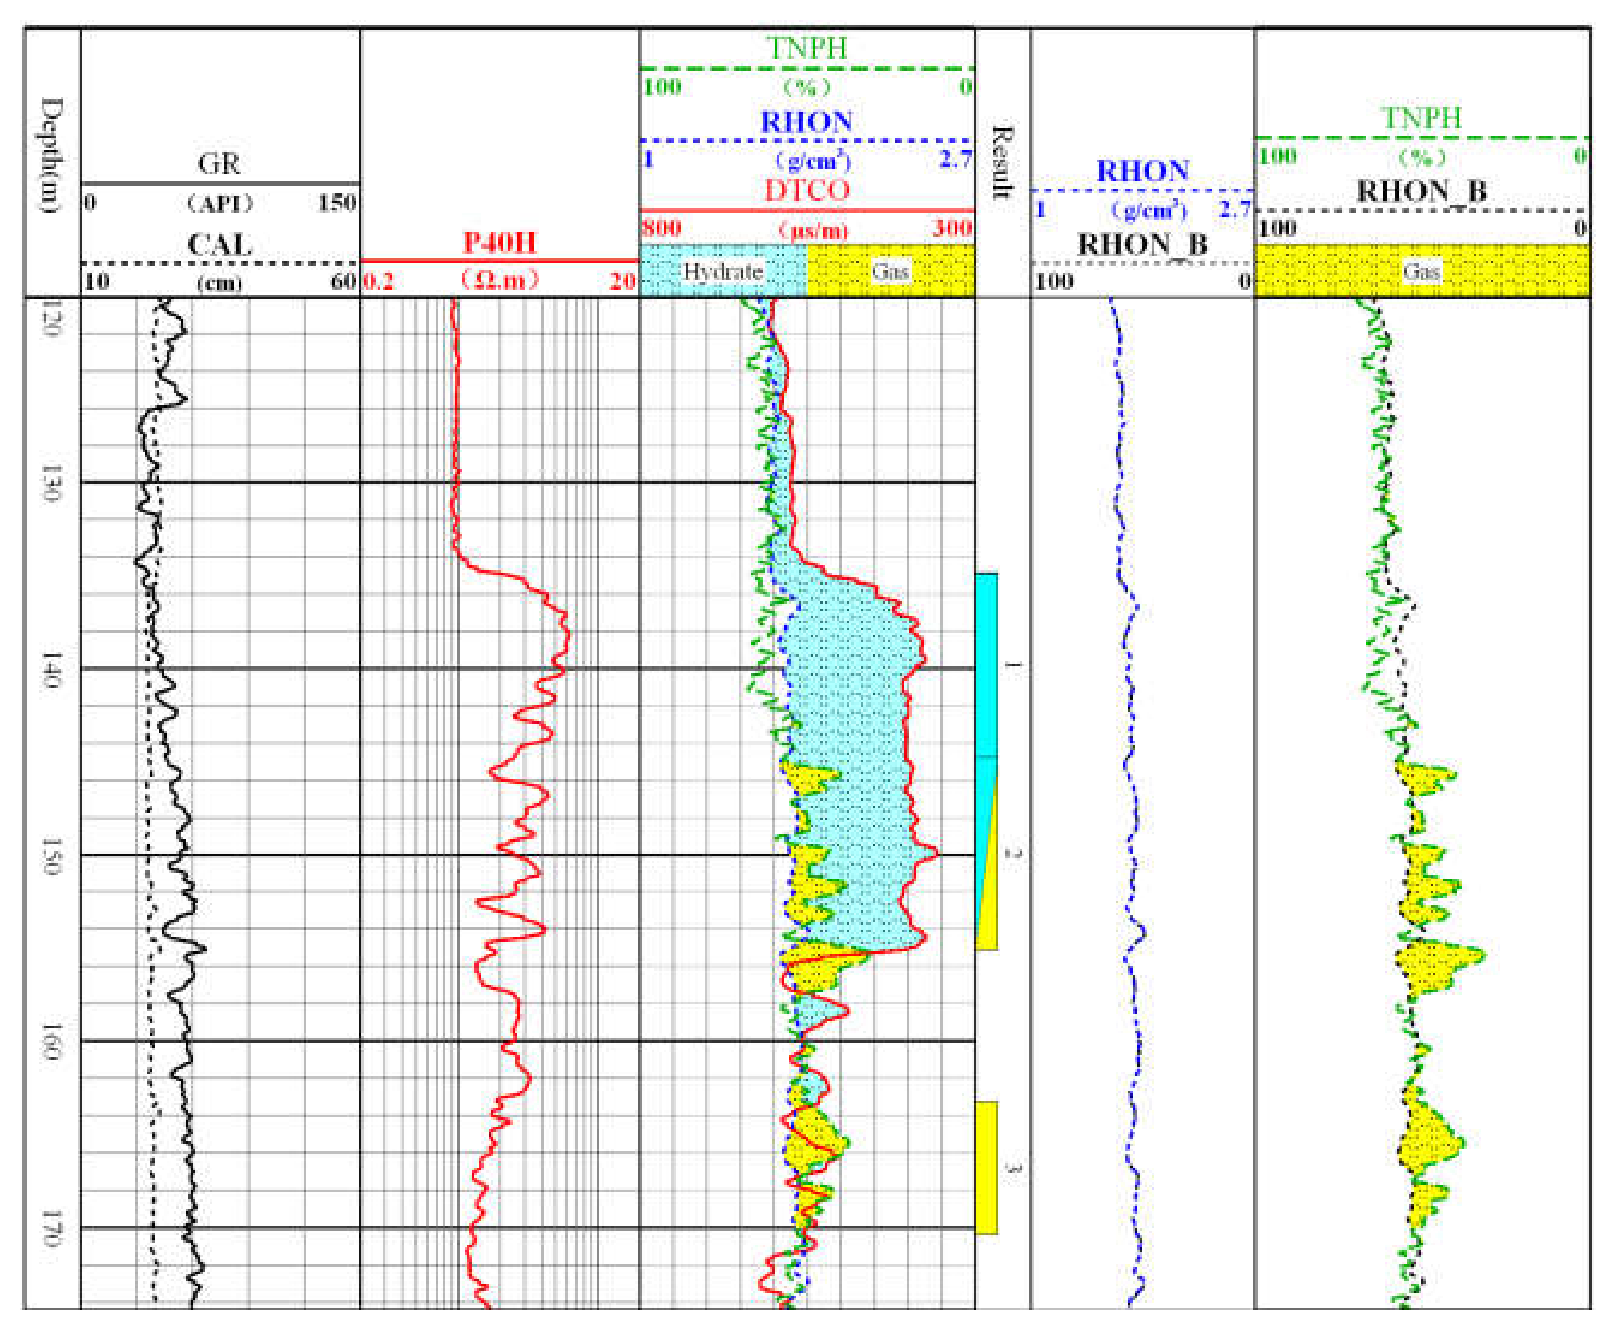
Figure 7.
Relative content of hydrate and free gas in the coexistence section of the hydrate formation in well XX of the Shenhu sea area. GR—gamma ray log; CAL—hole diameter log; P40H—phase resistivity log; TNPH—neutron log; RHON—density log; DTCO—acoustic interval transit time log; Result—interpretation; RHONB—the scale-conversion density log; Swi—saturation of irreducible water; ∆∅—difference between neutron and density logs; -free-gas saturation in coexistence section; Sh- Hydrate saturation in coexistence section; and Sh-core—hydrate saturation from core experiment.
Figure 7.
Relative content of hydrate and free gas in the coexistence section of the hydrate formation in well XX of the Shenhu sea area. GR—gamma ray log; CAL—hole diameter log; P40H—phase resistivity log; TNPH—neutron log; RHON—density log; DTCO—acoustic interval transit time log; Result—interpretation; RHONB—the scale-conversion density log; Swi—saturation of irreducible water; ∆∅—difference between neutron and density logs; -free-gas saturation in coexistence section; Sh- Hydrate saturation in coexistence section; and Sh-core—hydrate saturation from core experiment.
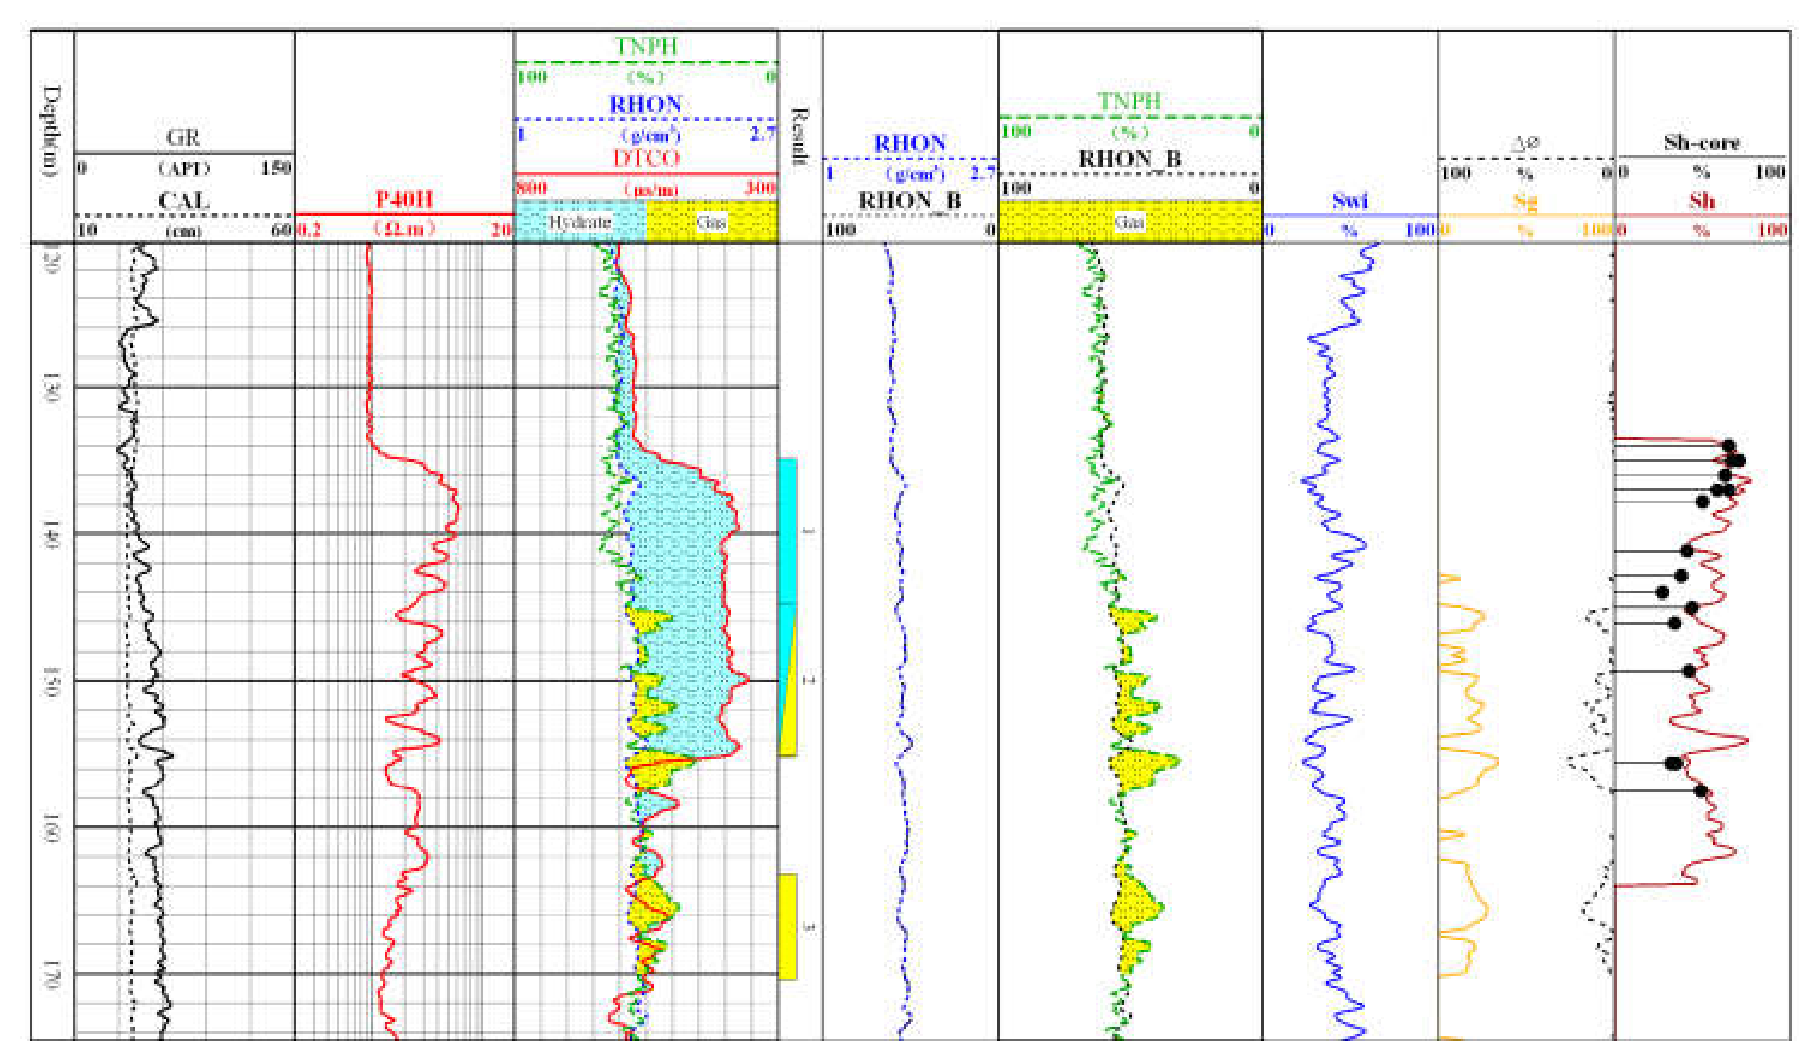

Table 1.
Experimental data of the resistivity increase rate for hydrate formation sediment samples with different gas saturations in the study area.
Table 1.
Experimental data of the resistivity increase rate for hydrate formation sediment samples with different gas saturations in the study area.
| Number of sample | Water saturation | Measuring resistivity | Resistivity index | Number of sample | Water saturation | Measuring resistivity | Resistivity index |
|---|---|---|---|---|---|---|---|
| unit | % | Ω.m | / | unit | % | Ω.m | / |
| 1 | 1 | 0.076014 | 1 | 2 | 1 | 0.064549 | 1 |
| 0.80743 | 0.112994 | 1.486486 | 0.915637 | 0.08002 | 1.239669 | ||
| 0.722899 | 0.13662 | 1.797297 | 0.830882 | 0.086013 | 1.332507 | ||
| 0.617905 | 0.198254 | 2.608108 | 0.731618 | 0.107351 | 1.663085 | ||
| 0.533009 | 0.212789 | 2.799324 | 0.631618 | 0.153123 | 2.372176 | ||
| 0.447138 | 0.287406 | 3.780946 | 0.507843 | 0.214311 | 3.32011 | ||
| 0.338611 | 0.441705 | 5.810811 | 0.379118 | 0.381606 | 5.911846 | ||
| 0.285655 | 0.628536 | 8.268656 | 0.301912 | 0.50786 | 7.867769 | ||
| 0.247625 | 0.893682 | 11.756757 | 0.269118 | 0.661498 | 10.247934 | ||
| 3 | 1 | 0.051705 | 1 | 4 | 1 | 0.051244 | 1 |
| 0.882485 | 0.066626 | 1.288566 | 0.877968 | 0.06394 | 1.247772 | ||
| 0.792872 | 0.08798 | 1.701571 | 0.746658 | 0.09317 | 1.818182 | ||
| 0.694835 | 0.101516 | 1.963351 | 0.604412 | 0.134275 | 2.620321 | ||
| 0.57686 | 0.128587 | 2.486911 | 0.491979 | 0.178119 | 3.475936 | ||
| 0.50595 | 0.177206 | 3.427225 | 0.424358 | 0.293212 | 5.721925 | ||
| 0.43719 | 0.22902 | 4.429319 | 0.369545 | 0.3672 | 7.165775 | ||
| 0.389773 | 0.277477 | 5.366492 | 0.288904 | 0.54806 | 10.695187 | ||
| 0.338946 | 0.376286 | 7.277487 | 0.211898 | 0.913433 | 17.825312 |
Disclaimer/Publisher’s Note: The statements, opinions and data contained in all publications are solely those of the individual author(s) and contributor(s) and not of MDPI and/or the editor(s). MDPI and/or the editor(s) disclaim responsibility for any injury to people or property resulting from any ideas, methods, instructions or products referred to in the content. |
© 2026 by the authors. Licensee MDPI, Basel, Switzerland. This article is an open access article distributed under the terms and conditions of the Creative Commons Attribution (CC BY) license.
Copyright: This open access article is published under a Creative Commons CC BY 4.0 license, which permit the free download, distribution, and reuse, provided that the author and preprint are cited in any reuse.