
Submitted:
25 August 2026
Posted:
07 September 2026
You are already at the latest version
Abstract
Background and Objectives: Outcomes after cochlear implantation are usually judged using audiological measures, although recipients' everyday benefit also depends on psychological and social functioning. This study characterized post-implant quality of life (QoL) across six patient-reported domains and explored factors associated with social integration. Methods: Fifty consecutive cochlear implant recipients completed a 35-item questionnaire covering speech perception, psychological self-esteem, media and music, environmental sound, listening effort, and social integration. Negatively framed items were reverse-scored, and domain scores were transformed to a 0-100 scale. Internal consistency, subgroup comparisons, inter-domain correlations, and multivariable regression were evaluated. Results: Mean overall QoL was 65.3 (95% CI, 60.5-69.7). Media and music received the highest mean score (77.9), whereas listening effort was lowest (56.6). The full questionnaire showed excellent internal consistency (Cronbach's alpha = 0.956). QoL scores did not differ significantly by sex, age group, time since implantation, surgical approach, or SMART NAV use, although several subgroup analyses were underpowered. Psychological self-esteem showed the strongest correlation with social integration (rho = 0.56, p < 0.001) and remained the only significant independent correlate in multivariable analysis (B = 0.456, 95% CI, 0.117-0.795; p = 0.010; R2 = 0.428). Conclusions: In this cohort, post-implant QoL varied across functional domains, with listening effort remaining a relative challenge. Social integration was more closely associated with psychological self-esteem than with individual auditory domains. These findings are exploratory and require confirmation in larger longitudinal studies with pre-implant measurements.
Keywords:
cochlear implantation
; quality of life
; hearing loss
; sensorineural
; social integration
; speech perception
1. Introduction
Sensorineural hearing loss is among the most prevalent chronic sensory deficits worldwide, and when severe-to-profound it imposes substantial limitations on communication, education, employment, and social participation. For individuals who derive insufficient benefit from conventional acoustic amplification, cochlear implantation has become the standard of care, converting acoustic signals into patterned electrical stimulation of the auditory nerve. Decades of outcome research have established that implantation reliably improves speech-recognition scores under controlled laboratory conditions [1], and the procedure is now offered across the lifespan, from prelingually deaf infants to elderly adults with acquired deafness [2,3,4].
However, the clinical metrics traditionally used to certify success, word-recognition percentages, sentence tests, and aided thresholds, capture only a fraction of what the procedure means to the people who undergo it. A recipient may achieve high speech-perception scores in a soundproof booth yet continue to withdraw from group conversations, avoid restaurants, or feel excluded among hearing peers. This divergence between audiometric performance and lived experience has driven a shift toward patient-reported outcome measures that quantify quality of life as the patient defines it, encompassing emotional, social, and recreational dimensions alongside auditory ones [5].
Quality of life after implantation is best understood as a multidimensional construct [6,7]. Speech perception in quiet and in noise represents the most studied dimension, but recipients also report on their ability to enjoy music, to perceive environmental and warning sounds, and on the cognitive effort required to sustain listening throughout a day [8,9]. Equally important are the psychological dimensions of self-esteem and emotional adjustment, and the behavioral dimension of social integration—the degree to which a person re-enters and sustains relationships and community participation after hearing restoration.
Among these dimensions, social integration occupies a special position because it is the outcome that most directly reflects participation in society and is most visible to families and clinicians [10]. Yet its determinants are debated. One view holds that better auditory access mechanically produces better social outcomes, implying that audiological optimization is sufficient. A competing view holds that emotional and self-image factors mediate whether restored hearing actually translates into social engagement, implying that psychosocial support is a necessary complement to device fitting [11].
Surgical and technical factors may also shape outcomes. The choice between a round-window approach and cochleostomy, and the intraoperative use of navigation or electrode-placement guidance systems such as SMART NAV, have been proposed as influences on residual hearing preservation and ultimately on functional benefit [12]. Whether these intraoperative choices produce measurable differences in patient-reported quality of life, however, has rarely been examined in everyday clinical cohorts rather than in highly selected trial populations.
The present study addresses these questions in a real-world sample of cochlear implant recipients. We characterized self-reported quality of life across six domains, tested whether demographic, temporal, and surgical factors were associated with outcomes, and examined which post-implant domains were most strongly associated with social integration. Conventional group comparisons, multivariable modeling, partial correlation, and dimensionality-reduction techniques were used as complementary exploratory analyses rather than to establish causal relationships.
2. Materials and Methods
2.1. Study Design and Participants
This was a single-cohort, cross-sectional observational study of patients who had undergone cochlear implantation and who were able to complete a structured self-report questionnaire. Fifty consecutive recipients agreed to participate and provided complete responses, yielding a final analytic sample of 50. No pre-implantation QoL measurements were collected; therefore, the study assesses post-implant status only and cannot quantify within-patient change attributable to implantation. All participants confirmed, via an introductory consent item, that they had been informed of the anonymous and scientific purpose of the study and agreed to participate; responses were collected anonymously and used exclusively for research purposes.
The cohort comprised 28 women (56%) and 22 men (44%). Age was recorded in ordinal bands, with the majority of participants in the adult band (>18 years, n = 26, 52%), followed by 6-10 years (n = 11), 10-18 years (n = 8), and 0-6 years (n = 5). Because implantation is performed across the lifespan and pediatric recipients constituted a meaningful share of the cohort, age-band was retained as a stratifying variable rather than as an exclusion criterion.
2.2. Questionnaire and Domain Construction
The instrument consisted of 35 Likert-type items, each scored on a five-point ordinal frequency scale (0 = never, 1 = rarely, 2 = sometimes, 3 = often, 4 = always), supplemented by demographic and surgical descriptors. Items covered the breadth of post-implant experience, including conversation in quiet and in noise, perception of voices, music appreciation, recognition of everyday and warning sounds, listening effort and concentration, self-image, and willingness to participate in social situations.
To produce interpretable composite measures, the 35 items were grouped a priori into six conceptual domains: Speech Perception (10 items), Psychological Self-Esteem (6 items), Media and Music (7 items), Environmental Sound (5 items), Listening Effort (4 items), and Social Integration (3 items). Eleven negatively worded items, those in which a higher frequency indicated worse functioning, such as needing to ask for repetition, irritability, frustration, social avoidance, and feeling excluded, were reverse-scored so that for every item a higher value denoted better quality of life. Each domain score was computed as the mean of its constituent items and linearly rescaled to a 0-100 metric, and a global Total score was derived analogously across all 35 items. This harmonization allowed direct visual and statistical comparison across domains of differing item counts.
2.3. Statistical Analysis
Analyses were performed in Python (pandas, SciPy, scikit-learn). Because individual items were ordinal and several domain distributions departed from normality, non-parametric methods were used for inferential group comparisons. Domain scores are bounded 0-100 composite measures. Means and standard deviations are retained as descriptive summaries when available to facilitate interpretation and comparison with prior QoL reports, whereas rank-based tests were used for inference. Medians and interquartile ranges are additionally shown for the overall domain distributions in Figure 1. A bootstrap 95% confidence interval (5,000 resamples) was computed for the Total score. Internal consistency of each domain and of the full instrument was quantified with Cronbach’s alpha [13].
Two-group comparisons (sex, surgical approach, SMART NAV use) used the Mann-Whitney U test, with the rank-biserial correlation reported as the effect size [14]. Comparisons across more than two ordered or nominal groups (age band, time since implantation) used the Kruskal-Wallis H test. Associations between continuous domain scores were assessed with Spearman’s rank correlation. To explore independent statistical associations with social integration, a multivariable ordinary-least-squares regression was fitted with Social Integration as the dependent variable and the five remaining domains as predictors; partial correlations were used to examine attenuation of the speech-social association after adjustment for other domains. A two-sided p-value below 0.05 was considered statistically significant. Because the analyses were exploratory and involved multiple comparisons, no multiplicity correction was applied; p-values are interpreted together with effect sizes, confidence intervals, and the study’s power limitations rather than as definitive confirmatory tests.
No a priori sample-size calculation was performed because the study used a fixed consecutive cohort and was exploratory. A sensitivity analysis was added to define the approximate effects detectable with the available sample at two-sided alpha = 0.05 and 80% power using conventional parametric analogues [14]. With N = 50, the minimum detectable bivariate correlation was approximately |r| = 0.39, and a five-predictor regression required an overall Cohen f2 of approximately 0.29. For two-group comparisons, minimum detectable standardized differences were approximately d = 0.81 for sex (28 versus 22), d = 0.98 for surgical approach (39 versus 11), and d = 1.24 for SMART NAV use (44 versus 6). The <1-year time-since-implant subgroup (n = 3) was too small for reliable power-based inference. Because the actual group tests were rank-based, these sensitivity values are approximate. They indicate limited sensitivity to small or moderate effects and support treating non-significant subgroup findings as inconclusive rather than as evidence of no association.
2.4. Exploratory Analyses
Beyond conventional comparisons, three additional techniques were applied to extract structure that simple group tests cannot reveal. First, principal component analysis (PCA) was performed on the standardized six-domain matrix [15] to determine how much of the total variance in patient experience could be reduced to a small number of latent dimensions and to inspect the loading structure of the leading components. Second, a median split on self-esteem was used to contrast social-integration outcomes between psychologically high- and low-scoring recipients, complementing the continuous regression with a clinically intuitive dichotomy. Third, floor and ceiling rates were quantified for the social domain to assess the interpretability of the scale at its extremes.
These exploratory analyses were specified to characterize the structure of post-implant quality of life rather than to test a single confirmatory hypothesis, and their results are interpreted as hypothesis-generating. Concordance across group comparison, regression, partial correlation, and dimensionality reduction was used as descriptive triangulation of associations with social integration, not as evidence of causality or mediation.
3. Results
The cohort included 28 women (56%) and 22 men (44%). Twenty-six participants (52%) were in the >18-year age band, while 24 (48%) were in the three pediatric age bands. Three participants (6%) were <1 year after implantation, 21 (42%) were 1-5 years after implantation, and 26 (52%) were >5 years after implantation. The round-window approach was used in 39 cases (78%), cochleostomy in 11 (22%), and SMART NAV in 6 (12%) (Table 1).
Media and music had the highest mean domain score (77.9), followed by social integration (71.8). Mean scores were 64.6 for environmental sound, 64.2 for psychological self-esteem, 59.0 for speech perception, and 56.6 for listening effort. The mean Total score was 65.3, with a bootstrap 95% confidence interval of 60.5 to 69.7. Internal consistency was high for the full instrument (alpha = 0.956), while listening effort (alpha = 0.570) and social integration (alpha = 0.650) showed lower reliability and should be interpreted cautiously (Table 2).
Mean scores were numerically higher in the cochleostomy group across all domains, with the largest difference for environmental sound (73.2 versus 62.2). No comparison reached statistical significance (all p >= 0.141). Given the 39-versus-11 group imbalance and an approximate detectable standardized difference of d = 0.98 at 80% power, these null results are inconclusive for smaller effects (Table 3).
Mean scores were lowest in the <1-year group for each domain. Media and music had H = 4.46 (p = 0.108), and the Total score had H = 3.47 (p = 0.177); no comparison reached statistical significance. Because only three participants were in the <1-year group, these cross-sectional comparisons are highly imprecise and should not be interpreted as longitudinal improvement or plateau (Table 4).
Women had higher mean scores than men across the reported domains. The largest difference was in speech perception (65.1 versus 51.1; rank-biserial r = -0.312; p = 0.061), followed by listening effort (60.3 versus 52.0; r = -0.278; p = 0.093). No sex comparison reached statistical significance. With 28 women and 22 men, the approximate standardized difference detectable with 80% power was d = 0.81; therefore, the null results do not establish equivalence between sexes (Table 5).
Speech perception correlated with environmental sound (rho = 0.81), listening effort (rho = 0.68), and media and music (rho = 0.60). The strongest observed bivariate correlation with social integration was psychological self-esteem (rho = 0.56, p < 0.001); correlations between social integration and the auditory domains ranged from rho = 0.32 to 0.43. These are associations among self-reported domains and do not establish directionality (Table 6).
In the multivariable model, psychological self-esteem was the only coefficient with p < 0.05 (B = 0.456, 95% CI 0.117-0.795, p = 0.010). Speech perception was not statistically significant (B = 0.179, 95% CI -0.295 to 0.653, p = 0.451), and neither were media and music, environmental sound, or listening effort. The overall model had R2 = 0.428 and adjusted R2 = 0.363 (F(5,44) = 6.58, p < 0.001). Given N = 50, five correlated predictors, and an approximate detectable overall effect of f2 = 0.29, individual coefficients should be interpreted as exploratory associations; non-significant coefficients do not rule out smaller independent effects (Table 7).
The zero-order correlation between speech perception and social integration was rho = 0.32. It decreased to partial r = 0.11 after controlling for listening effort and to r = 0.19 after controlling for self-esteem. This attenuation is consistent with shared variance among domains but does not demonstrate mediation or a causal pathway. In the exploratory median split, the high-self-esteem group had a mean social-integration score of 81.3 compared with 62.3 in the low-self-esteem group (p = 0.001); the continuous analyses remain more informative than this dichotomized comparison (Table 8).
PC1 explained 66.4% of total variance and had positive loadings across all six domains (0.36-0.46). PC2 explained a further 13.0% of variance. On PC2, self-esteem (+0.56) and social integration (+0.59) had positive loadings, whereas speech perception (-0.47), listening effort (-0.28), and environmental sound (-0.19) had negative loadings. This pattern is descriptive and hypothesis-generating (Table 9).
Figure 1 shows the overall distribution of domain scores. Media and music had a median of 85.7 (IQR 71.4-92.9), social integration a median of 75.0 (IQR 58.3-89.6), and listening effort a median of 56.2 (IQR 45.3-62.5). The figure also shows substantial between-participant variation across domains.
Figure 2 visualizes the correlation matrix. Speech perception was most strongly correlated with environmental sound (rho = 0.81), followed by listening effort (rho = 0.68) and media and music (rho = 0.60). Social integration correlated with the self-reported auditory domains at rho = 0.32-0.43 and with self-esteem at rho = 0.56.
Figure 3 shows the PCA biplot. All domain vectors loaded positively on PC1, which explained 66.4% of variance. On PC2 (13.0% of variance), self-esteem and social integration loaded positively, while speech perception, listening effort, and environmental sound loaded negatively. These loading directions describe the structure of the present dataset without implying distinct causal pathways.
4. Discussion
4.1. Analysis of Findings
This cross-sectional study describes post-implant quality of life across six self-reported domains in 50 cochlear implant recipients. The mean Total score was 65.3 (95% CI 60.5-69.7); media and music had the highest mean score and listening effort the lowest. These findings are broadly consistent with prior quality-of-life studies [16,17]. However, because no pre-implant baseline was collected, the observed scores cannot be interpreted as improvement caused by implantation. No demographic, temporal, or surgical comparison reached statistical significance, and the sensitivity analysis indicates that these null subgroup findings are inconclusive rather than evidence of equivalence.
The strongest observed association with social integration was psychological self-esteem [20,21,22]. In the multivariable model, self-esteem remained associated with social integration (B = 0.46, 95% CI 0.12-0.79, p = 0.010), whereas the speech-perception coefficient was not statistically significant and had a wide confidence interval. Partial correlations and PCA were directionally consistent with greater overlap between the psychosocial domains than between speech perception and social integration. These analyses do not establish that self-esteem causes social integration, mediates auditory benefit, or is more important than auditory performance in the broader cochlear-implant population. The modest sample size and correlations among predictor domains further limit the precision of individual regression coefficients [23,24].
The results support considering psychosocial factors alongside audiological outcomes in follow-up care [25]. Counseling, peer support, and self-efficacy interventions may be reasonable components of multidisciplinary rehabilitation [26,27], but the present data do not establish that psychosocial rehabilitation should receive priority over audiological optimization. Likewise, the non-significant sex and time-since-implant findings are not sufficiently powered to guide targeted follow-up strategies [28,29]. Prospective studies with pre-implant measurements and larger samples are needed to test whether changes in self-esteem predict or mediate later social participation. The present findings are best viewed as hypothesis-generating within a biopsychosocial framework [30].
4.2. Study Limitations
Several limitations constrain interpretation. First, the cross-sectional design and absence of pre-implant QoL measurements prevent estimation of within-patient change or causal effects of implantation. Second, no a priori sample-size calculation was performed. The sensitivity analysis shows limited power for subgroup comparisons, particularly for the <1-year (n = 3), SMART NAV (n = 6), and cochleostomy (n = 11) groups; non-significant results therefore cannot be interpreted as evidence of equivalence. The regression included five correlated predictors in only 50 participants, so individual coefficients may be unstable and smaller independent associations may have been missed. Third, age and time since implantation were captured as ordinal bands rather than continuous values. Pediatric and adult recipients were analyzed within the same framework, without a separate analysis of developmental stage or questionnaire-completion mode, which further limits age-group comparisons. Fourth, all outcomes were self-reported, and no objective audiometric correlate was available for the speech-perception domain. Fifth, listening effort and social integration had modest internal consistency, and the study did not include external validation of the study-specific questionnaire. Sixth, multiple exploratory analyses were performed without multiplicity correction, increasing the possibility of chance findings. In addition, the retained aggregate subgroup output did not include dispersion statistics for Table 4 and Table 5, so no SD or IQR values were fabricated. Finally, the single-center, anonymized design prevented adjustment for etiology, electrode type, comorbidity, and socioeconomic status.
5. Conclusions
In this cross-sectional sample, the mean post-implant Total QoL score was 65.3/100, with media and music scoring highest and listening effort lowest. No subgroup comparison reached statistical significance; however, the limited and uneven sample sizes prevent these null findings from being interpreted as evidence of equivalence. Psychological self-esteem showed the strongest observed association with social integration and was the only coefficient with p < 0.05 in the multivariable model, but the cross-sectional design and limited statistical power do not establish causality or show that psychosocial factors are more important than auditory performance. The findings support assessment of psychosocial as well as audiological outcomes and justify larger longitudinal studies with pre-implant baseline measurements before specific rehabilitation priorities are inferred.
Author Contributions
Conceptualization, C.M.N. and A.N.; methodology, C.M.N., E.M.D. and A.N.; software, C.M.N.; validation, A.N. and I.A.S.; formal analysis, C.M.N. and E.M.D.; investigation, C.M.N. and E.M.D.; resources, A.N.; data curation, C.M.N. and I.A.S.; writing—original draft preparation, C.M.N. and E.M.D.; writing—review and editing, A.N. and I.A.S.; visualization, I.A.S.; supervision and project administration, A.N. All authors have read and agreed to the published version of the manuscript.
Funding
The authors received no specific funding for this work.
Institutional Review Board Statement
The study was conducted in accordance with the Declaration of Helsinki and was approved by the Ethics Committee of the George Emil Palade University of Medicine, Pharmacy, Science, and Technology of Targu Mures, Romania.
Informed Consent Statement
Informed consent was obtained from all subjects involved in the study.
Data Availability Statement
The data presented in this study are available on request from the corresponding author.
Acknowledgments
The authors used ChatGPT, an AI language model developed by OpenAI (San Francisco, CA, USA), to exclusively improve the manuscript’s language and readability. All the scientific content, interpretations, and conclusions are the original work of the authors.
Conflicts of Interest
The authors declare no conflict of interest.
References
- Gaylor, J.M.; Raman, G.; Chung, M.; Lee, J.; Rao, M.; Lau, J.; Poe, D.S. Cochlear implantation in adults: A systematic review and meta-analysis. JAMA Otolaryngol. Head Neck Surg. 2013, 139, 265–272. [Google Scholar]
- World Health Organization. World Report on Hearing; WHO: Geneva, Switzerland, 2021. [Google Scholar]
- Wilson, B.S.; Dorman, M.F. Cochlear implants: A remarkable past and a brilliant future. Hear. Res. 2008, 242, 3–21. [Google Scholar] [CrossRef]
- Carlson, M.L. Cochlear implantation in adults. N. Engl. J. Med. 2020, 382, 1531–1542. [Google Scholar] [CrossRef]
- McRackan, T.R.; Bauschard, M.; Hatch, J.L.; Franko-Tobin, E.; Droghini, H.R.; Nguyen, S.A.; Dubno, J.R. Meta-analysis of quality-of-life improvement after cochlear implantation. Laryngoscope 2018, 128, 982–990. [Google Scholar] [CrossRef]
- Hinderink, J.B.; Krabbe, P.F.; Van Den Broek, P. Development and application of a health-related quality-of-life instrument for adults with cochlear implants: The Nijmegen Cochlear Implant Questionnaire. Otolaryngol. Head Neck Surg. 2000, 123, 756–765. [Google Scholar] [CrossRef]
- Gatehouse, S.; Noble, W. The Speech, Spatial and Qualities of Hearing Scale (SSQ). Int. J. Audiol. 2004, 43, 85–99. [Google Scholar] [CrossRef]
- Capretta, N.R.; Moberly, A.C. Does quality of life depend on speech recognition performance for adult cochlear implant users? Laryngoscope 2016, 126, 699–706. [Google Scholar] [CrossRef]
- Limb, C.J.; Roy, A.T. Technological, biological, and acoustical constraints to music perception in cochlear implant users. Hear. Res. 2014, 308, 13–26. [Google Scholar] [CrossRef]
- Mertens, G.; Andries, E.; Claes, A.J.; Topsakal, V.; Van de Heyning, P.; Van Rompaey, V.; Calvino, M.; Cuda, D.; Gantz, B.J. Cognitive improvement after cochlear implantation in older adults. Ear Hear. 2021, 42, 1100–1110. [Google Scholar] [CrossRef]
- Sladen, D.P.; Carlson, M.L.; Dowling, B.P.; Olund, A.P.; DeJong, M.D.; Breneman, A.; Hollander, S.; Beatty, C.W.; Neff, B.A.; Driscoll, C.L. Cochlear implantation in adults with asymmetric hearing loss. Otol. Neurotol. 2018, 39, 576–581. [Google Scholar] [CrossRef]
- Knopke, S.; Olze, H. Hearing rehabilitation with cochlear implants and cognitive abilities. HNO 2018, 66, 364–368. [Google Scholar] [CrossRef]
- Tavakol, M.; Dennick, R. Making sense of Cronbach’s alpha. Int. J. Med. Educ. 2011, 2, 53–55. [Google Scholar] [CrossRef]
- Cohen, J. Statistical Power Analysis for the Behavioral Sciences, 2nd ed.; Lawrence Erlbaum: Hillsdale, NJ, USA, 1988. [Google Scholar]
- Jolliffe, I.T.; Cadima, J. Principal component analysis: A review and recent developments. Philos. Trans. R. Soc. A 2016, 374, 20150202. [Google Scholar] [CrossRef]
- Lenarz, T.; Muller, L.; Czerniejewska-Wolska, H.; Vaerenberg, B.; Lorens, A.; Skarzynski, P.H. Patient-related benefits of cochlear implantation: A multicentre study. Audiol. Neurotol. 2017, 22, 61–73. [Google Scholar] [CrossRef]
- Olze, H.; Grabel, S.; Haupt, H.; Forster, U.; Mazurek, B. Extra benefit of a second cochlear implant with respect to tinnitus and quality of life. Otol. Neurotol. 2012, 33, 1169–1175. [Google Scholar] [CrossRef]
- Hawthorne, G.; Hogan, A.; Giles, E.; Stewart, M.; Kethel, L.; White, K.; Plaith, B.; Pedley, K.; Rushbrooke, E.; Taylor, A. Evaluating the health-related quality of life effects of cochlear implants. Int. J. Audiol. 2004, 43, 183–192. [Google Scholar] [CrossRef]
- Contrera, K.J.; Betz, J.; Li, L.; Blake, C.R.; Sung, Y.K.; Choi, J.S.; Lin, F.R. Quality of life after intervention with a cochlear implant or hearing aid. Laryngoscope 2016, 126, 2110–2115. [Google Scholar] [CrossRef]
- Vermeire, K.; Brokx, J.P.; Wuyts, F.L.; Cochet, E.; Hofkens, A.; Van de Heyning, P.H. Quality-of-life benefit from cochlear implantation in the elderly. Otol. Neurotol. 2005, 26, 188–195. [Google Scholar] [CrossRef]
- Damen, G.W.; Beynon, A.J.; Krabbe, P.F.; Mulder, J.J.; Mylanus, E.A. Cochlear implantation and quality of life in postlingually deaf adults: Long-term follow-up. Otolaryngol. Head Neck Surg. 2007, 136, 597–604. [Google Scholar] [CrossRef]
- Moberly, A.C.; Bates, C.; Harris, M.S.; Pisoni, D.B. The enigma of poor performance by adults with cochlear implants. Otol. Neurotol. 2016, 37, 1522–1528. [Google Scholar] [CrossRef]
- Pisoni, D.B.; Kronenberger, W.G.; Harris, M.S.; Moberly, A.C. Three challenges for future research on cochlear implants. World J. Otorhinolaryngol. Head Neck Surg. 2017, 3, 240–254. [Google Scholar] [CrossRef]
- Hughes, S.E.; Hutchings, H.A.; Rapport, F.L.; McMahon, C.M.; Boisvert, I. Social connectedness and perceived listening effort in adult cochlear implant users. Ear Hear. 2018, 39, 922–934. [Google Scholar] [CrossRef]
- Cosetti, M.K.; Pinkston, J.B.; Flores, J.M.; Friedmann, D.R.; Jones, C.B.; Roland, J.T.; Waltzman, S.B. Neurocognitive testing and cochlear implantation: Insights into performance in older adults. Clin. Interv. Aging 2016, 11, 603–613. [Google Scholar] [CrossRef]
- Sonnet, M.H.; Montaut-Verient, B.; Niemier, J.Y.; Hoen, M.; Ribeyre, L.; Parietti-Winkler, C. Cognition, quality of life, and tinnitus in cochlear implant recipients. Front. Neurosci. 2017, 11, 729. [Google Scholar]
- Cohen, S.M.; Labadie, R.F.; Dietrich, M.S.; Haynes, D.S. Quality of life in hearing-impaired adults: The role of cochlear implants and hearing aids. Otolaryngol. Head Neck Surg. 2004, 131, 413–422. [Google Scholar] [CrossRef]
- Bierbaum, M.; McMahon, C.M.; Hughes, S.; Boisvert, I.; Lau, A.Y.S.; Braithwaite, J.; Rapport, F. Barriers and facilitators to cochlear implant uptake in Australia and the United Kingdom. Ear Hear. 2020, 41, 374–385. [Google Scholar] [CrossRef]
- Boisvert, I.; Reis, M.; Au, A.; Cowan, R.; Dowell, R.C. Cochlear implantation outcomes in adults: A scoping review. PLoS ONE 2020, 15, e0232421. [Google Scholar] [CrossRef]
- Andries, E.; Gilles, A.; Topsakal, V.; Vanderveken, O.M.; Van de Heyning, P.; Van Rompaey, V.; Mertens, G. Systematic review of quality-of-life outcomes after cochlear implantation in adults. J. Clin. Med. 2021, 10, 4503. [Google Scholar] [CrossRef]
Figure 1.
Distribution of quality-of-life domain scores across the cohort (N = 50). Boxes show the interquartile range, the horizontal line the median, the white diamond the mean, and jittered points individual patients. Media and music had the highest median (85.7) and listening effort the lowest (56.2).
Figure 1.
Distribution of quality-of-life domain scores across the cohort (N = 50). Boxes show the interquartile range, the horizontal line the median, the white diamond the mean, and jittered points individual patients. Media and music had the highest median (85.7) and listening effort the lowest (56.2).
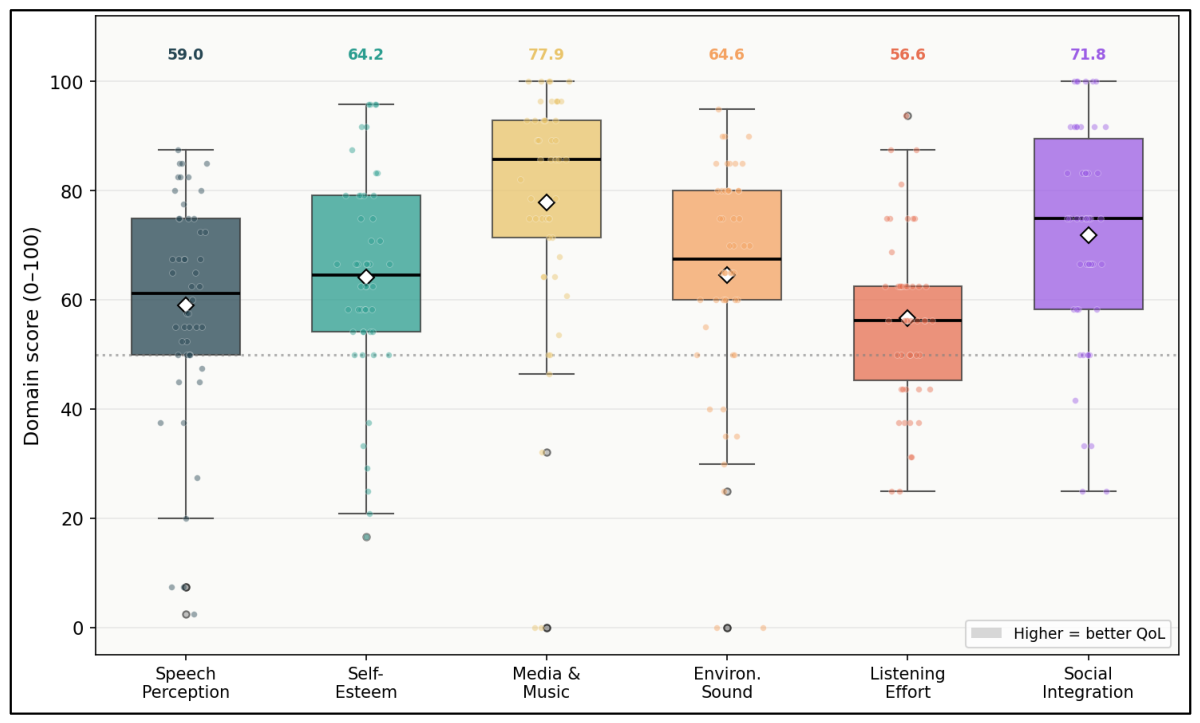
Figure 2.
Inter-domain correlation heatmap (Spearman rho). Cell shading encodes correlation strength from low (blue) to high (red); the diagonal is unity. The strongest off-diagonal association links speech perception and environmental sound (rho = 0.81), while self-esteem correlates more strongly with social integration (rho = 0.56) than any auditory domain does.
Figure 2.
Inter-domain correlation heatmap (Spearman rho). Cell shading encodes correlation strength from low (blue) to high (red); the diagonal is unity. The strongest off-diagonal association links speech perception and environmental sound (rho = 0.81), while self-esteem correlates more strongly with social integration (rho = 0.56) than any auditory domain does.
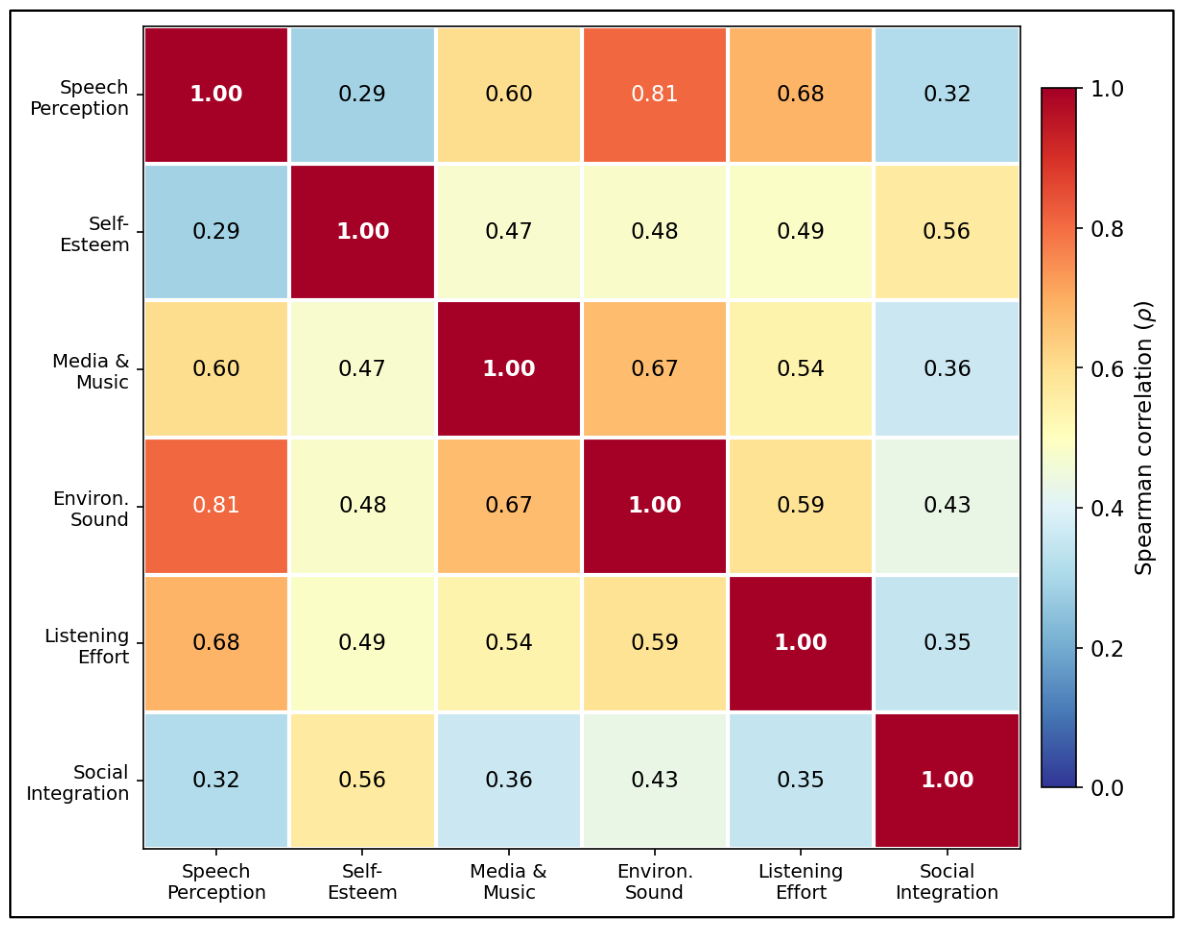
Figure 3.
Principal component analysis biplot of the six quality-of-life domains. Arrows are domain loading vectors; points are the 50 patients colored by time since implantation. PC1 (66.4% of variance) is a general-benefit axis; PC2 (13.0%) separates the psychosocial domains (self-esteem, social) from the auditory domains.
Figure 3.
Principal component analysis biplot of the six quality-of-life domains. Arrows are domain loading vectors; points are the 50 patients colored by time since implantation. PC1 (66.4% of variance) is a general-benefit axis; PC2 (13.0%) separates the psychosocial domains (self-esteem, social) from the auditory domains.
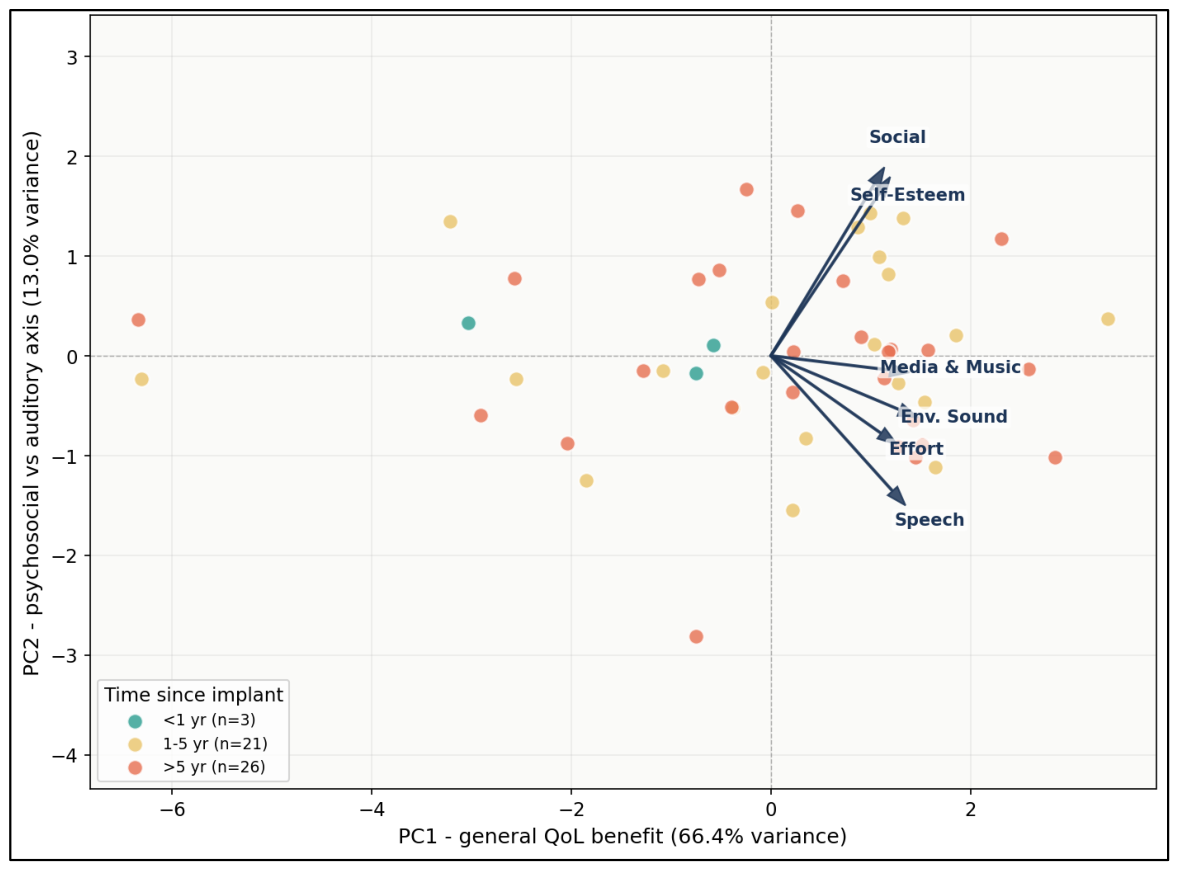

Table 1.
Cohort characteristics (N = 50).
| Characteristic | Category | n | % |
|---|---|---|---|
| Sex | Female | 28 | 56.0 |
| Male | 22 | 44.0 | |
| Age band | 0-6 years | 5 | 10.0 |
| 6-10 years | 11 | 22.0 | |
| 10-18 years | 8 | 16.0 | |
| >18 years | 26 | 52.0 | |
| Time since implant | <1 year | 3 | 6.0 |
| 1-5 years | 21 | 42.0 | |
| >5 years | 26 | 52.0 | |
| Surgical approach | Round window | 39 | 78.0 |
| Cochleostomy | 11 | 22.0 | |
| SMART NAV | Not used | 44 | 88.0 |
| Used | 6 | 12.0 |
Table 2.
Domain scores, internal consistency, and bootstrap confidence interval.
| Domain | Items | Mean (0-100) | SD | Cronbach alpha |
|---|---|---|---|---|
| Speech Perception | 10 | 59.0 | 19.6 | 0.903 |
| Psychological Self-Esteem | 6 | 64.2 | 19.4 | 0.793 |
| Media & Music | 7 | 77.9 | 22.6 | 0.947 |
| Environmental Sound | 5 | 64.6 | 21.2 | 0.870 |
| Listening Effort | 4 | 56.6 | 15.5 | 0.570 |
| Social Integration | 3 | 71.8 | 20.3 | 0.650 |
| Total | 35 | 65.3 | 17.0 | 0.956 |
Total QoL bootstrap 95% CI: 60.5-69.7. Negatively worded items reverse-scored so higher = better.
Table 3.
Exploratory quality of life comparison by surgical approach (Mann-Whitney U test).
| Domain | Round window (n=39) | Cochleostomy (n=11) | U | p |
|---|---|---|---|---|
| Speech Perception | 57.6 +/- 22.2 | 63.6 +/- 12.7 | 190 | 0.573 |
| Self-Esteem | 64.3 +/- 19.7 | 63.6 +/- 19.0 | 208 | 0.888 |
| Media & Music | 77.6 +/- 24.1 | 79.2 +/- 17.8 | 222 | 0.869 |
| Environmental Sound | 62.2 +/- 22.5 | 73.2 +/- 14.5 | 152 | 0.141 |
| Listening Effort | 55.4 +/- 16.3 | 60.8 +/- 12.8 | 169 | 0.286 |
| Social Integration | 70.9 +/- 20.5 | 75.0 +/- 19.7 | 186 | 0.516 |
| Total | 64.3 +/- 18.2 | 68.8 +/- 10.9 | 198 | 0.708 |
Values are mean +/- SD. U = Mann-Whitney U statistic.
Table 4.
Exploratory quality of life comparison by time since implantation (Kruskal-Wallis H test).
| Domain | <1 yr (n=3) | 1-5 yr (n=21) | >5 yr (n=26) | H | p |
|---|---|---|---|---|---|
| Speech Perception | 50.0 | 56.4 | 62.0 | 2.35 | 0.309 |
| Self-Esteem | 56.9 | 64.9 | 64.4 | 1.15 | 0.563 |
| Media & Music | 61.9 | 77.2 | 80.4 | 4.46 | 0.108 |
| Environmental Sound | 53.3 | 66.9 | 64.0 | 2.30 | 0.317 |
| Listening Effort | 41.7 | 58.0 | 57.2 | 2.74 | 0.254 |
| Social Integration | 61.1 | 73.4 | 71.8 | 1.25 | 0.535 |
| Total | 54.0 | 65.2 | 66.7 | 3.47 | 0.177 |
Values are unadjusted domain means (0-100). H = Kruskal-Wallis statistic (df = 2). The retained aggregate subgroup output did not include SD or IQR values; no dispersion values were imputed or reconstructed. These comparisons are exploratory.
Table 5.
Exploratory quality of life comparison by sex with effect sizes (Mann-Whitney U test).
| Domain | Female (n=28) | Male (n=22) | U | Rank-biserial r | p |
|---|---|---|---|---|---|
| Speech Perception | 65.1 | 51.1 | 404 | -0.312 | 0.061 |
| Self-Esteem | 65.8 | 62.1 | 332 | -0.078 | 0.645 |
| Media & Music | 82.8 | 71.8 | 377 | -0.224 | 0.179 |
| Environmental Sound | 68.4 | 59.8 | 351 | -0.140 | 0.404 |
| Listening Effort | 60.3 | 52.0 | 394 | -0.278 | 0.093 |
| Social Integration | 76.5 | 65.9 | 387 | -0.256 | 0.122 |
| Total | 69.6 | 59.7 | 392 | -0.273 | 0.103 |
Values are unadjusted domain means (0-100). Negative r denotes higher ranks among women under the coding used. The retained aggregate subgroup output did not include SD or IQR values; no dispersion values were imputed or reconstructed. These comparisons are exploratory.
Table 6.
Inter-domain Spearman correlation matrix (rho).
| Speech | SelfEst | Media | EnvSnd | Effort | Social | |
|---|---|---|---|---|---|---|
| Speech | 1.00 | 0.29 | 0.60 | 0.81 | 0.68 | 0.32 |
| Self-Esteem | 0.29 | 1.00 | 0.47 | 0.48 | 0.49 | 0.56 |
| Media & Music | 0.60 | 0.47 | 1.00 | 0.67 | 0.54 | 0.36 |
| Environmental Sound | 0.81 | 0.48 | 0.67 | 1.00 | 0.59 | 0.43 |
| Listening Effort | 0.68 | 0.49 | 0.54 | 0.59 | 1.00 | 0.35 |
| Social Integration | 0.32 | 0.56 | 0.36 | 0.43 | 0.35 | 1.00 |
Spearman rank correlation coefficients. Social-Self-Esteem rho = 0.56 (p < 0.001).
Table 7.
Multivariable linear regression: predictors of Social Integration.
| Predictor | B (unstd.) | SE | t | p |
|---|---|---|---|---|
| Intercept | 23.81 | 9.83 | 2.42 | 0.020 |
| Speech Perception | 0.179 | 0.235 | 0.76 | 0.451 |
| Self-Esteem | 0.456 | 0.168 | 2.71 | 0.010 |
| Media & Music | 0.102 | 0.172 | 0.59 | 0.558 |
| Environmental Sound | 0.097 | 0.257 | 0.38 | 0.706 |
| Listening Effort | -0.105 | 0.216 | -0.49 | 0.628 |
Model: R2 = 0.428, Adjusted R2 = 0.363, F(5,44) = 6.58, p < 0.001.
Table 8.
Partial correlations and exploratory self-esteem group comparison.
| Relationship | Zero-order rho | Partial r | Control variable |
|---|---|---|---|
| Speech <-> Social | 0.32 | 0.11 | Listening Effort |
| Speech <-> Social | 0.32 | 0.19 | Self-Esteem |
| Self-Esteem <-> Social (high vs low) | -- | 81.3 vs 62.3 (p = 0.001) | Median split |
Partial r controls for the listed variable. Median split contrasts group means.
Table 9.
Principal component analysis of the six-domain structure.
| Domain | PC1 loading | PC2 loading |
|---|---|---|
| Speech Perception | 0.42 | -0.47 |
| Self-Esteem | 0.37 | +0.56 |
| Media & Music | 0.43 | -0.05 |
| Environmental Sound | 0.46 | -0.19 |
| Listening Effort | 0.39 | -0.28 |
| Social Integration | 0.36 | +0.59 |
| Variance explained | 66.4% | 13.0% |
PC1 and PC2 explained 66.4% and 13.0% of variance, respectively; cumulative variance = 79.4%. PCA is descriptive and does not establish causal pathways.
Disclaimer/Publisher’s Note: The statements, opinions and data contained in all publications are solely those of the individual author(s) and contributor(s) and not of MDPI and/or the editor(s). MDPI and/or the editor(s) disclaim responsibility for any injury to people or property resulting from any ideas, methods, instructions or products referred to in the content. |
© 2026 by the authors. Licensee MDPI, Basel, Switzerland. This article is an open access article distributed under the terms and conditions of the Creative Commons Attribution (CC BY) license (http://creativecommons.org/licenses/by/4.0/).
Copyright: This open access article is published under a Creative Commons CC BY 4.0 license, which permit the free download, distribution, and reuse, provided that the author and preprint are cited in any reuse.