

Submitted:
04 September 2026
Posted:
07 September 2026
You are already at the latest version
Abstract
As AI increasingly supports human decision-making, designing clear and usable explanations has become a key challenge. Explainable Artificial Intelligence (XAI) aims to address this challenge, yet it remains unclear which explanation characteristics contribute to effective human-AI interaction. Following PRISMA guidelines, this systematic review synthesizes evidence from 161 empirical studies that directly compared multiple XAI implementations using human-centered evaluation metrics. Studies were analyzed across four explanation aspects: method, content, format, and interaction. Results were highly heterogeneous and often showed limited or non-significant differences between explanation implementations. Variations in explanation methods and content rarely produced consistent effects on user outcomes. In contrast, user-facing design choices, particularly explanation format and interaction, showed more consistent effects on user-related outcomes. Overall, the findings suggest that explanation effectiveness depends less on the underlying algorithm and more on how explanations are presented and experienced, highlighting the importance of a user-centered design perspective for XAI research and practice.
Keywords:
explainable AI
; human-AI interaction
; user studies
; explanation design
; interactivity
1. Introduction
The field of Artificial Intelligence (AI) is rapidly expanding, with AI technologies being increasingly integrated into everyday life. With the current, often opaque, AI systems, there are concerns about the lack of transparency and interpretability. The General Data Protection Regulation (GDPR) has emphasized the importance of the explainability of AI systems and that end-users have the “right to explanation” (Díaz-Rodríguez et al., 2023; Goodman & Flaxman, 2017). As a solution to these concerns, there is a growing interest in Explainable AI (XAI), which aims to increase the transparency of AI systems and make the outcomes understandable to users, by providing explanations of the inner workings of the algorithm (Samek & Müller, 2019).
In the early stages of the field, XAI research primarily focused on providing explanations for experts and AI developers, often with the goal of improving model accuracy and system performance (Vieira & Digiampietri, 2022). Consequently, many XAI solutions were based on developers’ intuitions of a ‘good’ explanation, rather than on knowledge from social sciences or empirical evidence (Miller, 2019). More recently, research has shifted towards more participatory approaches to XAI, actively involving end-users in the design and evaluation of explanations (Cabitza et al., 2023; Laato et al., 2022; D. Wang et al., 2019). As AI systems are increasingly deployed in non-technical, yet safety-critical domains, such as healthcare (e.g., Bussone et al., 2015; Cai et al., 2019), criminal justice (e.g., Dodge et al., 2019), and education (e.g., Farrow, 2023), the primary users are often lay users without technical expertise (Islam et al., 2022). For these users, explanations play a crucial role in enabling them to interpret, evaluate, and appropriately weigh AI-generated recommendations when making decisions. Identifying explanation approaches that are broadly useful and meaningful for end-users is therefore important for effective human–AI interaction (Amershi et al., 2014; Samek & Müller, 2019).
However, it remains unclear which factors contribute to effective explanations. Existing user studies report mixed findings regarding the impact of XAI on human-AI interaction (Haque et al., 2023; Rong et al., 2024; Schemmer et al., 2022). While many studies indicate that explanations can improve outcomes such as trust, understanding, usability, and collaboration performance (Haque et al., 2023; Rong et al., 2024), others find limited or no significant benefits of XAI (Schemmer et al., 2022). A potential reason for these inconsistent results is the substantial heterogeneity across studies, including differences in XAI implementations, explanation designs, application domains, and end-user evaluation methods. This diversity makes it difficult to identify which characteristics of XAI implementations, or which contextual factors within specific domains, contribute to effective human-AI interaction, as well as to determine whether observed effects generalize across use cases and domains. Addressing this challenge requires systematic comparisons of the factors that influence key outcome measures.
Numerous frameworks have been proposed to suggest factors that contribute to effective explanations. In their scoping review, Cortiñas-Lorenzo et al. (2025) identified as many as 73 frameworks that address different aspects of XAI design, implementation, and evaluation. Despite differences in terminology, scope, and emphasis, these frameworks show quite some overlapping factors that are considered important for a 'good' explanation. Some frameworks primarily focus on guiding the design of explanations (e.g., Adhikari et al., 2022; Cabour et al., 2023; D. Wang et al., 2019), while others emphasize user-centered evaluation (e.g., Confalonieri & Alonso-Moral, 2024; Donoso-Guzmán et al., 2023; Holzinger et al., 2020). However, most of these frameworks remain largely theoretical, as they are rarely empirically tested or systematically applied in user-centered research. As a result, it remains unclear which factors are most critical for effective explanations, which factors consistently contribute to positive outcomes, and which do not. Moreover, it is unclear which factors are domain- or use-case–specific and which generalize more broadly across the field of XAI.
Existing reviews of XAI implementations report generally positive, yet mixed, effects of AI explanations on performance and user experience, compared to systems without explanations or without AI support altogether (e.g., Haque et al., 2023; Islam et al., 2022; Johs et al., 2022; Laato et al., 2022; Rong et al., 2024; Schemmer et al., 2022). While such comparisons are useful for establishing whether explanations can influence human-AI interaction, they provide limited insight into which characteristics of explanations are responsible for these effects. If an explanation outperforms a no-explanation condition, it remains unclear whether this is due to the specific explanation implementation or simply the presence of additional information. To gain a clearer understanding of the factors that contribute to effective AI explanations, it is necessary to move beyond comparisons with null conditions and instead directly compare different XAI approaches. Such comparisons should ideally isolate the effects of specific explanation elements while keeping all other variables constant across conditions, so-called matched controls. This approach enables a more precise assessment of which design choices drive differences in outcomes. To date, existing reviews have rarely adopted this comparative perspective, limiting their ability to explain the heterogeneous findings in the literature or to identify which specific design elements contribute to improved performance and user experience. As an exception, Rong et al. (2024) take an initial step by identifying a small subset of 29 studies that directly compare different XAI implementations. Their findings suggest that certain explanation features, such as simplicity, relevance, and alignment with user goals, can influence effectiveness, but also highlight that results remain inconsistent and highly context-dependent. Moreover, their review is restricted to conference publications up to 2022, leaving more recent studies and work published in journals or other venues largely unexplored. As a result, a comprehensive and up-to-date synthesis of studies that systematically compare XAI implementations is still lacking.
In particular, we aim to understand whether explanation effectiveness is primarily determined by the underlying AI or XAI method (as is often the focus in existing studies, such as those summarized in Rong et al., 2024), or whether it depends more on how explanations are presented and how users interact with them.
We conceptualize these influences as a spectrum (See Figure 1), ranging from (X)AI-centered aspects (e.g., model type, explanation algorithm) to human-centered aspects (e.g., presentation format, user expertise, interaction design). While prior research has mostly focused on the technical side of this spectrum, it is still an open question where the most important determinants of effective explanations lie along this spectrum. Identifying the relative importance of these aspects, and whether this varies across use cases, is essential for designing XAI systems that meaningfully support human decision-making.
Therefore, in this paper, we conduct a systematic review of empirical studies that directly compared different implementations of XAI in terms of their effects on human–AI collaboration outcomes. Our review addresses the following research question:
“How do different implementations of explainable Artificial Intelligence (XAI) compare to one another in terms of human-AI interaction outcomes?”
To address this research question, based on a careful comparison of the existing frameworks, we organize the review around four key aspects of XAI explanations. This structure serves two purposes. First, it provides a systematic way to compare the highly diverse explanation implementations found in the literature. Second, it allows us to examine whether explanation effectiveness is primarily determined by technical characteristics of the AI system or by design choices that are closer to the human user.
Existing taxonomies and frameworks distinguish between different types of XAI implementations in various ways (e.g., Donoso-Guzmán et al., 2023; S. Hong & Park, 2025; Miller, 2019; Sheridan et al., 2024). Although these frameworks differ in terminology and emphasis, they share several common elements. Typically, they start with the technical explanation method used to generate the explanation, and subsequently address aspects such as what information should be presented and how it should be presented (i.e., the user interface). Some frameworks additionally consider the interaction between the end user and the system. Across these aspects, the spectrum between AI and human involvement becomes visible again, ranging from the internal workings of the AI system to the user’s interpretation and interaction (as shown in Figure 1).
Building on this shared structure, we follow the core ideas of these frameworks along this spectrum and distinguish four aspects of an explanation: method, content, format, and interaction. These aspects closely resemble the explanation elements described by Donoso-Guzmán et al. (2023), although we adopt a more general terminology.
Explanation method refers to the technical approaches or generation procedures used to produce the explanation (for example, whether the system relies on feature attributions, counterfactual reasoning, or example-based retrieval). This aspect concerns how the explanation is computed.
Explanation content refers to the information that is selected as the explanation, independent of how it is presented. In a feature-based approach, this might be the specific features and their importance scores; in an example-based method, the chosen training examples.
Explanation format concerns the way this content is presented to the user (i.e. the user interface), such as a bar chart, a table of numbers, a highlighted image, or a short textual statement. While the content stays the same, its representation differs.
Lastly, interaction refers to how users are facilitated to engage with the presented explanation. This includes the ways in which users can explore and respond to explanations, for example by requesting additional details, selecting alternative views, or interacting with visual elements.
In the following sections, we examine these four aspects in more detail and outline which explanation elements fall within each aspect. Given the diversity of frameworks, which differ in focus from general AI design to specific XAI mechanisms, this four-part structure helps to organize what might otherwise appear as a fragmented and heterogeneous field. Although this framework provides a useful analytical structure, the boundaries between aspects are not always clear-cut. Explanation elements and comparisons may involve multiple aspects at the same time, and decisions regarding one aspect may shape or depend on decisions in another aspect.
2. Theoretical Background
2.1. Explanation Method
To systematically analyze explanation methods in XAI, prior literature proposes several dimensions along which methods can be classified. A widely adopted taxonomy distinguishes between (i) intrinsic vs. post-hoc explanations, (ii) model-specific vs. model-agnostic methods, and (iii) global vs. local explanations (Molnar, 2025). These dimensions provide a conceptual foundation for organizing explanation methods, which can be further differentiated based on the type of explanation they produce.
Intrinsic (ante-hoc) interpretability refers to models that are inherently transparent by design, such as linear models, decision trees, or rule-based systems. These models enable direct inspection of their internal logic. In contrast, post-hoc methods aim to explain already trained models, often treated as black boxes, without modifying their internal structure. This distinction is important, as post-hoc approaches allow the use of highly complex models, such as deep neural networks, while still providing interpretability (Lipton, 2018).
A second distinction concerns the dependency of explanation methods on the underlying model. Model-specific approaches use internal properties such as gradients, weights, or architectures, whereas model-agnostic methods rely solely on input-output behavior and can therefore be applied universally. Model-agnostic approaches are particularly relevant in practice due to their flexibility and comparability across models (Lundberg & Lee, 2017; Ribeiro et al., 2016).
Finally, explanation methods differ in their scope. Global explanations aim to describe overall model behavior, while local explanations focus on individual predictions. This distinction is especially important when comparing explanation techniques, as some methods inherently provide instance-level insights, whereas others support a more holistic understanding of the model. However, in the categorization used in this paper, the distinction between global and local fits better in the explanation content as it is more about the information provided and does not necessarily depend on the XAI method. Therefore, we will present the scope in more detail in the section about explanation content.
This broad taxonomy by Molnar (2025) provides a conceptual foundation for categorizing explanation methods, which can be further differentiated based on the type of explanation they produce. The type of explanation can be broadly grouped into model-based, feature-based (attribution), and example-based approaches (e.g., Markus et al., 2021; Molnar, 2025). Jin et al. (2022) suggest supplementary information as an additional category, including elements such as model performance metrics and dataset characteristics; however, in the current review we address these under content, as they do not constitute explanation generation methods per se.
Furthermore, counterfactual explanations are often considered a subset of example-based approaches. Counterfactuals focus on identifying minimal changes to the input required to alter a model prediction. The contrastive and action-oriented nature makes them particularly relevant in human-centered and socially meaningful explanation contexts (Miller, 2019; Wachter et al., 2017). Therefore, we argue that counterfactuals constitute a fundamentally different explanatory approach, and hence treat it as a separate category.
2.1.1. Feature-Based (Attribution) Explanations
Feature-based explanations are the most widely used type of XAI methods. They aim to quantify the contribution of input features to model predictions, typically by assigning importance scores to individual features. These approaches are especially prominent in post-hoc, model-agnostic settings due to their flexibility and intuitive outputs.
Prominent attribution methods include LIME, which approximates the model with an interpretable surrogate, SHAP, which leverages concepts from cooperative game theory to distribute prediction contributions among features, and Generalized Additive Models (GAMs), which provide interpretable predictions by modeling the additive contribution of individual features (Caruana et al., 2015; Lundberg & Lee, 2017; Ribeiro et al., 2016). While these methods provide intuitive explanations, they may suffer from instability and rely on assumptions such as feature independence (Alvarez-Melis & Jaakkola, 2018; Lundberg & Lee, 2017).
Beyond individual feature contributions, feature-based approaches also include methods that capture how multiple features combined influence predictions. Techniques such as Partial Dependence Plots (PDPs) and Accumulated Local Effects (ALE) visualize the relationship between features and model outputs, while interaction-aware methods explicitly capture non-additive relationships between features (Apley & Zhu, 2020; Friedman, 2001; Molnar, 2025). Compared to attribution methods, these approaches are less frequently used and tend to be more developer oriented, primarily supporting model developers in understanding overall model behavior rather than providing intuitive explanations for end users. While they offer deeper insights into complex models, they also increase interpretational complexity (Guidotti et al., 2018; Molnar, 2025).
2.1.2. Model-Based Explanations
Model-based explanations achieve interpretability either through inherently transparent models or by approximating complex models with interpretable surrogates. Rather than producing post-hoc attributions, these approaches explain predictions by exposing the structure, parameters, or decision logic of the model itself. As such, they might reveal how input features contribute to outcomes, but in a way that is directly tied to the model’s internal representation rather than computed afterward.
Intrinsically interpretable models include linear and logistic regression, decision trees, and rule-based systems. These models provide global interpretability, as their decision processes can be directly inspected and understood. However, their simplicity may limit predictive performance when applied to complex or high-dimensional data (Lipton, 2018).
To address this limitation, surrogate (post-hoc) models are often employed. A surrogate is an interpretable model trained to approximate the behavior of a black-box model. Such surrogates can be global, capturing overall model behavior, or local, focusing on specific regions of the input space (Molnar, 2025). However, this introduces a fidelity–interpretability trade-off, as simpler models may fail to fully capture complex relationships (Molnar, 2025; Ribeiro et al., 2016).
2.1.3. Example-Based Explanations
Example-based explanations justify model predictions by referencing specific data instances, aligning closely with human reasoning based on analogies and comparisons. Instead of describing abstract feature contributions, these methods explain predictions through concrete examples drawn from the dataset or cases similar to the data.
One common approach is to retrieve similar instances from the dataset that are close to the query point in feature space. These explanations allow users to assess whether a prediction is reasonable by comparing it to known cases. Another approach involves prototype and criticism methods, which summarize datasets using representative examples (prototypes) and identify poorly represented or atypical instances (criticisms), as proposed in the MMD-critic framework (B. Kim et al., 2016).
Another type of example-based explanations are influential instance methods. These methods trace predictions back to training data points that had the greatest impact on the model. Influence functions approximate the effect of individual training samples on predictions, enabling users to detect biases or errors in the training data (Koh & Liang, 2017). These approaches are particularly useful for model debugging and dataset understanding.
2.1.4. Counterfactual Explanations
Counterfactual explanations address “what-if” scenarios by identifying the changes required to change a model’s prediction. They are often grouped under example-based explanation methods, as they are formulated as concrete data instances that are close to a given input. Like other example-based approaches, they rely on comparisons between individual cases to justify model predictions, thereby aligning with human reasoning patterns based on analogy and similarity. In this sense, a counterfactual can be interpreted as a specific type of example that illustrates how the input space relates to the model’s decision boundary.
However, in this review, we treat counterfactual explanations as a separate category due to their fundamentally contrastive and action-oriented nature. Unlike other example-based methods that primarily aim to justify or contextualize a prediction (e.g., by retrieving similar instances or prototypes), counterfactuals explicitly address what the minimal changes are to change a model’s prediction. These minimal changes are typically defined in terms of modifying as few input features as possible, making the smallest necessary adjustments to their values, and ensuring that such changes are feasible or actionable in practice (Wachter et al., 2017). This makes counterfactual explanations intervention-focused rather than purely descriptive. It is closely related to human approaches to explanation, as human explanations often directly answer contrastive questions such as “Why this outcome instead of another?” (Miller, 2019; Wachter et al., 2017).
2.2. Explanation Content
While the explanation method concerns how an explanation is produced, explanation content concerns what information is selected and presented in order to address a user-relevant question. Importantly, the same explanation generation method (e.g., SHAP, counterfactuals, attention weights) can support multiple content types depending on how its output is structured, contextualized, and framed but they may also limit the types of content that can be generated (e.g., certain methods are inherently unsuitable for producing local explanations). The explanation content can be characterized along several dimensions, including the explained object, scope, degree of personalization, level of detail, type of argumentation, and external evidence.
2.2.1. Explained Object
The explained object refers to the specific aspect of a model or decision that an explanation tries to clarify. It closely aligns with the types of questions users naturally ask when interacting with AI systems. Building on this idea, Lim & Dey (2010) define eight (model-agnostic) objects which can be explained by an explanation method: model inputs, model outputs, what (current output), what if (what is the output for different input values), why (did the model reach this output), why not (different output), how to (produce different output, certainty (how certain is the model). These are highly similar to the questions users might have about specific AI output as defined in the question bank by Liao et al. (2020), as well as the levels of explanations by Mueller et al. (2021). Taken together, explanation content begins with identifying which user question is being addressed.
2.2.2. Scope of Explanations: Local Versus Global
The scope (or granularity) of an explanation refers to whether it describes the behaviour of an AI system at the level of a specific instance (local) or at the level of the entire model (global). In addition, both the evidence (i.e., model-derived information) and the interpretation (i.e., the meaning assigned to that information) can operate at either level (Rizzo et al., 2023). For example, a local interpretation may explain a single attention weight for one prediction, whereas a global interpretation may aggregate attention patterns across many instances to reveal broader trends.
Local explanations focus on individual predictions. They are widely used in research, with about 70% of empirical XAI studies focusing exclusively on local explanations (J. Kim et al., 2024). From a technical standpoint, local explanations can be more accurate than global explanations because the behaviour of a complex model is often simpler (e.g., linear) in a small neighbourhood around a specific data point (Molnar, 2025).
Global explanations, in contrast, describe the overall behaviour of a model. While they provide a more comprehensive view, they are harder to interpret due to model complexity (Molnar, 2025). Global interpretability is often achieved at a modular level (e.g., feature weights or decision rules) rather than for the entire model at once. Common approaches include rule extraction, decision tree approximations, and global feature importance (Molnar, 2025).
2.2.3. Framing
Another aspect of content in XAI concerns the type of framing (or reasoning/argumentation) used in explanations. Explanations can be presented through different forms of reasoning, for example by emphasizing associations between different outcomes, contrasting outcomes or features with plausible alternatives, or highlighting statistical evidence about outcomes, each influencing how users interpret AI decisions. Several studies emphasize the role of argumentative and persuasive framing. Chatti et al. (2024), for example, distinguish between explanations that encourage users to think carefully about the underlying reasoning and explanations that rely more on simple cues such as visual design or heuristics. Alternatively, D. Wang et al. (2019) argue that contrastive explanations, which answer questions such as “Why this outcome instead of another?”, are often more usable than listing all possible causes because they reduce information overload and increase users’ perceived control. In addition, Rosenfeld and Richardson (2019) describe justification as a framing strategy aimed at persuading users that a decision is appropriate or trustworthy, often prioritizing user acceptance over full technical transparency.
2.2.4. Level of Detail
Another important aspect of content in XAI concerns the level of detail in explanations, which determines how much information is presented and must balance informativeness with cognitive simplicity.
A central concept is completeness, referring to the extent to which explanations reflect the full model’s reasoning process and underlying causes (Donoso-Guzmán et al., 2023; Kulesza et al., 2012; Nauta et al., 2023). While more complete explanations can support more accurate mental models, overly detailed explanations may reduce curiosity, engagement, and usability, suggesting that both insufficient and excessive information can be detrimental (Donoso-Guzmán et al., 2023; Kulesza et al., 2012).
As a result, researchers emphasize compactness and parsimony in explanation design. Parsimonious explanations reduce cognitive load by presenting information in a concise form that aligns with human processing limits (Markus et al., 2021; Nauta et al., 2023). Similarly, Molnar (2025) notes that users often prefer brief explanations with only a few key reasons, even for complex systems. This relates to the fidelity paradox, where simplified but plausible explanations can be perceived as more understandable and satisfying than fully complete but complex ones (Molnar, 2025; Rizzo et al., 2023).
Several studies therefore emphasize balancing completeness and compactness in explanation design. While completeness focuses on providing a sufficiently comprehensive account of the factors underlying a model’s output, compactness emphasizes restricting explanations to the most relevant information and presenting it in a concise and cognitively manageable form (Donoso-Guzmán et al., 2023; Kulesza et al., 2012; Markus et al., 2021; Nauta et al., 2023). From this perspective, explanation design involves determining which information is most relevant to disclose, how much detail is necessary for the user and task, and how additional information can be layered or selectively revealed when needed (Haque et al., 2023).
2.2.5. Personalized Explanations
Another important aspect of content in XAI is the personalization of information to the specific user, task, and context. From an explainee-centered perspective, explanations are not static properties of a system, but part of a social process that depends on how they are perceived and understood by the individual receiving them (Miller, 2019).
Personalization can be used to ensure that explanations are clear, coherent, and actionable for a specific user, such that they fit the user’s background and informational needs (cf. context and coherence in Nauta et al., 2023). This can involve adapting both the type and amount of information provided. For example, users may require different forms of explanations depending on whether they ask “why,” “why not,” or “what if” questions, highlighting the importance of adapting explanations to situational goals and informational needs (Lim et al., 2009; Lim & Dey, 2010).
Another dimension of personalization concerns tailoring to user characteristics such as expertise, AI literacy, prior knowledge, mental models, and psychological traits. In a medical context, for instance, a patient may require a simple explanation such as “high blood sugar,” whereas a physician may need a more detailed technical explanation of the underlying biological relationships (Samek & Müller, 2019). More broadly, explanations could be more effective when aligned with users’ existing conceptions, cognitive processes, and technical understanding (e.g., Chazette & Schneider, 2020; Ehsan et al., 2019; D. Wang et al., 2019). Finally, personalization may also account for psychological and cognitive characteristics such as need for cognition, conscientiousness, decision making style, and other individual differences, which can influence how users perceive and interact with explanations (e.g., Conati et al., 2021; Hernandez-Bocanegra & Ziegler, 2021b).
2.2.6. External and Contextual Information
As part of the content level, external or contextual information surrounding an AI system can support users in interpreting explanations, evaluating system reliability, and understanding the boundaries of model applicability. Although this information does not directly explain the internal reasoning process of a model, it provides important supplementary context for decision-making.
One category of contextual information concerns model performance metrics, such as accuracy, precision, recall, ROC curves, calibration scores, and uncertainty estimates. These metrics are described as global supplementary information or “model facts” that communicate overall system quality, limitations, and uncertainty rather than explaining specific prediction logic (Jin et al., 2022; Liao et al., 2021). Performance transparency is important because users often interpret explanations differently depending on their confidence in the model, while communicating calibration and evaluation choices can help users better assess reliability and uncertainty (Adhikari et al., 2022).
Another important category concerns dataset characteristics, including training data distributions, sample sizes, demographic representation, missing values, and excluded datasets. Such information helps users identify potential biases, blind spots, and limitations in model behavior, while also increasing perceptions of transparency and trustworthiness (Haque et al., 2023; Jin et al., 2022; Liao et al., 2020). Questions regarding data provenance, collection methods, and dataset scope are therefore increasingly recognized as important elements within XAI systems.
A third category includes human, social, and domain-based references external to the model itself. External trust signals such as peer reviews, institutional reputation, authority approvals, or endorsements from other users can influence trust and acceptance independently of the technical explanation provided (Chatti et al., 2024; Jin et al., 2022). Similarly, social comparison approaches that present examples of similar users or trusted peers could improve persuasive effectiveness and user engagement (D. Wang et al., 2019).
Finally, human-like and anthropomorphic aspects of AI systems can also shape explanatory perception. Users naturally attribute human characteristics and intentions to algorithmic systems, meaning that conversational agents using human-like communication styles, gestures, or voice interaction may appear more trustworthy and socially acceptable (Haque et al., 2023; Molnar, 2025). In addition, users may accept explanations more readily when they are presented by a perceived authoritative system or institution (M.-Y. Kim et al., 2021).
2.3. Explanation Format
Explanation format refers to the way in which explanatory information is presented to the user. It captures the representational and perceptual characteristics of explanations. Prior research highlights that format is not merely a delivery mechanism but also shapes how explanations are perceived and interpreted by users (e.g., Haque et al., 2023; Rizzo et al., 2023).
A key distinction within explanation format concerns (1) modality, referring to the sensory channel through which information is conveyed, and (2) saliency, referring to how important elements within an explanation are emphasized.
2.3.1. Modality
Modality describes the form in which an explanation is represented and perceived. Explanations can be delivered through different representational formats most commonly textual, graphical, and tabular formats, while less frequently used modalities include images, audio, and video (Adhikari et al., 2022; Haque et al., 2023; Vilone & Longo, 2021). More broadly, explanation modalities can also be combined into multi-modal formats or embedded in richer communication media such as infographics or illustrated text (El-Assady et al., 2019; Vilone & Longo, 2021). Within graphical modalities specifically, different subtypes can be distinguished. Chatti et al. (2024) categorize visual explanations into ten different types, with the node-link diagram and bar chart being most common, followed by the tag cloud, and then by Venn diagram, heatmap, scatterplot, pie chart, treemap, radar chart, and world map.
It needs to be noted that explanation formats are closely linked to the underlying generation method. Jin et al. (2022) explicitly group formats according to explanation generation methods and suggest that each type is associated with a limited set of typical representations. This indicates that the choice of format is constrained by the generation approach rather than being purely a design decision. Closely related, the choice of modality is often constrained by practical considerations such as interface limitations and design standards, reinforcing the need for context-sensitive format selection (Eiband et al., 2018).
2.3.2. Saliency
Saliency refers to highlighting information that is considered most relevant to a model's output. While saliency is often based on attribution methods that estimate the importance of individual input features, it concerns how this information is highlighted and communicated to the user, for example through heatmaps, highlights, color coding, or other visual cues. In this sense, saliency can support explanations about why a prediction was made by drawing attention to influential parts of the input, although the underlying explanation method may vary (Liao et al., 2021). Moreover, saliency-based methods are among the most widely used explanation approaches across domains (Klein et al., 2024).
Saliency is particularly prominent in visual explanation techniques, where importance is encoded through cues such as color, intensity, or spatial focus. Across modalities, saliency can highlight relevant elements such as image regions, words, or text passages through mechanisms like localization or textual highlighting (Nauta et al., 2023; D. Wang et al., 2019). In practice, saliency is most commonly realized through heatmaps or color-coded visualizations. Saliency maps and heatmaps are widely identified as dominant formats for feature attribution, using color scales to represent fine-grained importance scores (Islam et al., 2022; Jin et al., 2022).
2.4. Explanation Interaction
Explanation interaction refers to explanation as an interactive process between user and AI system rather than a static output. It focuses on how users could engage with explanations by asking questions, filtering information, or exploring results, and it enables explanations to become adaptive, user-centered, and dialogical. Interactivity can be divided into different types of interaction techniques: selective, mutable, and dialogic interaction (Bertrand et al., 2023).
Selective or on-demand explanations refer to systems where users request explanations only when needed, rather than receiving all information automatically, often called “progressive disclosure” (Springer & Whittaker, 2020). On-demand disclosure could reduce cognitive overload and might give users more control when additional contextual information is revealed (Haque et al., 2023; Laato et al., 2022).
Mutable explanations refer to interaction modes in which users actively modify inputs, parameters, or conditions of the AI system to observe how predictions or explanations change. These interactions correspond to common user questions, such as “what-if” scenarios (Liao et al., 2020) or the effects of adjusting system parameters (Sipos et al., 2023), enabling users to actively explore the model’s behavior. This form of interaction aligns closely with the concept of controllability, which captures the extent to which users can influence or “correct” the system, and is identified as a key quality dimension in XAI evaluation frameworks (Donoso-Guzmán et al., 2023; Nauta et al., 2023).
Dialogic or conversational interactivity refers to explanation systems that engage users in a back-and-forth dialogue, where explanations are shaped by user questions and follow-up interactions. Liao et al. (2021) describe this as a question-driven grounding process, where explanations are continuously adapted to user queries in order to reduce the gap in understanding through iterative clarification.
The importance of interaction in explanation is reflected in a broader view within the literature that conceptualizes explanation as a social process grounded in continuous (interactive) information exchange between an explainer and an explainee (Miller, 2019). In their framework of explanation levels, M.-Y. Kim et al. (2021) describe the most advanced level as interactive and explainee-aware, enabling users to iteratively refine their questions through conversational explanations and receive tailored clarifications. Interactivity therefore functions as an advanced and important explanatory capability that supports identifying knowledge gaps, enabling clarification, and building user trust through dynamic exchange (M.-Y. Kim et al., 2021). Additionally, explanation is an iterative process that is particularly important during verification phases, where user feedback plays a critical role in refining understanding and explanation systems (El-Assady et al., 2019). The importance of interaction is further reflected in XAI evaluation frameworks, where dimensions such as controllability and adaptivity are commonly used to assess the quality of explanatory systems (Cortiñas-Lorenzo et al., 2025; Donoso-Guzmán et al., 2023).
3. Method
We conducted a systematic literature review of empirical studies that compared different implementations of XAI with each other. We aimed to create an overview of studies that involve human participants in the evaluation of XAI and that compare multiple explanation approaches within the same experimental context.
3.1. Literature Search Strategy
We performed our systematic literature review following the PRISMA guidelines for systematic reviews (Shamseer et al., 2015), to identify user studies that compare XAI implementations on end-user evaluations. The protocol for this systematic review was preregistered on Protocols.io (Ronckers et al., 2024). We systematically searched the electronic databases Web of Science, Scopus, IEEE Xplore, and ACM Digital Library on May 14th, 2024. The search query contained words related to Explainable AI and user studies (See Table 1 for the full search strategy). The search was limited to title, abstract, and keywords for most databases, and “all metadata” for IEEE Xplore. Because database interfaces and search functionalities differed, the exact queries were adapted for each database. Detailed search strings for all databases are provided in Appendix A – Search Queries.
The original protocol also included an additional literature saturation step following the initial screening, involving backward reference searching and the identification of related publications using AI tools. However, given the large number of records retained after screening, the inclusion of this step would have required a substantial expansion of the screening and eligibility assessment process, and was therefore not pursued further.
3.2. Selection Criteria
For the literature selection, we defined a set of eligibility criteria based on the different aspects of the research question. The inclusion and exclusion criteria are outlined in Table 2. We included studies on “explainable” or “interpretable” AI, for any application domain. Recommender systems were included as AI systems as well. Studies should compare different XAI implementations with each other, which could be a comparison between XAI generation methods (e.g., feature-based, example-based, counterfactuals, etc.), content (e.g. level of detail, local versus global, etc.), formats (e.g., modality, saliency, etc.) or interaction (e.g. on-demand possibilities, chatbots, etc.).
We excluded comparisons between different black-box AI models without different XAI implementations and comparisons between different XAI models whose differences were not noticeable for end users. The XAI implementations could be applied in any domain or use cases and comparisons between application domains were included as well.
Studies were included if they measured some form of human-AI interaction outcomes. This could be subjective experiences of the users, such as trust, likeability, preference, or objective measures, such as effectiveness, performance of the human-AI collaboration, decision time, or behavioral reliance. There was no restriction on the year of publication (with the final date being May 14th, 2024).
3.3. Results Screening
For the screening process, we used online software Rayyan (Ouzzani et al., 2016) for both the title-and-abstract screening phase and the full-text screening phase, making use of the platform’s blind-mode functionality, in which reviewers performed independent assessments while being blinded to one another’s screening decisions to reduce bias. The initial search yielded 4,035 articles. Search results were imported into Rayyan (Ouzzani et al., 2016), where duplicate removal was first performed automatically. Initially, Rayyan automatically resolved duplicates with a similarity score of 97% or higher. Because closer inspection revealed that a substantial number of duplicates remained, we added an additional duplicate screening step that had not been specified in the protocol, in which Rayyan resolved duplicates with a similarity score of 95% or matching titles and DOI numbers. Remaining duplicates were removed manually, resulting in a final set of 3,034 unique articles for screening.
Although Rayyan provides relevance scores indicating how well records may fit the review topic, all records were screened manually. After a pilot screening of 50 articles to refine the screening criteria and establish consensus among the authors (MR, RC, and CS), the first author (MR) screened the full set of 3,034 titles and abstracts of all records. Studies that clearly did not meet the eligibility criteria were excluded by MR. Studies for which eligibility was uncertain were additionally screened independently and in blind mode by RS (220 papers). Papers marked as “include” by RS were included, while remaining doubtful cases were resolved through discussion. In total, 285 articles remained for full-text screening.
Because Rayyan did not support automatic retrieval of full texts, full-text articles were searched for, downloaded, and uploaded manually for the second screening phase. Full-text screening was conducted by MR. Doubtful cases were resolved through discussion amongst all authors (MR, RC, and CS). This process resulted in an included sample of 206 papers. An overview of the complete screening procedure is provided in Figure 2.
3.4. Quality Assessment
For the quality assessment, all 206 included papers were evaluated using the Mixed Methods Appraisal Tool (MMAT; Q. N. Hong et al., 2018). The MMAT includes both general criteria regarding the research question and data quality, as well as method-specific criteria for qualitative, quantitative, randomized controlled, and mixed-methods studies. In this review, the MMAT was used as an overall quality appraisal tool to assess the methodological rigor and reporting quality of the included studies, rather than to evaluate a specific type of bias. For each paper, we assessed all categories applicable to the study design. In some cases, multiple categories were scored within a single paper because the paper included multiple study types or methodological approaches.
To obtain an overall quality score, we calculated the average across all rated MMAT items, using the following coding scheme: 2 = “Yes” (criterion clearly met and reported), 1 = “Can’t tell” (criterion could have been met, but reporting was unclear), and 0 = “No” (criterion not met or not reported). The general MMAT item regarding clear research questions (S1) was excluded from the overall score calculation, as this criterion appeared overly strict for the included literature. Many papers did not formulate an explicit research question, but their research aims and direction were generally clear from the introduction and study description.
The original protocol specified that only studies with extremely low overall scores would be excluded from the review, with the threshold to be determined after assessment (Ronckers et al., 2024). In the final process, we excluded studies with an average MMAT score of 1 or lower across the assessed criteria from further analysis. This threshold reflected studies in which the majority of criteria were rated as either “No” or “Can’t tell,” indicating substantial concerns regarding methodological transparency or study quality. Applying this criterion resulted in the exclusion of 45 papers and resulted in a final set of 161 papers for data extraction.
3.5. Data Extraction
Data from the included studies were extracted manually by MR, MV, and RLN, who divided the papers among themselves. A final consistency check across all papers was subsequently conducted by MR. As an additional independent check, RC and CS did a final consistency check on the papers extracted by MR.
All extracted data were managed using Covidence software (Covidence Systematic Review Software, 2025) and recorded in a predefined data extraction form, which was refined by MR, RC, and CS after pilot extraction of 25 papers, leading to adjustments in item wording, order, and category definitions. The extracted data included detailed study characteristics such as research aims, participant demographics, and study context. In addition, extensive information was collected on the XAI interventions, including a classification according to explanation method, content, format, and interaction characteristics. Data were also extracted on study design features, including sample size, experimental setup, comparison conditions, and the underlying AI and user tasks. Outcome-related data included the human-AI interaction constructs assessed, measurement instruments, all reported effects on XAI comparisons, and the direction of findings across experimental conditions (see Supplementary Materials 1[1] for the full data extraction). Following extraction, MR synthesized the data in a table format, identifying for each paper which XAI conditions performed better across specific outcome measures (see Supplementary Materials 21). Additionally, an overview of the visuals of XAI implementations used in each paper was created (see Supplementary Materials 31).
Originally, the protocol specified that, if relevant information was missing in the papers or supplementary materials, study authors would be contacted (up to three attempts). However, this step was not undertaken due to the large set of included studies. Missing information was generally limited and did not substantially affect data extraction. Moreover, studies with insufficient reporting quality were excluded during the quality assessment, reducing the likelihood that missing information influenced the review findings.
4. Overview of the Field
Our systematic review showcases a wide variety of studies. The field of XAI is broad in all senses: many different application domains, use cases, implementations, and presentation formats coexist. In addition, user studies are conducted in diverse ways with different methods and measurements. To contextualize the heterogeneity in findings, we first provide an overview of the included studies, focusing on application domains, participant populations, and methodological approaches. This overview contextualizes the subsequent differences in outcomes across studies and highlights structural characteristics of the field that may shape the effectiveness of XAI. A complete overview of all extracted study characteristics, including sample sizes, participant characteristics, outcome measures, measurement instruments, and study results, is provided in Supplementary Materials 1.
Figure 3 presents the distribution of publications over time. Especially in recent years, the number of user-centered XAI studies that compare different explanation implementations has grown substantially, indicating that this line of research is rapidly gaining attention. This growth mirrors the general growth of XAI research, but also suggests a more recent shift toward empirical, comparative, and human-centered evaluations. With regard to publication venues, the majority of included studies were published in conference proceedings (60.2%) rather than journals (39.8%). This aligns with the prominence of conferences in fields such as computer science and human–computer interaction, as well as the rapidly growing nature of the field.
5. Results
Understanding how different explanation designs influence human–AI interaction is central to evaluating the practical value of XAI. While prior work often compares explanations to a no-explanation baseline, far fewer studies directly contrast different kinds of explanations with one another. The studies in our review do exactly that: they compare variations in how explanations are generated, what content they present, and how this content is formatted and communicated to users. These works do not necessarily compare explanations against the absence of explanations. Instead, by comparing explanations with one another, they move beyond the question of whether explanations help at all, and instead examine which design choices meaningfully affect user experience and performance.
For each of the four components of explanations (method, content, format, and interaction), we summarize what types of comparisons the included studies made, how these design choices influence human–AI interaction, and where results converge or diverge. In doing so, we highlight which explanations tend to make a difference (compared to other explanations), where effects remain inconsistent, and which design choices appear most promising for supporting effective and meaningful human–AI collaboration.
Across the reviewed studies, one overarching pattern becomes clear: there is no universally best explanation. Most comparisons reveal mixed or non-significant differences, and when differences do appear, they are often dependent on the use case, task demands, or user characteristics. At the same time, certain explanation factors are more influential than others. Our overview suggests that the explanation format (such as graphical layouts) and interactivity features tend to influence human-AI interaction the strongest. The content of explanations shows moderate influence, yet again with substantial variability across studies. In contrast, the underlying technical XAI method used to generate an explanation tends to have the least consistent impact on user outcomes.
Interpreting the presented findings requires caution. Many of the included studies compared different explanations, but they rarely varied only one factor in the explanation’s design; instead, often multiple design aspects changed at once, making it difficult to pinpoint which elements actually drive the results. Although we summarize overarching patterns, individual findings are shaped by many contextual factors, such as the specific explanation design, domain or use case, task difficulty, user characteristics, and study setup. These differences make it challenging to compare studies directly, and certain nuances may be lost when synthesizing findings at a high level. In addition, qualitative descriptors such as “a few,” “many,” or “the majority” are used throughout this section instead of exact percentages. Because individual studies often reported multiple outcome measures, with some yielding significant and others non-significant results, precise percentages could be misleading. Readers should therefore keep these limitations in mind when interpreting our conclusions. For those who want to examine the exact conditions under which particular results were obtained, all study-level details can be found in the Supplementary Materials 1.
5.1. Limited Impact of Explanation Method
Across the studies that compared different XAI generation methods, such as feature-based, example-based, and counterfactual explanations, there is no clear evidence that one method consistently outperforms the others. About two thirds of the (measured) outcomes did not show significant differences between methods.
The vast majority of studies comparing example-based and feature-based explanations found no significant differences. This holds for understanding (Bove et al., 2022; Dominguez et al., 2020; Gentile et al., 2023), trust or reliance (Du et al., 2022; Gentile et al., 2023; Tsai et al., 2021; B. Wang et al., 2024), effectiveness (Gedikli et al., 2014), interaction or response time (Dominguez et al., 2020; Gedikli et al., 2014; Gentile et al., 2023; Linder et al., 2021), satisfaction (Gedikli et al., 2014; Guesmi et al., 2021; Tsai et al., 2021), transparency (Gedikli et al., 2014; Tsai et al., 2021), cognitive load (Gentile et al., 2023; Tsai et al., 2021; B. Wang et al., 2024), and performance (Linder et al., 2021; Tsai et al., 2021) or general user ratings (B. Wang et al., 2024).
The same pattern appears in studies comparing counterfactual and feature-based explanations. These studies also most often report non-significant results for understanding (Melsion et al., 2023; Riveiro & Thill, 2021), trust or reliance (de Brito Duarte et al., 2023; Jakubik et al., 2023; Larasati et al., 2020; Lim et al., 2009; Melsion et al., 2023; Scharowski et al., 2023; Warren et al., 2022, 2023; Woodcock et al., 2021), confidence (Celar & Byrne, 2023), satisfaction (Jansen et al., 2024; Riveiro & Thill, 2021; Warren et al., 2022, 2023), performance (Celar & Byrne, 2023; Ibrahim et al., 2023; Jakubik et al., 2023; Lim et al., 2009; Warren et al., 2022, 2023), personal attachment (Larasati et al., 2020), completeness (Riveiro & Thill, 2021), and general user experience (Jansen et al., 2024). For counterfactual explanations compared to example-based, there were no significant differences for agreement, performance, and helpfulness (Perlmutter et al., 2024).
Studies that compared example-based, feature-based, and counterfactual explanations (all three in the same study) reported no significant differences in understanding (Shulner-Tal et al., 2022; X. Wang & Yin, 2021, 2022), trust or reliance (Naiseh et al., 2023; A. Silva et al., 2023; X. Wang & Yin, 2021, 2022), interaction or response time (Cau et al., 2023; A. Silva et al., 2023), performance (Cau et al., 2023; Gombolay et al., 2024; Naiseh et al., 2023; A. Silva et al., 2023), explainability (Gombolay et al., 2024; A. Silva et al., 2023), and fairness (Shulner-Tal et al., 2022).
Although most studies found no significant differences between XAI methods, about one third of the individual results report that certain XAI methods work better than others. However, these findings are inconsistent and do not indicate a universally best XAI method, with methods outperforming others in some cases but underperforming in others.
Compared to feature-based explanations, counterfactual explanations showed higher user understanding (Le et al., 2020; Maruf et al., 2023; Naiseh et al., 2023; Perlmutter et al., 2024; Schulze-Weddige & Zylowski, 2022), accuracy (Celar & Byrne, 2023; Le et al., 2020; Mertes et al., 2022), trust/reliance (Maruf et al., 2023; Mertes et al., 2022; Perlmutter et al., 2024) satisfaction, self-efficacy, and confidence (Mertes et al., 2022), user experience (Naiseh et al., 2023), perceived helpfulness (Celar & Byrne, 2023), completeness, and preference (Maruf et al., 2023), and intuitiveness (Le et al., 2020). However, these effects often depended on additional factors: Schulze-Weddige & Zylowski (2022) found them only for LIME and not for SHAP, Celar & Byrne (2023) observed them only when the AI was correct and effects varied by domain familiarity, and Maruf et al. (2023) reported them only in the nursery scenario, not the “telecom” scenario. Combining counterfactuals with examples reduced trust, persuasiveness, and perceived quality compared to examples alone or examples accompanied by text (Gates et al., 2023). Rule-based counterfactuals improved objective understanding relative to example-based counterfactuals, though subjective understanding, performance, reliance, and usability did not differ (van der Waa et al., 2021).
Additionally, example-based explanations led to better understanding (Naiseh et al., 2023), accuracy (V. Chen et al., 2023), perceived competence (B. Wang et al., 2024), agreement (Cau et al., 2023) than feature-based explanations. Qualitative studies suggest that example-based explanations have higher persuasiveness, transparency, accuracy, and satisfaction (Lu et al., 2023) than feature-based explanations and align more closely with intuitive reasoning, support learning through examples, and provide clearer signals of AI unreliability (V. Chen et al., 2023) compared to feature-based explanations that were seen as visually overwhelming and sometimes led to inappropriate reliance (V. Chen et al., 2023).
The effectiveness of an explanation method can also depend on its content. Global example-based explanations improved trust and transparency when explaining the input, whereas feature-based explanations were more effective for explaining the output of the AI system (Guesmi et al., 2021).
On the other hand, feature-based explanations showed higher efficiency (Guesmi et al., 2021), understandability (B. Wang et al., 2024) and higher preference (S. S. Y. Kim et al., 2023) than example-based explanations, and better subjective understanding, perceived quality, and indirect trust (but not direct trust) (de Brito Duarte et al., 2023) compared to counterfactuals. When the AI output was correct, feature-based explanations were associated with higher satisfaction, completeness, and understanding than counterfactual explanations, but no significant differences were observed when the AI output was incorrect (Riveiro & Thill, 2021). Similarly, qualitative findings showed that factual, feature-based explanations were preferred over counterfactual explanations when the output was similar to expectations, but both combined was preferred when the output was unexpected (Riveiro & Thill, 2022).
Overall, no clear distinction between subjective and objective outcomes emerged. Advantages reported for specific explanation methods were observed for both types of measures, but these effects were highly inconsistent and context-dependent. However, the positive effects reported for feature-based explanations were predominantly subjective in nature, including outcomes such as perceived understanding, trust, and preference. In contrast, the positive effects of counterfactual and example-based explanations were observed across both subjective and objective measures, including improvements in perceived evaluations as well as understanding and accuracy.
Specific Feature-based methods: LIME, SHAP, and GAM
Because LIME and SHAP are two of the most widely used feature-based explanation methods, several studies have compared them directly to examine whether they differ in how users interpret and evaluate explanations. Across those studies, the two methods generally perform similarly, and almost all outcomes show no significant differences. We see this for understanding (Jalali et al., 2023; Knapič et al., 2021; Schulze-Weddige & Zylowski, 2022; X. Wang & Yin, 2021, 2022), predictability (Jalali et al., 2023), performance (Knapič et al., 2021; Malhi et al., 2020), and trust (X. Wang & Yin, 2021, 2022). Another feature-based method commonly used is GAM: GAM explanations outperform SHAP on accuracy, cognitive load, and confidence in understanding the explanation, but SHAP results in higher confidence in reasonable explanations when explanations or AI output is wrong (Kaur et al., 2020).
Other explanation generation methods are typically less researched in the literature. We highlight some of the results: decision trees were less preferred and induced the longest processing time compared to feature maps or natural language, but decision trees caused the fewest consecutive mistakes after incorrect advice; feature maps led to the most inappropriate compliance (A. Silva et al., 2024). White box regression explanations caused more prediction errors than both local or global LIME explanations, but trust, usefulness, and time showed no significant differences between the explanation types (Burkart et al., 2021). A visual map explanation reduced cognitive load and improved satisfaction for participants with low AI literacy compared to SHAP, decision trees, and counterfactuals (Jansen et al., 2024).
5.2. Mixed Effects of Explanation Content
The findings across explanation content choices show that what an explanation communicates can influence human–AI interaction, but often in nuanced and context-dependent ways. Some factors, such as the amount of information, show clearer patterns, whereas others, such as confidence scores, local or global, personalization, argumentation and framing, or explanations with human-oriented cues, have more mixed or limited effects across contexts.
5.2.1. Amount of Information
The findings on the amount of information in an explanation suggest a tension between what users prefer and what helps them perform best. On the subjective level, participants frequently want more information: richer, more complete, or more interactive explanations tend to produce higher understanding, satisfaction, trust, and perceived usefulness. Yet, objective outcomes tell a different story: performance and cognitive load studies show that very detailed explanations can hinder users, and that a balanced, intermediate level of information often works best. Overall, the findings point toward an explanation design that avoids both extremes: users appreciate more detail, but their performance benefits most from an optimal, moderately complex explanation, rather than offering maximal or minimal information.
Impact on Subjective Experience
Subjective evaluations generally improved with more, or optimally balanced, information. Providing more examples improved subjective trust (Perlmutter et al., 2024), understanding (Bove et al., 2023; Perlmutter et al., 2024), user interest (Zhang et al., 2022) and satisfaction (Bove et al., 2023 when comparative analysis is added as well; Zhang et al., 2022 for textual explanations) compared to one single example. Similarly, providing more complete information was preferred (Ehsan et al., 2019; Maruf et al., 2023) over shorter basic explanations, and resulted in higher ratings for user experience such as fairness, usefulness, completeness, ease of use, trust/acceptance, and satisfaction (Dodge et al., 2019; Hermann et al., 2023; Khurana et al., 2021; Larasati et al., 2020; Maruf et al., 2023; Naveed et al., 2018; Rago et al., 2021). Finally, combining separate explanation types (sometimes with different modalities) also resulted in higher trust, interpretability, ease of use, perceived confidence, and persuasiveness (Radensky et al., 2022; Szymanski et al., 2021; Weitz et al., 2021; Wibowo et al., 2018) and qualitative results suggest that combined explanations are preferred and more persuasive and useful compared to single, simple explanations (Du et al., 2022; Heuer & Breiter, 2020; Sato et al., 2018, 2019). Some studies mentioned a more optimal level of information: although no statistical tests were reported in Chatti et al. (2022), intermediate levels of detail appeared to result in higher satisfaction, trust, and scrutability compared to basic and advanced explanations. However, these findings depended on personality characteristics, such as need for cognition, visualization familiarity, and personal innovativeness (Chatti et al., 2022; Guesmi et al., 2022). In the study by Heuer & Breiter (2020), participants emphasized the value of exposing inner mechanisms and providing more information, while also noting a trade-off between informativeness and potential overload. Additionally, mixed findings also suggest this optimum: in Kleinerman et al. (2018) explanations with less information were rated higher on relevance, satisfaction, and competence, but more information was rated higher on trust and acceptance. Only the study by Abdul et al. (2020) suggests that less information can lead to more positive subjective outcomes: less information was easier to understand.
One study pointed to preferences for simpler (non-hybrid) formats: Martijn et al. (2022) found that brief explanations (e.g., preference-fit score or example-based) were preferred over more information-rich multimodal combinations that included feature-based, example-based, and scatter-plot components. Additionally, while there were no overall preference differences between bar charts and more complex multimodal explanations, users low in openness preferred bar-chart-only formats, whereas users high in openness sometimes preferred the more detailed, multimodal information.
At the same time, about half of the reported findings did not show significant differences in subjective ratings across explanation sizes or detail levels. This includes outcomes such as fairness (Barile et al., 2021, 2024; Goyal et al., 2024), consensus / agreement (Barile et al., 2021, 2024; Perlmutter et al., 2024), satisfaction (Barile et al., 2021, 2024; Guesmi et al., 2021; Qu et al., 2021; Stepin et al., 2022; Tsai & Brusilovsky, 2019b; Wibowo et al., 2018), trust / reliance / confidence (Conijn et al., 2023; de Brito Duarte et al., 2023; Ehsan et al., 2019; Hou et al., 2024; Qu et al., 2021; Ribes et al., 2021; Stepin et al., 2022; Wibowo et al., 2018), motivation (Conijn et al., 2023), usefulness / usability / helpfulness (Cruz et al., 2022; Perlmutter et al., 2024; Qu et al., 2021; Radensky et al., 2022; Ribes et al., 2021; Robbemond et al., 2022), human-likeness (Ehsan et al., 2019), explanation quality (Wilkinson et al., 2021), persuasiveness (Guesmi et al., 2021; Tsai & Brusilovsky, 2019b), informativeness (Stepin et al., 2022), completeness (Sivaprasad et al., 2024), understanding (Qu et al., 2021; Radensky et al., 2022; Ribes et al., 2021; Sivaprasad et al., 2024), perceived competence (Ribes et al., 2021), transparency (Wibowo et al., 2018), scrutability (Guesmi et al., 2021), and bias perception (Hou et al., 2024). Tsai & Brusilovsky (2019b) likewise reported mostly non-significant results for subjective experience, with only a single comparison showing an effect: adding a bar chart to a Venn Word Cloud improved transparency, scrutability, trust, effectiveness, and perceived performance.
Impact on Cognitive Load and Time
Several studies indicate that providing more information in explanations tends to increase both interaction time and cognitive load. More extensive interfaces resulted in higher (objective) cognitive load when having more graphs (Abdul et al., 2020) or explanation elements (Andjelkovic et al., 2016; Sanneman & Shah, 2022). Similarly, adding more elements to the explanations increased response time (Linder et al., 2021) and interaction time (Radensky et al., 2022) compared to only one explanation element. In contrast, two studies reported an opposite pattern: participants experienced higher cognitive load (Dodge et al., 2021) and longer perceived time (Szymanski et al., 2021) when presented with less information or types of explanations. However, about half of the studies did not find any significant influences of the amount of information for interaction time (Jesus et al., 2021; Stepin et al., 2022; Stites et al., 2021; Tran et al., 2019, 2020; Tsai & Brusilovsky, 2019b; Wibowo et al., 2018) or cognitive load (Robertson et al., 2021; Tsai & Brusilovsky, 2019b).
Impact on Performance
In our sample, richer explanations were typically associated with better human–AI performance. Combined explanations resulted in higher (subjective) performance than explanations with one element alone (Das & Chernova, 2020; Gentile et al., 2023; Qu et al., 2021). Simply adding more information or more graphs also resulted in higher performance, understanding, and improved skills to highlight inconsistencies and logic errors in the decision path (Abdul et al., 2020; Dodge et al., 2021; T. Liu et al., 2023; Mccalmone et al., 2022; Sanneman & Shah, 2022). Similarly, the results from Ibrahim et al. (2023) suggested that providing more information resulted in higher accuracy, although this was not statistically tested. Interestingly, one study found the opposite result, where performance was better with less information (Sivaprasad et al., 2024), but mental models did change more when interacting with more extensive explanations. Still, about half of the studies did not report any significant findings of the amount of information on performance (Andjelkovic et al., 2016; Goyal et al., 2024; Linder et al., 2021; Perlmutter et al., 2024; Radensky et al., 2022; Ribes et al., 2021; Robertson et al., 2021; Stepin et al., 2022; Stites et al., 2021; Tsai & Brusilovsky, 2019b; Wibowo et al., 2018).
These mixed findings may indicate that explanation effectiveness depends on finding a balance in the level of detail provided, rather than simply offering more or less information. Intermediate levels of information resulted in better performance compared to the simplest and most extensive explanations (Pierson et al., 2024), although only for difficult tasks. Similar results were found by Chatti et al. (2022), although not statistically tested.
5.2.2. Confidence and Probability Scores
Confidence or probability scores constitute the most minimal type of explanatory information, as they provide only a numerical indication of model certainty without offering insight into how a decision was reached. Although such scores are often assumed to make AI decisions clearer or more trustworthy compared to other types of explanations, the empirical evidence offers little support for this assumption. Across studies, these numerical indicators generally do not improve how people understand, trust, or use AI systems. A large majority works report no significant effects of confidence scores on accuracy or performance (Brachman et al., 2023; Buçinca et al., 2021; Gombolay et al., 2024; Linder et al., 2021; Qu et al., 2021), understanding (Brachman et al., 2023), trust (Buçinca et al., 2021; Conijn et al., 2023; Mehrotra et al., 2024), preference (Buçinca et al., 2021), cognitive load (Buçinca et al., 2021; Qu et al., 2021), motivation (Conijn et al., 2023), satisfaction and effectiveness (Gedikli et al., 2014), time (Gedikli et al., 2014; Linder et al., 2021), difficulty (Qu et al., 2021), willingness to pay (Ben David et al., 2021), and usefulness (Mehrotra et al., 2024), compared to other types of explanations.
When effects do appear, they are mixed. A few studies show benefits, such as improved adoption or agreement (Ben David et al., 2021; Linder et al., 2021) or higher preference (Waa et al., 2020) compared to other types of explanations such as feature-based explanations. Others find that confidence scores compare unfavorably to richer or more interpretable explanation formats: they reduce transparency and effectiveness (Gedikli et al., 2014), perform worse on explainability measures compared to decision trees, case-based or feature importance (Gombolay et al., 2024), or result in lower satisfaction and usability compared to highlighted explanations (Qu et al., 2021). Notably, the few significant effects that were reported primarily concerned subjective outcomes, whereas objective outcomes were almost exclusively null findings.
5.2.3. Local versus Global Explanations
While the majority of studies find no significant differences between local and global explanations, the few significant results observed tentatively point to a slight advantage for local explanations. Non-significant differences were found across a wide range of outcome measures including performance (Burkart et al., 2021; Huber et al., 2021; Naiseh et al., 2023; Radensky et al., 2022), trust (Ben David et al., 2021; Burkart et al., 2021; Naiseh et al., 2023; Radensky et al., 2022; B. Wang et al., 2024; X. Wang & Yin, 2021, 2022), understanding (Naiseh et al., 2023; Radensky et al., 2022; Sivaprasad et al., 2024; X. Wang & Yin, 2021, 2022), usefulness (Burkart et al., 2021; Naiseh et al., 2023; Radensky et al., 2022; Sivaprasad et al., 2024) and several other user experience measures (Ben David et al., 2021; Guesmi et al., 2021; Septon et al., 2023; B. Wang et al., 2024).
When significant differences do appear, they tend to favor local explanations over global. Local explanations result in higher trust (Ben David et al., 2021), understanding (Septon et al., 2023), efficiency (Guesmi et al., 2021), performance and shorter explanation length (Evirgen et al., 2024; Sivaprasad et al., 2024), and had more impact on participants’ decision changes under high AI confidence (H. Chen et al., 2024). Specifically for positively phrased recommendations, local explanations resulted in higher perceived fairness and understanding (Shulner-Tal et al., 2022) Qualitative findings also suggest a preference for local explanations: users preferred local why explanations and perceived them as more effective compared to global how explanations, although the global explanations were perceived as more transparent and trustworthy (Guesmi et al., 2023).
Evidence supporting global explanations is more limited and mixed. Global explanations could be more useful (Radensky et al., 2022), help users detect inconsistencies better (Dodge et al., 2021), and reduce cognitive load (Dodge et al., 2021; B. Wang et al., 2024) relative to local explanations.
The mixed effects might depend on the content or design of the explanation: Guesmi et al. (2021) reported that global explanations resulted in higher trust and transparency when the goal was to explain system input, but when explaining system output, local explanations scored higher. B. Wang et al. (2024) reported that global explanations resulted in better understandability compared to some local explanations but not all, and for competence, global explanations scored in between two local explanation types.
5.2.4. Personalized Explanations
Even though personalized explanations are often proposed as a way to make AI systems more meaningful to individual users, findings suggest that personalized explanations offer limited practical value and do not reliably improve user outcomes compared to non-personalized explanations. In the included literature, personalized explanations typically present information that is specifically relevant to an individual user, for example by highlighting particular features or by adapting the explanation based on prior interactions, preferences, or behavioral history. The vast majority of included studies report no significant effects of personalization at all. They found null results of personalization on trust (Hernandez-Bocanegra & Ziegler, 2020, 2021b; Tintarev & Masthoff, 2008; Tsai et al., 2021), reliance (Matarese et al., 2023), transparency (Hernandez-Bocanegra & Ziegler, 2020, 2021b; Lu et al., 2023; Tsai et al., 2021), effectiveness (Gedikli et al., 2014; Hernandez-Bocanegra & Ziegler, 2020, 2021b; Tintarev & Masthoff, 2008), subjective quality (Hernandez-Bocanegra & Ziegler, 2020, 2021b), satisfaction (Gedikli et al., 2011; Hernandez-Bocanegra & Ziegler, 2020, 2021b; Lu et al., 2023; Matarese et al., 2023; Naveed et al., 2018; Tsai et al., 2021), system acceptance, completeness, and intention to use (Naveed et al., 2018), as well as on time (Gedikli et al., 2011, 2014), accuracy (Gedikli et al., 2011; Lu et al., 2023), performance and user experience (Matarese et al., 2023; Tsai et al., 2021), persuasiveness (Lu et al., 2023; Tsukuda & Goto, 2020), learning and mental load (Tsai et al., 2021).
The few studies that found significant effects of personalized explanations, reported findings in different directions. Participants have higher satisfaction (Gedikli et al., 2014; Tintarev & Masthoff, 2008) and transparency (Gedikli et al., 2014 for tag clouds) with personalized explanations compared to non-personalized explanations. Additionally, qualitative findings found that personalized explanations were the most appreciated feature within an interactive explanation setting (Guesmi et al., 2024) and resulted in higher confidence, transparency, and help to communicate, but this was not replicated in the quantitative results (Tsai et al., 2021). On the other hand, personalized information seems less easy to understand, useful, and persuasive than information based on other users or content (Hernandez-Bocanegra & Ziegler, 2020, 2021b; Kouki et al., 2019, 2020).
One study tried to find the most optimal way to personalize the explanation design: A. Silva et al. (2024) found that balancing users’ preferred explanation modality (feature importance, language, or decision trees) with optimal task performance resulted in higher user preference and lower inappropriate compliance compared to randomly chosen modalities or maximizing modality preference. No other significant differences were observed, including when explanations were personalized based only on task performance or exclusively language explanations.
Overall, personalization showed little impact on either subjective or objective outcomes, but the few positive effects that were observed were largely confined to subjective measures such as satisfaction, transparency, confidence, and user appreciation rather than objective measures such as accuracy, performance, or time.
5.2.5. Framing
Framing choices can influence how explanations are perceived but the specific effects depend strongly on the type of framing used and the situation in which it is applied. Several studies indicate that framing information in a more “argumentative” or “contrastive” way can improve user outcomes compared to a more descriptive statement. Using argumentative facts (keywords with words like “therefore”) were more persuasive than simple factual keywords, although fully argumentative sentences were the least persuasive (Zanker & Schoberegger, 2014). For invalid statements, questioning framings improved accuracy and informativeness compared to causal framings, whereas for valid statements, causal framings were more informative (Danry et al., 2023). “General” explanations performed worse than contrastive, truthful, and thorough explanations for both trust and personal attachment (Larasati et al., 2020). And finally, presenting one-sided information resulted in more user-interest than two-sided information, but satisfaction did not differ (Zhang et al., 2022). The specific way in which a contrastive explanation was framed appeared to have limited impact. Counterfactual explanations (how an outcome could have been different in the past) and prefactual explanations (how it could be different in the future) did not differ in terms of perceived accuracy or helpfulness (X. Dai et al., 2022).
Also other framing than “argumentative” aspects were investigated: positive framing improved understanding (Hadash et al., 2022; Kuhl et al., 2023), performance, and subjective experience (Kuhl et al., 2023) compared to negative framing. The perceived power of an explanation also appeared to influence user perceptions. High-power explanations increased users' sense of control, although they did not affect perceptions of system-related factors (Ha et al., 2022). Likewise, framing a system as highly autonomous reduced cognitive load and increased social presence and faith in the system compared to low-autonomy framing, but no differences were found in interaction fluency, confidence, or trust (B. Wang et al., 2024). Additionally, providing context-relevant information led to higher satisfaction compared to context-irrelevant details (Zhang et al., 2022) and using keywords that are familiar to the target user resulted in higher confidence than unfamiliar keywords (Evirgen et al., 2024). Similarly, using language that matched the user's wording resulted in better understanding than using less aligned language (Srivastava et al., 2023).
Framing effects also depend on the perceived reliability and correctness of the presented information. Papenmeier et al. (2022) shows that explanations framed with higher accuracy cues result in higher objective trust than medium or antagonistic framings. However, the effects differ between subjective and objective outcomes: while faithful explanations (i.e., correctly reflecting the model) improve objective trust compared to random information under high accuracy conditions, this advantage does not consistently translate to subjective trust. In some cases, subjective trust was even higher without explanations than with faithful or random explanations, indicating that users do not always respond to explanation quality in a straightforward way.
5.2.6. Human-Oriented Explanation Content
Two further factors studied in explanation design are the use of social information and the degree to which explanations appear human-like. The literature on these aspects shows mixed outcomes for social information and more promising patterns for human-like presentation.
Social and User-based Information
Evidence on whether explanations based on other users or “social” information are helpful show no consistent pattern: social or user-based information can sometimes help, sometimes harm, and often makes no measurable difference. About half of the individual findings report no significant differences when explanations are based on information of other humans rather than system-based or generic information, including for understanding (Brachman et al., 2023), trust and reliance (Matarese et al., 2023; A. Silva et al., 2023; Woodcock et al., 2021), time (A. Silva et al., 2023), performance and accuracy (Matarese et al., 2023; A. Silva et al., 2023), compliance, explainability (A. Silva et al., 2023), user experience (Matarese et al., 2023), perceived quality (J. Dai et al., 2023), and satisfaction (Matarese et al., 2023). About a quarter of the findings show benefits of social information, such as higher accuracy (Brachman et al., 2023), greater persuasiveness (Í. Silva et al., 2024; Tsukuda & Goto, 2020), better effectiveness (Í. Silva et al., 2024), and better user experience (Hasanah & Kusumo, 2024) compared to explanations based on generic information. Lu et al. (2023) also reported that peer-based and similar-user information appeared better for transparency, persuasiveness, accuracy, and satisfaction than generic explanations, though no statistical testing was performed. Other findings indicate the opposite: generic information explanations increase persuasiveness, usefulness (Sato et al., 2018, 2019), fairness, understanding, (Shulner-Tal et al., 2022), and satisfaction (J. Dai et al., 2023), and could be more preferred and useful (Hasanah & Kusumo, 2024) compared to social-based information. There is also some evidence that too much social information may not be helpful: Donkers et al. (2020) found that selected, aspect-based reviews performed better than large sets of user reviews.
Human-like Explanations
A recurring pattern across studies is that explanations presented in a more human-like way are generally preferred or lead to better outcomes than more technical or machine-like formats. Textual explanations framed like a human increased awareness of harm, perceived responsibility (Hindennach et al., 2024), understanding, user experience (Mukhtar et al., 2023), and increased usefulness ratings for lay-users, but not for AI experts (Cruz et al., 2022) compared to computer-based explanations. Additionally, textual highlights based on human strategies increased perceived quality and lowered processing time compared to computer-based highlights (Pafla et al., 2024). Similarly, adding human-like modalities (like audio or virtual agents) increased trust (Weitz et al., 2021). Finally, explanations perceived with higher human-agency increased trust in the system, which subsequently enhanced choice confidence (W. Liu & Wang, 2025). In this study, explanations attributed to an AI assistant or similar users were perceived as having greater human agency than those attributed to an algorithm (W. Liu & Wang, 2025).
At the same time, a majority of studies found no significant differences between human-like and machine-like formats on bias perception (Hou et al., 2024), trust or reliance (Ben David et al., 2021; Hou et al., 2024; Pafla et al., 2024), usefulness (Cruz et al., 2022), responsibility (Hindennach et al., 2024), correctness (Hindennach et al., 2024), satisfaction (Ben David et al., 2021; Pafla et al., 2024), performance (Pafla et al., 2024), cognitive load (Pafla et al., 2024).
Overall, the reported benefits of human-like explanations were more evident for subjective outcomes, such as perceived understanding, usefulness, and user experience, than for objective outcomes, where effects were largely absent.
5.3. More Promising Impact of Explanation Format
In this section, we turn to the explanation format, where we find yet more consistent and significant effects. In other words, how an explanation is presented seems to matter at least as much as, and in many cases more than, the underlying method or the specific content shown. Findings suggest there is no single format or design choice that works best in every context. Instead, the effectiveness of an explanation seems to depend on how well it organizes and structures information and how clearly it communicates key insights. Transparent formats that structure underlying information, often graphical or tabular, frequently support faster and more accurate understanding, but simpler or more constrained designs can be preferable when cognitive load needs to remain low.
5.3.1. Modality
Because modalities differ in how they structure information and how easily users can extract information and form an overview of what is going on, comparing them offers insight into which formats work well under which conditions. The following subsections compare these modalities systematically, beginning with textual and tabular formats and then moving on to visualizations, image-based, audio, and video. Overall, the evidence across modalities suggests that no single modality is universally best. Instead, users benefit most when explanations present information in a structured, clear, and cognitively manageable way, regardless of whether the medium is textual, tabular, or graphical.
Text Versus Tabular Formats
More than two thirds of the studies report no significant differences between text and tabular formats for performance (Gombolay et al., 2024; A. Silva et al., 2023), trust (Gates et al., 2023; Hernandez-Bocanegra & Ziegler, 2021a; A. Silva et al., 2023; X. Wang & Yin, 2021, 2022), effectiveness (Hernandez-Bocanegra & Ziegler, 2021a), time (A. Silva et al., 2023), subjective quality (Gates et al., 2023; Hernandez-Bocanegra & Ziegler, 2021a), perceived explainability (Gombolay et al., 2024; A. Silva et al., 2023), and other user experience measures (Gates et al., 2023; Hernandez-Bocanegra & Ziegler, 2021a).
The few significant findings tend to favor more organized formats, such as word clouds, interactive lists, or tables over plain natural language. Tabular explanations score higher on subjective quality (Hernandez-Bocanegra & Ziegler, 2023)and might be more preferred (Rago et al., 2021) than (conversational) natural language. Additionally, structured word clouds are preferred over basic word clouds (Tsai & Brusilovsky, 2019a) and have higher satisfaction and accuracy and shorter interaction time compared to tabular lists (Gedikli et al., 2014).
Graphical Versus Textual Formats
Overall, the included studies comparing graphical and textual explanation formats show that graphical explanations generally outperform plain text, if significant differences exist. This happens especially when graphical explanations offer a clear and quickly understandable overview.
Graphical representations lead to higher understanding (de Brito Duarte et al., 2023; Kumar et al., 2022), subjective trust, and quality ratings (de Brito Duarte et al., 2023), helpfulness (Heuer & Breiter, 2020), effectiveness and lower time (Gedikli et al., 2014), and higher reliance for high confidence-models (X. Wang & Yin, 2021, 2022) compared to textual alternatives. Qualitative studies support this positive effect of graphical formats: participants generally preferred graphical representations over text-based ones (Szymanski et al., 2022; Tsai & Brusilovsky, 2019a) and participants noted that these graphs provided a high level of transparency and insight into how their input contributed to the outcome (Szymanski et al., 2022).
Only a few studies show the opposite pattern, where textual explanations produce better understanding and more positive ratings (Mukhtar et al., 2023) and higher performance (Ribeiro et al., 2018; Szymanski et al., 2021), less interaction time (Ribeiro et al., 2018) than graphical ones. Closer inspection of these cases suggests that this tends to occur when the graphical representations are unclear or difficult to interpret.
Differences might depend on the specific design of the graphical formats, as some graphs are more understandable than text and others less (Schulze-Weddige & Zylowski, 2022), on the correctness of the advice (A. Silva et al., 2024), or it might depend on personal characteristics of the user, such as need for cognition or personal innovativeness (Chatti et al., 2022) or domain knowledge (Bhattacharya et al., 2023). In addition, Bhattacharya et al. (2023) noted that graphical representations supported quick understanding, textual annotations improved clarity, and many participants indicated a tendency to use multiple explanation aspects together.
Contrasting the promising findings of graphical formats compared to text, more than half of the studies find no significant differences at all for performance (A. Silva et al., 2023), trust (de Brito Duarte et al., 2023; Hernandez-Bocanegra & Ziegler, 2021a; Robbemond et al., 2022; A. Silva et al., 2023; X. Wang & Yin, 2021, 2022), understanding (Dominguez et al., 2020; X. Wang & Yin, 2021, 2022), interaction time (Dominguez et al., 2020; A. Silva et al., 2023), satisfaction (Gedikli et al., 2014; Guesmi et al., 2021; Hernandez-Bocanegra & Ziegler, 2021a), and several other user experience measures (Gedikli et al., 2014; Guesmi et al., 2021; Hernandez-Bocanegra & Ziegler, 2021a; Kumar et al., 2022; Robbemond et al., 2022; A. Silva et al., 2023; Szymanski et al., 2021).
Graphical Versus Tabular Formats
When comparing graphical formats to more organized textual formats such as tables, the differences become much less pronounced. In many studies, once text is presented in a structured way, the clear advantage that graphical representations usually have over plain text seems to disappear. A substantial number of studies show no significant differences between graphical and tabular formats, including performance (Naiseh et al., 2023; Stites et al., 2021), trust (Du et al., 2022; Hernandez-Bocanegra & Ziegler, 2021b, 2021a; X. Wang & Yin, 2021, 2022), understanding (Le et al., 2023; X. Wang & Yin, 2021, 2022), cognitive load (Jansen et al., 2024), effectiveness (Gedikli et al., 2014; Hernandez-Bocanegra & Ziegler, 2021b, 2021a), interaction time (Gedikli et al., 2014), satisfaction (Gedikli et al., 2014; Guesmi et al., 2021; Hernandez-Bocanegra & Ziegler, 2021b, 2021a; Jansen et al., 2024), reliability (Naiseh et al., 2023), persuasiveness (Guesmi et al., 2021; Hernandez-Bocanegra & Ziegler, 2021b), and other user experience measures (Gedikli et al., 2014; Guesmi et al., 2021; Hernandez-Bocanegra & Ziegler, 2021b, 2021a; Jansen et al., 2024; Naiseh et al., 2023; Tsai & Brusilovsky, 2019a).
Still, a few studies do report significant differences, although the findings point in different directions. In some cases, graphical explanations are more preferred (Du et al., 2022), result in higher reliance for high-confidence models (X. Wang & Yin, 2021, 2022), result in higher trust and satisfaction, specifically for one type of data (Le et al., 2023) compared to tabular explanations. In other cases, tabular explanations are more transparent, trusted, and efficient than decision-tree graphs (Guesmi et al., 2021), reach higher accuracy (V. Chen et al., 2023), and they may lead to higher satisfaction, trust, scrutability, persuasion, efficiency, and effectiveness compared to graphical formats (Chatti et al., 2022; Ha & Kim, 2023), although these last results were not tested statistically.
Images Versus Text-based Formats
Using images, icons, or other visuals that are not graphs, is not inherently better or worse than providing information textually, but their value depends on how clearly and meaningfully they support the explanation. About two thirds of the studies report no significant differences when visuals are compared to textual explanations for performance (Morrison et al., 2024), time (Cau et al., 2023), user experience (Guo et al., 2022; Jansen et al., 2024), satisfaction (Jansen et al., 2024; Wibowo et al., 2018), trust or reliance (Hou et al., 2024; Wibowo et al., 2018), bias perception (Hou et al., 2024), and effectiveness, efficiency, or transparency (Wibowo et al., 2018). Additionally, adding an image as part of the (textual) explanations did not improve trust and perceived usefulness (Mehrotra et al., 2024).
However, when visuals genuinely help structure information, they may outperform text. Showing a visual map results in lower cognitive load than a tabular explanation (Jansen et al., 2024), natural language alone takes longer to process than designs incorporating thumb-icons (Wibowo et al., 2018), and visual versions offer higher usefulness, transparency, and trust compared with textual versions with highlights (Khurana et al., 2021). At the same time, visuals can mislead users when they are unclear or difficult to interpret, as explanations using images of birds caused higher levels of deception than explanations presented in natural language (Morrison et al., 2024).
This could depend on the AI certainty: under high AI certainty, images lead to higher performance and text to higher user agreement with AI (Cau et al., 2023), but under high uncertainty, this pattern reverses such that text leads to better performance and image to higher agreement with AI.
Images Versus Graphical Formats
Comparing images with graphs appears more difficult, because the effectiveness of each seems to depend strongly on the application, and several studies find non-significant differences in understandability or time (Dominguez et al., 2020), trust (Ghods & Cook, 2022), or satisfaction (Jansen et al., 2024).
Yet when images provide a clear visual overview fitted to the task, they can outperform graphs in the right context. For time series data, pictures seem to have the best performance, highest understandability, and shortest completion time compared to graphs (Ghods & Cook, 2022). And a well designed static visual map, resembling an image, leads to a lower cognitive load and better user experience than graphs, and higher satisfaction for users with low AI knowledge (Jansen et al., 2024).
Types of Graphical Formats
Graphical representations sometimes work better than other modalities and sometimes do not, and the diversity of graphical formats makes this even harder to evaluate. Findings suggest that the effectiveness depends less on the specific graph chosen and more on how understandable it visualizes the underlying structure: graphical representations work well when they structure information clearly, avoid unnecessary complexity, and support the task.
Graphical representations that structure the underlying data instead of showing the raw data reduce time (Arendt et al., 2020), cognitive load (Abdul et al., 2020), and improve recall (Arendt et al., 2020), although other measures do not necessarily improve, such as precision (Arendt et al., 2020) and subjective understanding (Abdul et al., 2020). Qualitative work also points toward the value of graphs that structure information where participants mentioned that some types of graphical formats were preferred because they helped identifying relevance and comparing numbers more easily (Tsai & Brusilovsky, 2019a). The positive effect of structure is further supported by studies showing no significant differences when graphical representations share similar information and structure, including comparisons between pie and bar charts across transparency, satisfaction, effectiveness, and time (Gedikli et al., 2014), SHAP versus decision-tree explanations for satisfaction, cognitive load, and user experience (Jansen et al., 2024), different bar-chart variants for understanding, reliability, user experience, and performance (Naiseh et al., 2023), and rule-based graphs and decision trees for user experience (Vilone & Longo, 2022). Similarly, LIME and SHAP graphs, despite conceptual differences, often yield similar outcomes as well with no show significant differences between those graphs for understandability or predictability (Jalali et al., 2023; Schulze-Weddige & Zylowski, 2022), and bias-detection performance (Malhi et al., 2020). Again, the design matters more: a simple SHAP bar plot produces better understanding than a SHAP decision plot, SHAP force plot, or LIME, suggesting that structure and clarity drive effectiveness (Schulze-Weddige & Zylowski, 2022).
Yet not all structured graphs are necessarily superior and ease of understandability matters too: Yang et al. (2020) finds that a simple grid is perceived as more helpful than a decision tree, and the tree is more helpful than a more complex connected graph. Then again, for a rose-plot comparison, appropriate trust is higher for trees and graphs than it is for grids, whereas objective trust and confidence do not differ significantly across designs.
The effectiveness of graphical formats may also depend on the outcome measure considered. For example, tables and counterfactual bar-graphs both score higher on subjective understanding than feature-based graphs, while counterfactual graphs score highest on user experience among technically competent users (Naiseh et al., 2023).
At the same time, the “best” graphical representation seems to depend on the task. In an educational advising context, advisors found a slider interface slightly more usable, while a rose plot was easier for understanding student skills; the slider worked especially well when the goal was to see the impact of a specific feature (Scheers & De Laet, 2021). Tintarev et al. (2018) likewise reports that bar charts are better than chord diagrams (or radial networks) for understanding and confidence when explaining popularity, but the opposite pattern emerges for illustrating blind spots.
Audio Explanations
Most studies show that adding audio does not improve explanations compared to text or visuals. Across many outcome measures, audio makes no significant difference: trust (Avetisyan et al., 2022; Robbemond et al., 2022; B. Wang et al., 2024), credibility or usability (Robbemond et al., 2022), interaction fluency, user experience, perceived confidence (B. Wang et al., 2024), and satisfaction (Zhang et al., 2022). In fact, audio can sometimes reduce user interest compared to textual explanations (Zhang et al., 2022).
Still, audio can be helpful when added to existing explanations in time-sensitive contexts or in contexts where channels besides the auditory channel are overloaded: it increases situational awareness in a driving scenario (Avetisyan et al., 2022), reduces mental load and improves understandability with time-series data (B. Wang et al., 2024), and increases trust in a game scenario (Weitz et al., 2021).
Video Explanations
Similar to audio, videos do not appear to improve explanations. Videos result in lower performance (Pierson et al., 2024) and lower understanding (Septon et al., 2023) than a non-video alternative, and there are no significant differences in satisfaction (Septon et al., 2023) or understandability (Singla et al., 2023). The content of the video might influence the effectiveness of video explanations: a video explaining a series of counterfactual images had higher ratings for justification of the decision and helpfulness but lower perceived quality compared to a video explaining only two images (Singla et al., 2023).
5.3.2. Saliency
With saliency we refer to highlighting important information, either in text (for example, highlighting, bolding, or coloring words) or in images (for example, heatmaps, contours, bounding boxes, cut-outs, or dots). The evidence base differs for textual highlights and image-based saliency.
Textual Highlights
Overall, the effectiveness of textual highlights is mixed, with a large majority of the studies showing non-significant findings for performance (Cau et al., 2023; Gedikli et al., 2011; Pafla et al., 2024; Qu et al., 2021), effectiveness (Gedikli et al., 2014), time (Cau et al., 2023; Gedikli et al., 2011, 2014; Pafla et al., 2024), cognitive load (Pafla et al., 2024), trust (Gaube et al., 2023; Pafla et al., 2024), satisfaction (Gedikli et al., 2011, 2014; Pafla et al., 2024), and perceived quality (Donkers et al., 2020; Pafla et al., 2024).
Several studies show that textual highlighting could help in some cases: it improved perceived transparency (Gedikli et al., 2014), confidence, understanding, usability, satisfaction, and reduced perceived difficulty and workload (Qu et al., 2021) relative to no highlights. Additionally, textual highlights resulted in higher agreement, but this depended on the certainty of the AI (Cau et al., 2023) and, through mediated effects, it resulted in higher perceived quality (Donkers et al., 2020) compared to no highlighting. Finally, Pafla et al. (2024) found that with human-highlighted text or answer-only highlighting, participants spent less time on the task and they rated it as higher quality and more helpful than with computer-highlighted text.
Image-Based Saliency
For image-based saliency, the overall picture is also mixed, with again a number of non-significant results for performance (Das & Chernova, 2020; Huber et al., 2021; Maehigashi et al., 2023b, 2023a; Pierson et al., 2024), acceptance (Maehigashi et al., 2023b, 2023a), understandability, justification, quality, or helpfulness (Singla et al., 2023).
Saliency often performs worse than explanations without saliency cues: adding a bounding box around an image region increases users’ misclassification of images compared with no box (Kenny et al., 2023). Additionally, saliency cues result in lower accuracy, satisfaction, trust, self-efficacy, and confidence (Mertes et al., 2022), justification and helpfulness but received higher quality ratings (Singla et al., 2023) compared to counterfactual explanations. Also compared to example-based explanations, heatmaps were less preferred, while they did result in higher confidence (Evirgen et al., 2024). In a driving scenario, image-based or decision tree highlights, resulted in lower preference, more inappropriate compliance, more mistakes, and longer decision times compared to natural language based explanations (A. Silva et al., 2024). In a qualitative study, participants mentioned that heatmap-based explanations felt more unsatisfying because they do not answer the “why” question, but just the “where to look” question (S. S. Y. Kim et al., 2023). On the other side, only one study found a positive effect: a bounding box improved accuracy and perceived quality for non-experts (Gaube et al., 2023).
One study reported more mixed findings: under high uncertainty, highlights in abductive explanations led to higher agreement than no highlights, although they reduced performance, and under low uncertainty, this pattern reverses (Cau et al., 2023).
Several studies compare different ways of visualizing saliency but the results are diverse and do not point in a single best design. Some evidence suggests that saliency directly placed over the image leads to higher confidence and lower cognitive load rather than shown separately (Hudon et al., 2021; Karran et al., 2022). The provided detail with saliency also gave mixed results. Less detail seems to work better in some studies: more detailed heatmaps could result in higher cognitive load (Hudon et al., 2021; Karran et al., 2022) and longer interaction time (Knapič et al., 2021), and detailed outlines led to lower satisfaction whereas simple cut-outs help users better recognize correct decisions (Knapič et al., 2021). Other studies show the opposite: outlines or dense heatmaps supported higher confidence in no-overlay conditions (Hudon et al., 2021; Karran et al., 2022) and boxes and masks get worse quality ratings, than heatmaps and contours (Ammeling et al., 2023). Additionally, it is best to use traditional heatmap color schemes while focusing on smaller, low-level features to support higher accuracy (Famiglini et al., 2024).
At the same time, a similar number of studies report no significant differences between saliency designs: considering understanding or correctness for outlines versus heatmaps or cut-outs (Knapič et al., 2021), confidence in adjacent versus non-adjacent highlights (Karran et al., 2022), acceptance and accuracy for heatmap explanations with or without pointing cues (Maehigashi et al., 2023a, 2023b), or performance and agreement across techniques such as LIME cut-outs, Grad-CAM outlines, and feature-based visualizations (Morrison et al., 2023).
5.4. Strong Effects of Explanation Interaction
Interaction possibilities such as changing the input/output, conversational interfaces, and on-demand access seem to have a strong effect on human-AI interaction. In practice, interactivity is often implemented through interface elements such as buttons or links that allow users to navigate different aspects of an explanation, controls to adjust which features or inputs are considered, or interactive visualizations that enable users to explore and manipulate the model output. Although not uniformly beneficial across all contexts, these interactive and user-controlled elements tend to yield clearer and more consistent improvements in subjective experience, perceived usefulness, and understanding than many of the changes in explanation method or content.
Studies that vary levels of interactivity overwhelmingly report positive effects: subjective experiences (Andjelkovic et al., 2016; Hernandez-Bocanegra & Ziegler, 2021a; Robrecht et al., 2023), quality ratings (L. Chen et al., 2019; Hernandez-Bocanegra & Ziegler, 2021a, 2023; Yeh et al., 2023), persuasiveness (L. Chen et al., 2019), usefulness (Khurana et al., 2021), and transparency (Khurana et al., 2021), and users mentioned more engagement (Prabhudesai et al., 2023). Interactivity also strengthens users’ trust and confidence in the system (L. Chen et al., 2019; Hernandez-Bocanegra & Ziegler, 2021a; Khurana et al., 2021; Yeh et al., 2023) and enhances their understanding of the AI and its explanations (Robrecht et al., 2023; Schmude et al., 2023; Septon et al., 2023, qualitative), as well as the interpretability (Bhattacharya et al., 2023) and it creates more effective interactions (Hernandez-Bocanegra & Ziegler, 2021a; Yeh et al., 2023). Users also report more perceived control when interacting with the system (Andjelkovic et al., 2016; Guo et al., 2022; Prabhudesai et al., 2023).
Some downsides do emerge: interactivity can increase time (Gedikli et al., 2011) and users mentioned higher cognitive load (Prabhudesai et al., 2023), although L. Chen et al. (2019) find the opposite, i.e., with interactivity requiring less time compared to static textual explanations.
Only a few studies report no effects of interactivity for satisfaction (Septon et al., 2023), understanding (Lim et al., 2009; Yeh et al., 2023), trust (Lim et al., 2009), and no clear effects in a qualitative study as well (Schmude et al., 2023). Very few studies report negative effects of interactivity: it lowered one measure (out of multiple) of efficiency (Robrecht et al., 2023), satisfaction (Gedikli et al., 2011), and accuracy (Gedikli et al., 2011) and less interaction possibilities were preferred over more interaction by low-music sophistication participants (Martijn et al., 2022).
Overall, the positive effects of interactivity were observed predominantly for subjective outcomes, such as satisfaction, trust, perceived usefulness, and understanding, although some benefits were also reported for objective outcomes. In contrast, the limited null and negative findings were more frequently associated with objective outcomes, including efficiency, accuracy, time, and cognitive load.
5.4.1. Conversational Explanations
A specific form of interactivity is conversational interaction, such as chatbot-based explanations, which have become increasingly common with LLMs. Only a few studies compare conversational explanations with other formats, and the results are mixed. Some studies suggest that a graphical user interface has higher quality ratings (Hernandez-Bocanegra & Ziegler, 2023) and preference (Rago et al., 2021) compared to a conversational interface. Compared to plain textual explanations, one study suggests that textual is preferred over conversational (Rago et al., 2021), whereas another study suggests that conversational explanations support better understanding (Schmude et al., 2023).
5.4.2. On-Demand Explanations
Whether explanations should be shown up front or offered on demand mainly depends on how much information the explanation contains. For short explanations, presenting them up front results in higher preference (Martijn et al., 2022; Zang & Jeon, 2022), higher perceived competence and intelligence (Pu & Chen, 2007; Zang & Jeon, 2022), lower cognitive/work load (Pu & Chen, 2007; Zang & Jeon, 2022), and stronger intention to return (Pu & Chen, 2007) compared to demand explanations. One reason for the advantage of up-front explanations may be that adding on-demand options increases system complexity even when the amount of information is small (Buçinca et al., 2021).
In contrast, when explanations are long or when users already receive substantial information at the start, on-demand formats increased satisfaction (Bove et al., 2022), improved performance with incorrect AI predictions (Buçinca et al., 2021), and was preferred (Guesmi et al., 2024) and perceived as higher in warmth (Zang & Jeon, 2022) over up-front explanations.
Most significant effects are on subjective experiences, while objective measures more often show no differences for understanding (Bove et al., 2022), performance or accuracy (Buçinca et al., 2021; Zang & Jeon, 2022), trust (Buçinca et al., 2021; Zang & Jeon, 2022), preference (Buçinca et al., 2021), cognitive load (Buçinca et al., 2021; Zang & Jeon, 2022), user experience (Dominguez et al., 2020), time (Pu & Chen, 2007), and effort (Zang & Jeon, 2022).
6. Discussion
In this study, we take a comparative perspective on explainable AI by systematically reviewing studies that evaluate multiple explanation implementations side by side. This approach allows observed differences in outcomes to be attributed more directly to variations in explanation design. A central methodological decision was to restrict the analysis to studies that directly compare two or more explanation types within the same experimental setup, thereby ensuring matched conditions across comparisons. This contrasts with much of the earlier XAI literature, which often contrasts explanations with a no-explanation baseline (or no clear baseline at all). By focusing on explanation-versus-explanation contrasts, we could examine what changes when one XAI method is replaced by another, rather than simply whether explanations have an effect at all. To systematically capture these design differences, explanation implementations were analyzed across four dimensions: method, content, format, and interaction. This framework enabled a structured comparison of how variations in explanation design influence user outcomes.
The first key finding and most notable pattern in the reviewed literature is that, even when different explanation implementations are compared directly, consistent effects remain remarkably scarce. Earlier reviews have already shown that the impact of XAI on outcomes such as trust, understanding, and performance is often mixed and context-dependent (Haque et al., 2023; Laato et al., 2022; Rong et al., 2024; Schemmer et al., 2022). Our review extends this observation by focusing specifically on explanation-versus-explanation comparisons. Despite providing a more controlled basis for evaluating explanation design choices, these studies rarely converge on clear conclusions about what works best. Most comparisons yield mixed or non-significant effects, and no single explanation type consistently outperforms others. At the same time, this does not imply that explanations do not matter. Rather, the findings suggest that explanation effectiveness is highly dependent on contextual factors and the alignment between explanation design, user needs, and task characteristics.
A second key finding of this review is that explanation aspects become more influential as they move closer to the user. When organizing the results along the spectrum from more technical (AI-centered) to more human-centered aspects (see Figure 1, page 3), a consistent pattern becomes visible: explanation characteristics that shape how users interact with, experience, and interpret explanations generally have a stronger impact on outcomes than characteristics related to the underlying explanation algorithm.
Among these factors, explanation interaction appears most influential. Features that allow users to explore, query, modify, or request additional information consistently show the clearest and most consistent positive effects across studies. These findings align with conceptualizations of explanation as an interactive and social process rather than a static transfer of information (Miller, 2019), as well as recent frameworks that emphasize controllability, adaptivity, and dialogue as central qualities of effective XAI systems (Bertrand et al., 2023; Donoso-Guzmán et al., 2023; M.-Y. Kim et al., 2021). Together, these findings point toward a broader shift from static explanation outputs to more dynamic, adaptive, and dialogical forms of XAI.
Following interaction, explanation format also plays an important role. Structured and well-organized representations, such as clear visualizations, tables, or hybrid formats, tend to support understanding and efficiency, while unstructured or overly complex formats can hinder interpretation. Notably, the advantage of visual explanations over text largely disappears when textual information is presented in a similarly structured way. These results suggest that explanations should not be seen merely as outputs of an AI system, but as user interfaces that organize and communicate information in ways that align with human cognitive processes. This finding is consistent with earlier work highlighting explanations as communication and interface design problems rather than purely technical artefacts (Eiband et al., 2018; Haque et al., 2023; D. Wang et al., 2019).
In contrast, explanation content shows more moderate and context-dependent effects. Choices such as the amount of information, framing, or personalization can influence outcomes, but findings are mixed and the effectiveness depends strongly on the task, user, and setting. Elements that align more closely with human reasoning, such as human-like explanations or the inclusion of socially meaningful information, tend to show somewhat more consistent positive effects on perceived understanding, usefulness, and user experience. This is consistent with prior work emphasizing the importance of tailoring explanations to users’ informational needs, mental models, and contextual circumstances (Liao et al., 2020; Lim & Dey, 2010; Rosenfeld & Richardson, 2019).
Finally, the explanation method, such as feature-based, example-based, or counterfactual explanations, shows the weakest and least consistent effects. Most studies comparing these methods find no systematic differences, suggesting that differences in explanation algorithms alone are often insufficient to explain variation in end-user outcomes. This supports earlier critiques that the XAI field may place disproportionate emphasis on algorithmic differences, while the user-facing aspects of explanations receive less attention (Cabitza et al., 2023; Miller, 2019; Rong et al., 2024).
A third key finding of this review is that many XAI design choices involve trade-offs rather than clear improvements. A key example is the tension between fidelity and usability: more detailed explanations increase satisfaction and perceived understanding, but often lead to higher cognitive load and lower performance, with users performing best at moderate levels of complexity. This reflects broader discussions on balancing completeness and compactness in explanation design (Kulesza et al., 2012; Markus et al., 2021; Nauta et al., 2023). Similarly, visual explanations can be effective, but only when they are clear and well-structured; otherwise, they may hinder understanding. Interactivity also illustrates this balance: it often improves engagement and perceived usefulness, yet increases time investment and system complexity, reflecting broader discussions of controllability and progressive disclosure in interactive XAI systems (Donoso-Guzmán et al., 2023; Springer & Whittaker, 2020).
A fourth key finding of this review is that subjective and objective do not always align. Improvements in subjective experience do not necessarily translate into improvements in objective performance. Explanations that increase trust, satisfaction, or perceived understanding often have limited, mixed, or even opposing effects on decision quality, performance, appropriate reliance, or cognitive load. This observation aligns with previous reviews. For example, Rong et al. (2024) note that subjective understanding often improves with explanations, whereas objective metrics such as decision accuracy, trust calibration, and usability show mixed or no improvement. More generally, the misalignment between perceived and actual utility has increasingly been recognized as a key challenge in XAI evaluation (Haque et al., 2023; Islam et al., 2022; Johs et al., 2022). Our findings extend this observation by showing that this disconnect persists even when different explanation implementations are compared directly, rather than only when explanations are compared against a no-explanation baseline.
Taken together, these findings suggest a shift in perspective for XAI. The effectiveness of explanations appears to depend less on the specific algorithm used to generate them, and more on how they are communicated, structured, and aligned with human needs. This implies that XAI should not be approached primarily as a technical problem, but increasingly as a design problem of human–AI interaction. Small, user-facing design choices, such as enabling interaction, choosing an appropriate format, or balancing information complexity, can have a larger impact than differences between explanation algorithms themselves. While calls for a more user-centered perspective on XAI are not new (Laato et al., 2022; Miller, 2019; D. Wang et al., 2019), our findings provide evidence that this shift in focus is warranted. The most consistent effects emerge from user-facing design choices rather than from differences in the underlying explanation algorithms themselves.
6.1. Implications for Research in XAI
Building on the results of our review, we identify a set of key contributions to the field of explainable AI. These contributions reflect both what can be learned from existing comparative studies and what is needed to advance future research in a more systematic and impactful way.
First, research should move away from focusing on the question of “which XAI generation method is best,” and instead approach XAI as a user-centered design problem. Although the importance of user-centered XAI has been acknowledged for some time (Laato et al., 2022; Miller, 2019; D. Wang et al., 2019), our review demonstrates why this perspective deserves greater attention. Across a large body of direct explanation comparisons, the most robust effects were associated with user-facing design characteristics rather than with the underlying explanation methods. Based on this, we suggest that future research should explicitly treat XAI as a user-centered design problem. This means focusing more on how explanations are presented and used, such as format, interaction, and presentation, and clearly justifying these design choices in relation to the user needs and task context.
Second, explanations should be designed for fit rather than general superiority. Much of the existing literature implicitly treats explanations as universally “better” or “worse,” aiming to identify a single optimal design. However, our results highlight substantial variability in effects, suggesting that the value of an explanation is strongly context-dependent and shaped by the task, the user, the domain, and their interactions. This suggests that the effectiveness of XAI lies not in optimizing a single explanation format, but in matching explanations to their specific context of use. Consequently, researchers should move beyond main-effect comparisons and adopt research designs that explicitly model interaction effects (e.g., explanation × task) and moderation (e.g., explanation × user expertise), focusing on when and for whom particular explanations are effective, rather than if they are effective at all.
A third implication of our findings is the need to clearly separate subjective experience from objective performance. Across the reviewed studies, explanations that improved trust, satisfaction, or perceived understanding often showed limited or inconsistent effects on performance, appropriate reliance, cognitive load, or decision quality. This pattern was observed across multiple explanation types and design choices, suggesting that positive user perceptions should not automatically be interpreted as evidence of improved human-AI collaboration. Therefore, subjective improvement should not be treated as the only measure for effective human–AI collaboration. Instead, evaluations should systematically include both subjective and objective performance measures and explicitly report their (mis)alignment.
The fourth implication concerns the need for more targeted comparative research designs, adopting more structured matched conditions. Many existing studies compare XAI with no-XAI conditions or vary multiple explanation features simultaneously. Such designs are valuable for identifying explanations that work well in practice, but they make it difficult, if not impossible, to isolate which specific aspects of an explanation impact the observed effects. Our review therefore highlights that XAI research could benefit from more systematic and controlled comparative approaches that isolate single explanatory factors. Researchers should prioritize tightly matched conditions, clearly specify what differs between them, and vary explanation elements in a structured way. Such study designs are essential to disentangle the mechanisms underlying explanation effectiveness. Importantly, two interpretations could follow and should be further investigated. One is that the effectiveness of XAI is highly conditional on contextual factors, requiring more precise, theory-driven accounts of when and for whom specific explanation types work. The other is that the field may have overestimated the psychological distinctiveness of different XAI paradigms, while underestimating the role of contextual fit in shaping how explanations are perceived and used.
Finally, our review highlights several broader methodological challenges in the current XAI literature. As expected for a relatively young and rapidly growing field, many studies do not yet meet high standards of methodological rigor, especially for user studies. Many studies vary multiple explanation aspects simultaneously, rely on diverse and sometimes weak, non-validated outcome measures, provide limited or incomplete statistical reporting, or rely on relatively small samples. These issues do not invalidate existing findings, but they make it more difficult to compare results across studies and identify the mechanisms underlying explanation effectiveness. As the field matures, greater methodological rigor, standardized outcome measures, and more transparent reporting practices will be important for building a cumulative evidence base.
6.2. Limitations of this Study
The findings of this review should be interpreted within the scope of the available evidence and the methodological choices made in this study. First, although we included a large number of studies and selected those with direct comparisons between explanation types, our conclusions remain both dependent on the quality of the underlying literature and limited in isolating causal factors. Many studies still vary multiple aspects of explanation design simultaneously, which makes it difficult to attribute observed effects to a single component. As a result, the patterns identified should be interpreted as broad tendencies rather than precise causal effects, and reflect both the strengths and limitations of the available empirical evidence.
A limitation of this comparative approach is that it does not allow conclusions about whether the explanation conditions themselves outperform the absence of explanations. Consequently, findings should be interpreted as differences between explanation designs rather than as evidence for the overall effectiveness of XAI.
In addition, the distinction between method, content, format, and interaction should be interpreted as an analytical framework for this review rather than categories that were consistently defined or reported in the original studies. Although these four aspects provided a useful structure for synthesizing a highly heterogeneous literature, many studies did not explicitly describe their comparisons in these terms. Consequently, the classification of explanation characteristics required interpretation by the reviewers based on the reported explanation designs and materials. While we applied this framework consistently across studies, some explanation implementations could reasonably be classified in multiple ways, which may have introduced ambiguity in how individual comparisons were categorized.
Third, the included studies show substantial heterogeneity in domains, tasks, users, and outcome measures. While this diversity provides a comprehensive view of XAI applications, it limits direct comparability and reduces the extent to which findings can be generalized beyond broad patterns.
Finally, we applied quality criteria to decide which studies to include. This improves the interpretability and credibility of our findings, as it ensures that conclusions are based on studies with sufficient methodological detail and rigor. At the same time, this decision may have influenced the patterns we observe, as excluding lower-quality studies also means excluding part of the available evidence. The exact threshold is inevitably somewhat arbitrary, but it was necessary to strike a balance between including as much literature as possible and ensuring that the results could be meaningfully compared and interpreted.
6.3. Conclusion
In this paper, we conducted a systematic review of studies that directly compare different implementations of explainable AI (XAI), with the aim of understanding how explanation design influences human–AI interaction outcomes. Across the reviewed literature, we find that differences between explanation approaches are often limited and highly context-dependent. Comparisons between explanation methods rarely yield consistent advantages, suggesting that technical differences in how explanations are generated are often less decisive for user outcomes. In contrast, aspects that are more closely tied to the human side, such as how explanations are presented, structured, and how interaction is facilitated, more frequently influence users’ understanding, experience, and decision-making.
These findings suggest that the effectiveness of XAI lies less in the underlying algorithmic approach and more in how explanations are designed, presented, and integrated into user interaction. In other words, explanations appear to become more impactful as they move closer to the human-centered end of the spectrum of explanation aspects.
Taken together, our results highlight the need to shift the focus of XAI research from developing new explanation methods toward designing explanations that are aligned with human needs, contexts, and decision-making processes. Rather than asking which explanation method is best, future research should focus on when, for whom, and in which context explanations truly make a difference.
Authors contributions
CRediT: Mieke Ronckers: Conceptualization, Data curation, Formal analysis, Methodology, Project administration, Visualization, Writing – original draft, Writing – review and editing; Rianne Conijn: Conceptualization, Data curation, Funding acquisition, Supervision, Validation, Writing – review and editing; Chris Snijders: Conceptualization, Data curation, Funding acquisition, Supervision, Validation, Writing – review and editing.
Declaration of generative AI use: During the preparation of this work, the authors used Microsoft Copilot to assist in drafting, revising, and editing the manuscript. Google NotebookLM was used to organize references and search within downloaded literature sources. AI-assisted features available in Rayyan.ai were used to support the literature screening process. All outputs and recommendations generated by these tools were critically reviewed by the authors, who take full responsibility for the content of the article.
Funding
This work was partly supported by an Eindhoven AI Systems Institute (EAISI) starting grant.
Acknowledgments
The authors would like to thank Rik Schutte (RS), Mink Veltman (MV), and Renske Lijcklama à Nijeholt (RLN) for their valuable contributions to the screening and data extraction processes. Their support was invaluable, particularly in managing the large volume of included studies.
Appendix A. Search Queries
Scopus
TITLE-ABS-KEY ( ( xai OR ( ( explanation OR explainable OR explanatory OR interpretable OR intelligible OR explainability OR interpretability OR intelligibility ) W/15 ( ai OR "Artificial Intelligence" OR "black-box" OR "machine learning" OR "recommender system*" ) ) ) AND ( "user study" OR participant* OR "human subject*" OR "empirical study" OR "lab study" OR "user evaluation" OR "human evaluation" OR "end-users" OR "user experiment*" ) AND NOT ( "model calibration" OR "validation data" OR "model performance" OR "cross validation" ) )
ACM Digital Library
(Abstract:(XAI explanation explainable explanatory interpretable intelligible explainability interpretability intelligibility) OR Title:(XAI explanation explainable explanatory interpretable intelligible explainability interpretability intelligibility) OR Keyword:(XAI explanation explainable explanatory interpretable intelligible explainability interpretability intelligibility)) AND (Abstract:(AI "Artificial Intelligence" "black?box" "machine learning" "recommender system*") OR Title:(AI "Artificial Intelligence" "black?box" "machine learning" "recommender system*") OR Keyword:(AI "Artificial Intelligence" "black?box" "machine learning" "recommender system*")) AND (Abstract:("user study" participant* "human subject*" "empirical study" "lab study" "user evaluation" "human evaluation" "end?user*" "user experiment*") OR Title: ("user study" participant* "human subject*" "empirical study" "lab study" "user evaluation" "human evaluation" "end?user*" "user experiment*") OR Keyword: ("user study" participant* "human subject*" "empirical study" "lab study" "user evaluation" "human evaluation" "end?user*" "user experiment*")) AND NOT (Abstract:("model calibration" "validation data" "model performance" "cross?validation") OR Title:("model calibration" "validation data" "model performance" "cross?validation") OR Keyword:("model calibration" "validation data" "model performance" "cross?validation"))
IEEE Xplore
(("All Metadata":XAI OR (("All Metadata":explanation OR "All Metadata":explainable OR "All Metadata":explanatory OR "All Metadata":interpretable OR "All Metadata":intelligible OR "All Metadata":explainability OR "All Metadata": interpretability OR "All Metadata":intelligibility) NEAR ("All Metadata":AI OR "All Metadata":“Artificial Intelligence” OR "All Metadata":“black-box” OR "All Metadata":“machine learning” OR "All Metadata":“recommender system*”))) AND ("All Metadata":“user study” OR "All Metadata":participant* OR "All Metadata":“human subject*” OR "All Metadata":“empirical study” OR "All Metadata":“lab study” OR "All Metadata":“user evaluation” OR "All Metadata":“human evaluation” OR "All Metadata":"end?user*" OR "All Metadata":"user experiment*") NOT ("All Metadata":"model calibration" OR "All Metadata":"validation data" OR "All Metadata":"model performance" OR "All Metadata":"cross?validation") )
Web of Science
TS=(XAI OR ((explanation OR explainable OR explanatory OR interpretable OR intelligible OR explainability OR interpretability OR intelligibility) NEAR (AI OR “Artificial Intelligence” OR “black-box” OR “machine learning” OR “recommender system*”))) AND TS=(“user study” OR participant* OR “human subject*” OR “empirical study” OR “lab study” OR “user evaluation” OR “human evaluation” OR "end-user*" OR "user experiment*") NOT TS=( "model calibration" OR "validation data" OR "model performance" OR "cross validation")
References
- Studies included in the systematic review are marked with an asterisk*
- *Abdul, A.; von der Weth, C.; Kankanhalli, M.; Lim, B. Y. COGAM: Measuring and Moderating Cognitive Load in Machine Learning Model Explanations. In Proceedings of the 2020 CHI Conference on Human Factors in Computing Systems; 2020; pp. 1–14. [Google Scholar] [CrossRef]
- Adhikari, A.; Wenink, E.; van der Waa, J.; Bouter, C.; Tolios, I.; Raaijmakers, S. Towards FAIR Explainable AI: a standardized ontology for mapping XAI solutions to use cases, explanations, and AI systems. In Proceedings of the 15th International Conference on PErvasive Technologies Related to Assistive Environments; 2022; pp. 562–568. [Google Scholar] [CrossRef]
- Alvarez-Melis, D.; Jaakkola, T. S. On the Robustness of Interpretability Methods; 2018; Available online: http://arxiv.org/abs/1806.08049.
- Amershi, S.; Cakmak, M.; Knox, W. B.; Kulesza, T. Power to the People: The Role of Humans in Interactive Machine Learning. AI Magazine 2014, 35(4), 105–120. [Google Scholar] [CrossRef]
- *Ammeling, J.; Manger, C.; Kwaka, E.; Krügel, S.; Uhl, M.; Kießig, A.; Fritz, A.; Ganz, J.; Riener, A.; Bertram, C. A.; Breininger, K.; Aubreville, M. Appealing but Potentially Biasing - Investigation of the Visual Representation of Segmentation Predictions by AI Recommender Systems for Medical Decision Making. Mensch Und Computer 2023 2023, 330–335. [Google Scholar] [CrossRef]
- *Andjelkovic, I.; Parra, D.; O’Donovan, J. Moodplay: Interactive Mood-based Music Discovery and Recommendation. In Proceedings of the 2016 Conference on User Modeling Adaptation and Personalization; 2016; pp. 275–279. [Google Scholar] [CrossRef]
- Apley, D. W.; Zhu, J. Visualizing the Effects of Predictor Variables in Black Box Supervised Learning Models. Journal of the Royal Statistical Society Series B: Statistical Methodology 2020, 82(4), 1059–1086. [Google Scholar] [CrossRef]
- *Arendt, D. L.; Nur, N.; Huang, Z.; Fair, G.; Dou, W. Parallel Embeddings: a Visualization Technique for Contrasting Learned Representations. In Proceedings of the 25th International Conference on Intelligent User Interfaces; 2020; pp. 259–274. [Google Scholar] [CrossRef]
- *Avetisyan, L.; Ayoub, J.; Zhou, F. Investigating explanations in conditional and highly automated driving: The effects of situation awareness and modality. Transportation Research Part F: Traffic Psychology and Behaviour 2022, 89, 456–466. [Google Scholar] [CrossRef]
- Bangor, A.; Kortum, P. T.; Miller, J. T. An Empirical Evaluation of the System Usability Scale. International Journal of Human–Computer Interaction 2008, 24(6), 574–594. [Google Scholar] [CrossRef]
- *Barile, F.; Draws, T.; Inel, O.; Rieger, A.; Najafian, S.; Ebrahimi Fard, A.; Hada, R.; Tintarev, N. Evaluating explainable social choice-based aggregation strategies for group recommendation. User Modeling and User-Adapted Interaction 2024, 34(1), 1–58. [Google Scholar] [CrossRef]
- *Barile, F.; Najafian, S.; Draws, T.; Inel, O.; Rieger, A.; Hada, R.; Tintarev, N. Toward Benchmarking Group Explanations: Evaluating the Effect of Aggregation Strategies versus Explanation. In Proceedings of the Perspectives on the Evaluation of Recommender Systems Workshop (PERSPECTIVES 2021); 2021. Available online: http://ceur-ws.org.
- *Ben David, D.; Resheff, Y. S.; Tron, T. Explainable AI and Adoption of Financial Algorithmic Advisors. In Proceedings of the 2021 AAAI/ACM Conference on AI, Ethics, and Society; 2021; pp. 390–400. [Google Scholar] [CrossRef]
- Bertrand, A.; Viard, T.; Belloum, R.; Eagan, J. R.; Maxwell, W. On Selective, Mutable and Dialogic XAI: a Review of What Users Say about Different Types of Interactive Explanations. Conference on Human Factors in Computing Systems - Proceedings, April 19; 2023. [Google Scholar] [CrossRef]
- *Bhattacharya, A.; Ooge, J.; Stiglic, G.; Verbert, K. Directive Explanations for Monitoring the Risk of Diabetes Onset: Introducing Directive Data-Centric Explanations and Combinations to Support What-If Explorations. In Proceedings of the 28th International Conference on Intelligent User Interfaces; 2023; pp. 204–219. [Google Scholar] [CrossRef]
- *Bove, C.; Aigrain, J.; Lesot, M.-J.; Tijus, C.; Detyniecki, M. Contextualization and Exploration of Local Feature Importance Explanations to Improve Understanding and Satisfaction of Non-Expert Users. In 27th International Conference on Intelligent User Interfaces; 2022; pp. 807–819. [Google Scholar] [CrossRef]
- *Bove, C.; Lesot, M.-J.; Tijus, C. A.; Detyniecki, M. Investigating the Intelligibility of Plural Counterfactual Examples for Non-Expert Users: an Explanation User Interface Proposition and User Study. In Proceedings of the 28th International Conference on Intelligent User Interfaces; 2023; pp. 188–203. [Google Scholar] [CrossRef]
- *Brachman, M.; Pan, Q.; Do, H. J.; Dugan, C.; Chaudhary, A.; Johnson, J. M.; Rai, P.; Chakraborti, T.; Gschwind, T.; Laredo, J. A.; Miksovic, C.; Scotton, P.; Talamadupula, K.; Thomas, G. Follow the Successful Herd: Towards Explanations for Improved Use and Mental Models of Natural Language Systems. In Proceedings of the 28th International Conference on Intelligent User Interfaces; 2023; pp. 220–239. [Google Scholar] [CrossRef]
- *Buçinca, Z.; Malaya, M. B.; Gajos, K. Z. To Trust or to Think: Cognitive Forcing Functions Can Reduce Overreliance on AI in AI-assisted Decision-making. Proceedings of the ACM on Human-Computer Interaction 2021, 5(CSCW1), 1–21. [Google Scholar] [CrossRef]
- *Burkart, N.; Robert, S.; Huber, M. F. Are you sure? Prediction revision in automated decisionmaking. Expert Systems 2021, 38(1). [Google Scholar] [CrossRef]
- Bussone, A.; Stumpf, S.; O’Sullivan, D. The Role of Explanations on Trust and Reliance in Clinical Decision Support Systems. In 2015 International Conference on Healthcare Informatics; 2015; pp. 160–169. [Google Scholar] [CrossRef]
- Cabitza, F.; Campagner, A.; Natali, C.; Parimbelli, E.; Ronzio, L.; Cameli, M. Painting the Black Box White: Experimental Findings from Applying XAI to an ECG Reading Setting. Machine Learning and Knowledge Extraction 2023, 5(1), 269–286. [Google Scholar] [CrossRef]
- Cabour, G.; Morales-Forero, A.; Ledoux, É.; Bassetto, S. An explanation space to align user studies with the technical development of Explainable AI. AI & SOCIETY 2023, 38(2), 869–887. [Google Scholar] [CrossRef]
- Cai, C. J.; Winter, S.; Steiner, D.; Wilcox, L.; Terry, M. “Hello Ai”: Uncovering the onboarding needs of medical practitioners for human–AI collaborative decision-making. In Proceedings of the ACM on Human-Computer Interaction; Association for Computing Machinery, 2019; Vol. 3. [Google Scholar] [CrossRef]
- Caruana, R.; Lou, Y.; Gehrke, J.; Koch, P.; Sturm, M.; Elhadad, N. Intelligible Models for HealthCare. In Proceedings of the 21th ACM SIGKDD International Conference on Knowledge Discovery and Data Mining; 2015; pp. 1721–1730. [Google Scholar] [CrossRef]
- *Cau, F. M.; Hauptmann, H.; Spano, L. D.; Tintarev, N. Effects of AI and Logic-Style Explanations on Users’ Decisions Under Different Levels of Uncertainty. ACM Transactions on Interactive Intelligent Systems 2023, 13(4), 1–42. [Google Scholar] [CrossRef]
- *Celar, L.; Byrne, R. M. J. How people reason with counterfactual and causal explanations for Artificial Intelligence decisions in familiar and unfamiliar domains. Memory & Cognition 2023, 51(7), 1481–1496. [Google Scholar] [CrossRef] [PubMed]
- Chatti, M. A.; Guesmi, M.; Muslim, A. Visualization for Recommendation Explainability: A Survey and New Perspectives. ACM Transactions on Interactive Intelligent Systems 2024, 14(3), 1–40. [Google Scholar] [CrossRef]
- *Chatti, M. A.; Guesmi, M.; Vorgerd, L.; Ngo, T.; Joarder, S.; Ain, Q. U.; Muslim, A. Is More Always Better? The Effects of Personal Characteristics and Level of Detail on the Perception of Explanations in a Recommender System. In Proceedings of the 30th ACM Conference on User Modeling, Adaptation and Personalization; 2022; pp. 254–264. [Google Scholar] [CrossRef]
- Chazette, L.; Schneider, K. Explainability as a non-functional requirement: challenges and recommendations. Requirements Engineering 2020, 25(4), 493–514. [Google Scholar] [CrossRef]
- *Chen, H.; Ma, X.; Rives, H.; Serpedin, A.; Yao, P.; Rameau, A. Trust in Machine Learning Driven Clinical Decision Support Tools Among Otolaryngologists. The Laryngoscope 2024, 134(6), 2799–2804. [Google Scholar] [CrossRef] [PubMed]
- *Chen, L.; Yan, D.; Wang, F. User Evaluations on Sentiment-based Recommendation Explanations. ACM Transactions on Interactive Intelligent Systems 2019, 9(4), 1–38. [Google Scholar] [CrossRef] [PubMed]
- *Chen, V.; Liao, Q. V.; Wortman Vaughan, J.; Bansal, G. Understanding the Role of Human Intuition on Reliance in Human-AI Decision-Making with Explanations. Proceedings of the ACM on Human-Computer Interaction 2023, 7(CSCW2), 1–32. [Google Scholar] [CrossRef]
- Conati, C.; Barral, O.; Putnam, V.; Rieger, L. Toward personalized XAI: A case study in intelligent tutoring systems. Artificial Intelligence 2021, 298, 103503. [Google Scholar] [CrossRef]
- Confalonieri, R.; Alonso-Moral, J. M. An Operational Framework for Guiding Human Evaluation in Explainable and Trustworthy Artificial Intelligence. IEEE Intelligent Systems 2024, 39(1), 18–28. [Google Scholar] [CrossRef]
- *Conijn, R.; Kahr, P.; Snijders, C. The Effects of Explanations in Automated Essay Scoring Systems on Student Trust and Motivation. Journal of Learning Analytics 2023, 10(1), 37–53. [Google Scholar] [CrossRef]
- Cortiñas-Lorenzo, K.; Cai, W.; Doherty, G. Designing, Implementing, and Evaluating AI Explanations: A Scoping Review of Explainable AI Frameworks. ACM Transactions on Computer-Human Interaction 2025, 32(6), 1–79. [Google Scholar] [CrossRef]
- Covidence systematic review software; Available at www.covidence.org; Veritas Health Innovation: Melbourne, Australia, 2025.
- *Cruz, F.; Young, C.; Dazeley, R.; Vamplew, P. Evaluating Human-like Explanations for Robot Actions in Reinforcement Learning Scenarios. In 2022 IEEE/RSJ International Conference on Intelligent Robots and Systems (IROS); 2022; pp. 894–901. [Google Scholar] [CrossRef]
- *Dai, J.; Zhang, C.; Aliakseyeu, D.; Peeters, S.; Ijsselsteijn, W. A. The Effect of Explanation Design on User Perception of Smart Home Lighting Systems: A Mixed-method Investigation. In Proceedings of the 2023 CHI Conference on Human Factors in Computing Systems; 2023; pp. 1–14. [Google Scholar] [CrossRef]
- *Dai, X.; Keane, M. T.; Shalloo, L.; Ruelle, E.; Byrne, R. M. J. Counterfactual Explanations for Prediction and Diagnosis in XAI. In Proceedings of the 2022 AAAI/ACM Conference on AI, Ethics, and Society; 2022; pp. 215–226. [Google Scholar] [CrossRef]
- *Danry, V.; Pataranutaporn, P.; Mao, Y.; Maes, P. Don’t Just Tell Me, Ask Me: AI Systems that Intelligently Frame Explanations as Questions Improve Human Logical Discernment Accuracy over Causal AI explanations. In Proceedings of the 2023 CHI Conference on Human Factors in Computing Systems; 2023; pp. 1–13. [Google Scholar] [CrossRef]
- *Das, D.; Chernova, S. Leveraging rationales to improve human task performance. In Proceedings of the 25th International Conference on Intelligent User Interfaces; 2020; pp. 510–518. [Google Scholar] [CrossRef]
- *de Brito Duarte, R.; Correia, F.; Arriaga, P.; Paiva, A. AI Trust: Can Explainable AI Enhance Warranted Trust? Human Behavior and Emerging Technologies 2023, 2023, 1–12. [Google Scholar] [CrossRef]
- Díaz-Rodríguez, N.; Del Ser, J.; Coeckelbergh, M.; López de Prado, M.; Herrera-Viedma, E.; Herrera, F. Connecting the dots in trustworthy Artificial Intelligence: From AI principles, ethics, and key requirements to responsible AI systems and regulation. Information Fusion 2023, 99, 101896. [Google Scholar] [CrossRef]
- *Dodge, J.; Khanna, R.; Irvine, J.; Lam, K.; Mai, T.; Lin, Z.; Kiddle, N.; Newman, E.; Anderson, A.; Raja, S.; Matthews, C.; Perdriau, C.; Burnett, M.; Fern, A. After-Action Review for AI (AAR/AI). ACM Transactions on Interactive Intelligent Systems 2021, 11(3–4), 1–35. [Google Scholar] [CrossRef]
- *Dodge, J.; Liao, Q. V.; Zhang, Y.; Bellamy, R. K. E.; Dugan, C. Explaining Models: An Empirical Study of How Explanations Impact Fairness Judgment. In Proceedings of the 24th International Conference on Intelligent User Interfaces, Part F147615; 2019; pp. 275–285. [Google Scholar] [CrossRef]
- *Dominguez, V.; Donoso-Guzmán, I.; Messina, P.; Parra, D. Algorithmic and HCI Aspects for Explaining Recommendations of Artistic Images. ACM Transactions on Interactive Intelligent Systems 2020, 10(4), 1–31. [Google Scholar] [CrossRef]
- *Donkers, T.; Kleemann, T.; Ziegler, J. Explaining recommendations by means of aspect-based transparent memories. In Proceedings of the 25th International Conference on Intelligent User Interfaces; 2020; pp. 166–176. [Google Scholar] [CrossRef]
- Donoso-Guzmán, I.; Ooge, J.; Parra, D.; Verbert, K. Towards a Comprehensive Human-Centred Evaluation Framework for Explainable AI; 2023; pp. 183–204. [Google Scholar] [CrossRef]
- *Du, Y.; Antoniadi, A. M.; McNestry, C.; McAuliffe, F. M.; Mooney, C. The Role of XAI in Advice-Taking from a Clinical Decision Support System: A Comparative User Study of Feature Contribution-Based and Example-Based Explanations. Applied Sciences 2022, 12(20), 10323. [Google Scholar] [CrossRef]
- *Ehsan, U.; Tambwekar, P.; Chan, L.; Harrison, B.; Riedl, M. O. Automated Rationale Generation: A Technique for Explainable AI and its Effects on Human Perceptions. In Proceedings of the 24th International Conference on Intelligent User Interfaces, Part F147615; 2019; pp. 263–274. [Google Scholar] [CrossRef]
- Eiband, M.; Schneider, H.; Bilandzic, M.; Fazekas-Con, J.; Haug, M.; Hussmann, H. Bringing Transparency Design into Practice. In 23rd International Conference on Intelligent User Interfaces; 2018; pp. 211–223. [Google Scholar] [CrossRef]
- El-Assady, M.; Jentner, W.; Kehlbeck, R.; Schlegel, U.; Sevastjanova, R.; Sperrle, F.; Spinner, T.; Keim, D. Towards XAI: Structuring the Processes of Explanations. In Proc. ACM Workshop Hum.-Centered Mach. 2366 Learn.; 2019; pp. 1–12. Available online: https://www.researchgate.net/publication/332802468.
- *Evirgen, N.; Wang, R.; Chen, X.; Anthony. From Text to Pixels: Enhancing User Understanding through Text-to-Image Model Explanations. In Proceedings of the 29th International Conference on Intelligent User Interfaces; 2024; pp. 74–87. [Google Scholar] [CrossRef]
- *Famiglini, L.; Campagner, A.; Barandas, M.; La Maida, G. A.; Gallazzi, E.; Cabitza, F. Evidence-based XAI: An empirical approach to design more effective and explainable decision support systems. Computers in Biology and Medicine 2024, 170, 108042. [Google Scholar] [CrossRef] [PubMed]
- Farrow, R. The possibilities and limits of explicable artificial intelligence (XAI) in education: a socio-technical perspective. Learning, Media and Technology 2023, 48(2), 266–279. [Google Scholar] [CrossRef]
- Friedman, J. H. Greedy Function Approximation: A Gradient Boosting Machine. The Annals of Statistics 2001, 29(5), 1189–1232. Available online: http://www.jstor.orgURL:http://www.jstor.org/stable/2699986. [CrossRef]
- *Gates, L.; Leake, D.; Wilkerson, K. Cases Are King: A User Study of Case Presentation to Explain CBR Decisions. In Case-Based Reasoning Research and Development. ICCBR 2023. Lecture Notes in Computer Science(); Massie, S., Chakraborti, S., Eds.; Springer: Cham, 2023; Vol. 14141, pp. 153–168. [Google Scholar] [CrossRef]
- *Gaube, S.; Suresh, H.; Raue, M.; Lermer, E.; Koch, T. K.; Hudecek, M. F. C.; Ackery, A. D.; Grover, S. C.; Coughlin, J. F.; Frey, D.; Kitamura, F. C.; Ghassemi, M.; Colak, E. Non-task expert physicians benefit from correct explainable AI advice when reviewing X-rays. Scientific Reports 2023, 13(1), 1383. [Google Scholar] [CrossRef] [PubMed]
- *Gedikli, F.; Ge, M.; Jannach, D. Understanding Recommendations by Reading the Clouds. In E-Commerce and Web Technologies. EC-Web 2011. Lecture Notes in Business Information Processing; Huemer, C., Setzer, T., Eds.; Springer: Berlin, Heidelberg, 2011; Vol. 85, pp. 196–208. [Google Scholar] [CrossRef]
- *Gedikli, F.; Jannach, D.; Ge, M. How should I explain? A comparison of different explanation types for recommender systems. International Journal of Human-Computer Studies 2014, 72(4), 367–382. [Google Scholar] [CrossRef]
- Gentile, D.; Donmez, B.; Jamieson, G. A. Human performance consequences of normative and contrastive explanations: An experiment in machine learning for reliability maintenance. Artificial Intelligence 2023, 321, 103945. [Google Scholar] [CrossRef]
- *Ghods, A.; Cook, D. J. PIP: Pictorial Interpretable Prototype Learning for Time Series Classification. IEEE Computational Intelligence Magazine 2022, 17(1), 34–45. [Google Scholar] [CrossRef] [PubMed]
- *Gombolay, G. Y.; Silva, A.; Schrum, M.; Gopalan, N.; Hallman-Cooper, J.; Dutt, M.; Gombolay, M. Effects of explainable artificial intelligence in neurology decision support. Annals of Clinical and Translational Neurology 2024, 11(5), 1224–1235. [Google Scholar] [CrossRef] [PubMed]
- Goodman, B.; Flaxman, S. European Union Regulations on Algorithmic Decision Making and a “Right to Explanation.”. AI Magazine 2017, 38(3), 50–57. [Google Scholar] [CrossRef]
- *Goyal, N.; Baumler, C.; Nguyen, T.; Daumé, H., III. The Impact of Explanations on Fairness in Human-AI Decision-Making: Protected vs Proxy Features. In Proceedings of the 29th International Conference on Intelligent User Interfaces; 2024; pp. 155–180. [Google Scholar] [CrossRef]
- *Guesmi, M.; Chatti, M. A.; Joarder, S.; Ain, Q. U.; Alatrash, R.; Siepmann, C.; Vahidi, T. Interactive Explanation with Varying Level of Details in an Explainable Scientific Literature Recommender System. International Journal of Human–Computer Interaction 2024, 40(22), 7248–7269. [Google Scholar] [CrossRef]
- *Guesmi, M.; Chatti, M. A.; Joarder, S.; Ain, Q. U.; Siepmann, C.; Ghanbarzadeh, H.; Alatrash, R. Justification vs. Transparency: Why and How Visual Explanations in a Scientific Literature Recommender System. Information 2023, 14(7), 401. [Google Scholar] [CrossRef]
- *Guesmi, M.; Chatti, M. A.; Vorgerd, L.; Joarder, S.; Ain, U.; Ngo, T.; Zumor, S.; Sun, Y.; Ji, F.; Muslim, A. Input or Output: Effects of Explanation Focus on the Perception of Explainable Recommendation with Varying Level of Details. IntRS’21: Joint Workshop on Interfaces and Human Decision Making for Recommender Systems 2021, 55–72. Available online: http://ceur-ws.org.
- *Guesmi, M.; Chatti, M. A.; Vorgerd, L.; Ngo, T.; Joarder, S.; Ain, Q. U.; Muslim, A. Explaining User Models with Different Levels of Detail for Transparent Recommendation: A User Study. In Adjunct Proceedings of the 30th ACM Conference on User Modeling, Adaptation and Personalization; 2022; pp. 175–183. [Google Scholar] [CrossRef]
- Guidotti, R.; Monreale, A.; Ruggieri, S.; Turini, F.; Pedreschi, D.; Giannotti, F. A Survey Of Methods For Explaining Black Box Models. ACM Computing Surveys 2018, 51(5). Available online: http://arxiv.org/abs/1802.01933. [CrossRef]
- *Guo, L.; Daly, E. M.; Alkan, O.; Mattetti, M.; Cornec, O.; Knijnenburg, B. Building Trust in Interactive Machine Learning via User Contributed Interpretable Rules. In 27th International Conference on Intelligent User Interfaces; 2022; pp. 537–548. [Google Scholar] [CrossRef]
- *Ha, T.; Kim, S. Improving Trust in AI with Mitigating Confirmation Bias: Effects of Explanation Type and Debiasing Strategy for Decision-Making with Explainable AI. International Journal of Human–Computer Interaction 2023, 40. [Google Scholar] [CrossRef]
- *Ha, T.; Sah, Y. J.; Park, Y.; Lee, S. Examining the effects of power status of an explainable artificial intelligence system on users’ perceptions. Behaviour & Information Technology 2022, 41(5), 946–958. [Google Scholar] [CrossRef]
- *Hadash, S.; Willemsen, M. C.; Snijders, C.; IJsselsteijn, W. A. Improving understandability of feature contributions in model-agnostic explainable AI tools. In CHI Conference on Human Factors in Computing Systems; 2022; pp. 1–9. [Google Scholar] [CrossRef]
- Haque, A. B.; Islam, A. K. M. N.; Mikalef, P. Explainable Artificial Intelligence (XAI) from a user perspective: A synthesis of prior literature and problematizing avenues for future research. Technological Forecasting and Social Change 2023, 186, 122120. [Google Scholar] [CrossRef]
- Hart, S.; Staveland, L. Development of NASA-TLX (Task Load Index): Results of Empirical and Theoretical Research. In Human Mental Workload; Hancock, P., Meshkati, N., Eds.; 1988; pp. 139–183. [Google Scholar]
- *Hasanah, A. U.; Kusumo, D. S. User-Centric Evaluation of Novelty and Explanation Aspects of Recommender Systems in an Indonesia E-commerce Platform Based on Perceived Usefulness. 2024 2nd International Conference on Software Engineering and Information Technology (ICoSEIT); 2024; pp. 70–75. [Google Scholar] [CrossRef]
- *Hermann, J.; Nierobisch, N.; Arndt, R.; Kubullek, A.-K.; Van Ledden, S.; Dogangün, A. The Impact of Explanation Detail in Advanced Driver Assistance Systems: User Experience, Acceptance, and Age-Related Effects. In Mensch Und Computer 2023; 2023; pp. 307–312. [Google Scholar] [CrossRef]
- *Hernandez-Bocanegra, D. C.; Ziegler, J. Argumentative explanations for recommendations - Effect of display style and profile transparency. In Mensch Und Computer 2020 - Workshopband; 2020. [Google Scholar] [CrossRef]
- *Hernandez-Bocanegra, D. C.; Ziegler, J. Effects of Interactivity and Presentation on Review-Based Explanations for Recommendations. In Lecture Notes in Computer Science (including subseries Lecture Notes in Artificial Intelligence and Lecture Notes in Bioinformatics): 12933 LNCS; Springer Science and Business Media Deutschland GmbH, 2021a; pp. 597–618. [Google Scholar] [CrossRef]
- *Hernandez-Bocanegra, D. C.; Ziegler, J. Explaining Review-Based Recommendations: Effects of Profile Transparency, Presentation Style and User Characteristics. I-Com 2021b, 19(3), 181–200. [Google Scholar] [CrossRef]
- *Hernandez-Bocanegra, D. C.; Ziegler, J. Explaining Recommendations through Conversations: Dialog Model and the Effects of Interface Type and Degree of Interactivity. ACM Transactions on Interactive Intelligent Systems 2023, 13(2), 1–47. [Google Scholar] [CrossRef]
- *Heuer, H.; Breiter, A. More Than Accuracy: Towards Trustworthy Machine Learning Interfaces for Object Recognition. In Proceedings of the 28th ACM Conference on User Modeling, Adaptation and Personalization; 2020; pp. 298–302. [Google Scholar] [CrossRef]
- *Hindennach, S.; Shi, L.; Miletić, F.; Bulling, A. Mindful Explanations: Prevalence and Impact of Mind Attribution in XAI Research. Proceedings of the ACM on Human-Computer Interaction 2024, 8(CSCW1), 1–43. [Google Scholar] [CrossRef]
- Hoffman, R. R.; Mueller, S. T.; Klein, G.; Litman, J. Metrics for Explainable AI: Challenges and Prospects . 2018. Available online: http://arxiv.org/abs/1812.04608.
- Holzinger, A.; Carrington, A.; Müller, H. Measuring the Quality of Explanations: The System Causability Scale (SCS): Comparing Human and Machine Explanations. KI - Kunstliche Intelligenz 2020, 34(2), 193–198. [Google Scholar] [CrossRef] [PubMed]
- Hong, Q. N.; Fàbregues, S.; Bartlett, G.; Boardman, F.; Cargo, M.; Dagenais, P.; Gagnon, M.-P.; Griffiths, F.; Nicolau, B.; O’Cathain, A.; Rousseau, M.-C.; Vedel, I.; Pluye, P. The Mixed Methods Appraisal Tool (MMAT) version 2018 for information professionals and researchers. Education for Information 2018, 34(4), 285–291. [Google Scholar] [CrossRef]
- Hong, S.; Park, W. Developing user-centered system design guidelines for explainable AI: a systematic literature review. Artificial Intelligence Review 2025, 58(12). [Google Scholar] [CrossRef]
- *Hou, T.-Y.; Tseng, Y.-C.; Yuan, C. W.; Tina. Is this AI sexist? The effects of a biased AI’s anthropomorphic appearance and explainability on users’ bias perceptions and trust. International Journal of Information Management 2024, 76, 102775. [Google Scholar] [CrossRef]
- *Huber, T.; Weitz, K.; André, E.; Amir, O. Local and global explanations of agent behavior: Integrating strategy summaries with saliency maps. Artificial Intelligence 2021, 301, 103571. [Google Scholar] [CrossRef]
- *Hudon, A.; Demazure, T.; Karran, A.; Léger, P.-M.; Sénécal, S. Explainable Artificial Intelligence (XAI): How the Visualization of AI Predictions Affects User Cognitive Load and Confidence. In Lecture Notes in Information Systems and Organisation: 52 LNISO; Springer Science and Business Media Deutschland GmbH, 2021; pp. 237–246. [Google Scholar] [CrossRef]
- *Ibrahim, L.; Ghassemi, M. M.; Alhanai, T. Do Explanations Improve the Quality of AI-assisted Human Decisions? An Algorithm-in-the-Loop Analysis of Factual & Counterfactual Explanations. Proceedings of the 2023 International Conference on Autonomous Agents and Multiagent Systems 2023, 9, 326–334. Available online: www.ifaamas.org. [CrossRef]
- Islam, M. R.; Ahmed, M. U.; Barua, S.; Begum, S. A Systematic Review of Explainable Artificial Intelligence in Terms of Different Application Domains and Tasks. Applied Sciences 2022, 12(3), 1353. [Google Scholar] [CrossRef]
- *Jakubik, J.; Schöffer, J.; Hoge, V.; Vössing, M.; Kühl, N. An Empirical Evaluation of Predicted Outcomes as Explanations in Human-AI Decision-Making. In Communications in Computer and Information Science: 1752 CCIS; Springer Science and Business Media Deutschland GmbH, 2023; pp. 353–368. [Google Scholar] [CrossRef]
- *Jalali, A.; Haslhofer, B.; Kriglstein, S.; Rauber, A. Predictability and Comprehensibility in Post-Hoc XAI Methods: A User-Centered Analysis. In Lecture Notes in Networks and Systems: 711 LNNS; Springer Science and Business Media Deutschland GmbH, 2023; pp. 712–733. [Google Scholar] [CrossRef]
- *Jansen, A.; Leborgne, F.; Wang, Q.; Zhang, C. Contextualizing the “Why”: The Potential of Using Visual Map As a Novel XAI Method for Users with Low AI-literacy. Extended Abstracts of the CHI Conference on Human Factors in Computing Systems 2024, 1–7. [Google Scholar] [CrossRef]
- *Jesus, S.; Belém, C.; Balayan, V.; Bento, J.; Saleiro, P.; Bizarro, P.; Gama, J. How can I choose an explainer? In Proceedings of the 2021 ACM Conference on Fairness, Accountability, and Transparency; 2021; pp. 805–815. [Google Scholar] [CrossRef]
- Jian, J.-Y.; Bisantz, A. M.; Drury, C. G. Foundations for an Empirically Determined Scale of Trust in Automated Systems. International Journal of Cognitive Ergonomics 2000, 4(1), 53–71. [Google Scholar] [CrossRef] [PubMed]
- Jin, W.; Fan, J.; Gromala, D.; Pasquier, P.; Hamarneh, G. EUCA: the End-User-Centered Explainable AI Framework . 2022. Available online: https://arxiv.org/abs/2102.02437.
- Johs, A. J.; Agosto, D. E.; Weber, R. O. Explainable artificial intelligence and social science: Further insights for qualitative investigation. Applied AI Letters 2022, 3(1). [Google Scholar] [CrossRef]
- *Karran, A. J.; Demazure, T.; Hudon, A.; Senecal, S.; Léger, P.-M. Designing for Confidence: The Impact of Visualizing Artificial Intelligence Decisions. Frontiers in Neuroscience 2022, 16. [Google Scholar] [CrossRef] [PubMed]
- *Kaur, H.; Nori, H.; Jenkins, S.; Caruana, R.; Wallach, H.; Wortman Vaughan, J. Interpreting Interpretability: Understanding Data Scientists’ Use of Interpretability Tools for Machine Learning. In Proceedings of the 2020 CHI Conference on Human Factors in Computing Systems; 2020; pp. 1–14. [Google Scholar] [CrossRef]
- *Kenny, E. M.; Delaney, E.; Keane, M. T. Advancing Post-Hoc Case-Based Explanation with Feature Highlighting. In Proceedings of the Thirty-Second International Joint Conference on Artificial Intelligence; 2023; pp. 427–435. [Google Scholar] [CrossRef]
- *Khurana, A.; Alamzadeh, P.; Chilana, P. K. ChatrEx: Designing Explainable Chatbot Interfaces for Enhancing Usefulness, Transparency, and Trust. In 2021 IEEE Symposium on Visual Languages and Human-Centric Computing (VL/HCC); 2021; pp. 1–11. [Google Scholar] [CrossRef]
- Kim, B.; Khanna, R.; Koyejo, O. O. Examples are not enough, learn to criticize! Criticism for Interpretability. In Advances in Neural Information Processing Systems; Lee, D., Sugiyama, M., Luxburg, U., Guyon, I., Garnett, R., Eds.; Curran Associates, Inc., 2016; Vol. 29, Available online: https://proceedings.neurips.cc/paper_files/paper/2016/file/5680522b8e2bb01943234bce7bf84534-Paper.pdf.
- Kim, J.; Maathuis, H.; Sent, D. Human-centered evaluation of explainable AI applications: a systematic review. Frontiers in Artificial Intelligence 2024, 7. [Google Scholar] [CrossRef] [PubMed]
- Kim, M.-Y.; Atakishiyev, S.; Babiker, H. K. B.; Farruque, N.; Goebel, R.; Zaïane, O. R.; Motallebi, M.-H.; Rabelo, J.; Syed, T.; Yao, H.; Chun, P. A Multi-Component Framework for the Analysis and Design of Explainable Artificial Intelligence. Machine Learning and Knowledge Extraction 2021, 3(4), 900–921. [Google Scholar] [CrossRef]
- *Kim, S. S. Y.; Watkins, E. A.; Russakovsky, O.; Fong, R.; Monroy-Hernández, A. “Help Me Help the AI”: Understanding How Explainability Can Support Human-AI Interaction. In Proceedings of the 2023 CHI Conference on Human Factors in Computing Systems; 2023; pp. 1–17. [Google Scholar] [CrossRef]
- Klein, L.; Lüth, C.; Schlegel, U.; Bungert, T.; El-Assady, M.; Jäger, P. Navigating the Maze of Explainable AI: A Systematic Approach to Evaluating Methods and Metrics. Advances in Neural Information Processing Systems 37 2024, 67106–67146. [Google Scholar] [CrossRef]
- *Kleinerman, A.; Rosenfeld, A.; Kraus, S. Providing explanations for recommendations in reciprocal environments. In Proceedings of the 12th ACM Conference on Recommender Systems; 2018; pp. 22–30. [Google Scholar] [CrossRef]
- *Knapič, S.; Malhi, A.; Saluja, R.; Främling, K. Explainable Artificial Intelligence for Human Decision Support System in the Medical Domain. Machine Learning and Knowledge Extraction 2021, 3(3), 740–770. [Google Scholar] [CrossRef]
- Koh, P. W.; Liang, P. Understanding black-box predictions via influence functions. Proceedings of the 34th International Conference on Machine Learning - 2017, Volume 70, 1885–1894. [Google Scholar]
- *Kouki, P.; Schaffer, J.; Pujara, J.; O’Donovan, J.; Getoor, L. Personalized explanations for hybrid recommender systems. In Proceedings of the 24th International Conference on Intelligent User Interfaces, Part F147615; 2019; pp. 379–390. [Google Scholar] [CrossRef]
- *Kouki, P.; Schaffer, J.; Pujara, J.; O’Donovan, J.; Getoor, L. Generating and Understanding Personalized Explanations in Hybrid Recommender Systems. ACM Transactions on Interactive Intelligent Systems 2020, 10(4), 1–40. [Google Scholar] [CrossRef]
- *Kuhl, U.; Artelt, A.; Hammer, B. For Better or Worse: The Impact of Counterfactual Explanations’ Directionality on User Behavior in xAI. In Communications in Computer and Information Science: 1903 CCIS; Springer Science and Business Media Deutschland GmbH, 2023; pp. 280–300. [Google Scholar] [CrossRef]
- Kulesza, T.; Stumpf, S.; Burnett, M.; Kwan, I. Tell me more? The Effects of Mental Model Soundness on Personalizing an Intelligent Agent. In Proceedings of the SIGCHI Conference on Human Factors in Computing Systems; 2012; pp. 1–10. [Google Scholar] [CrossRef]
- *Kumar, A.; Vasileiou, S. L.; Bancilhon, M.; Ottley, A.; Yeoh, W. VizXP: A Visualization Framework for Conveying Explanations to Users in Model Reconciliation Problems. Proceedings of the International Conference on Automated Planning and Scheduling 2022, 32, 701–709. [Google Scholar] [CrossRef]
- Laato, S.; Tiainen, M.; Najmul Islam, A. K. M.; Mäntymäki, M. How to explain AI systems to end users: a systematic literature review and research agenda. Internet Research 2022, 32(7), 1–31. [Google Scholar] [CrossRef]
- *Larasati, R.; De Liddo, A.; Motta, E. The Effect of Explanation Styles on User’s Trust. Proceedings of IUI Workshop on Explainable Smart Systems and Algorithmic Transparency in Emerging Technologies (ExSSATEC’ 20); 2020; 6. [Google Scholar]
- *Le, T.; Miller, T.; Singh, R.; Sonenberg, L. Explaining Model Confidence Using Counterfactuals. Proceedings of the AAAI Conference on Artificial Intelligence 2023, 37(10), 11856–11864. [Google Scholar] [CrossRef]
- *Le, T.; Wang, S.; Lee, D. GRACE: Generating Concise and Informative Contrastive Sample to Explain Neural Network Model’s Prediction. In Proceedings of the 26th ACM SIGKDD International Conference on Knowledge Discovery & Data Mining; 2020; pp. 238–248. [Google Scholar] [CrossRef]
- Liao, Q. V.; Gruen, D.; Miller, S. Questioning the AI: Informing Design Practices for Explainable AI User Experiences. In Proceedings of the 2020 CHI Conference on Human Factors in Computing Systems; 2020; pp. 1–15. [Google Scholar] [CrossRef]
- Liao, Q. V.; Pribić, M.; Han, J.; Miller, S.; Sow, D. Question-Driven Design Process for Explainable AI User Experiences . 2021. Available online: http://arxiv.org/abs/2104.03483.
- Lim, B. Y.; Dey, A. K. Toolkit to support intelligibility in context-aware applications. In Proceedings of the 12th ACM International Conference on Ubiquitous Computing; 2010; pp. 13–22. [Google Scholar] [CrossRef]
- *Lim, B. Y.; Dey, A. K.; Avrahami, D. Why and why not explanations improve the intelligibility of context-aware intelligent systems. In Proceedings of the SIGCHI Conference on Human Factors in Computing Systems; 2009; pp. 2119–2128. [Google Scholar] [CrossRef]
- *Linder, R.; Mohseni, S.; Yang, F.; Pentyala, S. K.; Ragan, E. D.; Hu, X. Ben. How level of explanation detail affects human performance in interpretable intelligent systems: A study on explainable fact checking. Applied AI Letters 2021, 2(4). [Google Scholar] [CrossRef]
- Lipton, Z. C. The mythos of model interpretability. Communications of the ACM 2018, 61(10), 36–43. [Google Scholar] [CrossRef]
- *Liu, T.; McCalmon, J.; Le, T.; Rahman, M. A.; Lee, D.; Alqahtani, S. A novel policy-graph approach with natural language and counterfactual abstractions for explaining reinforcement learning agents. Autonomous Agents and Multi-Agent Systems 2023, 37(2), 34. [Google Scholar] [CrossRef]
- *Liu, W.; Wang, Y. Evaluating Trust in Recommender Systems: A User Study on the Impacts of Explanations, Agency Attribution, and Product Types. International Journal of Human–Computer Interaction 2025, 41(2), 1280–1292. [Google Scholar] [CrossRef]
- *Lu, H.; Ma, W.; Wang, Y.; Zhang, M.; Wang, X.; Liu, Y.; Chua, T.-S.; Ma, S. User Perception of Recommendation Explanation: Are Your Explanations What Users Need? ACM Transactions on Information Systems 2023, 41(2), 1–31. [Google Scholar] [CrossRef]
- Lundberg, S. M.; Lee, S.-I. A unified approach to interpreting model predictions. In Proceedings of the 31st International Conference on Neural Information Processing Systems NIPS’17; 2017; pp. 4768–4777. [Google Scholar]
- Maehigashi, A.; Fukuchi, Y.; Yamada, S. Empirical investigation of how robot’s pointing gesture influences trust in and acceptance of heatmap-based XAI. 2023 32nd IEEE International Conference on Robot and Human Interactive Communication (RO-MAN); 2023a; pp. 2134–2139. [Google Scholar] [CrossRef]
- *Maehigashi, A.; Fukuchi, Y.; Yamada, S. Experimental Investigation of Human Acceptance of AI Suggestions with Heatmap and Pointing-based XAI. In International Conference on Human-Agent Interaction; 2023b; pp. 291–298. [Google Scholar] [CrossRef]
- *Malhi, A.; Knapic, S.; Främling, K. Explainable Agents for Less Bias in Human-Agent Decision Making. In Lecture Notes in Computer Science (including subseries Lecture Notes in Artificial Intelligence and Lecture Notes in Bioinformatics); Springer, 2020; pp. 12175 LNAI (pp. 129–146. [Google Scholar] [CrossRef]
- Markus, A. F.; Kors, J. A.; Rijnbeek, P. R. The role of explainability in creating trustworthy artificial intelligence for health care: A comprehensive survey of the terminology, design choices, and evaluation strategies. Journal of Biomedical Informatics 2021, 113, 103655. [Google Scholar] [CrossRef] [PubMed]
- *Martijn, M.; Conati, C.; Verbert, K. “Knowing me, knowing you”: personalized explanations for a music recommender system. User Modeling and User-Adapted Interaction 2022, 32(1–2), 215–252. [Google Scholar] [CrossRef]
- *Maruf, S.; Zukerman, I.; Reiter, E.; Haffari, G. Influence of context on users’ views about explanations for decision-tree predictions. Computer Speech & Language 2023, 81, 101483. [Google Scholar] [CrossRef]
- Matarese, M.; Cocchella, F.; Rea, F.; Sciutti, A. Ex(plainable) Machina: how social-implicit XAI affects complex human-robot teaming tasks. 2023 IEEE International Conference on Robotics and Automation (ICRA), -May; 2023; pp. 11986–11993. [Google Scholar] [CrossRef]
- *Mccalmone, J.; Le, T.; Alqahtani, S.; Lee, D. CAPS: Comprehensible Abstract Policy Summaries for Explaining Reinforcement Learning Agents. In Proceedings of the 21st International Conference on Autonomous Agents and Multiagent Systems; 2022; p. 889. Available online: https://github.com/mccajl/CAPS.
- McKnight, D. H.; Choudhury, V.; Kacmar, C. Developing and Validating Trust Measures for e-Commerce: An Integrative Typology. Information Systems Research 2002, 13(3), 334–359. [Google Scholar] [CrossRef]
- *Mehrotra, S.; Jorge, C. C.; Jonker, C. M.; Tielman, M. L. Integrity-based Explanations for Fostering Appropriate Trust in AI Agents. ACM Transactions on Interactive Intelligent Systems 2024, 14(1), 1–36. [Google Scholar] [CrossRef]
- *Melsion, G. I.; Stower, R.; Winkle, K.; Leite, I. What’s at Stake? Robot explanations matter for high but not low-stake scenarios. 2023 32nd IEEE International Conference on Robot and Human Interactive Communication (RO-MAN); 2023; pp. 2421–2426. [Google Scholar] [CrossRef]
- *Mertes, S.; Huber, T.; Weitz, K.; Heimerl, A.; André, E. GANterfactual—Counterfactual Explanations for Medical Non-experts Using Generative Adversarial Learning. Frontiers in Artificial Intelligence 2022, 5. [Google Scholar] [CrossRef] [PubMed]
- Miller, T. Explanation in artificial intelligence: Insights from the social sciences. Artificial Intelligence 2019, 267, 1–38. [Google Scholar] [CrossRef]
- Molnar, C. Interpretable Machine Learning: A Guide for Making Black Box Models Explainable, 3rd ed.; 2025; Available online: http://leanpub.com/interpretable-machine-learning.
- *Morrison, K.; Jain, M.; Hammer, J.; Perer, A. Eye into AI: Evaluating the Interpretability of Explainable AI Techniques through a Game with a Purpose. Proceedings of the ACM on Human-Computer Interaction 2023, 7(CSCW2), 1–22. [Google Scholar] [CrossRef]
- *Morrison, K.; Spitzer, P.; Turri, V.; Feng, M.; Kühl, N.; Perer, A. The Impact of Imperfect XAI on Human-AI Decision-Making. Proceedings of the ACM on Human-Computer Interaction 2024, 8(CSCW1), 1–39. [Google Scholar] [CrossRef]
- Mueller, S. T.; Veinott, E. S.; Hoffman, R. R.; Klein, G.; Alam, L.; Mamun, T.; Clancey, W. J. Principles of Explanation in Human-AI Systems; 2021; Available online: http://arxiv.org/abs/2102.04972.
- *Mukhtar, A.; Hofer, B.; Jannach, D.; Wotawa, F. Explaining software fault predictions to spreadsheet users. Journal of Systems and Software 2023, 201, 111676. [Google Scholar] [CrossRef]
- *Naiseh, M.; Al-Thani, D.; Jiang, N.; Ali, R. How the different explanation classes impact trust calibration: The case of clinical decision support systems. International Journal of Human-Computer Studies 2023, 169, 102941. [Google Scholar] [CrossRef]
- Nauta, M.; Trienes, J.; Pathak, S.; Nguyen, E.; Peters, M.; Schmitt, Y.; Schlötterer, J.; Van Keulen, M.; Seifert, C. From Anecdotal Evidence to Quantitative Evaluation Methods: A Systematic Review on Evaluating Explainable AI. ACM Computing Surveys 2023, 55(13). [Google Scholar] [CrossRef]
- *Naveed, S.; Donkers, T.; Ziegler, J. Argumentation-Based Explanations in Recommender Systems. In Adjunct Publication of the 26th Conference on User Modeling, Adaptation and Personalization; 2018; pp. 293–298. [Google Scholar] [CrossRef]
- Ouzzani, M.; Hammady, H.; Fedorowicz, Z.; Elmagarmid, A. Rayyan—a web and mobile app for systematic reviews. Systematic Reviews 2016, 5(1), 210. [Google Scholar] [CrossRef] [PubMed]
- Paas, F. G. W. C. Training strategies for attaining transfer of problem-solving skill in statistics: A cognitive-load approach. Journal of Educational Psychology 1992, 84(4), 429–434. [Google Scholar] [CrossRef]
- *Pafla, M.; Larson, K.; Hancock, M. Unraveling the Dilemma of AI Errors: Exploring the Effectiveness of Human and Machine Explanations for Large Language Models. In Proceedings of the CHI Conference on Human Factors in Computing Systems; 2024; pp. 1–20. [Google Scholar] [CrossRef]
- *Papenmeier, A.; Kern, D.; Englebienne, G.; Seifert, C. It’s Complicated: The Relationship between User Trust, Model Accuracy and Explanations in AI. ACM Transactions on Computer-Human Interaction 2022, 29(4), 1–33. [Google Scholar] [CrossRef]
- *Perlmutter, M.; Gifford, R.; Krening, S. Impact of example-based XAI for neural networks on trust, understanding, and performance. International Journal of Human-Computer Studies 2024, 188, 103277. [Google Scholar] [CrossRef]
- *Pierson, B. D.; Arendt, D.; Miller, J.; Taylor, M. E. Comparing explanations in RL. Neural Computing and Applications 2024, 36(1), 505–516. [Google Scholar] [CrossRef]
- *Prabhudesai, S.; Yang, L.; Asthana, S.; Huan, X.; Liao, Q. V.; Banovic, N. Understanding Uncertainty: How Lay Decision-makers Perceive and Interpret Uncertainty in Human-AI Decision Making. In Proceedings of the 28th International Conference on Intelligent User Interfaces; 2023; pp. 379–396. [Google Scholar] [CrossRef]
- *Pu, P.; Chen, L. Trust-inspiring explanation interfaces for recommender systems. Knowledge-Based Systems 2007, 20(6), 542–556. [Google Scholar] [CrossRef]
- Pu, P.; Chen, L.; Hu, R. A user-centric evaluation framework for recommender systems. In Proceedings of the Fifth ACM Conference on Recommender Systems; 2011; pp. 157–164. [Google Scholar] [CrossRef]
- *Qu, J.; Arguello, J.; Wang, Y. A Study of Explainability Features to Scrutinize Faceted Filtering Results. In Proceedings of the 30th ACM International Conference on Information & Knowledge Management; 2021; pp. 1498–1507. [Google Scholar] [CrossRef]
- *Radensky, M.; Downey, D.; Lo, K.; Popovic, Z.; Weld, D. S. Exploring the Role of Local and Global Explanations in Recommender Systems. In CHI Conference on Human Factors in Computing Systems Extended Abstracts; 2022; pp. 1–7. [Google Scholar] [CrossRef]
- *Rago, A.; Cocarascu, O.; Bechlivanidis, C.; Lagnado, D.; Toni, F. Argumentative explanations for interactive recommendations. Artificial Intelligence 2021, 296, 103506. [Google Scholar] [CrossRef]
- Ribeiro, M. T.; Singh, S.; Guestrin, C. Why Should I Trust You? In Proceedings of the 22nd ACM SIGKDD International Conference on Knowledge Discovery and Data Mining; 2016; pp. 1135–1144. [Google Scholar] [CrossRef]
- *Ribeiro, M. T.; Singh, S.; Guestrin, C. Anchors: High-Precision Model-Agnostic Explanations. Proceedings of the AAAI Conference on Artificial Intelligence 2018, 32(1). [Google Scholar] [CrossRef]
- *Ribes, D.; Henchoz, N.; Portier, H.; Defayes, L.; Phan, T.-T.; Gatica-Perez, D.; Sonderegger, A. Trust Indicators and Explainable AI: A Study on User Perceptions. In Human-Computer Interaction – INTERACT 2021. INTERACT 2021. Lecture Notes in Computer Science(); Ardito, C., Ed.; Springer, 2021; Vol. 12933, pp. 662–671. [Google Scholar] [CrossRef]
- *Riveiro, M.; Thill, S. “That’s (not) the output I expected!” On the role of end user expectations in creating explanations of AI systems. Artificial Intelligence 2021, 298, 103507. [Google Scholar] [CrossRef]
- *Riveiro, M.; Thill, S. The challenges of providing explanations of AI systems when they do not behave like users expect. In Proceedings of the 30th ACM Conference on User Modeling, Adaptation and Personalization; 2022; pp. 110–120. [Google Scholar] [CrossRef]
- Rizzo, M.; Veneri, A.; Albarelli, A.; Lucchese, C.; Nobile, M.; Conati, C. A Theoretical Framework for AI Models Explainability with Application in Biomedicine . 2023. Available online: http://arxiv.org/abs/2212.14447.
- *Robbemond, V.; Inel, O.; Gadiraju, U. Understanding the Role of Explanation Modality in AI-assisted Decision-making. In Proceedings of the 30th ACM Conference on User Modeling, Adaptation and Personalization; 2022; pp. 223–233. [Google Scholar] [CrossRef]
- *Robertson, J.; Kokkinakis, A. V.; Hook, J.; Kirman, B.; Block, F.; Ursu, M. F.; Patra, S.; Demediuk, S.; Drachen, A.; Olarewaju, O. Wait, But Why?: Assessing Behavior Explanation Strategies for Real-Time Strategy Games. In 26th International Conference on Intelligent User Interfaces; 2021; pp. 32–42. [Google Scholar] [CrossRef]
- *Robrecht, A. S.; Rothgänger, M.; Kopp, S. A Study on the Benefits and Drawbacks of Adaptivity in AI-generated Explanations. In Proceedings of the 23rd ACM International Conference on Intelligent Virtual Agents; 2023; pp. 1–8. [Google Scholar] [CrossRef]
- Ronckers, M.; Conijn, R.; Snijders, C. Comparing Implementations of Explainable Artificial Intelligence using End-User Evaluations: Protocol for a Systematic Review; Protocols.Io., 2024. [Google Scholar] [CrossRef] [PubMed]
- Rong, Y.; Leemann, T.; Nguyen, T. T.; Fiedler, L.; Qian, P.; Unhelkar, V.; Seidel, T.; Kasneci, G.; Kasneci, E. Towards Human-Centered Explainable AI: A Survey of User Studies for Model Explanations. IEEE Transactions on Pattern Analysis and Machine Intelligence 2024, 46(4), 2104–2122. [Google Scholar] [CrossRef] [PubMed]
- Rosenfeld, A.; Richardson, A. Explainability in human–agent systems. Autonomous Agents and Multi-Agent Systems 2019, 33(6), 673–705. [Google Scholar] [CrossRef]
- Samek, W.; Müller, K.-R. Towards Explainable Artificial Intelligence. In Lecture Notes in Computer Science (including subseries Lecture Notes in Artificial Intelligence and Lecture Notes in Bioinformatics): 11700 LNCS; Springer Verlag, 2019; pp. 5–22. [Google Scholar] [CrossRef]
- *Sanneman, L.; Shah, J. A. An Empirical Study of Reward Explanations With Human-Robot Interaction Applications. IEEE Robotics and Automation Letters 2022, 7(4), 8956–8963. [Google Scholar] [CrossRef]
- *Sato, M.; Ahsan, B.; Nagatani, K.; Sonoda, T.; Zhang, Q.; Ohkuma, T. Explaining Recommendations Using Contexts. In 23rd International Conference on Intelligent User Interfaces; 2018; pp. 659–664. [Google Scholar] [CrossRef]
- *Sato, M.; Nagatani, K.; Sonoda, T.; Zhang, Q.; Ohkuma, T. Context Style Explanation for Recommender Systems. Journal of Information Processing 2019, 27(0), 720–729. [Google Scholar] [CrossRef]
- *Scharowski, N.; Perrig, S. A. C.; Svab, M.; Opwis, K.; Brühlmann, F. Exploring the effects of human-centered AI explanations on trust and reliance. Frontiers in Computer Science 2023, 5. [Google Scholar] [CrossRef]
- *Scheers, H.; De Laet, T. Interactive and Explainable Advising Dashboard Opens the Black Box of Student Success Prediction. In T. De Laet, R. Klemke, C. Alario-Hoyos, I. Hilliger, & A. Ortega-Arranz (Eds.). In Technology-Enhanced Learning for a Free, Safe, and Sustainable World. EC-TEL 2021 Lecture Notes in Computer Science(); Springer, 2021; Vol. 12884, pp. 52–66. [Google Scholar] [CrossRef]
- Schemmer, M.; Hemmer, P.; Nitsche, M.; Kühl, N.; Vössing, M. A Meta-Analysis of the Utility of Explainable Artificial Intelligence in Human-AI Decision-Making. In Proceedings of the 2022 AAAI/ACM Conference on AI, Ethics, and Society; 2022; pp. 617–626. [Google Scholar] [CrossRef]
- *Schmude, T.; Koesten, L.; Möller, T.; Tschiatschek, S. On the Impact of Explanations on Understanding of Algorithmic Decision-Making. In 2023 ACM Conference on Fairness Accountability and Transparency; 2023; pp. 959–970. [Google Scholar] [CrossRef]
- Schrepp, M.; Hinderks, A.; Thomaschewski, J. Design and Evaluation of a Short Version of the User Experience Questionnaire (UEQ-S). International Journal of Interactive Multimedia and Artificial Intelligence 2017, 4(6), 103–108. [Google Scholar] [CrossRef]
- *Schulze-Weddige, S.; Zylowski, T. User Study on the Effects Explainable AI Visualizations on Non-experts. In Lecture Notes of the Institute for Computer Sciences, Social-Informatics and Telecommunications Engineering, LNICST: 422 LNICST; Springer Science and Business Media Deutschland GmbH, 2022; pp. 457–467. [Google Scholar] [CrossRef]
- *Septon, Y.; Huber, T.; André, E.; Amir, O. Integrating Policy Summaries with Reward Decomposition for Explaining Reinforcement Learning Agents. In Lecture Notes in Computer Science (including subseries Lecture Notes in Artificial Intelligence and Lecture Notes in Bioinformatics); Springer Science and Business Media Deutschland GmbH, 2023; pp. 13955 LNAI (pp. 320–332. [Google Scholar] [CrossRef]
- Shamseer, L.; Moher, D.; Clarke, M.; Ghersi, D.; Liberati, A.; Petticrew, M.; Shekelle, P.; Stewart, L. A. Preferred reporting items for systematic review and meta-analysis protocols (PRISMA-P) 2015: elaboration and explanation. BMJ 2015, 349(jan02 1), g7647–g7647. [Google Scholar] [CrossRef] [PubMed]
- Sheridan, H.; Murphy, E.; O’Sullivan, D. Human Centered Approaches and Taxonomies for Explainable Artificial Intelligence. Lecture Notes in Computer Science (Including Subseries Lecture Notes in Artificial Intelligence and Lecture Notes in Bioinformatics) 2024, 15382 LNCS, 144–163. [Google Scholar] [CrossRef]
- *Shulner-Tal, A.; Kuflik, T.; Kliger, D. Fairness, explainability and in-between: understanding the impact of different explanation methods on non-expert users’ perceptions of fairness toward an algorithmic system. Ethics and Information Technology 2022, 24(1), 2. [Google Scholar] [CrossRef]
- *Silva, A.; Schrum, M.; Hedlund-Botti, E.; Gopalan, N.; Gombolay, M. Explainable Artificial Intelligence: Evaluating the Objective and Subjective Impacts of xAI on Human-Agent Interaction. International Journal of Human–Computer Interaction 2023, 39(7), 1390–1404. [Google Scholar] [CrossRef]
- *Silva, A.; Tambwekar, P.; Schrum, M.; Gombolay, M. Towards Balancing Preference and Performance through Adaptive Personalized Explainability. In Proceedings of the 2024 ACM/IEEE International Conference on Human-Robot Interaction; 2024; pp. 658–668. [Google Scholar] [CrossRef]
- *Silva, Í.; Marinho, L.; Said, A.; Willemsen, M. C. Leveraging ChatGPT for Automated Human-centered Explanations in Recommender Systems. In Proceedings of the 29th International Conference on Intelligent User Interfaces; 2024; pp. 597–608. [Google Scholar] [CrossRef]
- *Singla, S.; Eslami, M.; Pollack, B.; Wallace, S.; Batmanghelich, K. Explaining the black-box smoothly—A counterfactual approach. Medical Image Analysis 2023, 84, 102721. [Google Scholar] [CrossRef] [PubMed]
- Sipos, L.; Schäfer, U.; Glinka, K.; Müller-Birn, C. Identifying Explanation Needs of End-users: Applying and Extending the XAI Question Bank. ACM International Conference Proceeding Series 2023, 492–497. [Google Scholar] [CrossRef]
- *Sivaprasad, A.; Reiter, E.; Tintarev, N.; Oren, N. Evaluation of Human-Understandability of Global Model Explanations Using Decision Tree. In Communications in Computer and Information Science; Springer Science and Business Media Deutschland GmbH, 2024; Vol. 1947, pp. 43–65. [Google Scholar] [CrossRef]
- Springer, A.; Whittaker, S. Progressive Disclosure: When, Why, and How Do Users Want Algorithmic Transparency Information? ACM Transactions on Interactive Intelligent Systems 2020, 10(4), 1–32. [Google Scholar] [CrossRef]
- *Srivastava, S.; Theune, M.; Catala, A. The Role of Lexical Alignment in Human Understanding of Explanations by Conversational Agents. In Proceedings of the 28th International Conference on Intelligent User Interfaces; 2023; pp. 423–435. [Google Scholar] [CrossRef]
- *Stepin, I.; Alonso-Moral, J. M.; Catala, A.; Pereira-Fariña, M. An empirical study on how humans appreciate automated counterfactual explanations which embrace imprecise information. Information Sciences 2022, 618, 379–399. [Google Scholar] [CrossRef]
- *Stites, M. C.; Nyre-Yu, M.; Moss, B.; Smutz, C.; Smith, M. R. Sage Advice? The Impacts of Explanations for Machine Learning Models on Human Decision-Making in Spam Detection. In Lecture Notes in Computer Science (including subseries Lecture Notes in Artificial Intelligence and Lecture Notes in Bioinformatics); Springer Science and Business Media Deutschland GmbH, 2021; pp. 12797 LNAI (pp. 269–284. [Google Scholar] [CrossRef]
- *Szymanski, M.; Abeele; Vanden, V.; Verbert, K. Explaining health recommendations to lay users: The dos and don’ts. In Joint Proceedings of the IUI 2022 Workshops: APEx-UI, HAI-GEN, HEALTHI, HUMANIZE, TExSS, SOCIALIZE Co-Located with the ACM International Conference on Intelligent User Interfaces (IUI 2022); 2022; pp. 1–10. Available online: http://ceur-ws.org.
- *Szymanski, M.; Millecamp, M.; Verbert, K. Visual, textual or hybrid: the effect of user expertise on different explanations. In 26th International Conference on Intelligent User Interfaces; 2021; pp. 109–119. [Google Scholar] [CrossRef]
- *Tintarev, N.; Masthoff, J. The Effectiveness of Personalized Movie Explanations: An Experiment Using Commercial Meta-data. In Adaptive Hypermedia and Adaptive Web-Based Systems; Springer Berlin Heidelberg, 2008; pp. 204–213. [Google Scholar] [CrossRef]
- *Tintarev, N.; Rostami, S.; Smyth, B. Knowing the unknown. In Proceedings of the 33rd Annual ACM Symposium on Applied Computing; 2018; pp. 1396–1399. [Google Scholar] [CrossRef]
- *Tran, T. N. T.; Atas, M.; Felfernig, A.; Le, V. M.; Samer, R.; Stettinger, M. Towards Social Choice-based Explanations in Group Recommender Systems. In Proceedings of the 27th ACM Conference on User Modeling, Adaptation and Personalization; 2019; pp. 13–21. [Google Scholar] [CrossRef]
- *Tran, T. N. T.; Atas, M.; Le, M.; Samer, R.; Stettinger, M. Social Choice-based Explanations: An Approach to Enhancing Fairness and Consensus Aspects. JUCS - Journal of Universal Computer Science 2020, 26(3), 402–431. [Google Scholar] [CrossRef]
- *Tsai, C.-H.; Brusilovsky, P. Designing Explanation Interfaces for Transparency and Beyond. Joint Proceedings Ofthe ACM IUI 2019 Workshops; 2019a; 11. Available online: https://digitalcommons.unomaha.edu/isqafacpubPleasetakeourfeedbacksurveyat:https://unomaha.az1.qualtrics.com/jfe/form/SV_8cchtFmpDyGfBLE.
- *Tsai, C.-H.; Brusilovsky, P. Evaluating Visual Explanations for Similarity-Based Recommendations. In Proceedings of the 27th ACM Conference on User Modeling, Adaptation and Personalization; 2019b; pp. 22–30. [Google Scholar] [CrossRef]
- *Tsai, C.-H.; You, Y.; Gui, X.; Kou, Y.; Carroll, J. M. Exploring and Promoting Diagnostic Transparency and Explainability in Online Symptom Checkers. In Proceedings of the 2021 CHI Conference on Human Factors in Computing Systems; 2021; pp. 1–17. [Google Scholar] [CrossRef]
- *Tsukuda, K.; Goto, M. Explainable Recommendation for Repeat Consumption. In Fourteenth ACM Conference on Recommender Systems; 2020; pp. 462–467. [Google Scholar] [CrossRef]
- Ullman, D.; Malle, B. F. Measuring Gains and Losses in Human-Robot Trust: Evidence for Differentiable Components of Trust. 2019 14th ACM/IEEE International Conference on Human-Robot Interaction (HRI); 2019; pp. 618–619. [Google Scholar] [CrossRef]
- *van der Waa, J.; Nieuwburg, E.; Cremers, A.; Neerincx, M. Evaluating XAI: A comparison of rule-based and example-based explanations. Artificial Intelligence 2021, 291, 103404. [Google Scholar] [CrossRef]
- Vieira, C. P.; Digiampietri, L. A. Machine Learning post-hoc interpretability: a systematic mapping study. In XVIII Brazilian Symposium on Information Systems; 2022; Volume Par F180474, pp. 1–8. [Google Scholar] [CrossRef]
- Vilone, G.; Longo, L. Notions of explainability and evaluation approaches for explainable artificial intelligence. Information Fusion 2021, 76, 89–106. [Google Scholar] [CrossRef]
- *Vilone, G.; Longo, L. A Novel Human-Centred Evaluation Approach and an Argument-Based Method for Explainable Artificial Intelligence. In IFIP Advances in Information and Communication Technology: 646 IFIP; Springer Science and Business Media Deutschland GmbH, 2022; pp. 447–460. [Google Scholar] [CrossRef]
- der *Waa, J. van; Schoonderwoerd, T.; van Diggelen, J.; Neerincx, M. Interpretable confidence measures for decision support systems. International Journal of Human-Computer Studies 2020, 144, 102493. [Google Scholar] [CrossRef]
- Wachter, S.; Mittelstadt, B.; Russell, C. Counterfactual explanations without opening the black box: Automated decisions and the GDPR. Harv. JL & Tech. 2017, 31, 841. [Google Scholar]
- *Wang, B.; Yuan, T.; Rau, P.-L. P. Effects of Explanation Strategy and Autonomy of Explainable AI on Human–AI Collaborative Decision-making. International Journal of Social Robotics 2024, 16(4), 791–810. [Google Scholar] [CrossRef]
- Wang, D.; Yang, Q.; Abdul, A.; Lim, B. Y. Designing Theory-Driven User-Centric Explainable AI. In Proceedings of the 2019 CHI Conference on Human Factors in Computing Systems; 2019; pp. 1–15. [Google Scholar] [CrossRef]
- *Wang, X.; Yin, M. Are Explanations Helpful? A Comparative Study of the Effects of Explanations in AI-Assisted Decision-Making. In 26th International Conference on Intelligent User Interfaces; 2021; pp. 318–328. [Google Scholar] [CrossRef]
- *Wang, X.; Yin, M. Effects of Explanations in AI-Assisted Decision Making: Principles and Comparisons. ACM Transactions on Interactive Intelligent Systems 2022, 12(4), 1–36. [Google Scholar] [CrossRef]
- *Warren, G.; Byrne, R. M. J.; Keane, M. T. Categorical and Continuous Features in Counterfactual Explanations of AI Systems. In Proceedings of the 28th International Conference on Intelligent User Interfaces; 2023; pp. 171–187. [Google Scholar] [CrossRef]
- *Warren, G.; Keane, M. T.; Byrne, R. M. J. Features of Explainability: How Users Understand Counterfactual and Causal Explanations for Categorical and Continuous Features in XAI. CEUR Workshop Proceedings; CEUR-WS, 2022; Vol. 2327. [Google Scholar]
- *Weitz, K.; Schiller, D.; Schlagowski, R.; Huber, T.; André, E. “Let me explain!”: exploring the potential of virtual agents in explainable AI interaction design. Journal on Multimodal User Interfaces 2021, 15(2), 87–98. [Google Scholar] [CrossRef]
- *Wibowo, A. T.; Siddharthan, A.; Masthoff, J.; Lin, C. Understanding how to Explain Package Recommendations in the Clothes Domain. In Proceedings of the 5th Joint Workshop on Interfaces and Human Decision Making for Recommender Systems; Brusilovsky, P., de Gemmis, M., Felfernig, A., Lops, P., O’Donovan, J., Semeraro, G., Willemsen, M. C., Eds.; CEUR-WS, 2018; pp. 74–78. [Google Scholar]
- *Wilkinson, D.; Alkan, Ö.; Liao, Q. V.; Mattetti, M.; Vejsbjerg, I.; Knijnenburg, B. P.; Daly, E. Why or Why Not? The Effect of Justification Styles on Chatbot Recommendations. ACM Transactions on Information Systems 2021, 39(4), 1–21. [Google Scholar] [CrossRef]
- *Woodcock, C.; Mittelstadt, B.; Busbridge, D.; Blank, G. The Impact of Explanations on Layperson Trust in Artificial Intelligence–Driven Symptom Checker Apps: Experimental Study. Journal of Medical Internet Research 2021, 23(11), e29386. [Google Scholar] [CrossRef] [PubMed]
- *Yang, F.; Huang, Z.; Scholtz, J.; Arendt, D. L. How do visual explanations foster end users’ appropriate trust in machine learning? In International Conference on Intelligent User Interfaces, Proceedings IUI; 2020; pp. 189–201. [Google Scholar] [CrossRef]
- *Yeh, C.; Cowit, N.; Howley, I. Designing for Student Understanding of Learning Analytics Algorithms. In Lecture Notes in Computer Science (including subseries Lecture Notes in Artificial Intelligence and Lecture Notes in Bioinformatics): 13916 LNAI; Springer Science and Business Media Deutschland GmbH, 2023; pp. 528–540. [Google Scholar] [CrossRef]
- *Zang, J.; Jeon, M. The Effects of Transparency and Reliability of In-Vehicle Intelligent Agents on Driver Perception, Takeover Performance, Workload and Situation Awareness in Conditionally Automated Vehicles. Multimodal Technologies and Interaction 2022, 6(9), 82. [Google Scholar] [CrossRef]
- *Zanker, M.; Schoberegger, M. Proceedings of the Joint Workshop on Interfaces and Human Decision Making in Recommender Systems. Joint Workshop on Interfaces and Human Decision Making in Recommender Systems 2014, Vol. 1253, 33–36. [Google Scholar]
- *Zhang, Z.; Chen, L.; Jiang, T.; Li, Y.; Li, L. Effects of Feature-Based Explanation and Its Output Modality on User Satisfaction With Service Recommender Systems. Frontiers in Big Data 2022, 5. [Google Scholar] [CrossRef] [PubMed]
[1] Supplementary materials will only be available after peer-review and publication. |
Figure 1.
Explanation Design Aspects from Technical to More Human-Centered.
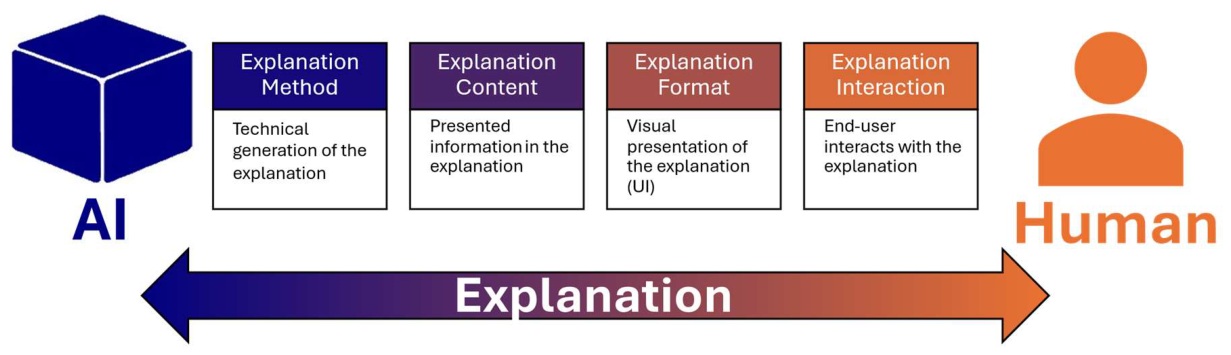
Figure 2.
Screening and Selection Process.
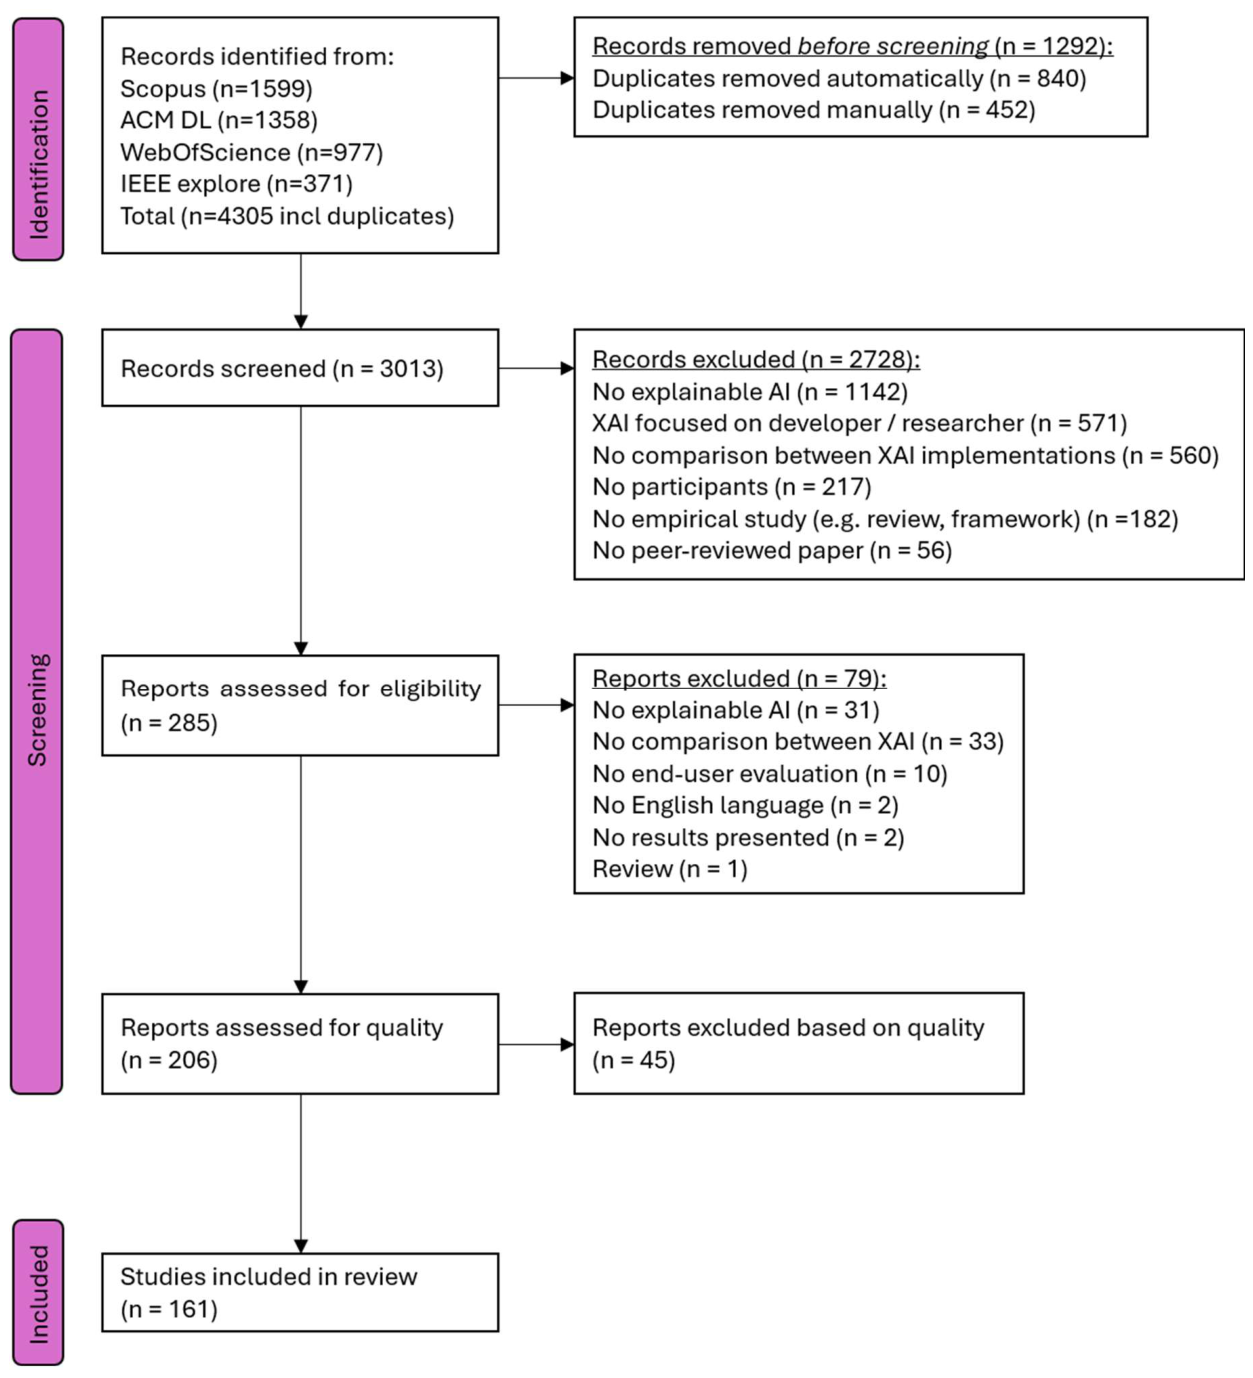
Figure 3.
Histogram of Publication Years.
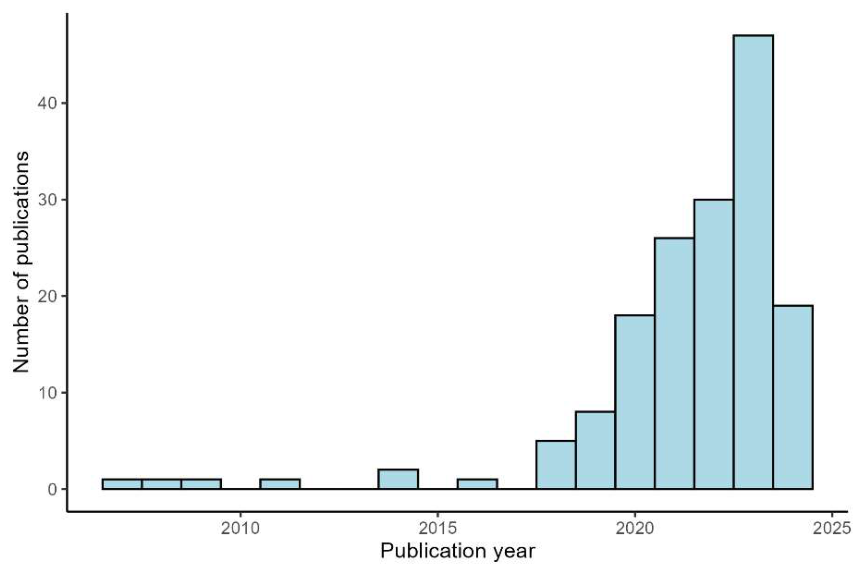

Table 1.
Keywords for the Search Query.
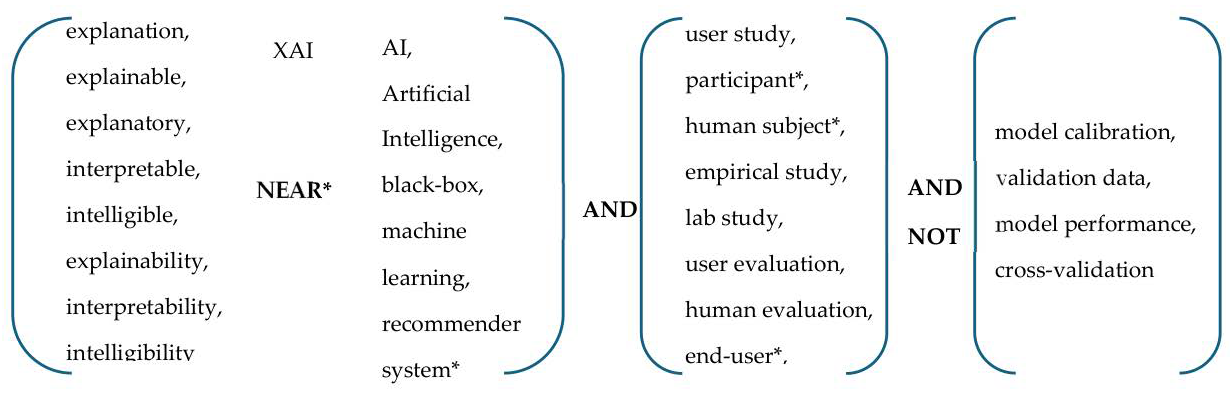
*The NEAR operator is used to check if terms appear within a 15-word distance.
Table 2.
Inclusion and Exclusion Criteria.
| Inclusion criteria | Exclusion criteria |
| Peer-reviewed, published papers Explainable AI and/or recommender systems Comparison between XAI implementations End-user involvement User evaluations (Active) human-AI interaction |
Reviews, frameworks, workshops, book chapters, editorials, and (opinion) statements Published in other languages than English Full text was unavailable, or only published in archive No active human-AI interaction (i.e. the user is unaware of interacting with an AI) |
Disclaimer/Publisher’s Note: The statements, opinions and data contained in all publications are solely those of the individual author(s) and contributor(s) and not of MDPI and/or the editor(s). MDPI and/or the editor(s) disclaim responsibility for any injury to people or property resulting from any ideas, methods, instructions or products referred to in the content. |
© 2026 by the authors. Licensee MDPI, Basel, Switzerland. This article is an open access article distributed under the terms and conditions of the Creative Commons Attribution (CC BY) license.
Copyright: This open access article is published under a Creative Commons CC BY 4.0 license, which permit the free download, distribution, and reuse, provided that the author and preprint are cited in any reuse.