
Submitted:
03 September 2026
Posted:
07 September 2026
You are already at the latest version
Abstract
The pollution of the shallow groundwater with nitrate (NO₃⁻) is considered as one of the problems concerning the water quality of semi-arid agricultural zones of northeastern Algeria. In this study, the physicochemical analysis of 80 groundwater samples was performed in order to characterize the hydrochemistry of the alluvial aquifer of the Garet Tarf plain in the Oum El Bouaghi wilaya, Algeria, and to estimate the degree of NO₃⁻ contamination. Twelve parameters were determined: the major ions HCO₃⁻, SO₄²⁻, Cl⁻, Ca²⁺, Mg²⁺, Na⁺, K⁺, and NO₃⁻; electrical conductivity (EC); pH; total dissolved solids (TDS); and a Water Quality Index (WQI). Nitrate concentrations vary in the range of 0 to 134 mg/L (mean concentration is 32.6 ± 27.7 mg/L); 18.8% of samples exceeded the WHO (2017) standard of 50 mg/L. Based on the results of piper diagrams, four hydrochemical facies were identified, including the dominance of Ca²⁺–SO₄²⁻ (46.3%) and Ca²⁺–HCO₃⁻ (27.5%), probably reflecting the effect of gypsum/anhydrite dissolution and carbonate weathering. The model based on the Random Forests® algorithm was used as an explorative method to determine which co-measured physicochemical parameters are most likely to be correlated with NO₃⁻ variability. The model demonstrated limited out-of-bag (OOB) R² performance of 16.36% (RMSE = 25.21 mg/L; MAD = 19.12 mg/L). One should consider this result with caution taking into account the limited number of data and predictor variables included. Random Forests® analysis revealed HCO₃⁻, Cl⁻, Ca²⁺, and Mg²⁺ as physicochemical parameters most strongly associated with NO₃⁻ variability within the evaluated dataset (OOB R² of the model is 16.36%). HCO₃⁻ is the first predictor in terms of variable importance (normalised value is 100%). It should be noted that this figure reflects the relative importance of HCO₃⁻ normalised to the most influential predictor. It means that HCO₃⁻ explains 100% of the nitrate variability. WQI values (mean is 53.4) indicate that the predominant quality of the water is poor due to geogenic mineralisation and, sometimes, due to nitrate content. These are different aspects of the water quality issue and cannot be mixed.
Keywords:
groundwater quality
; nitrate contamination
; hydrochemistry
; random forests
; water quality index
; Oum El Bouaghi
; Algeria
1. Introduction
In the arid and semi-arid zones of North Africa, groundwater is the main source of water for human domestic uses and irrigated agriculture. Therefore, groundwater quality becomes an important public health issue especially where the aquifer system is shallow and directly connected to the surface soils in the agricultural lands that are heavily exploited. During the last decades, nitrate (NO₃⁻) became one of the most commonly observed groundwater pollutants in northern Algeria and was associated with nitrogenous fertilizers application, poor sewage disposal, and high vulnerability of the aquifer in the alluvial environment [1,2,3].
According to the World Health Organisation, the maximum allowed level of NO₃⁻ in water intended for consumption should not exceed 50 mg/L to protect from methaemoglobinaemia in infants [4]. Elevated levels of nitrate can cause additional health effects according to observational studies, although the epidemiological evidence is still under active discussion [5,6]. The Algerian norm for NO₃⁻ content in drinking water coincides with the recommendation of the World Health Organisation, and exceedances are observed in shallow alluvial aquifers in several northeastern wilayat [1,3,7].
The Garet Tarf plain located in the upper Oued Chemorah watershed, wilaya of Oum El Bouaghi has a productive Quaternary alluvial aquifer that is supplying water to rural population and irrigated agriculture lands. Although this is a very important hydrological site, there is no sufficient amount of hydrochemical data available in the published literature about this particular aquifer. Thus, initial assessment of groundwater composition and NO₃⁻ level is required for further effective water resource management in the area.
Machine learning algorithms (and ensemble tree algorithms, in particular) have been actively used in hydrogeology for screening physicochemical variables that are statistically associated with contaminant concentration levels, supplementing classical geochemical approach [8,9,10,11]. Random Forest (RF) algorithm [8] works well with multicollinear input variables and does not require any prior assumptions about non-linearities in the data. Variable importance in the model provides an interpretable characteristic of physicochemical variables that are most closely correlated with the output parameter. However, it is crucial to understand that RF variable importance is the measure of correlation and should be interpreted as such and model performance should not be overestimated due to small sample size and number of predictors.
This study aims to achieve the following five goals: (1) to characterize physicochemical composition of groundwater in Garet Tarf alluvial plain; (2) to classify samples according to hydrochemical facies; (3) to assess NO₃⁻ pollution level relative to WHO (2017) recommendations; (4) to develop and evaluate exploratory RF model to detect co-measured physicochemical variables associated with NO₃⁻ variability; and (5) to discuss environmental implications and further research directions.
2. Study Area
2.1. Geographic and Topographic Setting
The study area is the alluvial plain of Garet Tarf, wilaya of Oum El Bouaghi, northeastern Algeria (UTM Zone 32N; 310,000–365,000 m E; 3,927,000–3,960,000 m N). It is the central depression of the upper Oued Chemorah basin which discharges its water to the north towards the Oued Rhumel river network. Elevations vary from c. 600 m a.s.l. in the alluvial plains to over 1,200 m a.s.l. in the surrounding limestone ridges (Figure 1). Such relief gradient influences both the recharge process and the groundwater flow direction, i.e., northwards along the plain.
The climatic conditions of the region are those of the semi-arid continental Mediterranean type; the annual mean precipitation is 350–450 mm and is distributed within the October–April rainy period. The potential evapotranspiration exceeds precipitation by far during summer months. In the northernmost part of the plain the depth to water table can be less than 5 m; this factor might affect considerably the fate of contaminants in case of their surface application.
2.2. Geological and Hydrogeological Context
Jurassic limestones and Cretaceous carbonate formations are exposed in the surrounding ranges and considered a potential source of Ca²⁺ and HCO₃⁻ ions in recharge waters. The tectonic depression contains Mio-Pliocene continental deposits, among them gypsiferous marls; evaporitic intercalations in this lithology could serve as a possible source of high SO₄²⁻ content in many samples, which is the supposition based on lithological rather than mineralogical criteria [12,13]. Quaternary alluvial sediments form a main shallow unconfined phreatic aquifer studied here; saturated thickness is supposed to be 5–30 m; the depth to water table ranges from <2 m in the lowest northern part to >20 m at piedmont boundaries.
The land use covers irrigated gardening, cereal production, and peri-urban plasticulture. Possible nitrogen sources to the aquifer are nitrogenous fertilizers, livestock manure, and domestic sewage in the absence of sewering; however, no precise information about land use spatial distribution and the quantities of fertilizers was available, and therefore no correlation between land use and NO₃⁻ distribution can be established here; further evidences are needed for source identification.
3. Materials and Methods
3.1. Sampling and Field Measurements
Groundwater samples were collected from 80 sites — including operating agricultural wells, monitoring boreholes, and natural springs — during field campaigns in 2023. Sites were selected to provide broad spatial coverage across the alluvial aquifer. Each point was georeferenced by differential GPS (WGS84, UTM Zone 32N). In-situ measurements of pH, electrical conductivity, water temperature, and dissolved oxygen were made at the time of sampling with a calibrated multiparameter probe (WTW Multi 3630 IDS; Xylem Analytics, Weilheim, Germany). Samples for laboratory analysis were collected in pre-rinsed 500 mL HDPE bottles; those for cation analysis were acidified to pH < 2 with ultrapure HNO₃. Samples were transported in refrigerated coolers at 4 °C and analysed within 48 hours at the accredited laboratory of Abbes Laghrour University, Khenchela.
3.2. Laboratory Analysis
Major anions and cations were determined by standard methods [14]: HCO₃⁻ by potentiometric titration; SO₄²⁻ by BaCl₂ turbidimetry; Cl⁻ by Mohr argentometric titration; NO₃⁻ by UV spectrophotometry at 220 nm (Shimadzu UV-1800, Shimadzu Corp., Kyoto, Japan); Ca²⁺ and Mg²⁺ by EDTA complexometric titration; Na⁺ and K⁺ by flame photometry (Jenway PFP7, Cole-Parmer, Stone, UK). TDS was estimated as the sum of dissolved ionic species. The ion balance error was maintained below ±5% for all 80 samples, confirming satisfactory analytical quality.
3.3. Water Quality Index
The WQI was computed using the weighted arithmetic mean method of Brown et al. [15], as applied in regional studies [16,17]. WHO (2017) [4] guideline values served as reference standards. For each parameter i: qᵢ = (Cᵢ / Sᵢ) × 100, where Cᵢ is the measured concentration and Sᵢ is the WHO maximum permissible limit. Parameters included: pH, EC, TDS, HCO₃⁻, SO₄²⁻, Cl⁻, Ca²⁺, Mg²⁺, Na⁺, and NO₃⁻. WQI classes [15]: Excellent (0–25), Good (26–50), Poor (51–75), Very Poor (76–100), Unsuitable for drinking (>100). It is important to note that WQI is a composite index of overall drinking-water suitability; elevated WQI values may reflect geogenic mineralisation, elevated nitrate, or both. WQI and nitrate-specific exceedance represent complementary but distinct dimensions of groundwater quality and should not be presented as equivalent.
3.4. Hydrochemical Facies Classification
The major-ion dataset was used to plot in the Piper trilinear diagram [18], where the dominant water chemistry types can be determined and possible geochemical paths identified. This diagram is used to classify water chemistries and also to visualize possible water mixing and mineral dissolution paths.
3.5. Pearson Correlation Analysis
Pearson correlation coefficient values for NO₃⁻ have been determined against each of the nine physicochemical factors. Significance testing has been carried out using two-tailed tests at both α = 0.05 and α = 0.01. The Pearson r indicates the extent of correlation in a linear bivariate model; it fails to account for multivariate or nonlinear relations.
3.6. Random Forests — Exploratory Variable Screening
A Random Forests® (RF) regression model was fitted as a screening tool to detect which of the co-measured physicochemical variables are the most correlated with the variation in NO₃⁻ concentration. RF consists of building an ensemble of regression trees using bootstrap data samples and averaging their outputs. Multicollinear and non-linearly related predictors can be handled automatically [8]. The predictor variables considered in this analysis were HCO₃⁻, SO₄²⁻, Cl⁻, Ca²⁺, Mg²⁺, Na⁺, K⁺, EC, and pH; NO₃⁻ was the response variable. All calculations were done in Minitab® 21 (Minitab LLC, State College, PA, USA) using the ‘Discover Best Model (Continuous Response)’ procedure, which compared RF with MARS® [19] and TreeNet® through 5-fold cross-validation, taking the algorithm with maximal OOB R² as the best. Hyperparameters of the RF are listed in Table 6.
Performance is reported in terms of OOB R², RMSE, and MAD. MAPE is not included due to the fact that there are NO₃⁻ concentrations equal to 0 mg/L in six data points, making MAPE mathematically impossible to calculate. The variable importance is defined as the average percentage improvement in node impurity that is obtained when splitting on particular predictors, with normalization to the most important predictor. This normalization makes the most important predictor to have importance equal to 100% by definition – thus, it gives only information about the relative ranking inside the model, and not about the percentage of explained variance in NO₃⁻. Here, the RF model is used solely as a variable-screening tool. OOB R² of 16.36% shows that nine hydrochemical variables co-measured with NO₃⁻ are insufficient for accurate spatial prediction of NO₃⁻ concentration; the model should not be treated as highly accurate predictive one. With such small sample size (n = 80) variable importance estimates may contain considerable uncertainty.
4. Results
4.1. General Physicochemical Characteristics
Table 1 summarises the descriptive statistics for all 12 parameters. Spatial variability is pronounced: coefficients of variation exceed 100% for SO₄²⁻ (CV = 121%), EC (CV = 107%), and TDS (CV = 107%). This heterogeneity is consistent with the superimposition of variable geogenic mineral dissolution and spatially heterogeneous anthropogenic loading across the 80 sampling points. pH values (6.5–8.0; mean 7.24 ± 0.31) fall within the WHO (2017) permissible range, consistent with carbonate-buffered groundwater. EC (164–6,710 µS/cm; mean 766 µS/cm) and TDS (107–4,362 mg/L; mean 498 mg/L) span wide ranges. Guideline exceedances for SO₄²⁻ (11.3% of samples above 250 mg/L, maximum 2,660 mg/L) and EC (8.8%) are likely attributable primarily to geogenic sources and represent a water quality concern independent of nitrate.
4.2. Nitrate Concentrations and Contamination Risk
The range of NO₃⁻ concentrations falls between 0 and 134 mg/L (average concentration is 32.6 ± 27.7 mg/L; median is 26 mg/L). The distribution shows positive skewing (skewness ~1.47), which is caused by a few high values added to the average background (Figure 2, Table 2). Undetectable NO₃⁻ was found in six samples (7.5%). This can be associated with denitrification occurring under suboxic conditions, although no redox measurements have been done during this investigation. Fifteen samples (18.8%) have exceeded the WHO (2017) threshold value (50 mg/L). The maximum concentration of 134 mg/L was detected at P27 site and corresponds to a well in proximity to the open drainage canal in the peri-urban market-garden area.
4.3. Hydrochemical Facies
Analysis of Piper diagram revealed four water types (Table 3). The Ca²⁺–SO₄²⁻ facies (46.3%, n = 37) demonstrates clear Ca²⁺–SO₄²⁻ co-occurrence, suggesting dissolution of gypsum or anhydrites of Miocene evaporites interbedded in basin-fill sequence; this conclusion is based on regional geology and not on mineral analysis data [12,13]. The Ca²⁺–HCO₃⁻ facies (27.5%, n = 22) corresponds to carbonate dissolution type of recharge from Jurassic limestone outcrops. Ca²⁺–Cl⁻ waters (25.0%, n = 20) can either correspond to evolved groundwater or minor halite dissolution; also these waters can be enriched with Cl⁻ ions via evapotranspiration; the options cannot be discriminated using the current data set. One sample of Na⁺+K⁺–Cl⁻ was recognized and not considered further due to the lack of repeated measurements.
The mean NO₃⁻ concentrations vary insignificantly in terms of facies (Table 3): Ca²⁺–HCO₃⁻ facies demonstrates the highest values (36.8 mg/L), being insignificantly higher than Ca²⁺–SO₄²⁻ facies (34.5 mg/L). Higher values of nitrates in Ca²⁺–HCO₃⁻ waters can suggest connection with hydrochemical characteristics of recharge zone. Nevertheless, it should be noted that the difference is not statistically significant due to the uneven sample groups.
4.4. Pearson Correlation Analysis
Table 4 and Figure 4 present Pearson r values. Two variables show statistically significant positive correlations with NO₃⁻ at p < 0.01: SO₄²⁻ (r = +0.324) and EC (r = +0.304). At p < 0.05, Na⁺ (r = +0.279), Ca²⁺ (r = +0.275), K⁺ (r = +0.272), and Cl⁻ (r = +0.267) also show statistically significant positive associations. HCO₃⁻ shows a significant negative correlation (r = −0.320, p < 0.01). Mg²⁺ and pH are not significant at either threshold. All magnitudes are modest (|r| ≤ 0.324), indicating that no single predictor is strongly linearly associated with NO₃⁻ across the full 80-sample dataset. Figure 5 illustrates the bivariate scatter for the three most correlated parameters.
4.5. Random Forests: Exploratory Variable Importance
Of the three analyzed algorithms, RF performed best in terms of OOB R² (Table 5). The full comparison between MARS® and TreeNet® is not available since Minitab® 21 provides only RMSE and MAD values for the selected model; the output statement from Minitab® 21 is that among the models analyzed, Random Forests produced the highest OOB R². MAPE cannot be calculated due to the presence of NO₃⁻ = 0 mg/L values in six samples, which makes this measure mathematically undefined for these data.
In this case, RF OOB R² of 16.36% (RMSE = 25.21 mg/L; MAD = 19.12 mg/L) means that the model is able to explain about 16% of variation in NO₃⁻, while 84% of variation remains unexplained. Such a poor performance is explained by the restrictions imposed by the analysis: the size of the dataset equal to 80 samples, the restriction to co-measured hydrochemical parameters (without land use, depth to water table, soil parameters, and geographic coordinates), and the natural heterogeneity of nitrate contamination sources in agricultural alluvial environments.
The R²-vs-trees diagnostic plot shows model stabilisation after approximately 150 trees, confirming that 300 bootstrap trees provide a stable OOB estimate. The relative variable importance chart ranks HCO₃⁻ first with a normalised value of 100%. It is important to note that this value represents relative variable importance normalised to the most influential predictor and does not mean that HCO₃⁻ explains 100% of nitrate variability; the 100% value is assigned by construction to the top-ranked predictor. Cl⁻ follows at 29.7%, then Ca²⁺ (15.0%) and Mg²⁺ (13.9%); EC (0.4%), SO₄²⁻, Na⁺, K⁺, and pH contribute negligibly.
4.6. Water Quality Index
WQI values range from 12.6 to 203.3 (mean 53.4; Figure 6). The modal class is ‘Poor’ (WQI 51–75; 41.3% of samples), followed by ‘Good’ (30.0%), ‘Very Poor’ (16.3%), ‘Unsuitable’ (12.5%), and ‘Excellent’ (12.5%). The maximum WQI of 203.3 at site P7 is driven by extreme geogenic mineralisation — EC = 6,710 µS/cm, SO₄²⁻ = 2,660 mg/L, Cl⁻ = 1,100 mg/L — rather than by elevated nitrate. This example illustrates the importance of treating WQI and nitrate-specific exceedance as complementary, not equivalent, dimensions of groundwater quality: WQI reflects overall drinking-water suitability and may be elevated by geogenic or anthropogenic factors independently. High WQI should not be interpreted as evidence of nitrate contamination specifically.
5. Discussion
5.1. Extent and Context of Nitrate Contamination
Mean NO₃⁻ values of 32.6 mg/L along with an 18.8% exceedance ratio put the Garet Tarf aquifer in line with moderately influenced alluvial aquifers reported in the north-eastern part of Algeria and similar semi-arid regions in North Africa [1,2,3,7]. The maximum value of NO₃⁻ of 134 mg/L at the P27 site, and the presence of such contamination in conjunction with the presence of peri-urban site near a channel with no lining could indicate anthropogenic origin, but further isotopic analysis (δ¹⁵N–NO₃⁻, δ¹⁸O–NO₃⁻) needs to be carried out to confirm such point-source pollution, which was not done in this study [20]. Absence of NO₃⁻ in six samples could indicate the presence of sub-oxic/anoxic conditions where denitrification is taking place biologically [21].
5.2. Hydrochemical Characteristics and Possible Mineralisation Processes
The predominance of the Ca²⁺–SO₄²⁻ facies (46.3%) is related to gypsum or anhydrite dissolution in Miocene evaporitic deposits of the basin-fill aquifers due to the similarity of the lithology and significant Ca²⁺–SO₄²⁻ correlation, but not to any data on saturation index and mineral analysis [12,13]. The Ca²⁺–HCO₃⁻ facies (27.5%) can be interpreted as recharge through carbonate weathering from Jurassic limestone beds. The Ca²⁺–Cl⁻ facies (25.0%) may correspond to evolution of groundwater or halite dissolution and Cl⁻ enrichment by evapotranspiration in the vadose zone; further investigations are required to determine the process responsible. The high SO₄²⁻ and TDS concentrations in some samples show that mineralization is a water quality issue apart from nitrates.
5.3. Physicochemical Variables Associated with NO₃⁻ Variability
Significant positive correlations among NO₃⁻, SO₄²⁻, EC, Na⁺, Ca²⁺, K⁺, and Cl⁻ could be expected from cases when these ions have some common anthropogenic sources; for instance, fertilizers based on nitrogen and sulphate compounds, or wastewater from human and animal activities supplying ions of Cl⁻, Na⁺, K⁺, and NO₃⁻. However, the values of all these correlations are relatively low (|r| ≤ 0.324), and the explained variation of NO₃⁻ concentration is quite small. These associations can be considered as suggestive rather than diagnostic. It could be reasonable to assume some agricultural or domestic contributions to the nitrate pollution in the area because of the corresponding type of land use; however, to prove the source of NO₃⁻ the independent evidence (isotopic tracers, land use data etc.) should be collected [20].
5.4. Interpreting the Random Forests Variable Importance: The HCO₃⁻ Paradox
The most prominent outcome from the RF analysis is the role played by HCO₃⁻ as the physicochemical variable most closely associated with NO₃⁻ variability (normalised importance = 100%), even though the former variable exhibits a significant negative Pearson correlation with the latter one (r = −0.320, p < 0.01). This seeming contradiction can be reconciled because the Pearson correlation assesses a two-variable linear association, while the relative importance of HCO₃⁻ in the RF model represents the contribution of a predictor in a multivariate context, which may also be non-linear. The dominant dilution effect in the Piper plot — recharge waters with high levels of HCO₃⁻ reducing NO₃⁻ concentration — leads to a negative r value. The role of HCO₃⁻ in the multidimensional space of predictors in the RF can be seen as that of a threshold variable dividing groups that are hydrochemically distinct and differ systematically in NO₃⁻ not due to the causal relation, but due to their co-variation with the hydrogeological settings influencing nitrate fate and transport.
However, it is important to emphasize once more that HCO₃⁻ = 100% is the relative importance of the variable normalized by the predictor with the greatest importance in this model and not the percentage of NO₃⁻ variance explained. With n = 80 samples and OOB R² equal to 16.36%, there is great uncertainty in estimating the variable importance. The fact that HCO₃⁻ has been identified as the most closely associated variable might be a reflection of the actual multivariate association with NO₃⁻ variability in this aquifer, or of the effects of sampling or co-variance with other variables, including water table depth, land use intensity and position, etc.
5.5. Limitations
Several limitations are explicitly acknowledged. The sample size (n = 80) is at the lower end for a machine learning analysis of a spatially heterogeneous contamination problem; a larger and more spatially distributed dataset would likely improve model stability and provide a more robust assessment of nitrate variability. The predictor set is restricted to co-measured hydrochemical variables; excluding spatial covariates such as land use, soil texture, depth to water table, and distance to contamination sources is likely the primary reason for the low OOB R². No redox measurements, isotopic data, or bacteriological analyses were performed, limiting interpretation of denitrification signals and preventing source apportionment. The temporal scope is limited to a single 2023 sampling campaign; seasonal dynamics and inter-annual variability are not captured.
5.6. Environmental and Management Implications
The 15 wells with NO₃⁻ > 50 mg/L represent an immediate concern for households consuming this water without treatment, particularly for infants and vulnerable groups [4,6]. These wells should be subjected to increased monitoring frequency. The spatial concentration of exceedance sites in the northern peri-urban sector — where shallow water tables, intensive market gardening, and absent sewerage infrastructure coincide — is consistent with, but not proven to be caused by, anthropogenic nitrate contributions in that area. Strengthening nitrogen fertilizer management and improving sanitation infrastructure in peri-urban zones are indicated as precautionary measures under conditions of incomplete evidence.
6. Conclusions
The current research has described the hydrochemical profile of the alluvial aquifer of Garet Tarf (Oum El Bouaghi, NE Algeria) and evaluated the prevalence of nitrate pollution based on 80 samples of groundwater collected in 2023. A Random Forests regression model has been developed as a screening method to identify important explanatory variables. The main findings of this study are the following:
(1) Nitrate concentrations vary from 0 to 134 mg/L (average 32.6 mg/L; median 26 mg/L); 18.8% exceed WHO (2017) guideline value of 50 mg/L. Such distribution of exceedances is concentrated in the northern peri-urban area of Garet Tarf, which is consistent with the possible presence of anthropogenic factors although the confirmation of sources will need further isotopic studies.
(2) The most prevalent type of waters is Ca²⁺–SO₄²⁻ (46.3%), possibly due to the dissolution of evaporites; the second and third prevalent types of waters are Ca²⁺–HCO₃⁻ (27.5%) and Ca²⁺–Cl⁻ (25.0%). Such inferences have been made based on geochemical interpretation and lithological peculiarities of the region.
(3) Correlation coefficients (Pearson) between NO₃⁻ and some parameters (SO₄²⁻: r = +0.324; EC: r = +0.304; Cl⁻: r = +0.267; HCO₃⁻: r = −0.320) are statistically significant but relatively low, implying the association between multiple hydrochemical parameters and NO₃⁻ without dominance of any of them.
(4) Exploratory model of Random Forests has relatively low OOB R² equal to 16.36% (RMSE = 25.21 mg/L; MAD = 19.12 mg/L) which demonstrates low predictive ability of hydrochemical co-variables; thus, the RF model is not a highly accurate predictive model. HCO₃⁻ is identified as the variable the most closely related to NO₃⁻ (normalised importance = 100%; normalised importance represents the relative rank of variable significance and does not refer to the explained variance). It is not a contradiction to the negative Pearson coefficient (r = −0.320) since Pearson correlation determines linear bivariate relation while RF importance – the multivariate and non-linear contribution.
(5) Results of WQI are rather poor (average = 53.4; 12.5% Unsuitable) which reflects the generally poor quality of groundwater due to the geogenic mineralisation and, sometimes, due to high nitrate concentration. WQI and nitrate exceedances represent two different aspects of water quality and should not be confused.
(6) Further research should: increase the sample size and its geographical coverage to provide better model stability and robustness; include spatial land use, soil and water table depth as additional independent variables; conduct stable isotope analysis (δ¹⁵N–NO₃⁻, δ¹⁸O–NO₃⁻) for identification of sources of nitrate pollution; determine redox parameters in order to evaluate the possibility of denitrification; create long-term monitoring programme.
Author Contributions
Conceptualization, S.D. and S.P.; Methodology, S.D.; Formal Analysis, S.D.; Investigation, S.D.; Data Curation, S.D.; Writing — Original Draft, S.D.; Writing — Review & Editing, S.D. and S.P.; Supervision, S.P. All authors have read and agreed to the published version of the manuscript.
Funding
This research received no external funding.
Data Availability Statement
The raw data supporting the conclusions of this article will be made available by the authors on request.
Conflicts of Interest
The authors declare no conflicts of interest.
References
- Bouteraa, O.; Mebarki, A.; Bouaicha, F.; Nouaceur, Z.; Laignel, B. Groundwater quality assessment using multivariate analysis, geostatistical modelling, and Water Quality Index (WQI): a case study in the Boumerzoug–El Khroub valley, NE Algeria. Acta Geochim. 2019, 38, 796–814. [Google Scholar] [CrossRef]
- Benyoussef, S.; Larbi, R.; Kherief-Nacereddine, A.K.; Bendahmane, I. Assessment of groundwater quality using hydrochemical processes, GIS, and multivariate statistical analysis in the central Rif, North Morocco. Environ. Earth Sci. 2024, 83, 211. [Google Scholar] [CrossRef]
- Selmane, T.; Dougha, M.; Hasbaia, M.; Ferhati, A.; Redjem, A. Hydrogeochemical processes and multivariate analysis for groundwater quality in the arid Maadher region of Hodna, northern Algeria. Acta Geochim. 2022, 41, 893–909. [Google Scholar] [CrossRef]
- WHO (World Health Organization). Guidelines for Drinking-water Quality, 4th ed.; World Health Organization: Geneva, Switzerland, 2017. [Google Scholar]
- Ward, M.H.; Jones, R.R.; Brender, J.D.; de Kok, T.M.; Weyer, P.J.; Nolan, B.T.; Villanueva, C.M.; van Breda, S.G. Drinking water nitrate and human health: an updated review. Int. J. Environ. Res. Public Health 2018, 15, 1557. [Google Scholar] [CrossRef]
- Ward, M.H.; deKok, T.M.; Levallois, P.; Brender, J.; Gulis, G.; Nolan, B.T.; VanDerslice, J. Workgroup report: Drinking-water nitrate and health — recent findings and research needs. Environ. Health Perspect. 2005, 113, 1607–1614. [Google Scholar] [CrossRef]
- Bouselsal, B.; Satouh, A.; Akcha, D. Evaluating water quality, mineralisation mechanisms, and potential health risks of nitrate contamination in the Continental Intercalaire aquifer of Reggane, Algeria. Environ. Earth Sci. 2024, 83, 155. [Google Scholar] [CrossRef]
- Breiman, L. Random Forests. Mach. Learn. 2001, 45, 5–32. [Google Scholar] [CrossRef]
- Rodriguez-Galiano, V.; Mendes, M.P.; Garcia-Soldado, M.J.; Chica-Olmo, M.; Ribeiro, L. Predictive modelling of groundwater nitrate pollution using Random Forest and multisource variables. Sci. Total Environ. 2014, 476–477, 189–206. [Google Scholar] [CrossRef]
- Knoll, L.; Breuer, L.; Bach, M. Large scale prediction of groundwater nitrate concentrations from spatial data using machine learning. Sci. Total Environ. 2019, 668, 1317–1327. [Google Scholar] [CrossRef]
- He, S.; Wu, J.; Wang, D.; He, X. Predictive modelling of groundwater nitrate pollution and evaluating its main impact factors using random forest. Chemosphere 2022, 290, 133388. [Google Scholar] [CrossRef]
- Tafrount, A.; Demdoum, A.; Lekrine, Y.; Bouaicha, F. Hydrogeochemical evolution and mineralisation origin in a semi-arid shallow aquifer: Barika area, northeast Algeria. Acque Sotter. 2023, 12, 7–18. [Google Scholar] [CrossRef]
- Kouadra, R.; Demdoum, A. Hydrogeochemical characteristics of groundwater and quality assessment for drinking and irrigation purposes in Bougaa area, NE Algeria. Acta Geochim. 2020, 39, 642–654. [Google Scholar] [CrossRef]
- APHA; American Public Health Association. Standard Methods for the Examination of Water and Wastewater, 23rd ed.; APHA: Washington, DC, USA, 2017. [Google Scholar]
- Brown, R.M.; McClelland, N.I.; Deininger, R.A.; Tozer, R.G. A water quality index — do we dare? Water Sew. Work. 1972, 117, 339–343. [Google Scholar]
- Derdour, A.; Bouanani, A.; Babahamed, K. Groundwater quality assessment for sustainable human consumption in arid areas. Environ. Earth Sci. 2023, 82, 68. [Google Scholar] [CrossRef]
- Piper, A.M. A graphic procedure in the geochemical interpretation of water-analyses. Trans. Am. Geophys. Union 1944, 25, 914–928. [Google Scholar] [CrossRef]
- Friedman, J.H. Multivariate Adaptive Regression Splines. Ann. Stat. 1991, 19, 1–67. [Google Scholar] [CrossRef]
- Vitoria, L.; Otero, N.; Soler, A.; Canals, A. Fertilizer characterization: isotopic data (N, S, O, C, and Sr). Environ. Sci. Technol. 2004, 38, 3254–3262. [Google Scholar] [CrossRef]
- Rivett, M.O.; Buss, S.R.; Morgan, P.; Smith, J.W.N.; Bemment, C.D. Nitrate attenuation in groundwater: a review of biogeochemical controlling processes. Water Res. 2008, 42, 4215–4232. [Google Scholar] [CrossRef]
- Liaw, A.; Wiener, M. Classification and regression by randomForest. R News 2002, 2, 18–22. [Google Scholar]
Figure 1.
Digital Elevation Model (DEM) of the Garet Tarf watershed, Oum El Bouaghi (NE Algeria). The colour ramp transitions from blue-green in the flat northern alluvial plain (~600 m a.s.l.) through green-yellow at intermediate elevations to orange-red in the southern mountain ridges (>1,100 m). UTM Zone 32N projection.
Figure 1.
Digital Elevation Model (DEM) of the Garet Tarf watershed, Oum El Bouaghi (NE Algeria). The colour ramp transitions from blue-green in the flat northern alluvial plain (~600 m a.s.l.) through green-yellow at intermediate elevations to orange-red in the southern mountain ridges (>1,100 m). UTM Zone 32N projection.
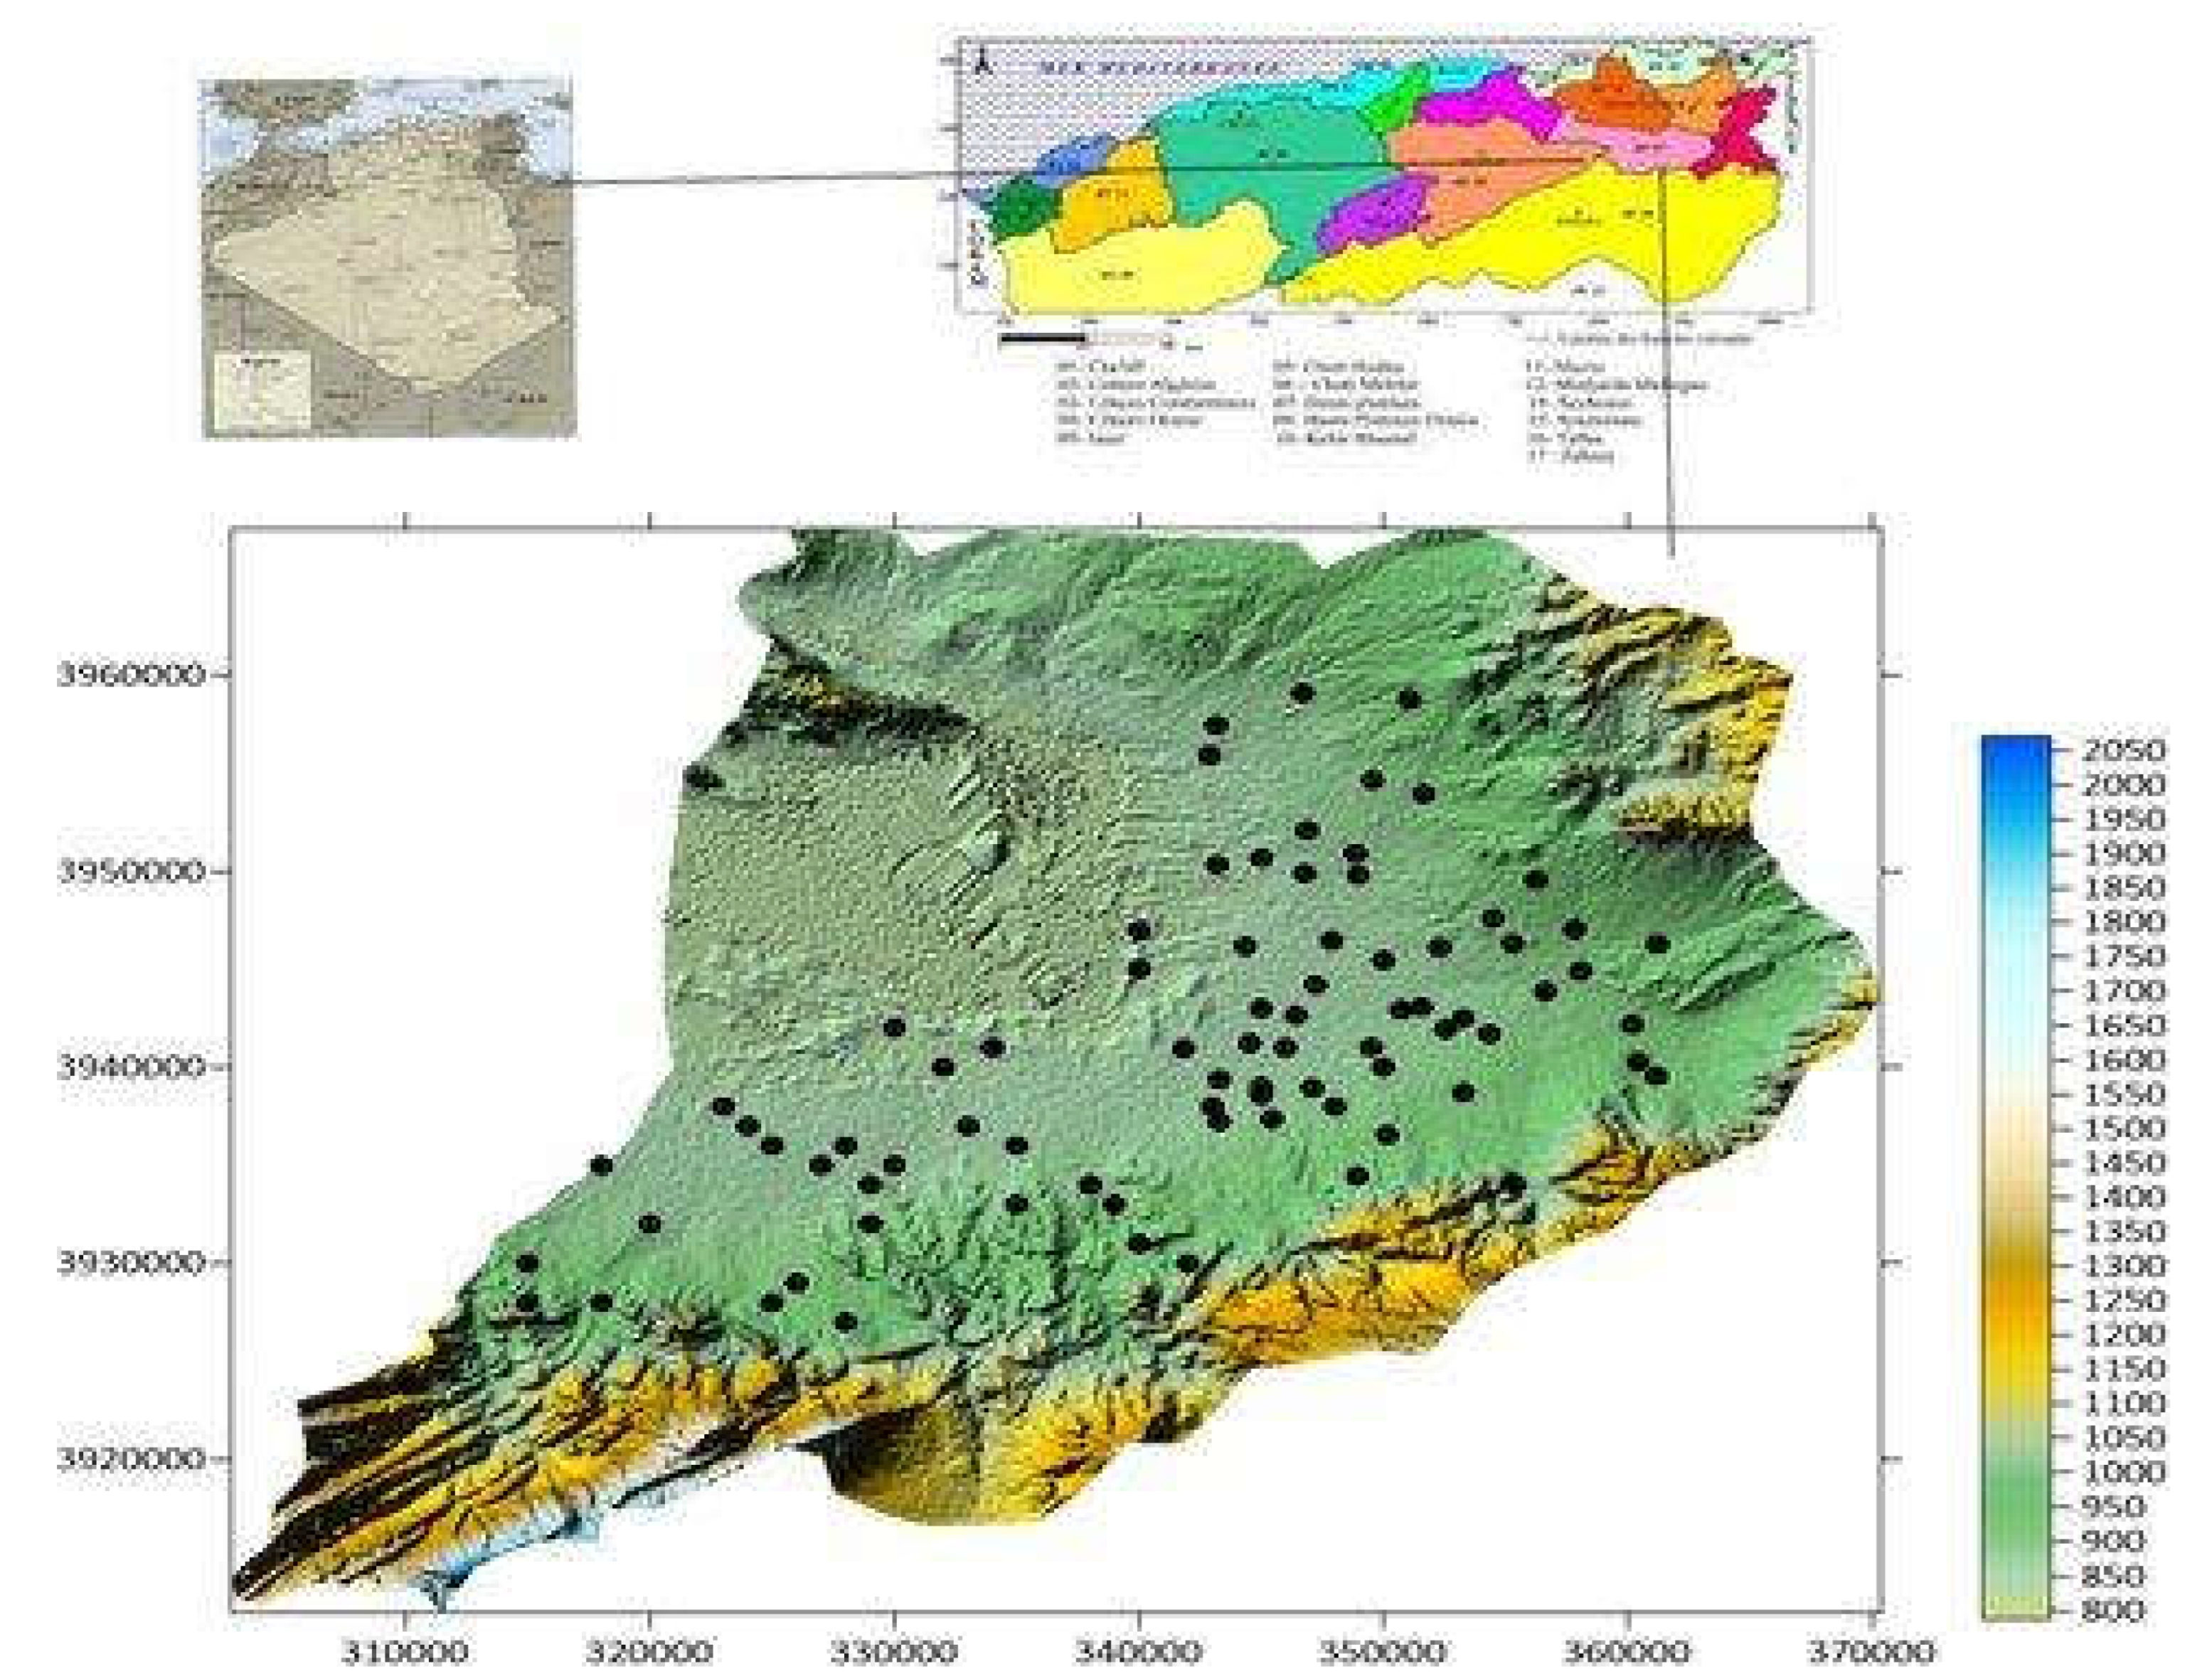
Figure 2.
NO₃⁻ concentration distribution in the 80 groundwater samples from the Garet Tarf plain. (a) Frequency histogram; the red dashed line marks the WHO (2017) limit of 50 mg/L. (b) Proportional distribution across contamination risk categories (Table 2).
Figure 2.
NO₃⁻ concentration distribution in the 80 groundwater samples from the Garet Tarf plain. (a) Frequency histogram; the red dashed line marks the WHO (2017) limit of 50 mg/L. (b) Proportional distribution across contamination risk categories (Table 2).
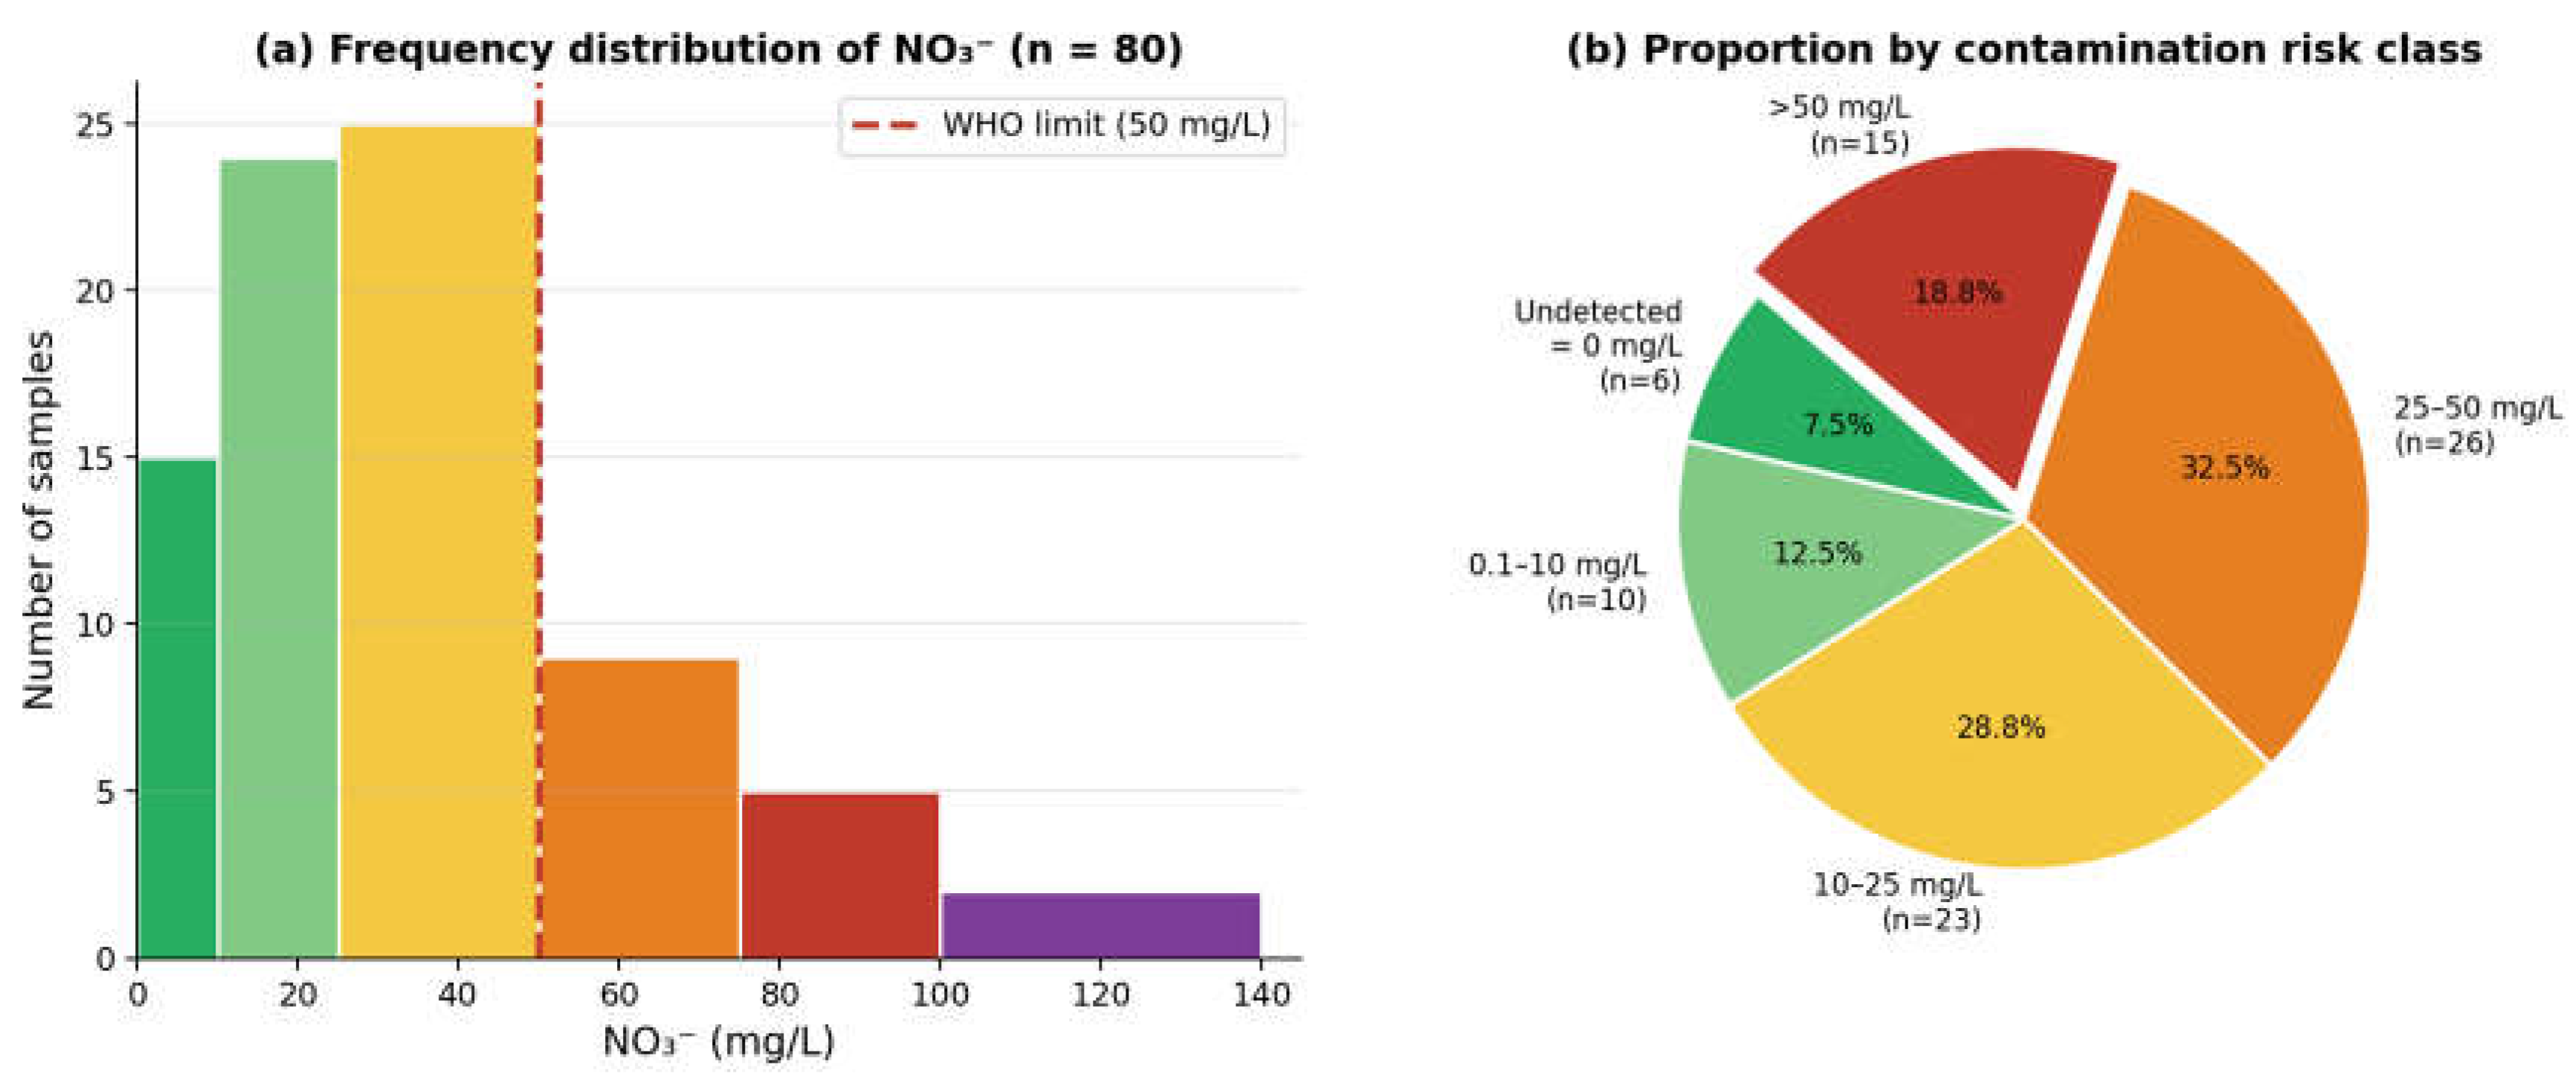
Figure 3.
Boxplots of NO₃⁻ concentration by hydrochemical facies (n = 80). The red dashed line marks the WHO (2017) limit of 50 mg/L. Outliers are shown as open circles; sample counts per facies are given at the base of each box.
Figure 3.
Boxplots of NO₃⁻ concentration by hydrochemical facies (n = 80). The red dashed line marks the WHO (2017) limit of 50 mg/L. Outliers are shown as open circles; sample counts per facies are given at the base of each box.
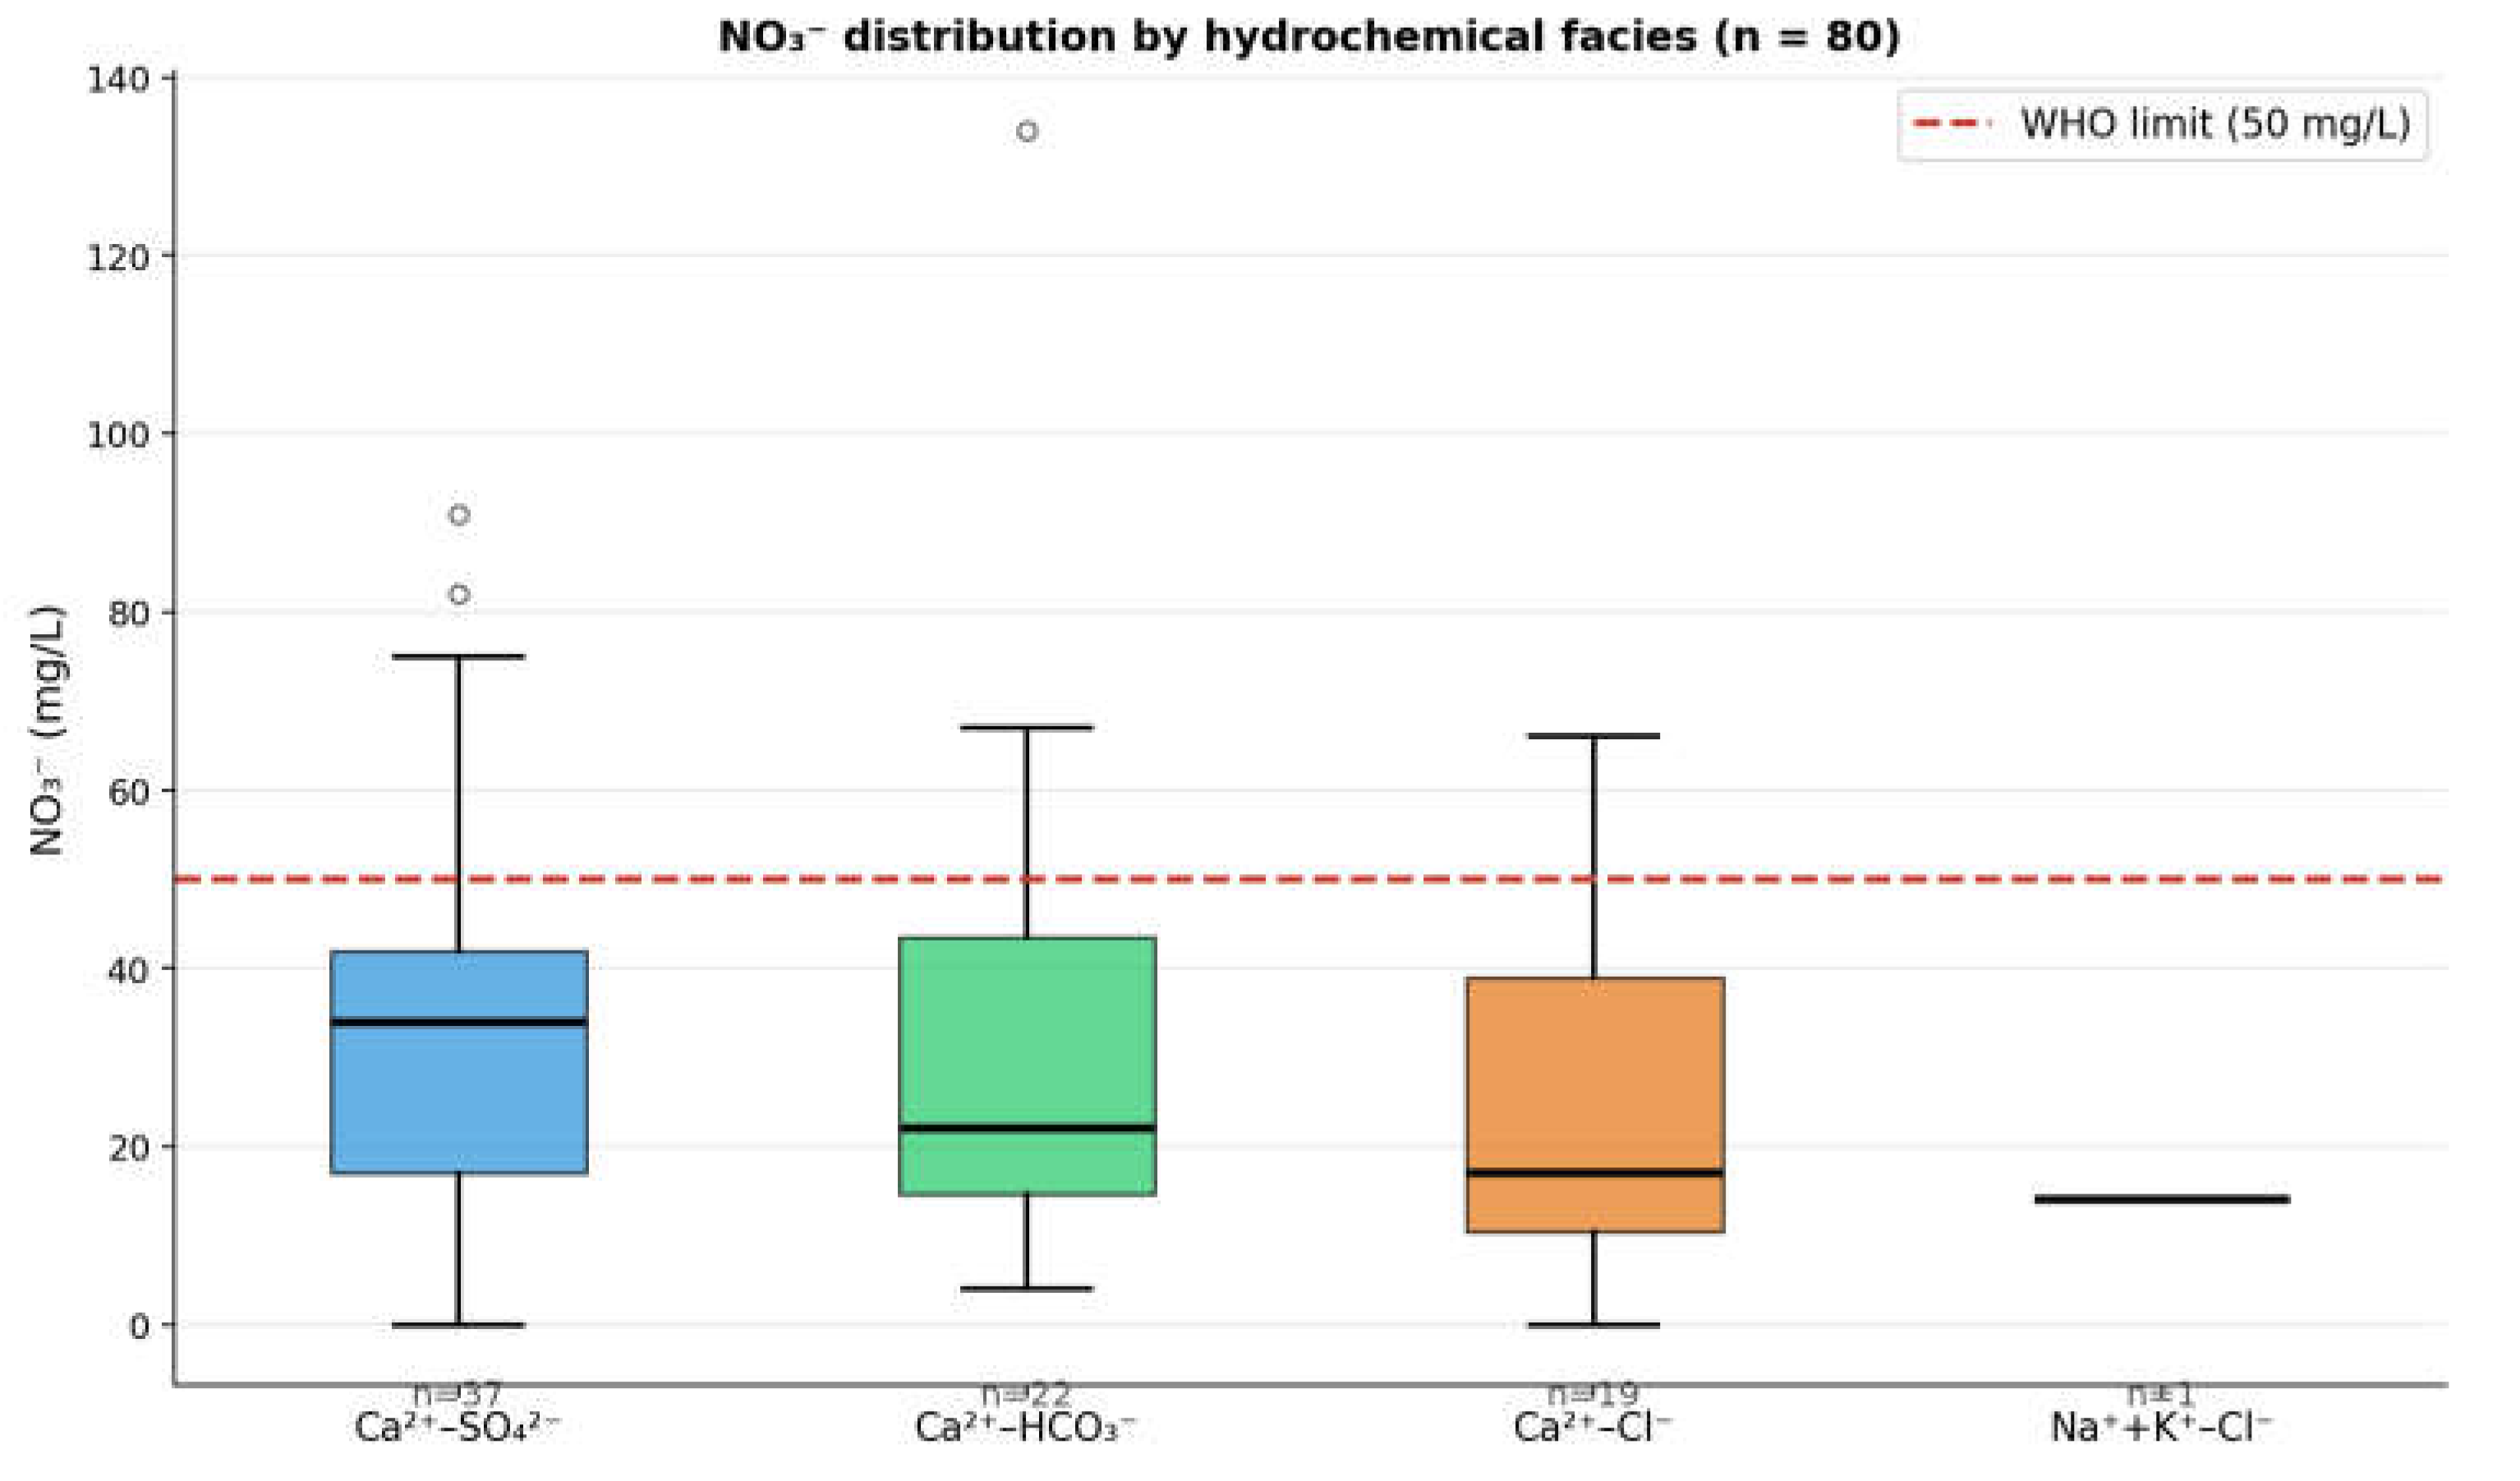
Figure 4.
Pearson correlation coefficients between physicochemical parameters and NO₃⁻ (n = 80). Blue bars: positive correlations; red bar: negative correlation. Significance: ** p < 0.01; * p < 0.05; ns = not significant. All values have |r| ≤ 0.324.
Figure 4.
Pearson correlation coefficients between physicochemical parameters and NO₃⁻ (n = 80). Blue bars: positive correlations; red bar: negative correlation. Significance: ** p < 0.01; * p < 0.05; ns = not significant. All values have |r| ≤ 0.324.
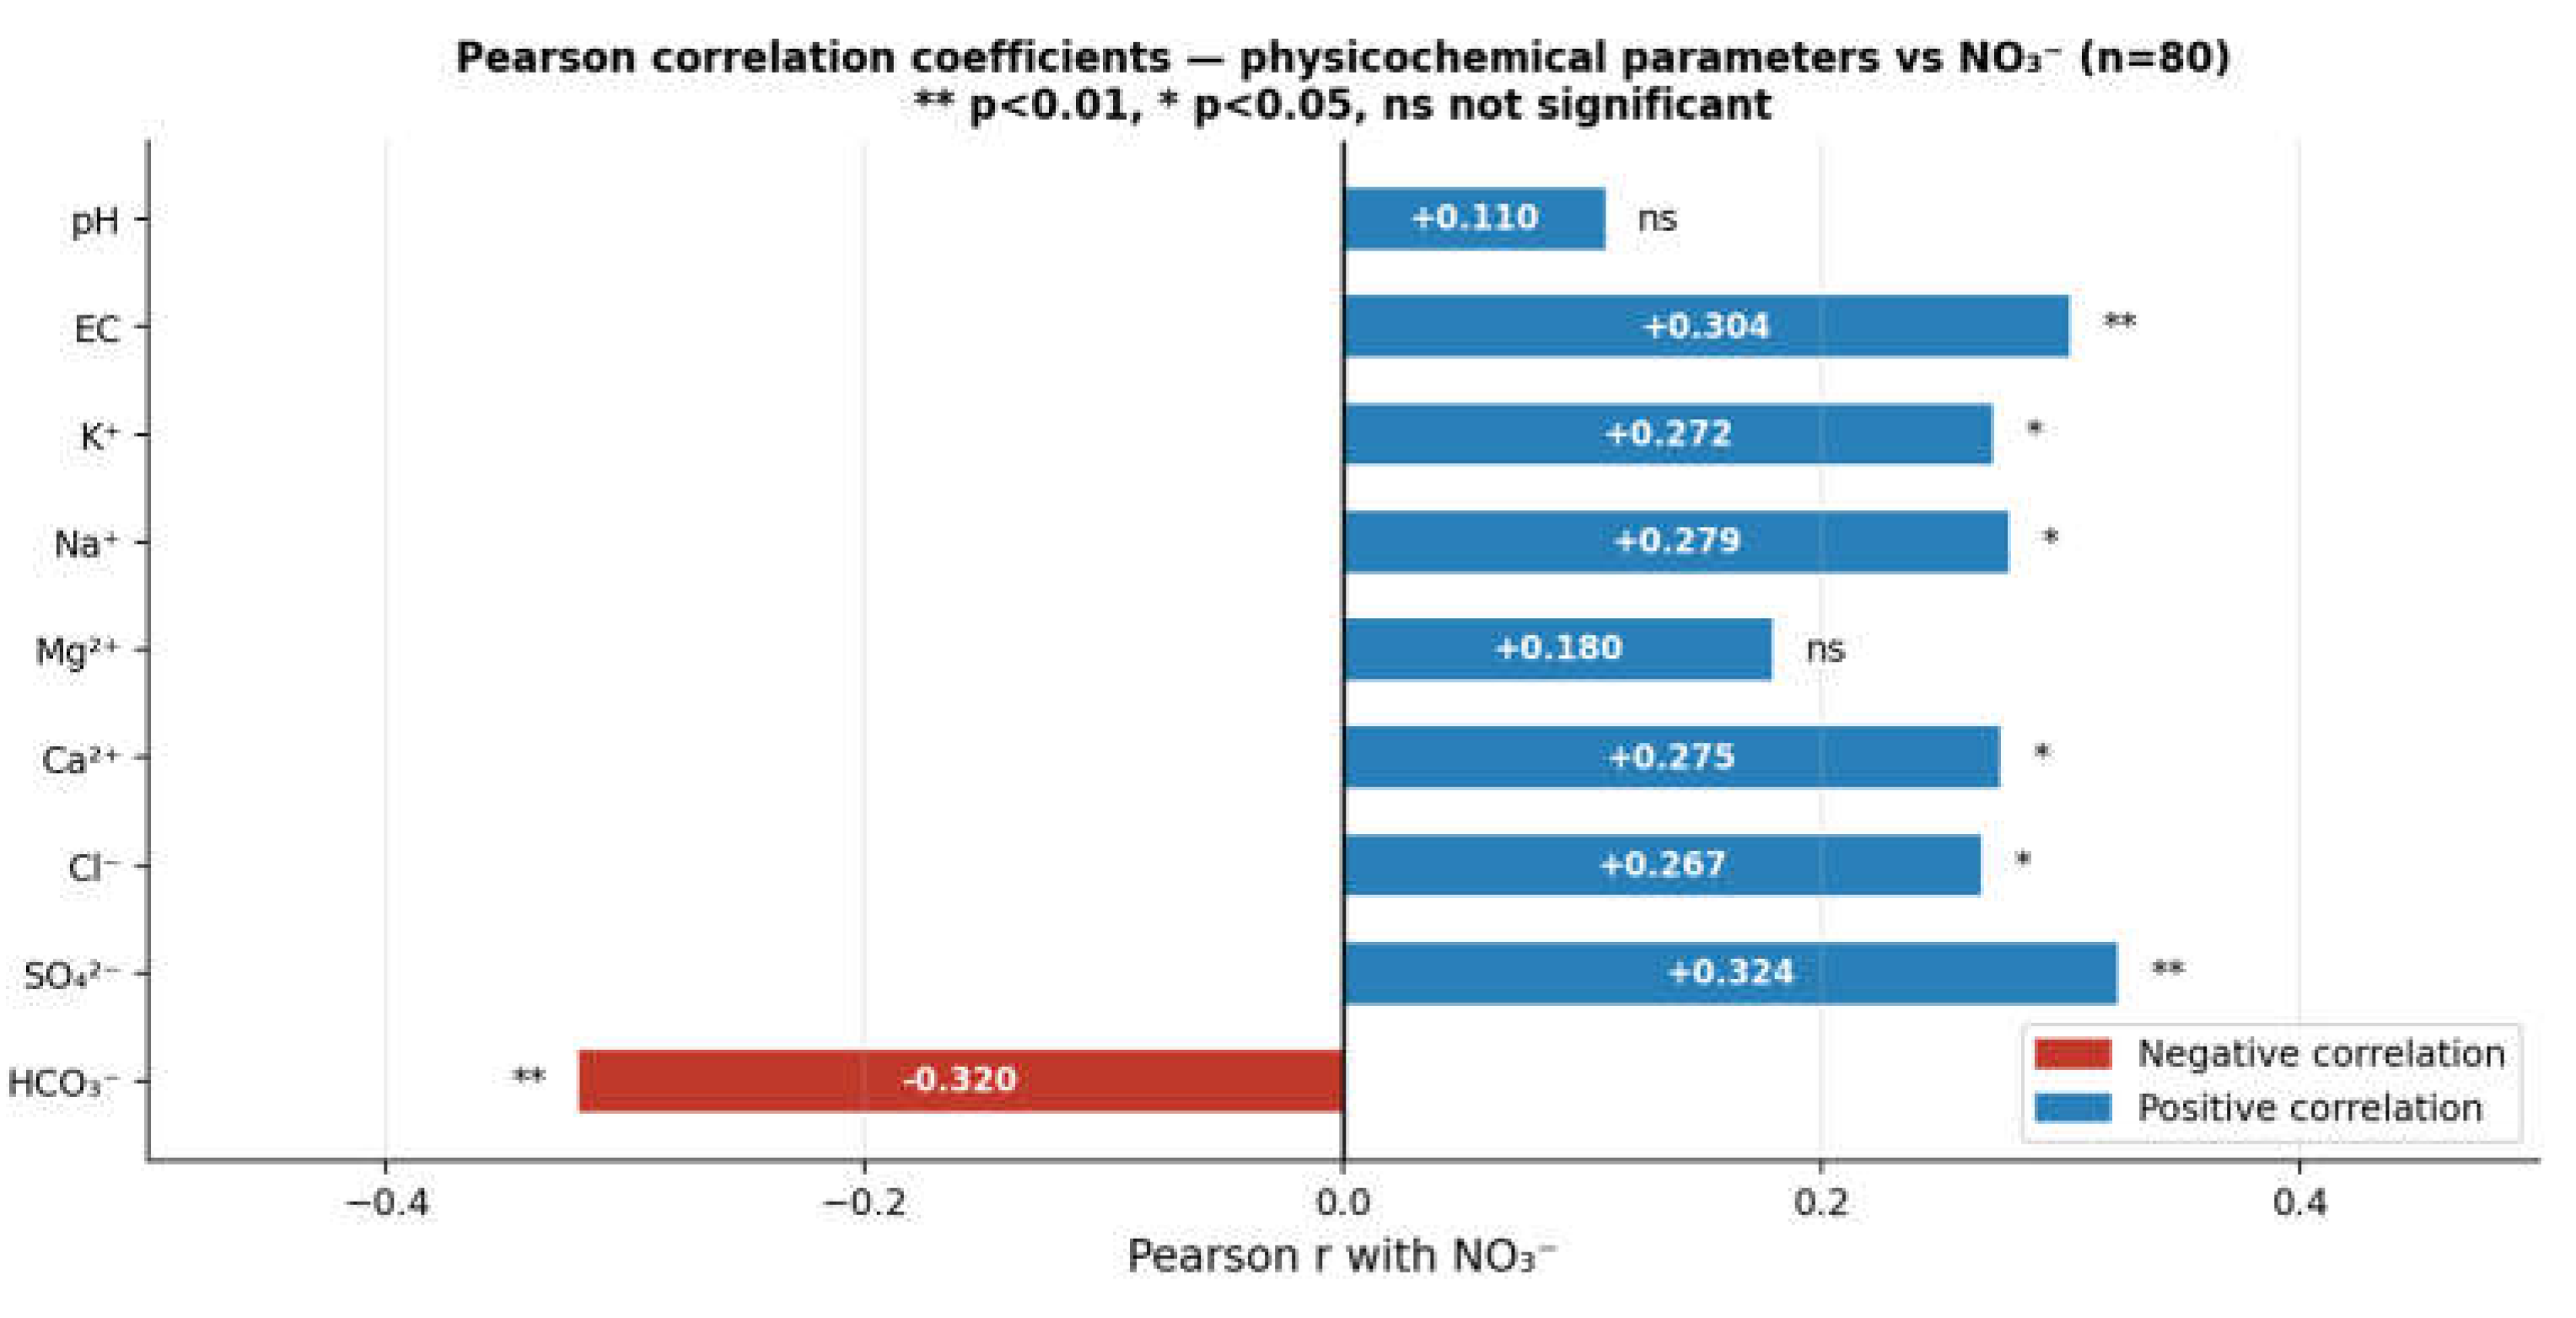
Figure 5.
Bivariate scatter plots of NO₃⁻ against the three most correlated parameters: (a) HCO₃⁻ (r = −0.320, p < 0.01); (b) SO₄²⁻ (r = +0.324, p < 0.01); (c) Cl⁻ (r = +0.267, p < 0.05). Red circles: samples exceeding WHO limit (n = 15); grey circles: compliant samples. The red dashed horizontal line marks 50 mg/L. OLS trend lines are shown. Substantial scatter is evident in all three panels, consistent with the modest correlation magnitudes.
Figure 5.
Bivariate scatter plots of NO₃⁻ against the three most correlated parameters: (a) HCO₃⁻ (r = −0.320, p < 0.01); (b) SO₄²⁻ (r = +0.324, p < 0.01); (c) Cl⁻ (r = +0.267, p < 0.05). Red circles: samples exceeding WHO limit (n = 15); grey circles: compliant samples. The red dashed horizontal line marks 50 mg/L. OLS trend lines are shown. Substantial scatter is evident in all three panels, consistent with the modest correlation magnitudes.
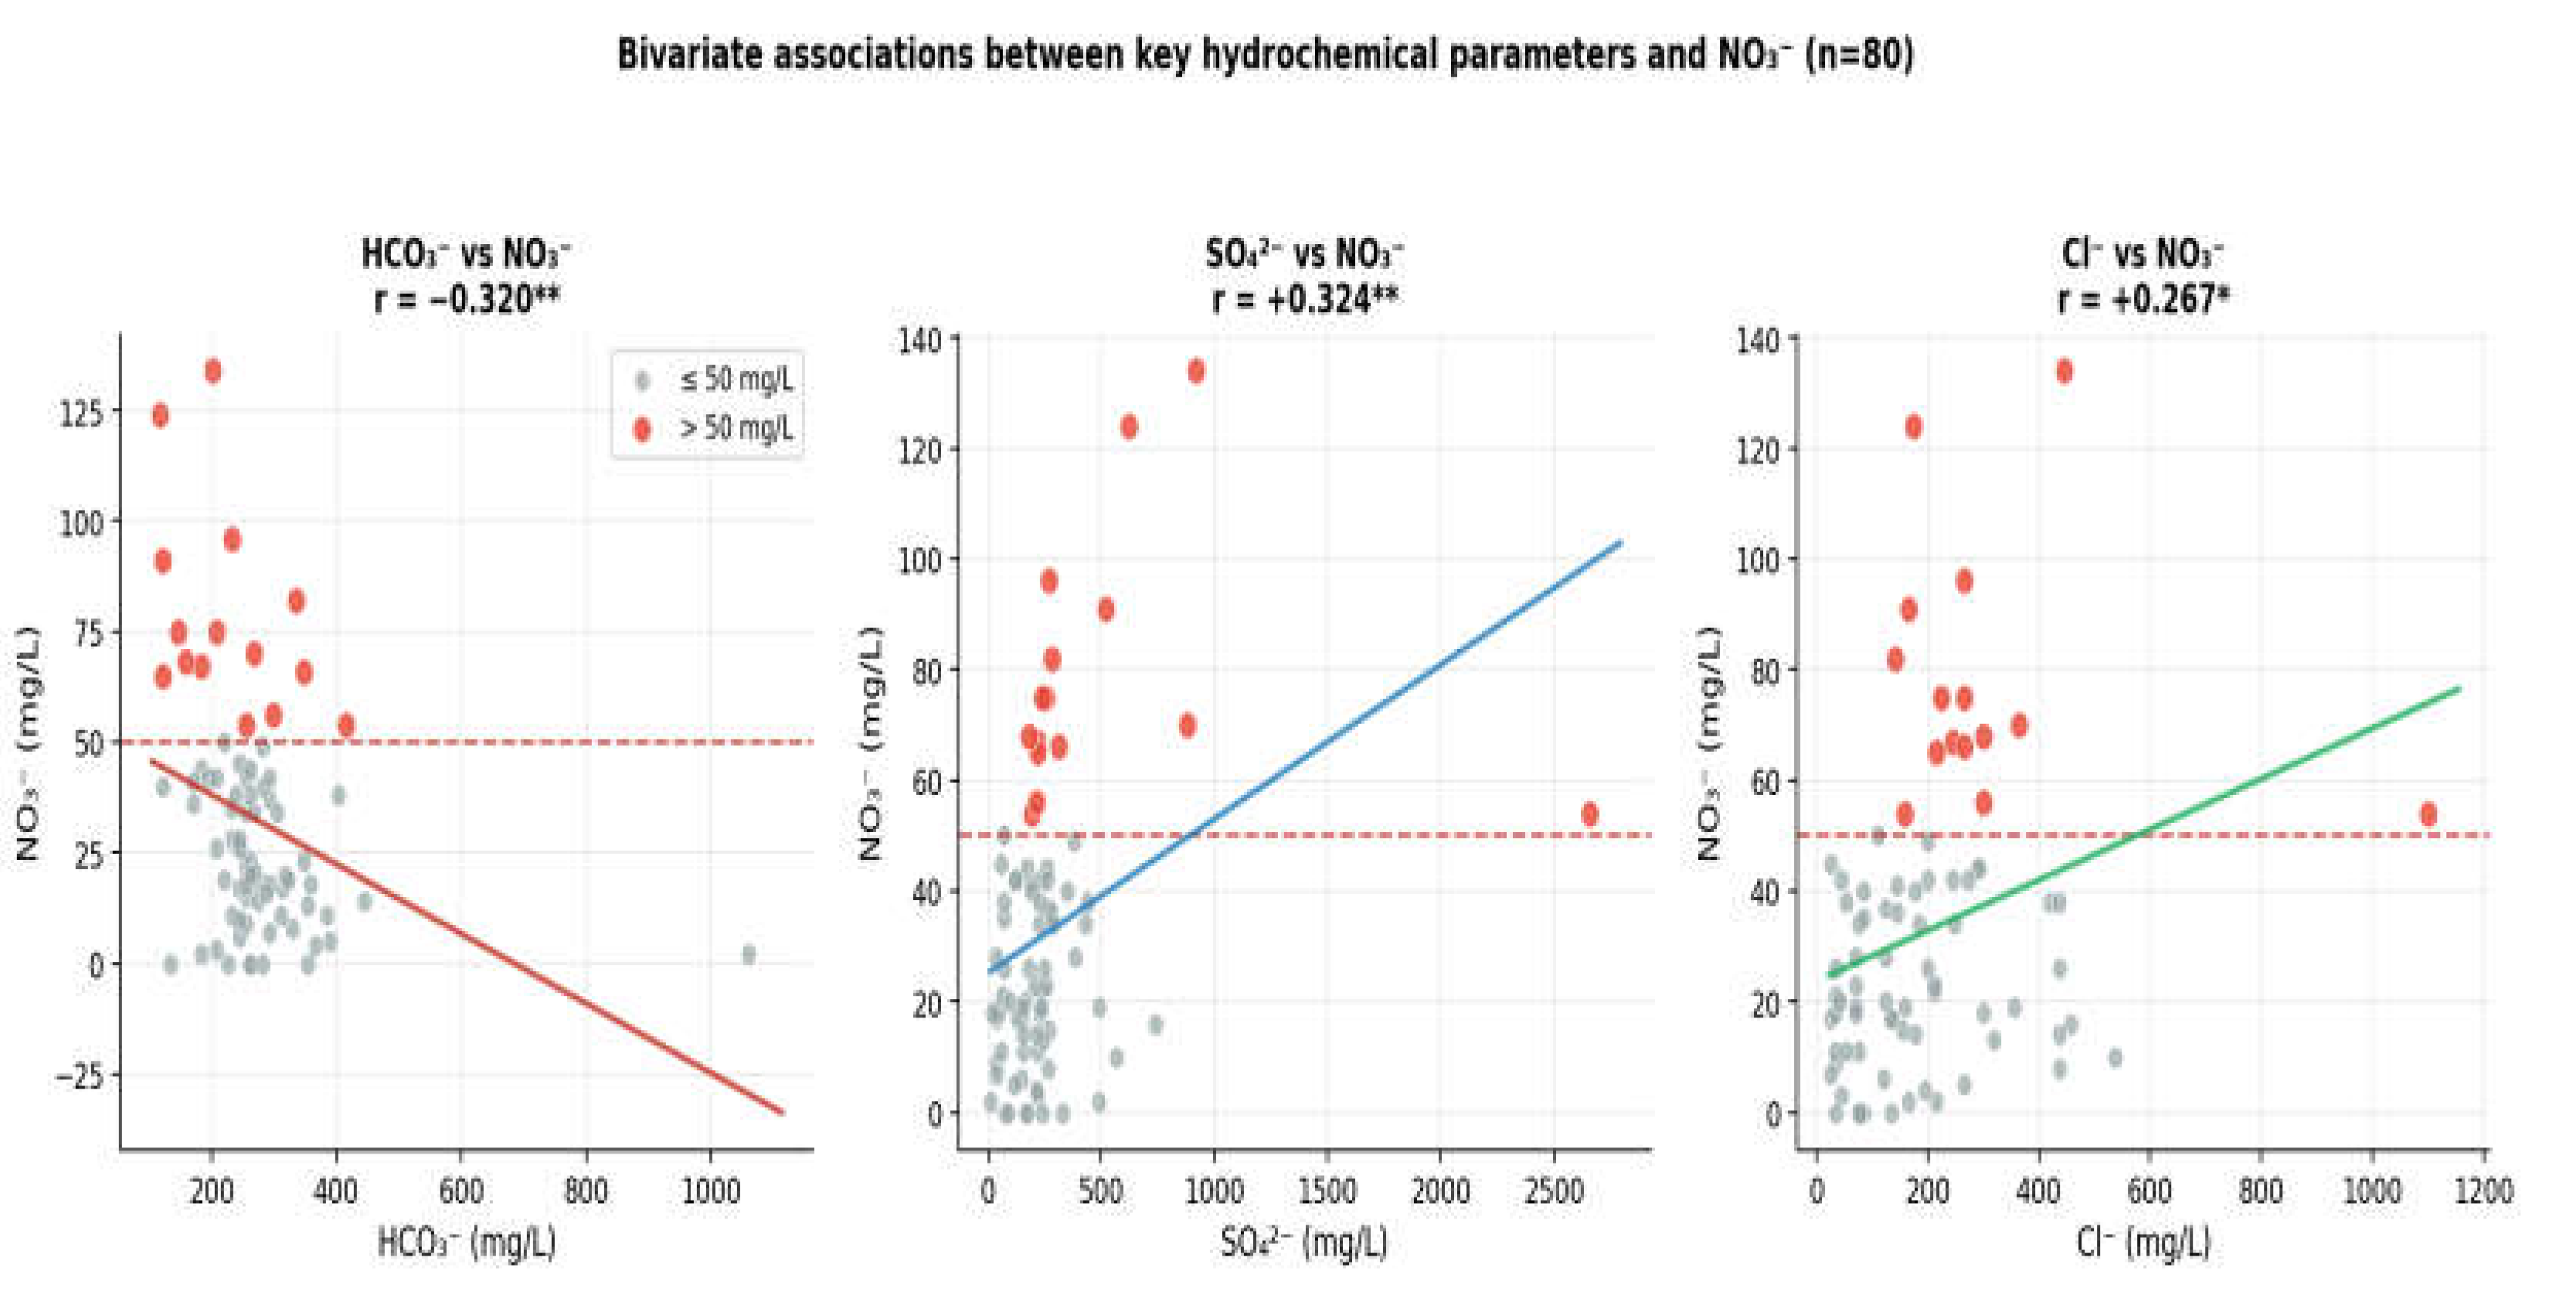
Figure 6.
WQI distribution across the 80 groundwater samples. (a) Donut chart with the mean WQI at centre; (b) bar chart of sample counts per class. Twelve and a half percent of samples are classified as Unsuitable for drinking (WQI > 100). The highest WQI values are driven by geogenic mineralisation rather than by nitrate in many samples; WQI and NO₃⁻ exceedance represent complementary but distinct aspects of water quality.
Figure 6.
WQI distribution across the 80 groundwater samples. (a) Donut chart with the mean WQI at centre; (b) bar chart of sample counts per class. Twelve and a half percent of samples are classified as Unsuitable for drinking (WQI > 100). The highest WQI values are driven by geogenic mineralisation rather than by nitrate in many samples; WQI and NO₃⁻ exceedance represent complementary but distinct aspects of water quality.
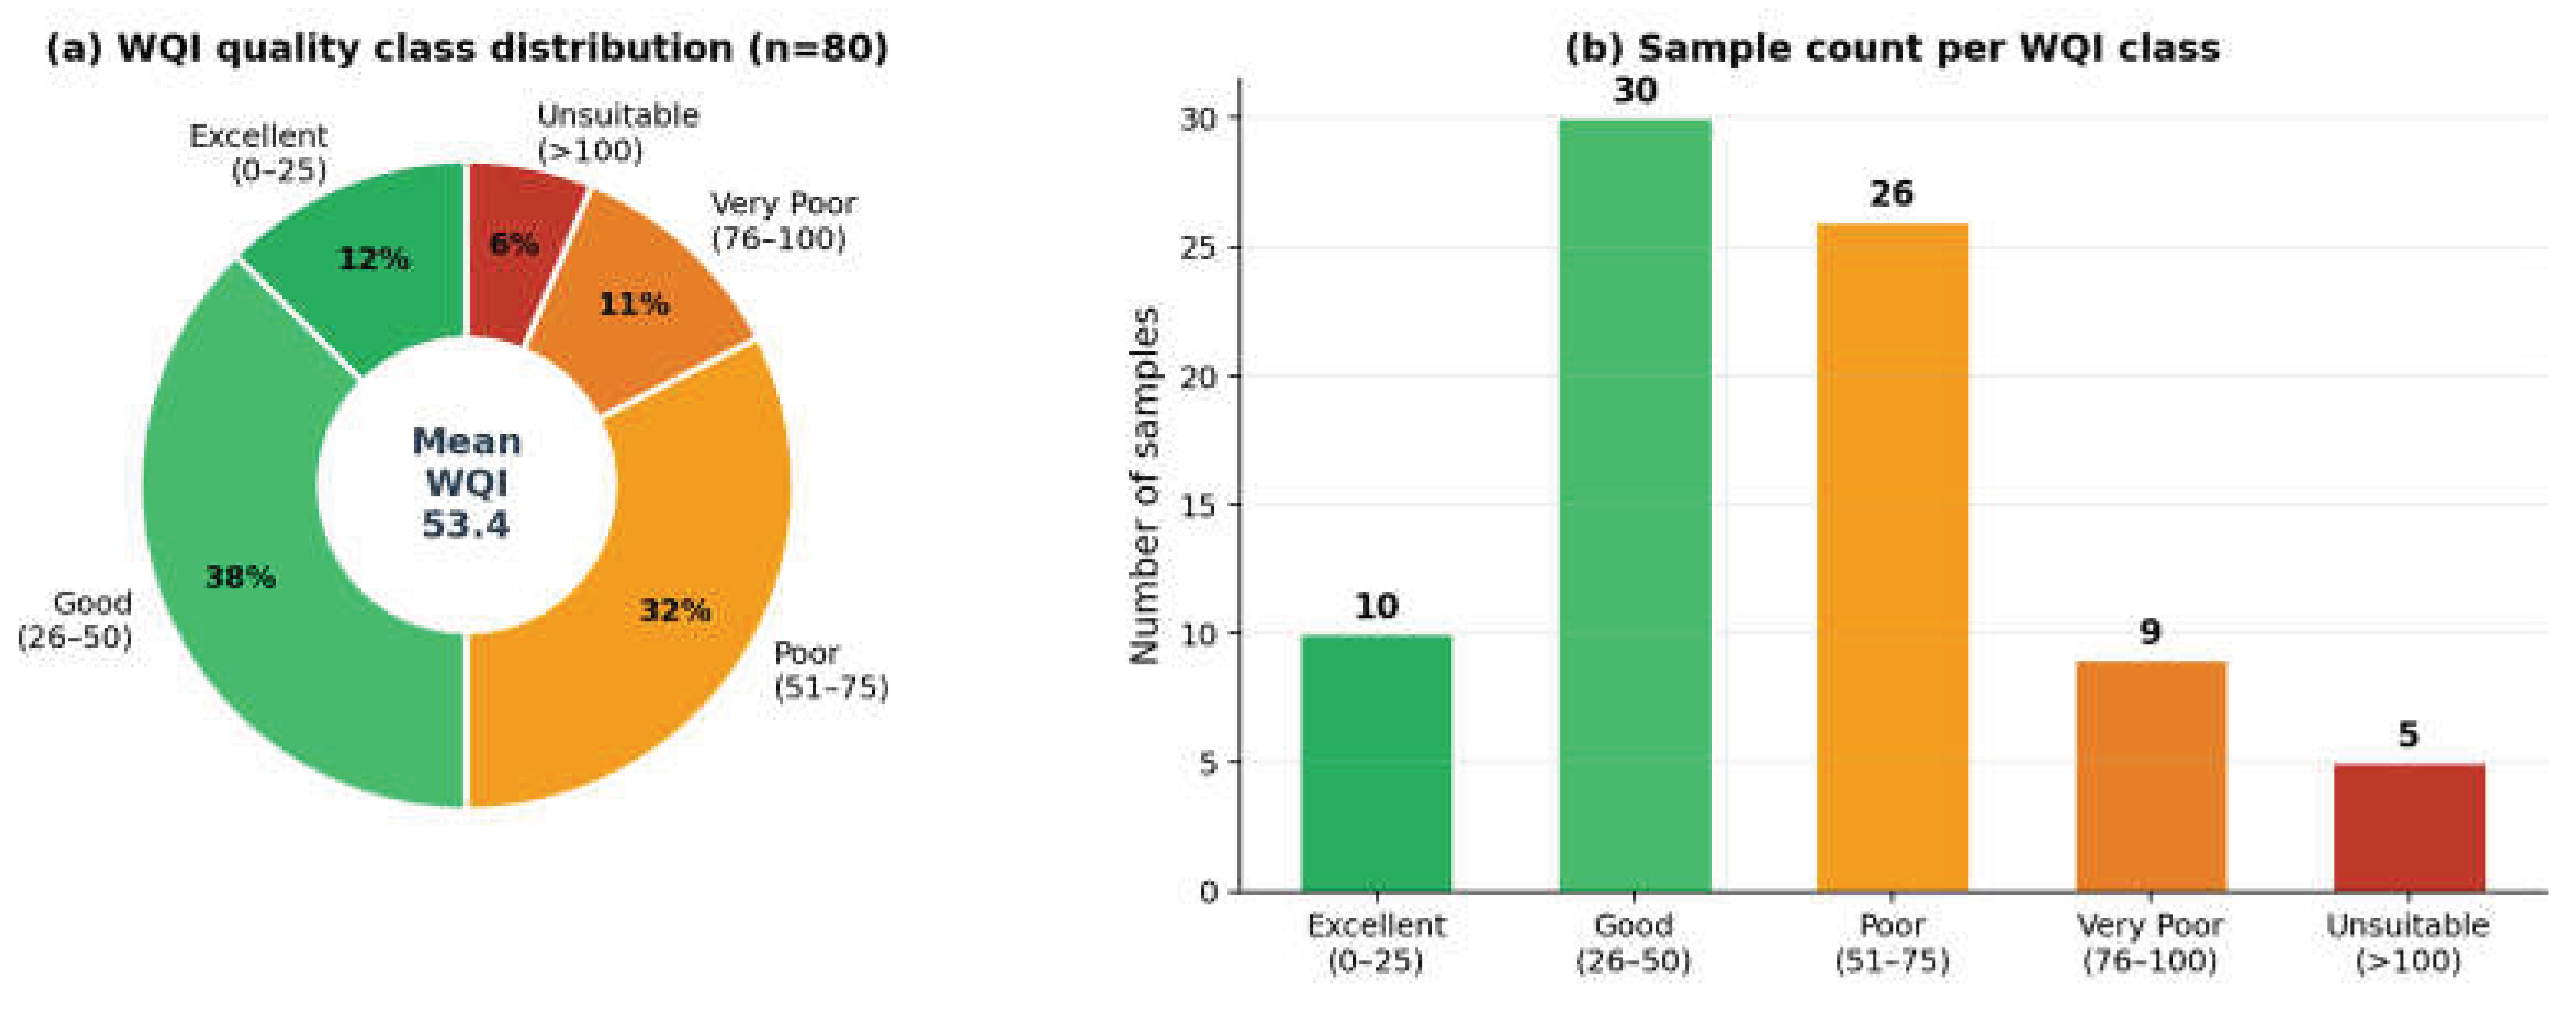

Table 1.
Descriptive statistics for 12 physicochemical parameters in 80 groundwater samples from the Garet Tarf plain. SD = standard deviation. WHO (2017) guideline values are shown for reference.
Table 1.
Descriptive statistics for 12 physicochemical parameters in 80 groundwater samples from the Garet Tarf plain. SD = standard deviation. WHO (2017) guideline values are shown for reference.
| Parameter | Unit | Min | Max | Mean | SD | WHO (2017) | % Exceeding |
|---|---|---|---|---|---|---|---|
| HCO₃⁻ | mg/L | 116 | 1061 | 270.2 | 113.2 | — | — |
| SO₄²⁻ | mg/L | 12 | 2660 | 266.6 | 323.1 | 250 | 11.3 |
| Cl⁻ | mg/L | 25 | 1100 | 195.0 | 162.2 | 250 | 7.5 |
| Ca²⁺ | mg/L | 52 | 720 | 147.3 | 98.9 | 200 | 2.5 |
| Mg²⁺ | mg/L | 12 | 427 | 51.2 | 49.7 | 150 | 1.3 |
| Na⁺ | mg/L | 14 | 680 | 96.1 | 86.9 | 200 | 1.3 |
| K⁺ | mg/L | 0.01 | 24 | 1.94 | 4.06 | 12 | 0 |
| NO₃⁻ | mg/L | 0 | 134 | 32.6 | 27.7 | 50 | 18.8 |
| EC | µS/cm | 164 | 6710 | 766.5 | 820.9 | 1500 | 8.8 |
| pH | — | 6.5 | 8.0 | 7.24 | 0.31 | 6.5–8.5 | 0 |
| TDS | mg/L | 107 | 4362 | 498.2 | 533.6 | 1000 | 6.3 |
| WQI | — | 12.6 | 203.3 | 53.4 | 32.6 | <100 | 12.5 |
Table 2.
Classification of NO₃⁻ concentrations in the 80 groundwater samples into contamination risk categories.
Table 2.
Classification of NO₃⁻ concentrations in the 80 groundwater samples into contamination risk categories.
| NO₃⁻ Range (mg/L) | n | % | Risk Category |
|---|---|---|---|
| Undetected (= 0) | 6 | 7.5 | No contamination detected |
| 0.1–10 | 10 | 12.5 | Background / natural level |
| 10–25 | 23 | 28.8 | Low — possible anthropogenic influence |
| 25–50 | 26 | 32.5 | Moderate — approaching WHO limit |
| > 50 (WHO exceedance) | 15 | 18.8 | High — unsuitable for drinking |
Table 3.
Hydrochemical facies identified by Piper diagram analysis and associated mean NO₃⁻ concentrations (n = 80). Possible processes are inferred from regional lithological analogies and should be regarded as indicative.
Table 3.
Hydrochemical facies identified by Piper diagram analysis and associated mean NO₃⁻ concentrations (n = 80). Possible processes are inferred from regional lithological analogies and should be regarded as indicative.
| Hydrochemical Facies | n | % Total | Mean NO₃⁻ (mg/L) | Possible Process |
|---|---|---|---|---|
| Ca²⁺–SO₄²⁻ | 37 | 46.3 | 34.5 | Possibly gypsum/anhydrite dissolution |
| Ca²⁺–HCO₃⁻ | 22 | 27.5 | 36.8 | Consistent with carbonate weathering, recharge |
| Ca²⁺–Cl⁻ | 20 | 25.0 | 27.1 | Possibly evolved groundwater or halite input |
| Na⁺+K⁺–Cl⁻ | 1 | 1.3 | 14.0 | Possibly cation exchange; single sample only |
| Total / Mean | 80 | 100 | 32.6 | — |
Table 4.
Pearson correlation coefficients between physicochemical parameters and NO₃⁻ in the 80 groundwater samples from the Garet Tarf plain.
Table 4.
Pearson correlation coefficients between physicochemical parameters and NO₃⁻ in the 80 groundwater samples from the Garet Tarf plain.
| Predictor | r with NO₃⁻ | p-value | Significance |
|---|---|---|---|
| HCO₃⁻ | −0.320 | < 0.01 | Significant (negative) |
| SO₄²⁻ | +0.324 | < 0.01 | Significant (positive) |
| EC | +0.304 | < 0.01 | Significant (positive) |
| Na⁺ | +0.279 | < 0.05 | Significant (positive) |
| Ca²⁺ | +0.275 | < 0.05 | Significant (positive) |
| K⁺ | +0.272 | < 0.05 | Significant (positive) |
| Cl⁻ | +0.267 | < 0.05 | Significant (positive) |
| Mg²⁺ | +0.180 | > 0.05 | Not significant |
| pH | +0.110 | > 0.05 | Not significant |
Table 5.
Comparison of three machine learning algorithms evaluated by Minitab® 21 Discover Best Model using out-of-bag (OOB) statistics. RMSE and MAD are reported only for the selected model (Random Forests®). MAPE is not reported (see Section 3.6).
Table 5.
Comparison of three machine learning algorithms evaluated by Minitab® 21 Discover Best Model using out-of-bag (OOB) statistics. RMSE and MAD are reported only for the selected model (Random Forests®). MAPE is not reported (see Section 3.6).
| Model | OOB R² (%) | RMSE (mg/L) | MAD (mg/L) | Notes |
|---|---|---|---|---|
| Random Forests® ★ | 16.36 | 25.21 | 19.12 | Highest OOB R² among evaluated models |
| MARS® | 5.49 | — | — | RMSE and MAD not reported by software for non-selected models |
| TreeNet® | 0.00 | — | — | No variance explained |
Table 6.
Hyperparameters of the Random Forests® model applied in this study.
| Hyperparameter | Value / Setting |
|---|---|
| Bootstrap trees | 300 |
| Training sample size | 80 (full dataset) |
| Predictors per split (m) | √9 ≈ 3 |
| Min. internal node size | 8 observations |
| Model selection criterion | Maximum OOB R² (5-fold CV) |
| Error estimation | Out-of-Bag (OOB) |
Disclaimer/Publisher’s Note: The statements, opinions and data contained in all publications are solely those of the individual author(s) and contributor(s) and not of MDPI and/or the editor(s). MDPI and/or the editor(s) disclaim responsibility for any injury to people or property resulting from any ideas, methods, instructions or products referred to in the content. |
© 2026 by the authors. Licensee MDPI, Basel, Switzerland. This article is an open access article distributed under the terms and conditions of the Creative Commons Attribution (CC BY) license (http://creativecommons.org/licenses/by/4.0/).
Copyright: This open access article is published under a Creative Commons CC BY 4.0 license, which permit the free download, distribution, and reuse, provided that the author and preprint are cited in any reuse.