

Submitted:
03 September 2026
Posted:
04 September 2026
You are already at the latest version
Abstract
Transcriptomic signatures of immune checkpoint blockade (ICB) response often exhibit limited transportability across independent cohorts, while privacy constraints restrict pooling of pa-tient-level transcriptomic data across institutions. We evaluated whether federated learning (FL) with record-level differential privacy (DP) could predict ICB response across heterogeneous cohorts and whether a pre-specified PD-L1-trafficking module added predictive signal beyond an inter-feron-γ (IFN-γ) signature. Five public ICB cohorts (four anti-PD1 melanoma and one anti-PD-L1 urothelial cohort) were treated as federated sites. Logistic regression was trained using FedAvg and FedProx with per-example DP-SGD and cumulative Rényi DP accounting. The evaluation was conducted through leave-one-cohort-out external validation against a matched centralized non-private reference. The mean area under the receiver operating characteristic curves (AUROCs) were modest, ranging from approximately 0.56 to 0.61, and remained broadly stable across the privacy budgets evaluated. Specifically, for the combined feature set, mean AUROC was 0.561 without DP and 0.573 at ε = 1. The IFN-γ module provided the strongest predictive signal (≈0.61), whereas trafficking alone performed near chance (≈0.49), and combining the modules did not im-prove overall discrimination (≈0.56). These results support the feasibility of privacy-preserving federated ICB-response prediction despite significant cross-cohort heterogeneity. DRG2 exhibited a directionally consistent positive contribution across full-cohort and melanoma-only analyses, which persisted in a sensitivity analysis that additionally modeled upstream recycling regulators, including RAB5A, concordant with its established role in endosomal PD-L1 recycling and anti-PD-1 response.
Keywords:
federated learning
; differential privacy
; immune checkpoint blockade
; membrane traf-ficking
; immunotherapy response
; transcriptomics
; PD-L1 trafficking
; interferon-γ
; precision oncology
; cross-cohort generalization
; machine learning
1. Introduction
Immune checkpoint blockade has transformed the treatment of melanoma [1,2,3,4], urothelial carcinoma [5], and other malignancies [6], yet many patients derive limited or no lasting benefit, motivating extensive efforts to develop transcriptomic biomarkers of response [7]. Signatures including IFN-γ-related T-cell-inflamed gene-expression profiles and composite tumor-immune scores have been associated with ICB response, although their performance varies across cohorts [8].
Two limitations recur. First, predictors that appear informative within a single study frequently lose accuracy when transferred to an independent cohort, reflecting cohort-specific biological, technical, and distributional differences across institutions and assay platforms. These differences create a non-identically distributed (non- IID) learning setting. Second, patient- level genomic and clinical data are governed by privacy regulations and institutional data-use agreements that constrain the centralized pooling on which most predictive models depend. Federated learning, which trains a shared model across sites [9,10] while exchanging model updates rather than patient- level data, and differential privacy, which formally limits information leakage about individual records [11,12], directly address these constraints. Both approaches have been applied in oncology, particularly in medical imaging [13,14], but their application to ICB-response prediction from public transcriptomics remains comparatively underexplored.
One trafficking regulator, Developmentally Regulated GTP-binding protein 2 (DRG2), has been shown to control endosomal recycling of PD-L1 to the cell surface via regulation of Rab5, such that loss of DRG2 traps PD-L1 in endosomes, reduces surface PD-L1, and confers resistance to anti-PD-1 therapy in melanoma models [15]. Because this mechanism operates through the early-endosomal GTPase Rab, we additionally evaluate DRG2 alongside RAB5A and other recycling regulators in a pre-specified sensitivity analysis, to test whether its contribution is robust to inclusion of its upstream effector.
A complementary mechanistic gap concerns interpretability. Surface PD-L1 (CD274) abundance, the direct target of anti- PD-L1 therapy, is determined not only by transcriptional regulation downstream of IFN-γ but also by post-translational trafficking and degradation [16]. CMTM6 and CMTM4 protect PD-L1 from lysosomal degradation [17,18] while endosomal recycling machinery, including Rab GTPases [19,20], sorting nexins, and the retromer [21], contributes to its trafficking to the cell surface. Whether transcripts encoding this trafficking machinery carry predictive signals for ICB response beyond canonical inflammation has not, to our knowledge, been tested.
Distributed and federated approaches to immuno-oncology biomarker discovery have recently been demonstrated across public and private cohorts, showing that models can be developed without centralizing patient- level data [22]. However, these approaches have primarily focused on federated or distributed modeling without formal differential privacy, leaving an important gap in understanding whether predictive performance can be maintained under explicit privacy guarantees. In addition, most prior approaches have emphasized high-dimensional signature discovery using flexible machine-learning models, providing limited mechanistic resolution of individual features. Two questions therefore remain: whether ICB- response prediction is preserved under formal differential privacy with cumulative privacy accounting, and whether a pre-specified, mechanistically motivated feature set can be interrogated at coefficient-level resolution under these constraints.
Here, we develop and evaluate a federated, differentially private classifier of ICB response across five public transcriptomic cohorts [1,2,3,4,5] treated as federated sites. We use an interpretable linear model to test whether a pre-specified PD-L1 trafficking feature module carries predictive information complementary to a canonical IFN-γ signature. The cohorts occupy a distinct region of expression space (Figure 1), indicating substantial cross-cohort heterogeneity and motivating evaluation under a non-IID federated setting. We frame the study as a feasibility and privacy-utility evaluation across heterogeneous cohorts and report the trafficking-versus-inflammation comparison as a pre-specified, hypothesis-driven analysis without assuming that the PD-L1 trafficking module will improve predictive performance.
2. Materials and Methods
2.1. Cohorts
Five publicly available ICB transcriptomic cohorts with RECIST-annotated response assessments were used (Table 1), comprising four anti-PD-1 melanoma cohorts and one anti-PD-L1 urothelial cohort. Each cohort was treated as an independent federated client. The primary endpoint was uniformly dichotomized as clinical benefit, defined as complete response, partial response, or stable disease, versus progressive disease, using the available RECIST response category for each point. No duration criterion was imposed; therefore, the endpoint represents the best RECIST response category rather than durability of clinical benefit.
2.2. Feature Harmonization and Gene Modules
Gene features were restricted to the common set available across the five cohorts and mapped to standardized gene symbols with an alias resolution, including CD274/PD-L1. Three pre-specified feature sets were evaluated: a PD-L1-trafficking module (CD274, CMTM6, CMTM4, DRG2, RAB11A, RAB8A, SNX1, SNX2, SNX27, VPS35; 10 genes), an IFN-γ-related module (IFNG, STAT1, CXCL9, CXCL10, IDO1, HLA-DRA; 6 genes), and their combination. As a pre-specified secondary sensitivity analysis, the trafficking module was extended with six additional endosomal-recycling regulators (RAB5A, SNX6, TRAPPC4, VPS26A, VPS29, RAB4A), each motivated by the PD-L1 trafficking literature and confirmed present in all five cohorts, to test whether the directional contribution of DRG2 was robust to inclusion of its upstream effector RAB5A and related recycling machinery. This extended module was analyzed separately and did not replace the primary 10-gene panel.
Expression was first harmonized to log2(x+1) within each cohort using the available measurement scale (FPKM for Hugo and Riaz, TPM for Gide and Liu, CPM for IMvigor210). Values were standardized within each cohort (z-scored per gene) using cohort-local means and standard deviations, estimated from expression values only and never from response labels; no cross-site normalization statistics were shared. For each training cohort, normalization parameters were estimated from the model-fitting partition and applied to its held-out calibration partition; for externally held-out cohorts, cohort-local standardization was performed using that cohort’s expression alone without access to response labels. Principal component analysis (PCA) was performed on the pooled standardized expression matrix for descriptive visualization of cross-cohort expression structure and heterogeneity.
2.3. Model
To isolate the effects of federated and differentially private training, the centralized reference and federated models use the same logistic-regression specification. The federated model optimized L2-regularized weights using DP-SGD with Adam as the optimizer, whereas the centralized reference model selected the regularization strength by five-fold cross-validation on the model-fitting partition. The centralized model therefore served as a rigorously tuned, data-centralized comparator rather than a theoretical upper bound. Because the model is linear, its fitted coefficients provide a directly interpretable feature-attribution layer without requiring post-hoc explanation methods.
2.4. Federated Training
Federated training used the Flower framework with FedAvg, and FedProx to accommodate non-IID data [9,10,23]. Each communication round comprised local training on each client followed by model-weight aggregation; training used 15 communication rounds with five local epochs per round (batch size 8, learning rate 0.005, weight decay 1 × 10⁻⁴). The FedProx proximal coefficient was fixed at μ = 0.1 across cohorts and experimental conditions. Models were evaluated using leave-one- cohort-out external validation, with training performed on the remaining cohorts and evaluation on the held-out cohort, approximating deployment at a previously unseen site.
2.5. Differential Privacy Accounting
Record-level (per-example) differential privacy was implemented using DP-SGD with Opacus [11,24], in which per-patient gradients are clipped to a maximum L2 norm of 1.2 and perturbed with Gaussian noise. The resulting guarantee therefore protects individual patient records within each cohort rather than whole-cohort participation. Because each client participates across communication rounds, privacy loss was composed over the full training trajectory (5 local epochs × 15 rounds = 75 local passes per client). For each target cumulative privacy budget, a single noise multiplier was calibrated using the Opacus Rényi differential privacy (RDP) [12,25] accountant to achieve that budget over the full trajectory, and this multiplier was then held fixed across all rounds; reported ε values therefore represent cumulative privacy budgets rather than per-round values. In the DP training path, Opacus uses Poisson sampling, consistent with the sampling assumptions of the RDP accountant. Each federated configuration was repeated using five independent random seeds. We evaluated cumulative privacy budgets of ε = 1, 2, 4, 8, and 10, with ε = ∞ representing the non-private condition; δ was fixed at 10 -5 for each cohort, below 1/NK for all cohorts.
2.6. Evaluation, Thresholding, and Performance Metrics
Discrimination was quantified using AUROC and AUPRC (with cohort responder prevalence as the prevalence-based no-skill reference for AUPRC), calibration was assessed using the Brier score and reliability curves, and threshold-dependent classification performance was quantified using MCC and F1 [26,27]. To avoid selecting the operating threshold on data used for model fitting, the development cohorts were partitioned using stratified sampling into a model-fitting partition and a held-out calibration partition. The Youden operating threshold was selected on the calibration partition before application to the external held-out cohort. Ninety-five percent confidence intervals were obtained by bootstrap resampling with 1000 replicates.
2.7. Statistical Analysis
The federated model was compared with the centralized reference by paired bootstrap differences in AUROC (ΔAUROC) with 95% confidence intervals, and as a parametric complement, the DeLong tests for two correlated AUROCs [26,27,28]. Because several cohorts are small, DeLong p-values are reported alongside, not in place of, the bootstrap intervals and are interpreted with due caution regarding statistical power; per-cohort, DeLong p-values are provided in the supplementary table S1 and S2. The comparison assessing whether the trafficking module adds signal beyond IFN-γ was pre-specified as hypothesis-generating rather than confirmatory. Because confidence intervals are reported across multiple cohorts, privacy budgets, and feature sets, intervals are interpreted with consideration of multiplicity, and conclusions rest on the consistency of trends across the parameter space rather than any single comparison.
2.8. Ablations
Pre-specified ablations compared (i) centralized reference, federated, and within-cohort local baseline training (Figure 3 and Figure 6); (ii) FedAvg versus FedProx (Figure 2 and Figure 3); (iii) the trafficking-only, IFN-γ-only, and combined feature sets (Figure 4 and Figure 5 and 8) and (iv) the full privacy-budget grid (Figure 2 and Figure 8), each evaluated under the leave-one-cohort-out validation.
Figure 2.
Privacy- utility relationship in federated prediction of ICB response. Mean area under the receiver operating characteristic curve (AUROC; solid lines) ± standard deviation (shaded region), across the five independent held-out cohorts and five random seeds, evaluated by leave-one-cohort-out validation. Performance is compared across three pre-specified gene sets: a 10-gene PD-L1-trafficking module [trafficking_only], a 6-gene interferon-gamma module (IFN_gamma_only), and their 16-gene union (Combined). The x-axis is the cumulative differential privacy budget (ε) on a logarithmic scale; small ε denotes stronger privacy. The green and blue lines show differentially private federated models using Federated Averaging (FL_FedAvg) and Federated Proximal (FL_FedProx) aggregations, respectively. The horizontal dashed gray line in each panel indicates the non-private centralized reference trained on pooled data for that feature set. Discrimination is near-flat across the evaluated privacy range, indicating limited utility cost of differential privacy at the budgets tested.
Figure 2.
Privacy- utility relationship in federated prediction of ICB response. Mean area under the receiver operating characteristic curve (AUROC; solid lines) ± standard deviation (shaded region), across the five independent held-out cohorts and five random seeds, evaluated by leave-one-cohort-out validation. Performance is compared across three pre-specified gene sets: a 10-gene PD-L1-trafficking module [trafficking_only], a 6-gene interferon-gamma module (IFN_gamma_only), and their 16-gene union (Combined). The x-axis is the cumulative differential privacy budget (ε) on a logarithmic scale; small ε denotes stronger privacy. The green and blue lines show differentially private federated models using Federated Averaging (FL_FedAvg) and Federated Proximal (FL_FedProx) aggregations, respectively. The horizontal dashed gray line in each panel indicates the non-private centralized reference trained on pooled data for that feature set. Discrimination is near-flat across the evaluated privacy range, indicating limited utility cost of differential privacy at the budgets tested.
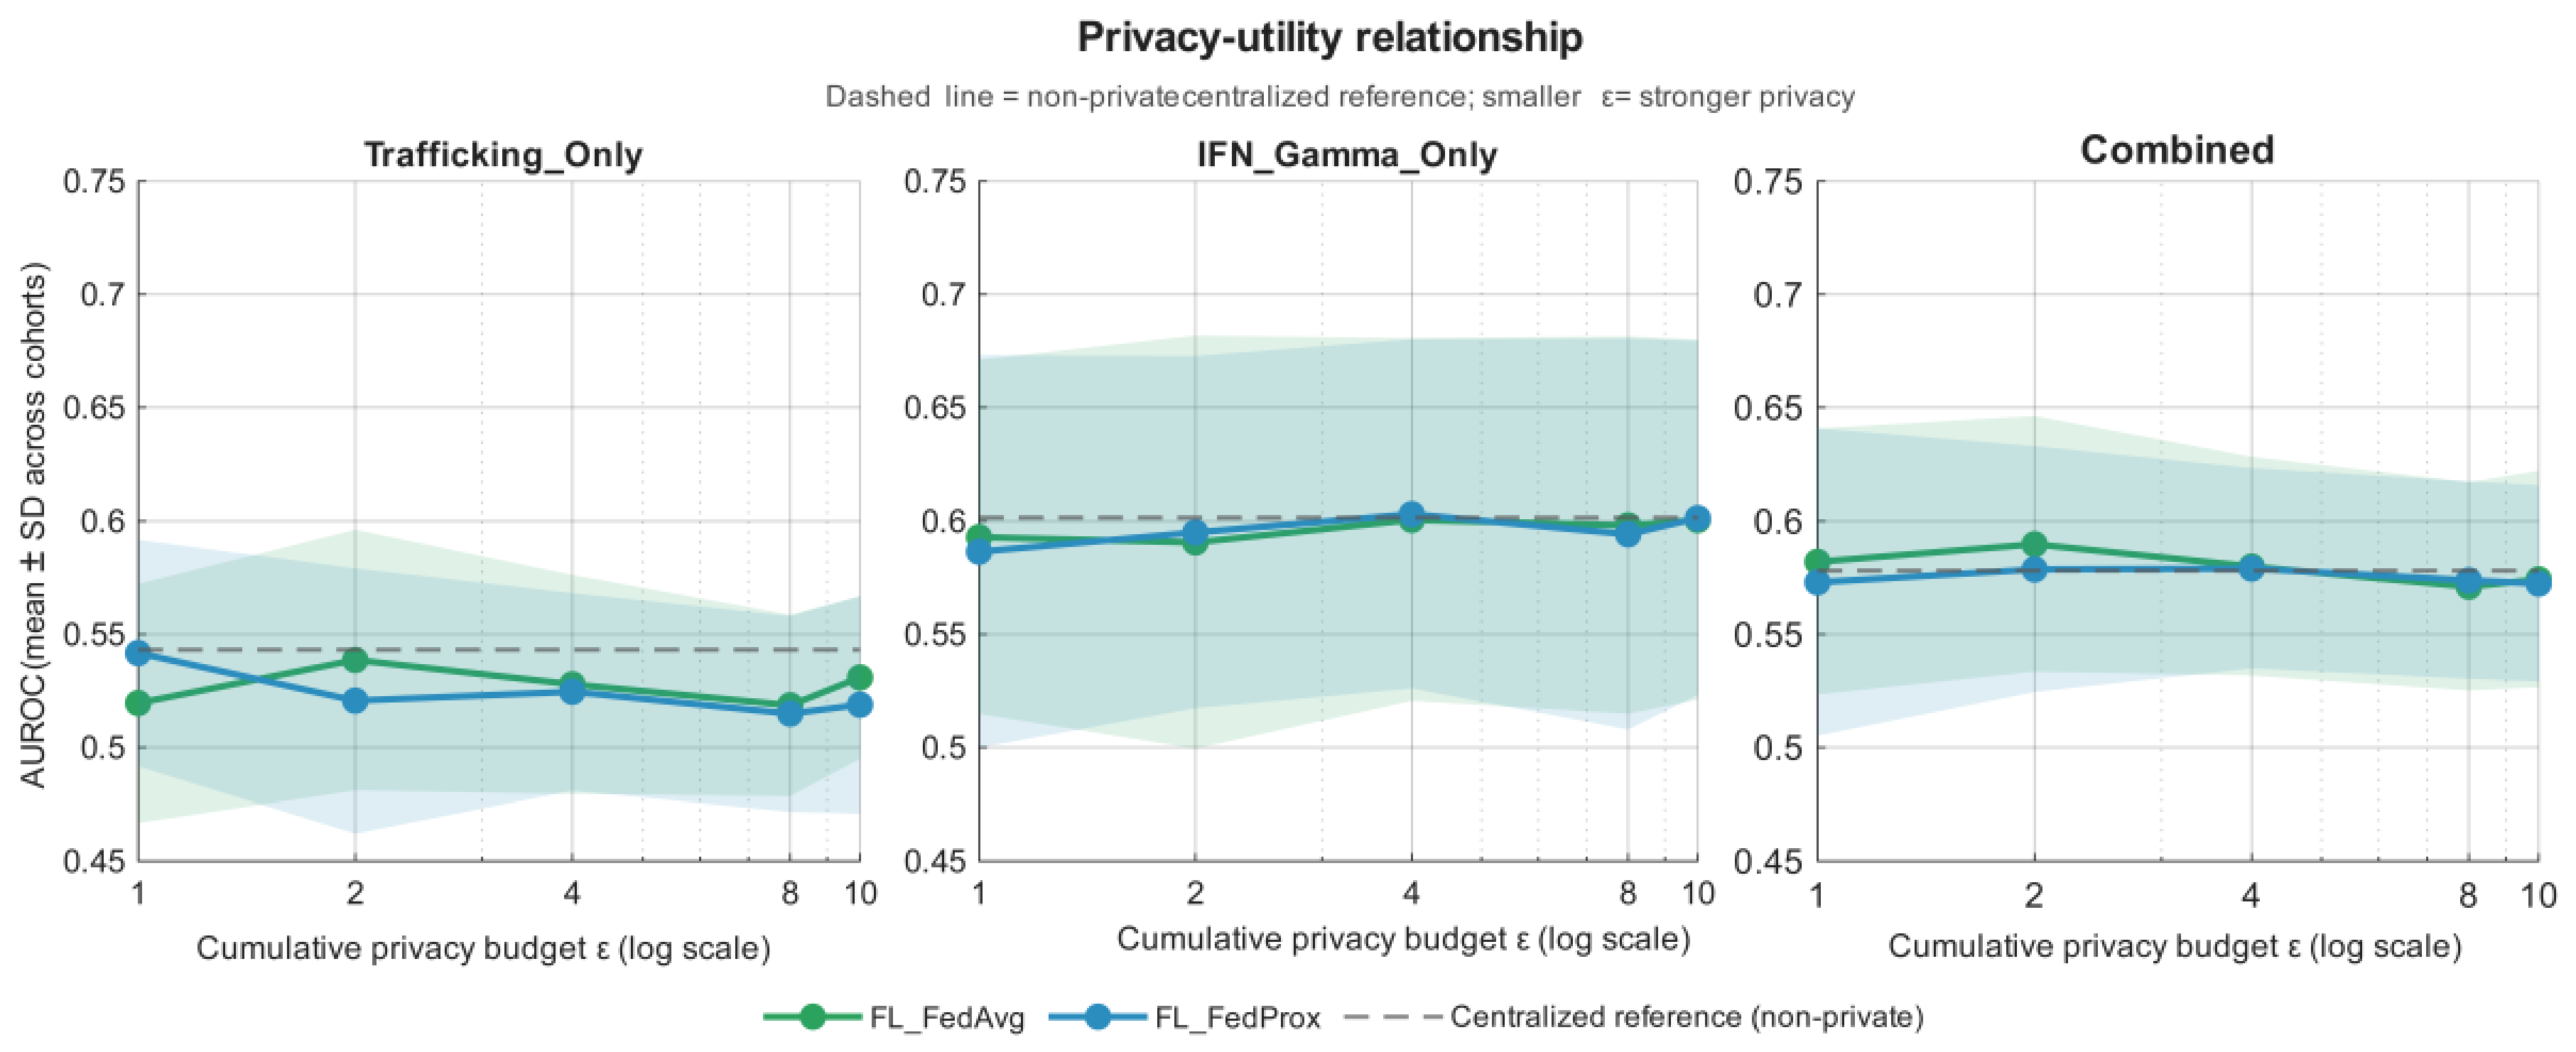
Figure 3.
Performance comparison of local, federated, and centralized models for ICB response prediction. AUROC point estimated with 95% bootstrap confidence intervals (Riaz, Liu, IMvigor210, Hugo, Gide) by leave-one-cohort-out validation. Performance is compared across three pre-specified gene sets: a 10-gene PD-L1-trafficking module (Trafficking only), a 6-gene interferon-gamma module (IFN_gamma_only), and their 16-gene union (Combined). Three training paradigms are contrasted: a within-cohort local baseline trained and evaluated within a single cohort (Within_Cohort_Local_Baseline, grey); a non-private federated model aggregating across cohorts via FedProx (FL_ FedProx, blue); and a centralized reference trained on explicitly pooled data (Centralized_Reference, brown). The centralized model serves as a data-centralized comparator rather than a theoretical upper bound; federated performance was close to it and exceeded it in some cohorts.
Figure 3.
Performance comparison of local, federated, and centralized models for ICB response prediction. AUROC point estimated with 95% bootstrap confidence intervals (Riaz, Liu, IMvigor210, Hugo, Gide) by leave-one-cohort-out validation. Performance is compared across three pre-specified gene sets: a 10-gene PD-L1-trafficking module (Trafficking only), a 6-gene interferon-gamma module (IFN_gamma_only), and their 16-gene union (Combined). Three training paradigms are contrasted: a within-cohort local baseline trained and evaluated within a single cohort (Within_Cohort_Local_Baseline, grey); a non-private federated model aggregating across cohorts via FedProx (FL_ FedProx, blue); and a centralized reference trained on explicitly pooled data (Centralized_Reference, brown). The centralized model serves as a data-centralized comparator rather than a theoretical upper bound; federated performance was close to it and exceeded it in some cohorts.
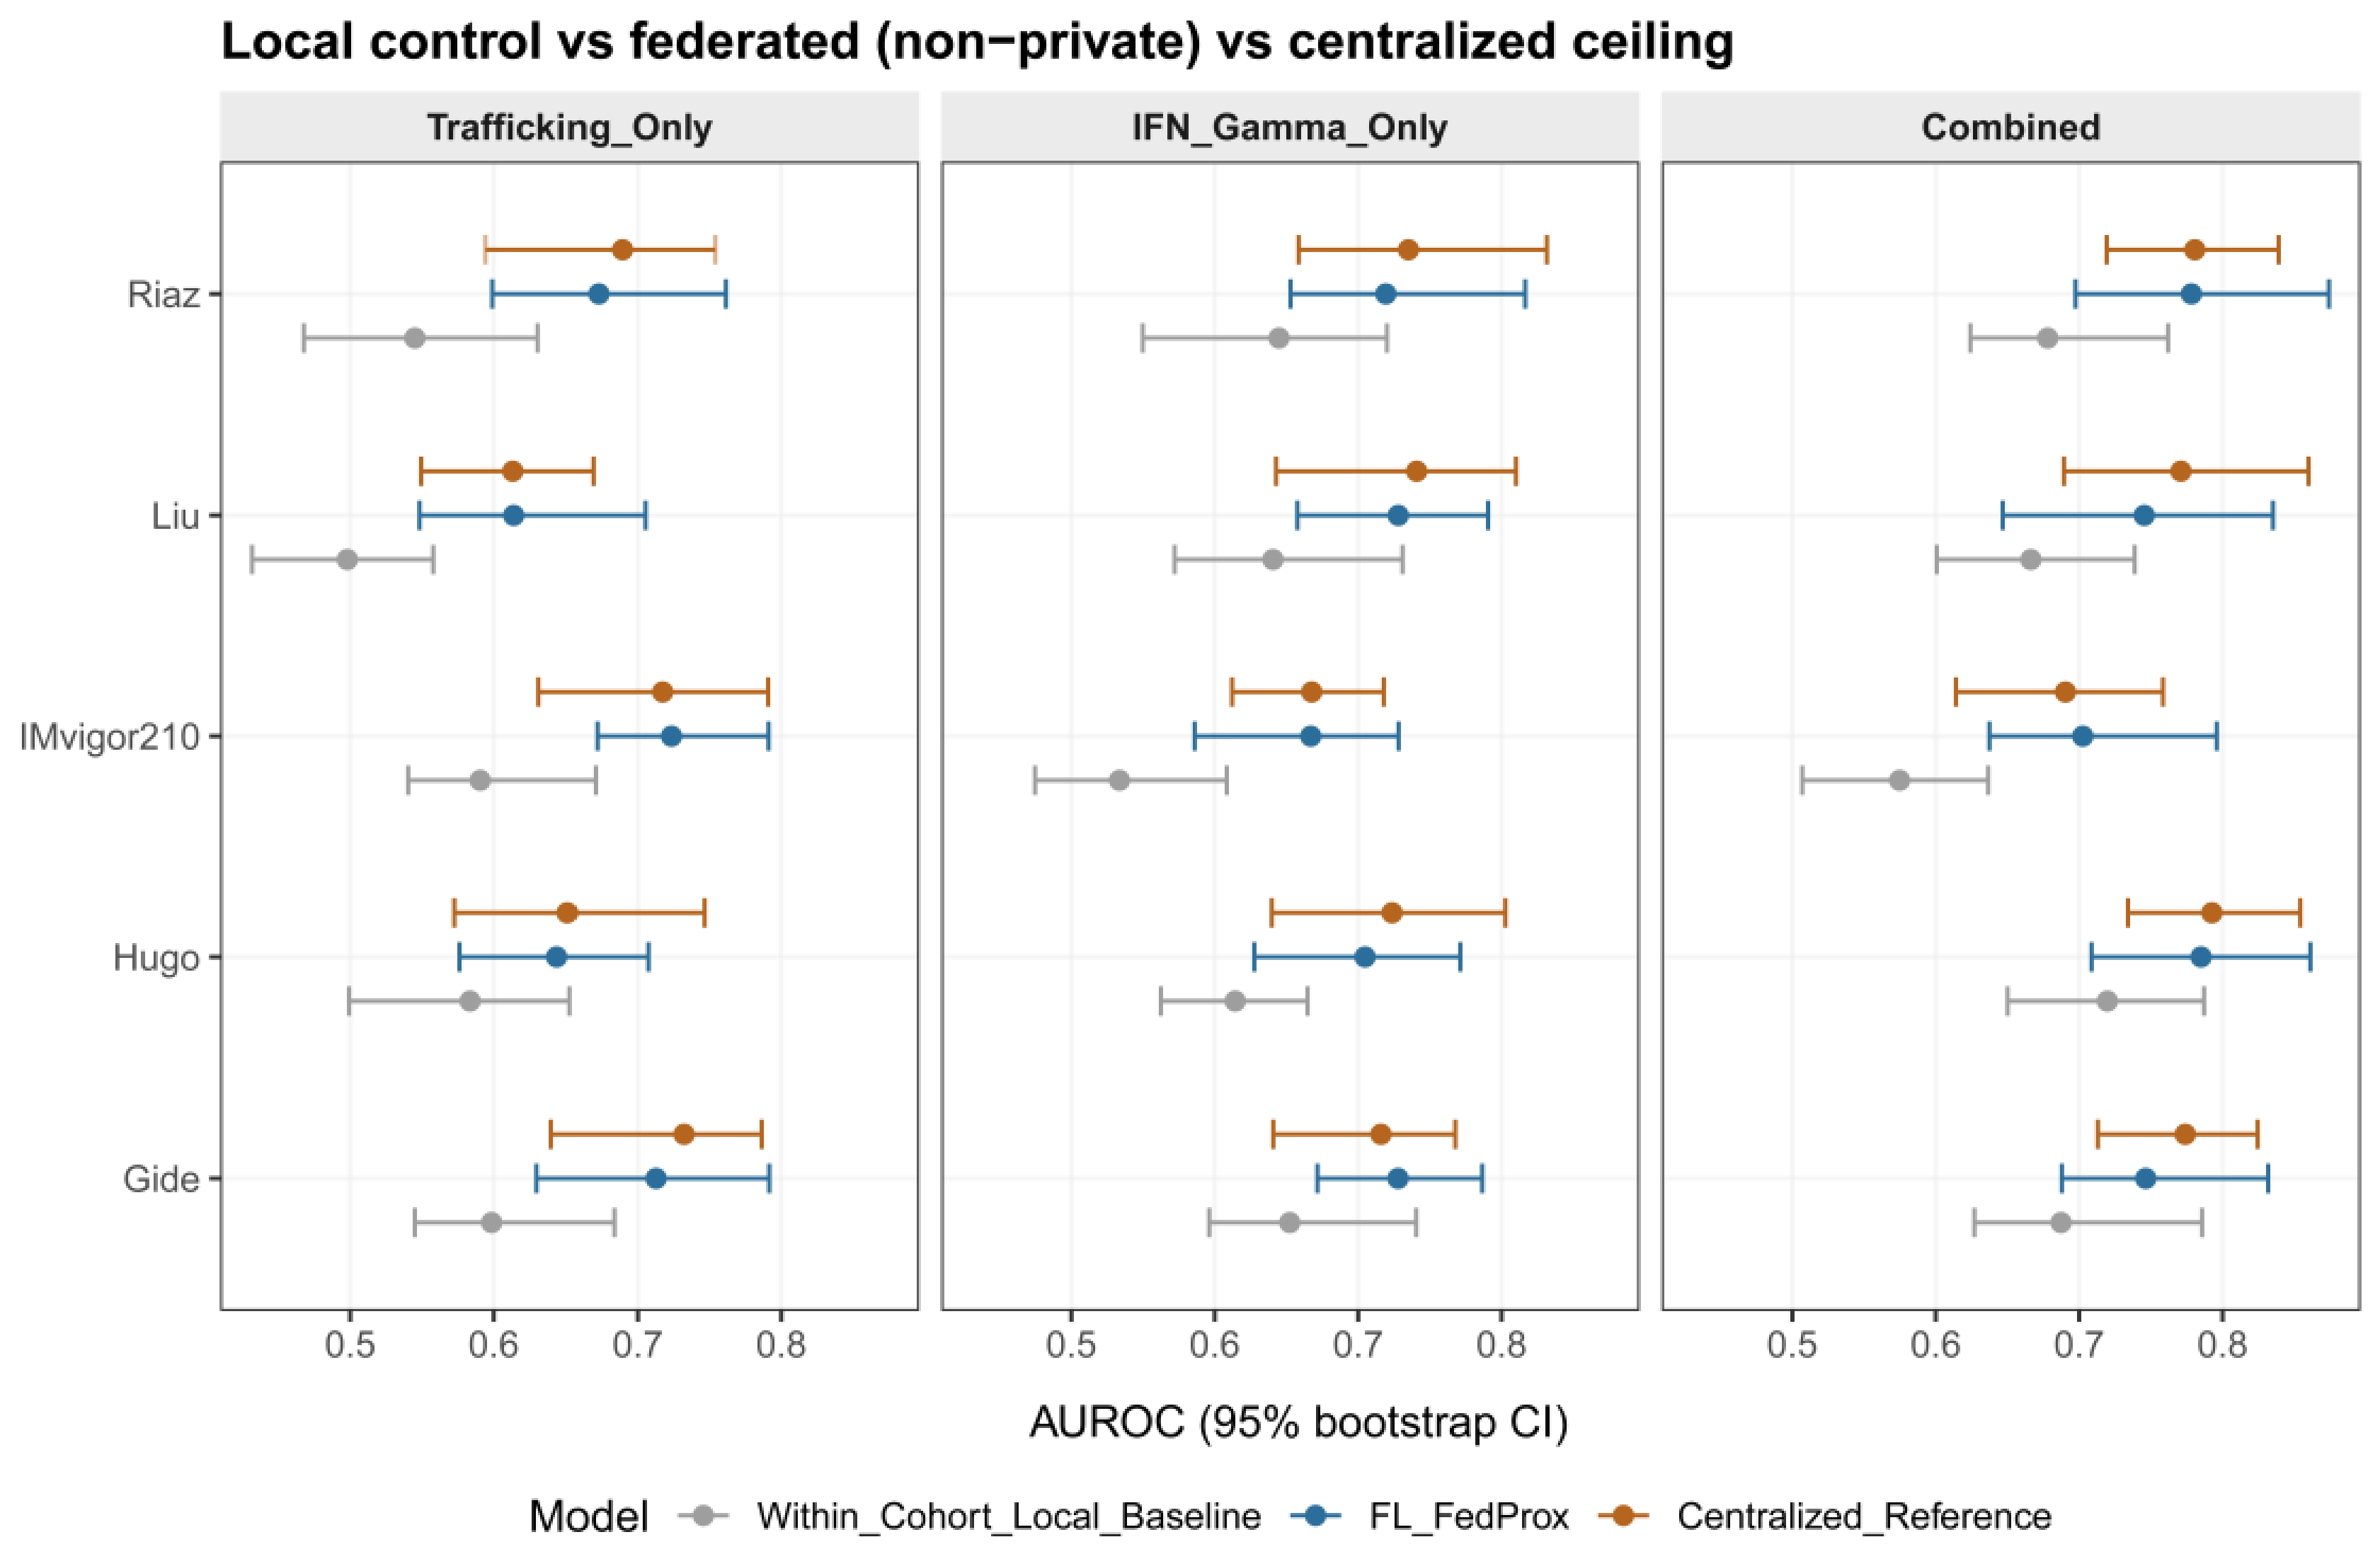
Figure 4.
Biological ablation assessing the predictive contribution of the PD-L1-trafficking module. AUROC Point estimates with 95% confidence intervals of (vertical error bars), evaluated across five independent cohorts (Gide, Hugo, IMvigor210, Liu, Riaz) by leave-one-cohort-out validation. Performance is compared across three pre-specified feature sets: a 10-gene PD-L1-trafficking module alone (Trafficking_only, red), a 6-gene interferon-gamma module alone (IFN_Gamma_only, green), and their 16-gene union (Combined, blue). The ablation isolates the predictive value of each module and tests whether adding the trafficking genes changes the discrimination relative to the IFN-γ module; across cohorts, the trafficking genes did not improve the discrimination over IFN-γ alone.
Figure 4.
Biological ablation assessing the predictive contribution of the PD-L1-trafficking module. AUROC Point estimates with 95% confidence intervals of (vertical error bars), evaluated across five independent cohorts (Gide, Hugo, IMvigor210, Liu, Riaz) by leave-one-cohort-out validation. Performance is compared across three pre-specified feature sets: a 10-gene PD-L1-trafficking module alone (Trafficking_only, red), a 6-gene interferon-gamma module alone (IFN_Gamma_only, green), and their 16-gene union (Combined, blue). The ablation isolates the predictive value of each module and tests whether adding the trafficking genes changes the discrimination relative to the IFN-γ module; across cohorts, the trafficking genes did not improve the discrimination over IFN-γ alone.
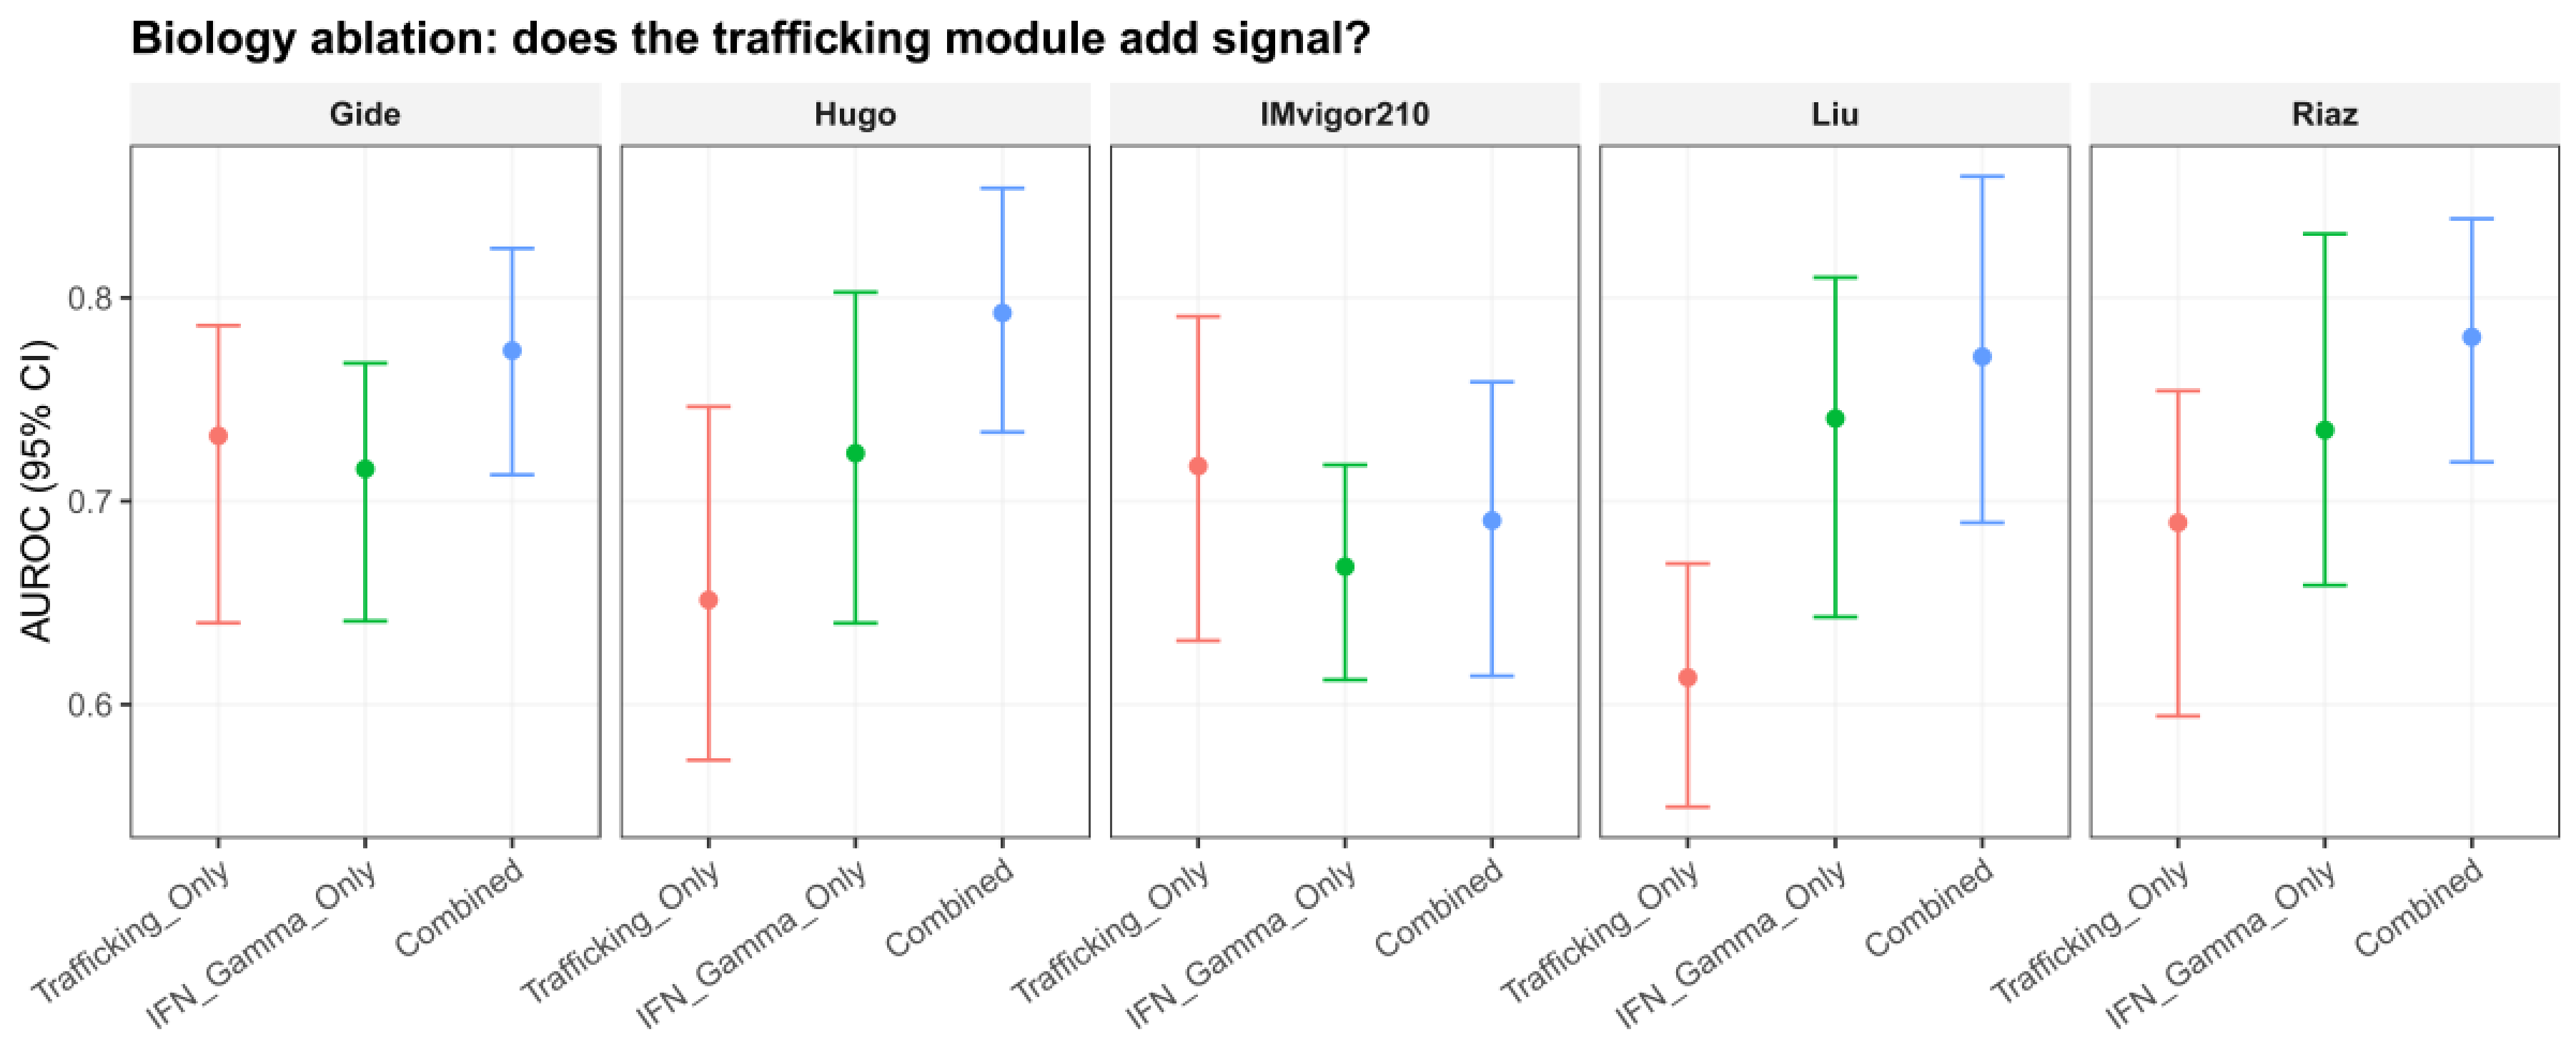
Figure 5.
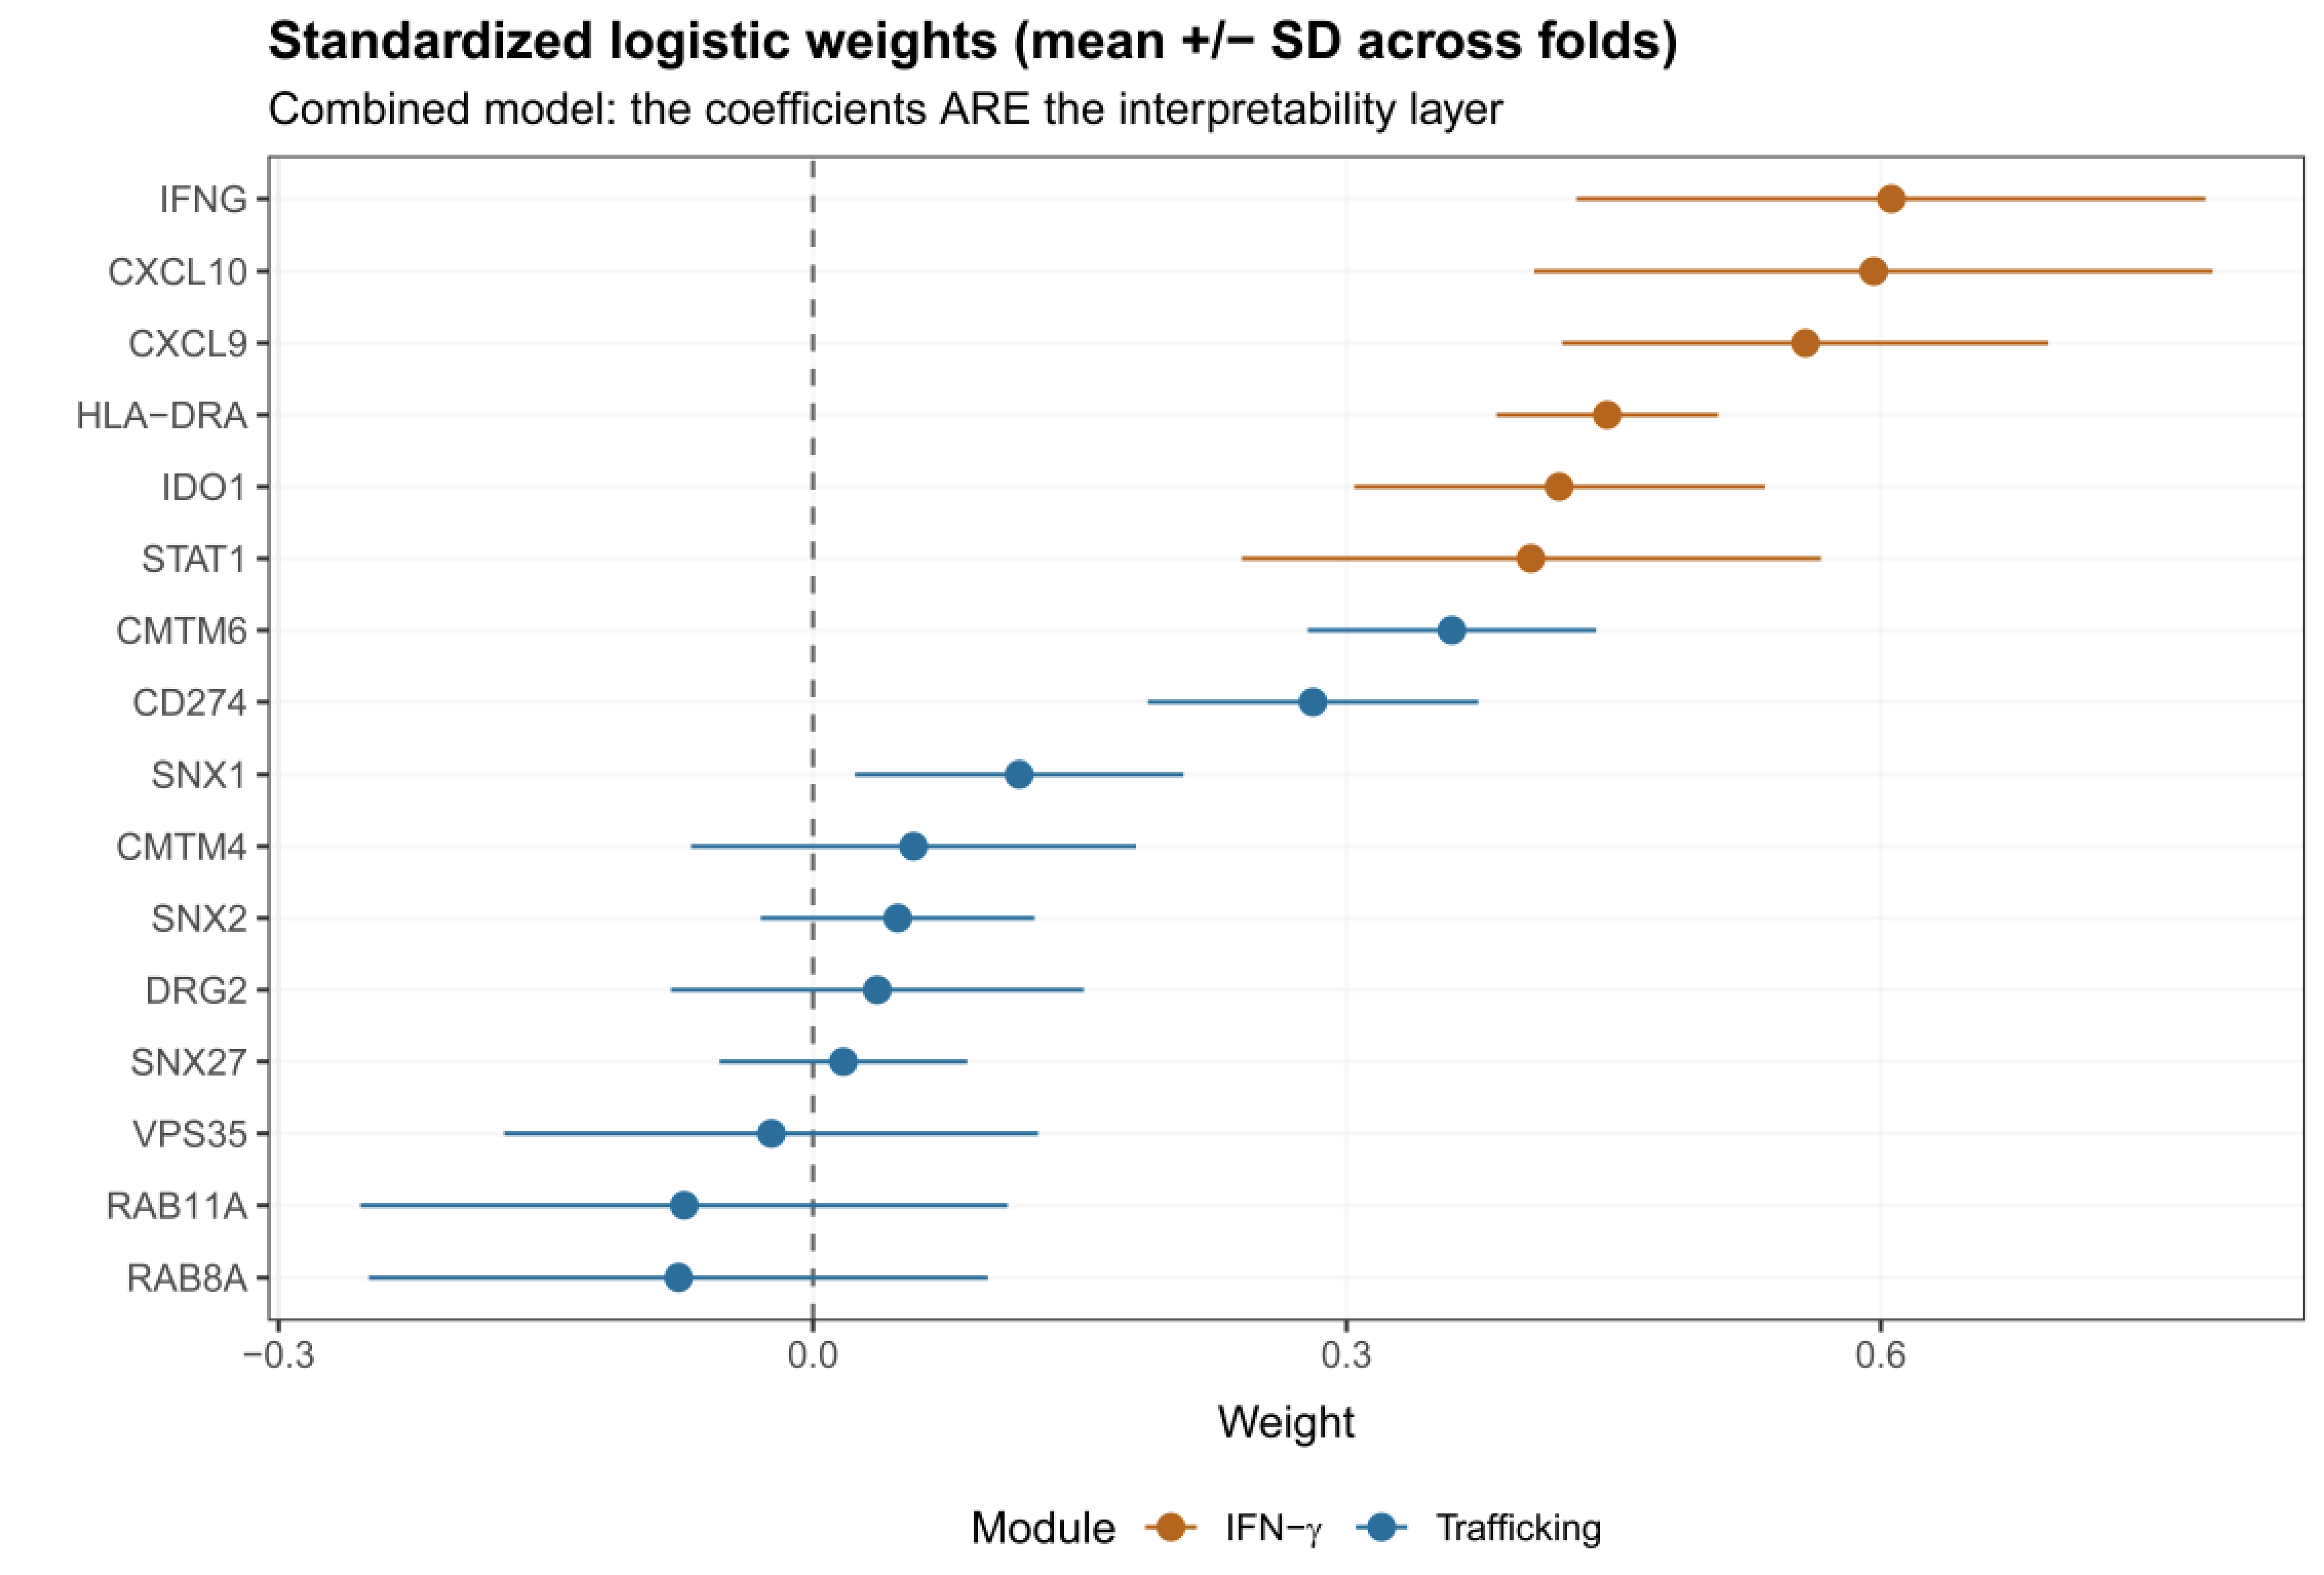
Standardized logistic-regression coefficients for the combined 16-gene model, colored by module. Points are mean standardized coefficients across cross-validation folds; horizontal bars indicate ±SD. Genes are colored by pre-specified module: the 6-gene interferon-γ module (IFN-γ, brown) and the 10-gene PD-L1-trafficking module (Trafficking, blue). The dashed line at zero marks a neutral contribution; weights to the right indicate a positive contribution to predicted response and to the left a negative (anti-predictive) contribution. This figure summarizes coefficient magnitudes; coefficient stability and sign consistency across seeds, folds, and privacy levels are evaluated separately in Figure S1.
Figure 5.
Standardized logistic-regression coefficients for the combined 16-gene model, colored by module. Points are mean standardized coefficients across cross-validation folds; horizontal bars indicate ±SD. Genes are colored by pre-specified module: the 6-gene interferon-γ module (IFN-γ, brown) and the 10-gene PD-L1-trafficking module (Trafficking, blue). The dashed line at zero marks a neutral contribution; weights to the right indicate a positive contribution to predicted response and to the left a negative (anti-predictive) contribution. This figure summarizes coefficient magnitudes; coefficient stability and sign consistency across seeds, folds, and privacy levels are evaluated separately in Figure S1.
2.9. Implementation and Reproducibility
The pipeline was implemented in Python using Flower, Opacus, scikit-learn, and PyTorch; figures were generated using R (ggplot2) or MATLAB v2026a. Each experimental configuration was repeated using five independent random seeds, which were recorded for reproducibility. Code and configuration are provided (see code availability on GitHub) to enable full reproduction, and reporting followed established principles for the transparent development and validation of clinical prediction models [29].
3. Results
3.1. Cohorts and Cross-Cohort Heterogeneity
Principal component analysis of the pooled standardized expression showed partially overlapping, however, distinguishable cohort distributions, with cohort-associated structure along the leading components (Figure 1). As a descriptive characterization of this heterogeneity, rather than a component of the federated prediction pipeline, PERMANOVA on the pooled pre-normalization log2-transformed expression showed that cohort membership explained a substantial fraction of total expression variance (R² = 0.43, 999 permutations, p = 0.001). A homogeneity-of-dispersion test (betadisper, p = 0.06) did not detect a significant difference in within-cohort multivariate dispersion, supporting interpretation of the PERMANOVA results as reflecting cohort-associated separation rather than differences in within-cohort spread. This heterogeneity encompasses biological differences as well as assay-platform and processing differences, including the use of Fragments Per Kilobase of transcript per Million mapped reads (FPKM), Transcripts Per Million (TPM), and Counts Per Million (CPM) measurements, and therefore cannot be attributed to biology alone. Its magnitude nevertheless motivates the federated approach with cohort-local normalization rather than naive cross-cohort pooling.
3.2. Privacy-Utility Relationship
Federated discrimination was largely preserved across the evaluated privacy grid rather than declining monotonically. For the combined feature set, mean AUROC was 0.561 without differential privacy and 0.573, 0.579, 0.579, 0.574, and 0.572 at cumulative ε values of 1,2,4,8, and 10, respectively (Figure 2).
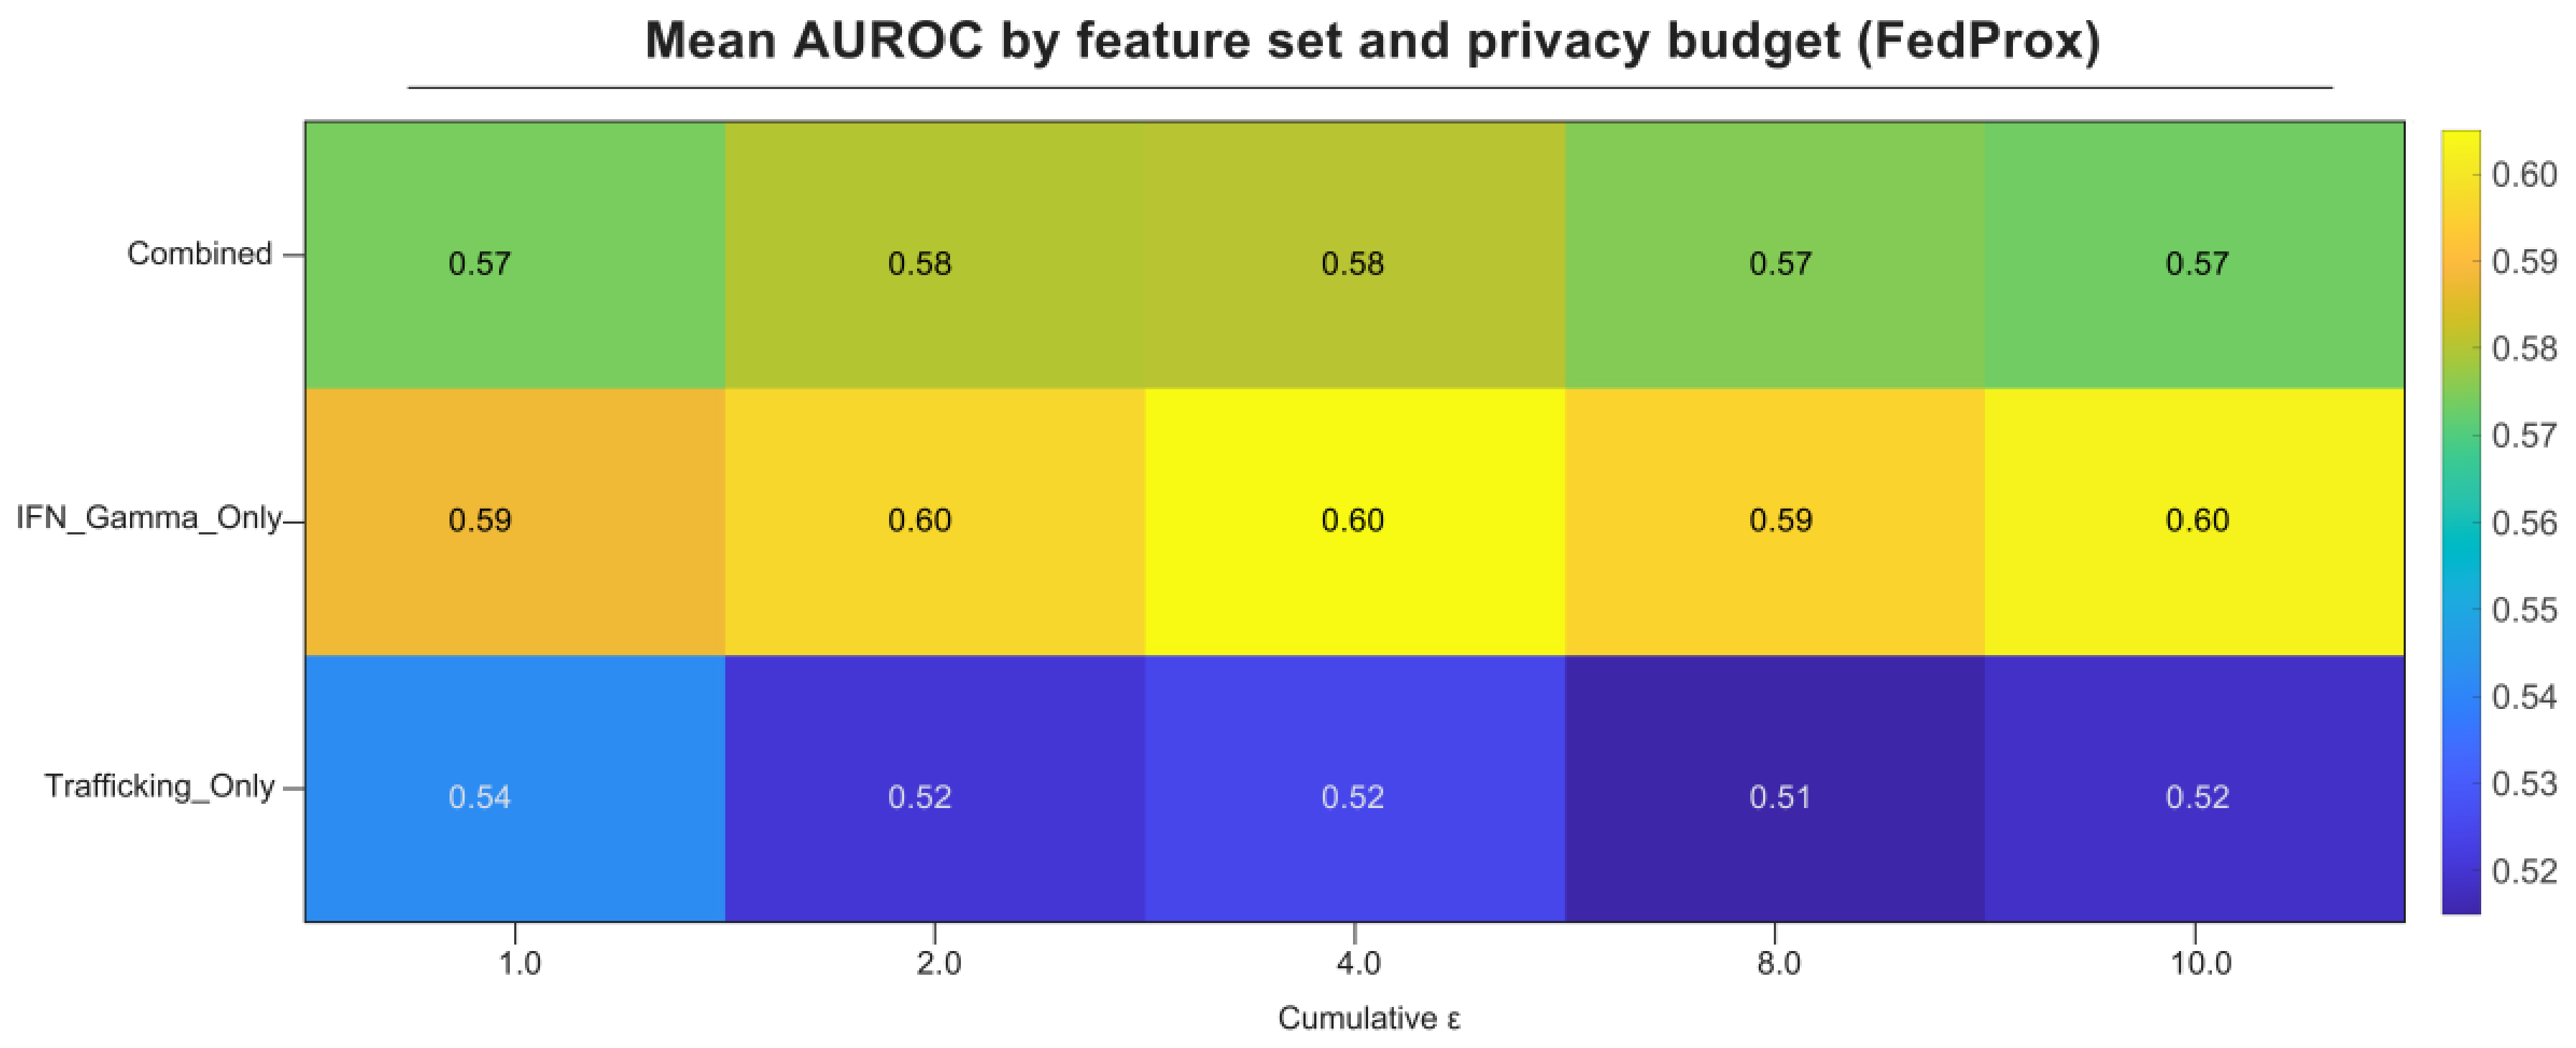
Discrimination was therefore near-flat across the evaluated privacy range, indicating a limited change across the tested privacy budgets; small fluctuations, including marginally higher AUROC at some private budgets than without privacy, are within the range expected from noise at these effect sizes. FedAvg and FedProx also performed similarly under these observed non-IID cohort structures, with non-private combined-module AUROCs of 0.556 and 0.561, respectively. The corresponding feature-set-by-privacy heat map (Figure 7) further showed that the IFN-γ module remained the strongest feature set across the privacy grid, whereas the trafficking-only module remained near chance.
3.3. Federation Versus Baselines
Non- private federated training performed close to the centralized reference and was comparable to or better than within-cohort local baselines in several cohorts, though performance varied substantially by held-outs (Figure 3). The cost of federation, quantified, as ΔAUROC relative to the centralized reference for the combined module, was small and mixed in direction across cohorts: Gide -0.11, IMvigor210 -0.06, Liu -0.02, Riaz +0.02, and Hugo +0.09. Confidence intervals were wide, particularly in the smallest cohorts ( e.g., Hugo, n= 26). DeLong tests comparing each federated model to its within-cohort baseline reached significance only in the largest cohort (IMvigor210) and in no cohort in the melanoma-only sensitivity analysis (supplementary tables S1 and S2), consistent with limited statistical power in the smaller cohorts.
3.4. Biology Ablation; Trafficking Versus IFN-γ
Among the cohorts, the strongest single feature set was IFN-γ, with a mean non-private AUROC of 0.608. The combined 16-gene module did not show improvement, achieving an AUROC of 0.561. The trafficking module alone performed near chance levels, with an AUROC of 0.486 (Figure 4). A melanoma-only sensitivity analysis (excluding the urothelial IMvigor210 cohort) reproduced this ordering (IFN-γ 0.598, combined 0.533, trafficking 0.502), indicating that this ordering was not dependent on inclusion of the urothelial cohort.
Interpreting the coefficients of the combined model (Figure 5 and Figure S1), the IFN-γ chemokine CXCL9 carried by far the largest and most stable positive weight (median 0.442, sign-consistent in 98% of records in the stability analysis; 0.309 in the melanoma-only analysis).
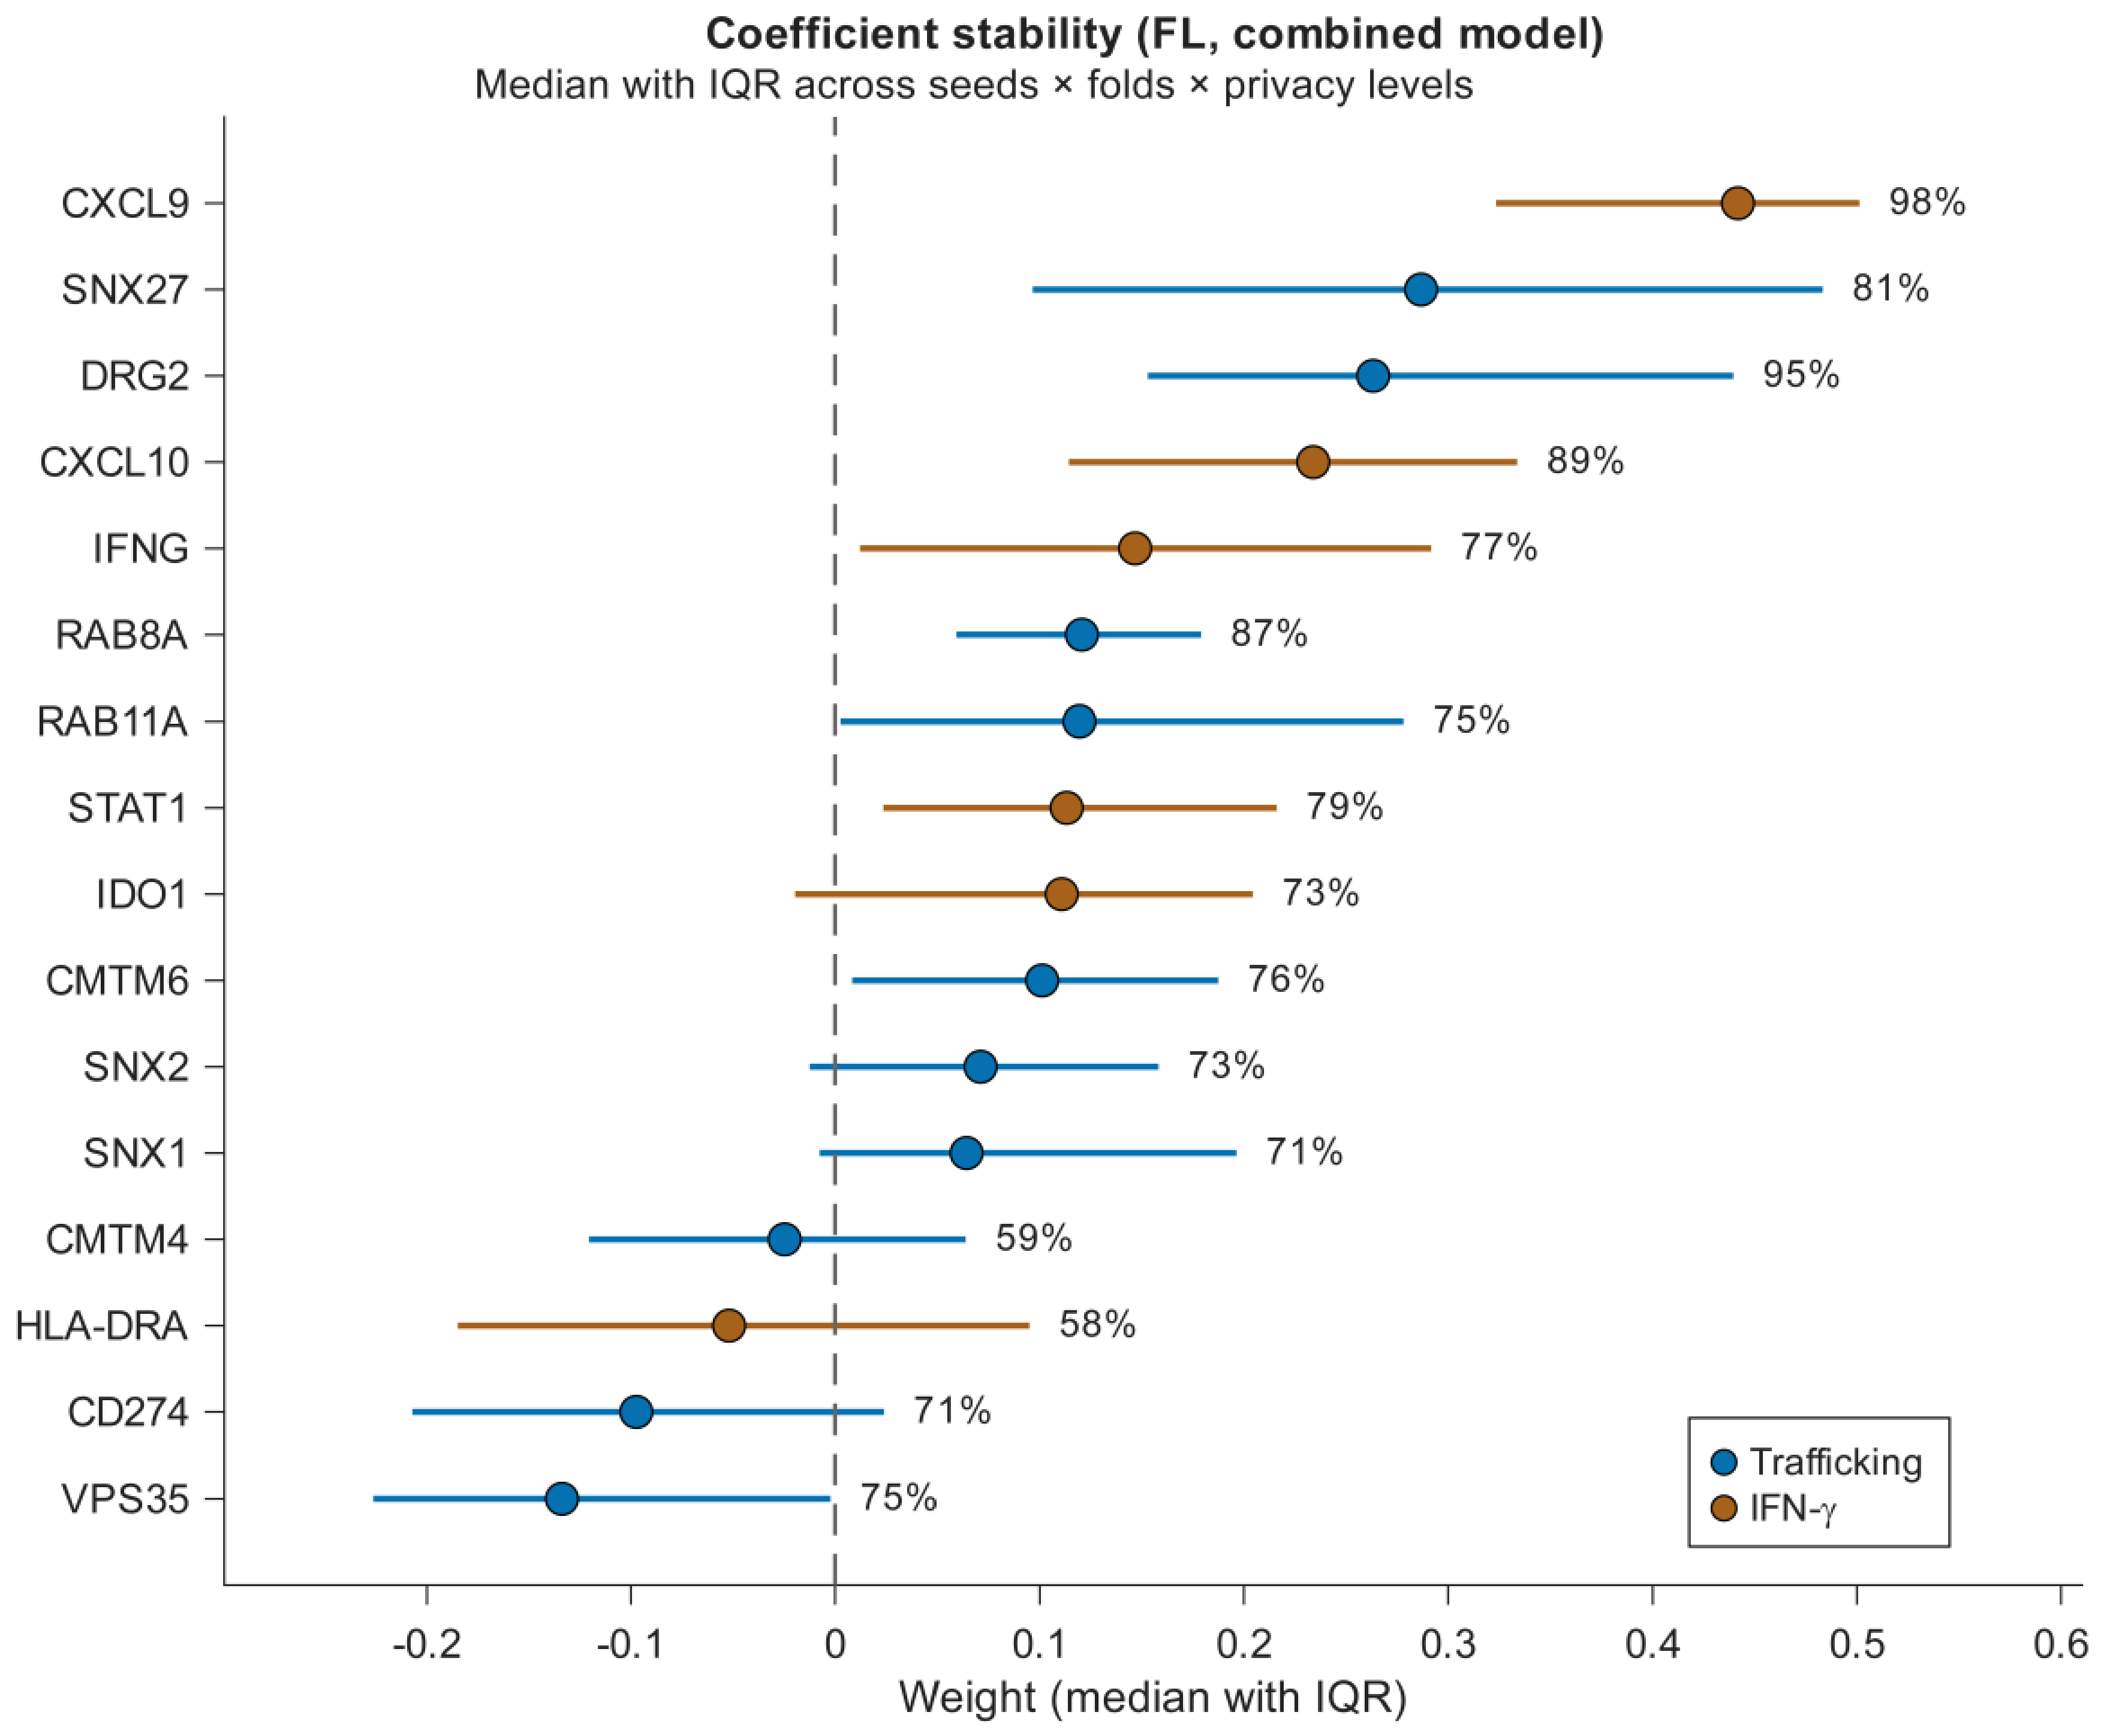
Among trafficking genes, DRG2 was the gene whose positive direction was best preserved across both the full five-cohort and melanoma-only analyses (median coefficient 0.263 and 0.145; sign-consistent in 95% and 82% of records, Figure 8). Other trafficking genes were sign-unstable across cohort compositions: SNX27, positive in the five- cohort model (median 0.287), reversed sign in the melanoma-only analysis (median -0.061), and RAB8A weakened (0.121 to 0.031). CD274 (PD-L1 mRNA) contributed weakly and inconsistently (median -0.097 in the five-cohort model; shifting to a small positive value, +0.026 in the melanoma-only model, Figure S1). These patterns indicate that most of the trafficking module’s apparent coefficient signal was cohort-context-dependent, with DRG2 the main exception.
3.5. Discrimination and Calibration
Receiver-operating-characteristic (ROC) curves for each held-out cohort (Figure 6) and reliability curves comparing non-private and private models (Figure S2) characterize discrimination and calibration, respectively. Calibration was imperfect but largely preserved under privacy; for the combined module, the mean Brier score was 0.271 without differential privacy and 0.280 at ε =1. Threshold-dependent classification performance was correspondingly modest, consistent with the AUROC values: Matthews correlation coefficients were low across the conditions (for example, 0.111 for the combined federated model without privacy) and near zero or below for the trafficking-only module, reflecting near-chance separation. Full performance metrics, including AUPRC, sensitivity, specificity, F1, and MCC for all main conditions, are provided in Supplementary Table S3; summary AUROC and Brier values are given in Table 2.
Figure 6.
Receiver-operating-characteristic (ROC) curves by held-out cohort (non-private models). ROC curves plotting the true positive rate against the false positive rate for predicting ICB response, evaluated on each cohort when held out under leave-one-cohort validation (combined 16-gene feature set). Four non-private training paradigms are compared: a centralized reference trained on pooled multi-cohort data (Centralized_Reference, brown), two federated models aggregating across cohorts via Federated Averaging (FL_FedAvg, green) and Federated Proximal (FL_FedProx, blue), and a baseline trained and evaluated within the single held-out cohort (Within_Cohort_Local_Baseline, grey). The diagonal dashed line indicates chance performance. The within-cohort local baseline shows markedly irregular curves, particularly in the smaller cohorts (e.g., Hugo, Riaz), reflecting the limited sample available when training and evaluating within a single small cohort; this instability illustrates the difficulty of cohort-local modeling that federated training is designed to address.
Figure 6.
Receiver-operating-characteristic (ROC) curves by held-out cohort (non-private models). ROC curves plotting the true positive rate against the false positive rate for predicting ICB response, evaluated on each cohort when held out under leave-one-cohort validation (combined 16-gene feature set). Four non-private training paradigms are compared: a centralized reference trained on pooled multi-cohort data (Centralized_Reference, brown), two federated models aggregating across cohorts via Federated Averaging (FL_FedAvg, green) and Federated Proximal (FL_FedProx, blue), and a baseline trained and evaluated within the single held-out cohort (Within_Cohort_Local_Baseline, grey). The diagonal dashed line indicates chance performance. The within-cohort local baseline shows markedly irregular curves, particularly in the smaller cohorts (e.g., Hugo, Riaz), reflecting the limited sample available when training and evaluating within a single small cohort; this instability illustrates the difficulty of cohort-local modeling that federated training is designed to address.
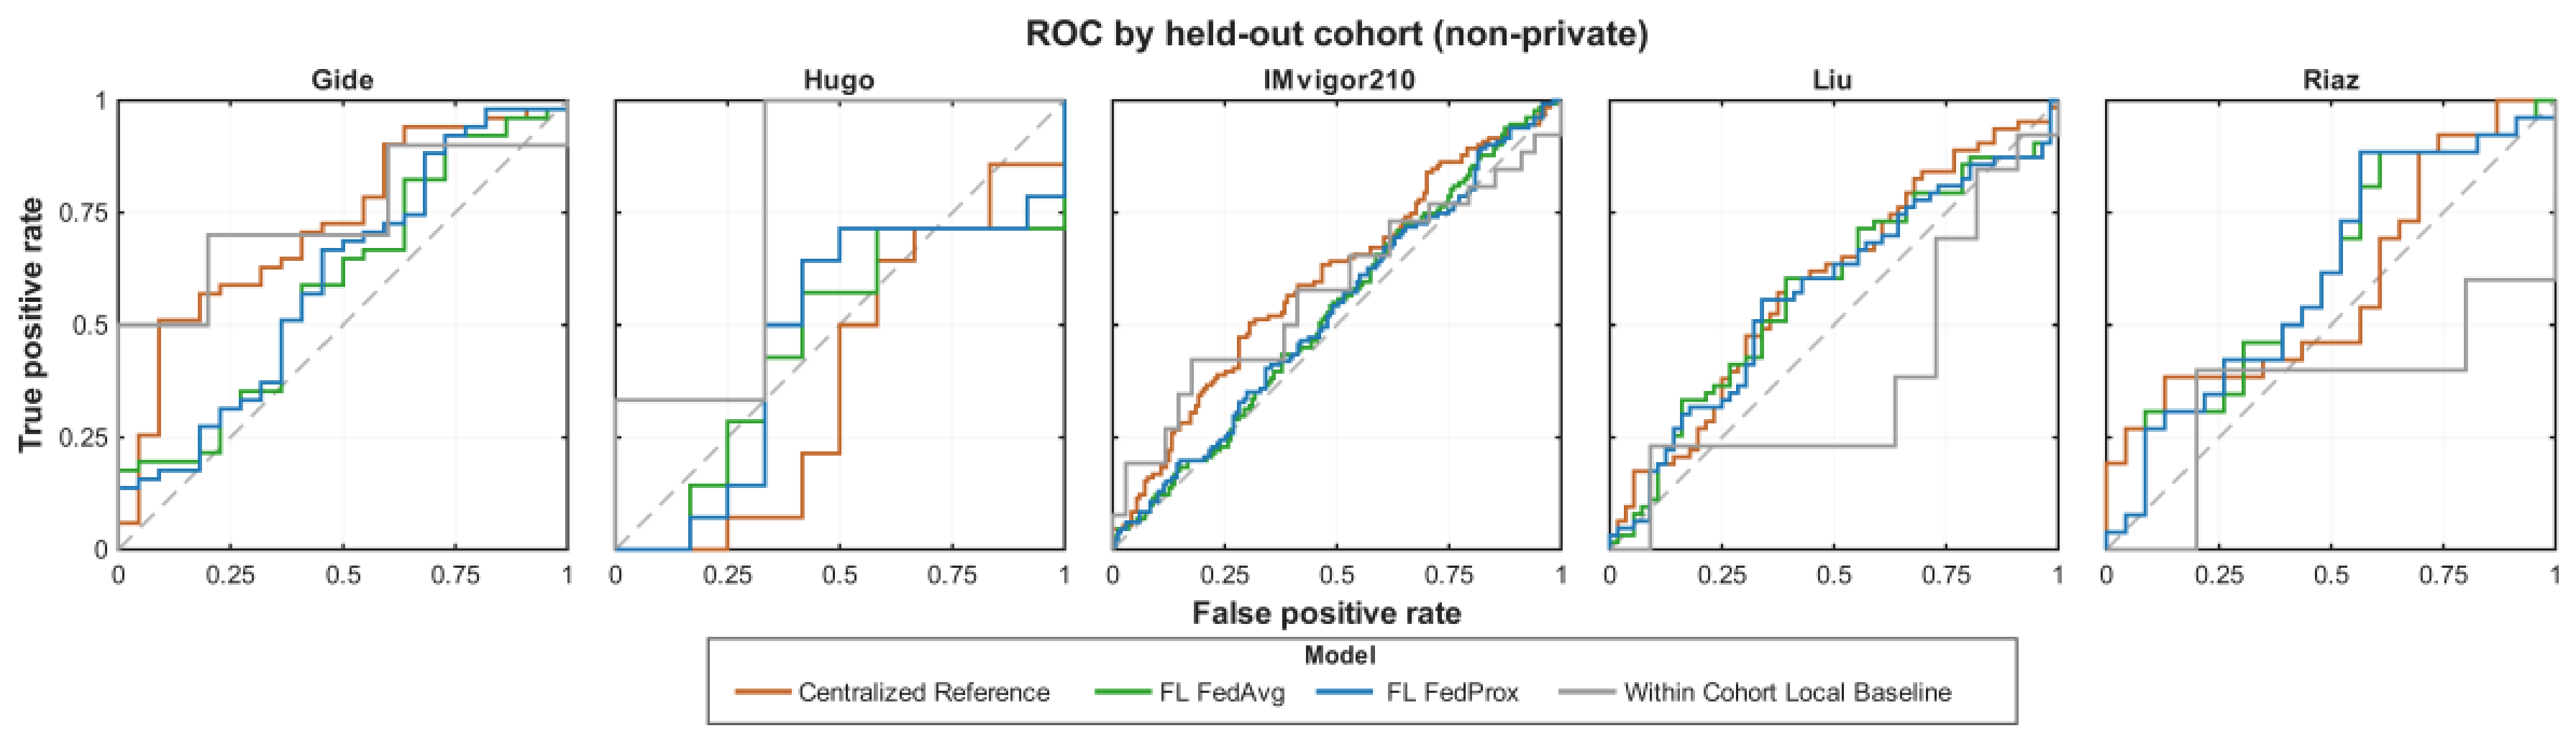
Figure 7.
Summary heatmap of federated model performance across feature sets and privacy budgets. Mean AUROC for models trained with the Federated Proximal (FedProx) aggregation strategy, across three-pre-specified feature sets (rows): the 16-gene union (Combined), the 6-gene interferon-γ module (IFN-γ), and the 10-gene PD-L1-trafficking module (Trafficking). Columns indicate the cumulative differential privacy budget (ε). From ε=1 (strongest privacy) to ε=10. Cell values are the mean AUROC across held-out cohorts and seeds. The color scale runs from dark blue (lower AUROC) through green to bright yellow (higher AUROC).AUROC was the highest for the IFN-γ module and lowest for the trafficking-only module, and varied little across privacy budgets within each feature set.
Figure 7.
Summary heatmap of federated model performance across feature sets and privacy budgets. Mean AUROC for models trained with the Federated Proximal (FedProx) aggregation strategy, across three-pre-specified feature sets (rows): the 16-gene union (Combined), the 6-gene interferon-γ module (IFN-γ), and the 10-gene PD-L1-trafficking module (Trafficking). Columns indicate the cumulative differential privacy budget (ε). From ε=1 (strongest privacy) to ε=10. Cell values are the mean AUROC across held-out cohorts and seeds. The color scale runs from dark blue (lower AUROC) through green to bright yellow (higher AUROC).AUROC was the highest for the IFN-γ module and lowest for the trafficking-only module, and varied little across privacy budgets within each feature set.
3.6. Sensitivity Analysis: Extended PD-L1 Recycling Module
We performed a secondary exploratory analysis because the primary trafficking module contained only part of the endosomal-recycling machinery, and in particular did not include RAB5A, the early-endosome GTPase through which DRG2 has been reported to regulate PD-L1 surface recycling; we performed a pre-specified secondary analysis with an extended PD-L1 trafficking module. Six additional recycling-arm genes were added: RAB5A [15], SNX6[21], TRAPPC4[19], VPS26A [30], VPS29[31], and RAB4A [32], chosen because each is implicated in endosomal recycling or retromer function in the PD-L1 trafficking literature, including references cited elsewhere in this work. Each gene was confirmed present in all five cohorts before inclusion, and the extended clean datasets were constructed as a strict superset of the primary datasets, leaving the original 16-gene values and patient composition unchanged. The extended trafficking module comprised 16 genes and the extended combined module 22 genes. All training, privacy accounting, and validation procedures were identical to the primary analysis; because record-level DP-SGD accounting depends on the clipping norm, noise multiplier, sampling rate, and number of steps rather than on feature dimensionality, the cumulative privacy budgets were unaffected by the additional features.
Adding the recycling genes did not improve discrimination. The extended trafficking-only module remained near chance (mean non-private AUROC 0.490, compared with 0.486 for the primary 10-gene module), and the extended combined module did not exceed the IFN-γ module (0.526 versus 0.610; Figure S4), consistent with the primary finding that trafficking transcripts do not add predictive signal beyond canonical inflammation. Coefficients for the 16 original genes were essentially unchanged relative to the primary combined model (for example, DRG2 median: +0.266 versus +0.263; CXCL9: +0.406 versus +0.442; SNX27: +0.295 versus +0.287), confirming that the additional features did not distort the original attributions.
Figure 8.
Coefficient stability and sign-consistency of the combined federated model. Forest plot showing the stability of individual gene coefficients within the 16-gene combined model across federated training conditions. Points represents the median standardized logistic-regression coefficient for each gene, and horizontal bars indicate the interquartile range (IQR) across random initialization seeds, cross-validation folds, and differential privacy budgets. Genes are colored by pre-specified module; the 6-gene interferon-γ module (IFN-γ, brown) and the 10-gene PD-L1 trafficking module (Trafficking, blue). The vertical dashed line at zero marks a neutral contribution; values to the right indicate a positive contribution to predicting ICB response, and values to the left a negative (anti-predictive) contribution. The percentage adjacent to each gene is its sign-consistency, the proportion of fits in which the coefficient retained the same directional sign, serving as a measure of stability under varying privacy and training conditions. Genes are ordered by median coefficient. CXCL9 (IFN-γ) showed the largest and most consistent positive contribution (98% sign-consistency), and DRG2 was the most directionally consistent trafficking gene (95%); several other trafficking coefficients (e.g., SNX27, RAB8A) were less stable across cohort compositions, as further examined in the melanoma-only sensitivity analysis (Supplementary Figure S1).
Figure 8.
Coefficient stability and sign-consistency of the combined federated model. Forest plot showing the stability of individual gene coefficients within the 16-gene combined model across federated training conditions. Points represents the median standardized logistic-regression coefficient for each gene, and horizontal bars indicate the interquartile range (IQR) across random initialization seeds, cross-validation folds, and differential privacy budgets. Genes are colored by pre-specified module; the 6-gene interferon-γ module (IFN-γ, brown) and the 10-gene PD-L1 trafficking module (Trafficking, blue). The vertical dashed line at zero marks a neutral contribution; values to the right indicate a positive contribution to predicting ICB response, and values to the left a negative (anti-predictive) contribution. The percentage adjacent to each gene is its sign-consistency, the proportion of fits in which the coefficient retained the same directional sign, serving as a measure of stability under varying privacy and training conditions. Genes are ordered by median coefficient. CXCL9 (IFN-γ) showed the largest and most consistent positive contribution (98% sign-consistency), and DRG2 was the most directionally consistent trafficking gene (95%); several other trafficking coefficients (e.g., SNX27, RAB8A) were less stable across cohort compositions, as further examined in the melanoma-only sensitivity analysis (Supplementary Figure S1).
The central purpose of this analysis was to test whether DRG2 retained its directionally reproducible contribution once its upstream effector RAB5A was present in the model. DRG2 retained a positive median coefficient that was stable across the extended panel (median +0.266, sign-consistent in 93 % of fits), essentially identical to the value obtained without RAB5A in the model (+0.263). RAB5A itself contributed a smaller, independent positive coefficient (median +0.158), rather than absorbing the DRG2 signal, indicating that the DRG2 association is not a proxy for Rab5-family transcript abundance (Figure S3 and Table S4). Among the other recycling genes, the retromer subunits showed the most directionally stable contributions, with VPS26A negative (median -0.290, sig-consistent in 81% of fits) and VPS29 positive (median +0.174), while SNX4, TRAPPC4, and RAB4A carried weak and less consistent coefficients (Figure S3). These patterns reinforce the conclusion of the primary analysis: the PD-L1 trafficking module as a whole does not represent a uniformly reproducible predictive program. However, DRG2 remained a directionally robust exception, retaining a stable positive contribution even when the broader endosomal-recycling machinery, including the upstream RAB5A pathway implicated in DRG2-mediated trafficking regulation, was modeled jointly. As in the primary analysis, this finding is hypothesis-generating and should not be interpreted as evidence of predictive utility.
4. Discussion
This study evaluated the feasibility of privacy-preserving federated prediction of ICB-response using transcriptomic data from multiple heterogeneous cohorts. Across five public records, non-private federated learning achieved discrimination broadly comparable to a centralized reference while avoiding the pooling of patient-level data. Performance changed only modestly across the evaluated differential privacy budgets, with cumulative privacy accounting applied across the complete federated training trajectory. Overall discrimination remained modest, with mean AUROCs generally ranging from approximately 0.56 to 0.61 under leave-one-out validation. These results provided a realistic benchmark for federated prediction under heterogeneous cohort conditions rather than a claim of state-of-the-art predictive accuracy.
Two methodological features distinguished this study. First, privacy loss was accounted for cumulatively across the entire federated training process rather than reported on a per-round basis. The reported ε values therefore represent the cumulative privacy budget over the complete training trajectory. Second, the centralized and federated approaches used the same logistic-regression model specification, limiting differences in model capacity as a source of performance variation. The linear model also provided directly interpretable coefficients that could be examined within the context of pre-specified biological feature sets. Together, these design choices allowed us to separate three related questions: whether federated prediction is feasible across heterogeneous cohorts, how much predictive discrimination is retained under differential privacy, and whether the mechanistically defined PD-L1 trafficking program contains reproducible signal beyond canonical inflammatory features.
Relation to Prior Work
The closest precedent is a distributed XGBoost framework for immune-oncology biomarker discovery across 26 cohorts [22], which established the feasibility of cross-cohort modeling without centralizing patient-level data and included several public datasets also analyzed here. Our study extends this framework in several respects. First, we implemented a formal record-level differential privacy with cumulative Rényi differential privacy accounting and evaluated performance across a defined privacy budget grid. This directly addresses the privacy safeguard identified as a need in previous distributed analyses. Second, rather than screening a broad collection of signatures, we evaluated a pre-specified mechanistic hypothesis concerning PD-L1 trafficking relative to an established IFN-γ inflammatory program. Third, we used an interpretable linear model in which fitted coefficients provided a direct model-level representation of feature contributions. Fourth, we used a leave-one-cohort out-of-validation to evaluate performance at previously unseen cohort sites and report cohort-specific variation rather than presenting only pooled performance.
The absolute discrimination observed here, with the mean AUROCs of approximately 0.56 to 0.61, was lower than that reported in some studies using higher-dimensional signatures and cohort-specific optimization. This difference is expected in part from the deliberately constrained design of the present analysis, which used a low-dimensional pre-specified feature space and external cohort validation without optimization to individual held-out cohorts. The resulting performance should therefore be interpreted as a benchmark for feasibility under realistic heterogeneity and privacy constraints rather than as evidence of superior predictive accuracy.
Biological Interpretation of the Trafficking Analysis
A central biological question was whether a transcript encoding PD-L1 trafficking machinery provided predictive information beyond canonical IFN-γ-associated inflammation. The pre-specified trafficking model did not improve overall discrimination when added to IFN-γ model, and the trafficking-only model performed near chance. This ordering was maintained in the melanoma-only sensitivity analysis, indicating that the finding was not driven solely by the inclusion of the urothelial IMvigor210 cohort [5]. Across the feature sets, CXCL9 was the strongest and most directionally stable positive contributor, consistent with the importance of inflammatory signaling in ICB response prediction.
Although the trafficking model did not provide an overall predictive advantage, coefficient-level analysis identified a more selective pattern. DRG2 showed the greatest directional reproducibility among the trafficking genes examined, retaining a positive contribution across both the full five-cohort analysis and the melanoma-only sensitivity analysis. In contrast, other trafficking genes were sensitive to cohort composition. For example, SNX27 showed a positive coefficient in the five-cohort analysis but reversed in direction in the melanoma-only sensitivity analysis, while the contribution of RAB8A was attenuated. CD274 itself showed weak and inconsistent coefficient contributions across the two cohort compositions. These findings suggested that the trafficking module does not represent any uniformly reproducible predictive program at the transcript level. Instead, individual genes may carry context-dependent information that is obscured when the module is considered as a whole. This context dependence is consistent with the substantial cross-cohort heterogeneity observed in the expression data. It also highlights an important decision between the coefficient-level reproducibility and predictive superiority. A gene can show a reproducible direction contribution within a model without providing a measurable improvement in overall discrimination. Accordingly, the present data support DRG2 as a hypothesis-generating candidate for further investigation rather than establishing it as a predictive biomarker or demonstrating that PD-L1 trafficking is superior to inflammatory signatures.
The biological interpretation should also be considered in the context of established mechanisms regulating PD-L1 abundance and stability. Previous studies have identified CMTM6, CMTM4[18], COPS5/CSN5, and STUB1 as regulators of PD-L1 stability and degradation. Notably, DRG2 has been reported to regulate endosomal PD-L1 recycling and to be required for the response to anti-PD-1 therapy, with low DRG2 levels associated with treatment resistance [15]. The positive coefficient direction observed in our analysis is concordant with that mechanism, supporting DRG2 as a biologically grounded candidate rather than an incidental coefficient. This concordance between an independent, data-driven multi-cohort analysis and established functional mechanism strengthens the rationale for further study, although our transcriptomics coefficient analysis does not itself demonstrate the mechanism. The mechanism linking DRG2 to PD-L1 surface presentation has been established experimentally, including endosomal accumulation of PD-L1 and reduced anti-PD-1 responsiveness upon DRG2 depletion [15]. Our findings extend this by showing that the directional association between DRG2 and response is recoverable at the transcript level across independent public cohorts. What remains to be established is whether DRG2 transcript abundance provides prospectively useful predictive value across tumor types and treatment settings, which will require evaluation in independent prospective cohorts.
Implications for Federated and Privacy-Preserving Biomarker Development
The results also illustrated an important distinction between predictive performance and robustness to privacy constraints. The observed AUROC values remained relatively stable across the evaluated cumulative privacy budgets, including the strictest budget tested. This suggested that, for this low-dimensional logistic-regression setting, useful predictive signal can be retained while applying a formal record-level differential privacy. However, the result should not be generalized to other model classes, feature dimensions, cohort size, or privacy regimes without additional evaluation. The observed privacy-utility relationship is specific to the percent experimental design and should be interpreted empirically rather than assumed to be negligible in general.
The variation in federated performance across the held-out cohorts further emphasizes that non-IID heterogeneity remains an important determinant of the model behavior. Federated learning avoids the need to centralize the patient-level data; however, it does not eliminate the biological, technical, or cohort-specific differences between sites. The mixed cohort-specific ΔAUROC values observed relative to the centralized reference therefore provide a more informative assessment than a single pooled performance estimate. In practice, successful deployment would require site-specific evaluation, prospective calibration, and monitoring of performance and distributional characteristics of the target population.
Limitations
Several limitations should be considered. First, the analysis used five retrospective public cohorts, with substantial differences in cohort size, cancer type, treatment context, expression measurements, and data processing. Although these differences provide a useful test of non-IID robustness, they also limit the ability to separate biological heterogeneity from technical and cohort-specific effects. Second, overall discrimination was modest, and the relatively small size for several cohorts resulted in wide confidence intervals and limited power for formal between-model comparisons. Third, the clinical-benefit endpoint combined stable disease with complete and partial response without a duration criterion. This definition provides a uniform endpoint across the datasets but does not capture the durability of benefit.
Fourth, the federated experiment was performed using public datasets treated as simulated sites. Although this design reproduced the computational constraints of cross-site training, real-world deployment would additionally require institutional governance, secure communication infrastructure, site-specific calibration, and operational privacy controls. Fifth, the demographic variables were not incorporated, and subgroup or fairness analyses were therefore not performed, reflecting incomplete and non-harmonized demographic annotation and the limited per-cohort sample sizes in the public cohorts. Finally, the study evaluated a low-dimensional linear model. The findings therefore establish the feasibility and the interpretability for this model class rather than demonstrating that the same privacy and generalization behavior would apply to more complex machine learning architectures.
5. Conclusions
In conclusion, this study provided a controlled evaluation of a federated, differentially private prediction of ICB response across heterogeneous transcriptomic cohorts. Federated performance remained broadly comparable to a centralized reference, with only modest discovery of changes across the evaluated cumulative privacy budgets. The interferon-gamma model provided a stronger predictive discrimination than the pre-PD-L1 trafficking model, while combining the two did not yield a consistent overall improvement. Nevertheless, coefficient-level analysis identified DRG2 as the most directionally reproducible trafficking gene candidate across the cohort examined, with the positive direction being consistent with its established role in endosomal PD-L1 on recycling and anti-PD-L1 response. This finding is hypothesis-generating rather than evidence of predictive superiority or clinical utility. Together, the results support federated differential privacy as a feasible framework for multi-cohort biomarker evaluation while underscoring the importance of rigorous external validation and cautious interpretation of mechanistic signals in heterogeneous clinical transcriptomic data.
Supplementary Materials
The following supporting information can be downloaded at the website of this paper posted on Preprints.org.
Author Contributions
Conceptualization, M.M; Methodology M.M, Investigation, M.M., Formal analysis M.M; Data Curation, M.M; Visualization, M.M, Writing-Original draft preparation, M.M; Writing and editing, M.M & JWP. All authors have read and agreed to the published version of the manuscript.
Funding
This research received no external funding.
Institutional Review Board Statement
Not applicable.
Informed Consent Statement
Not applicable.
Data Availability Statement
The code and analysis scripts used to generate the results presented in this study are publicly available on Git hub at (link). The publicly available transcriptomic datasets analyzed in this study can be accessed through their respective original repositories and accession numbers cited in the manuscript.
Acknowledgments
The authors have reviewed and edited the output and take full responsibility for the content of this publication.
Conflicts of Interest
The authors declare no conflicts of interest. The funders had no role in the design of the study; in the collection, analyses, or interpretation of data; in the writing of the manuscript; or in the decision to publish the results.
Abbreviations
The following abbreviations are used in this manuscript:
| AUROC | Area Under the Receiver Operating Characteristic curve |
| AUPRC | Area Under the Precision-Recall Curve |
| DP | Differential Privacy |
| DP-SGD | Differentially Private Stochastic Gradient Descent |
| FL | Federated Leaning |
| FedAvg | Federated Averaging |
| FedProx | Federated Proximal |
| ICB | Immune Checkpoint Blockade |
| IID | Independent and Identically Distributed |
| IFN-γ | Interferon-γ (Interferon-gamma) |
| PD-1 | Programmed Cell Death Protein 1 |
| PD-L1 | Programmed Cell Death-Ligand Protein 1 |
| DRG2 | Developmentally Regulated GTP-binding Protein 2 |
| ROC | Receiver-Operating-Characteristic |
References
- Hugo, W., et al., Genomic and Transcriptomic Features of Response to Anti-PD-1 Therapy in Metastatic Melanoma. Cell, 2016. 165(1): p. 35-44. [CrossRef]
- Gide, T.N., et al., Distinct Immune Cell Populations Define Response to Anti-PD-1 Monotherapy and Anti-PD-1/Anti-CTLA-4 Combined Therapy. Cancer Cell, 2019. 35(2): p. 238-255 e6. [CrossRef]
- Riaz, N., et al., Tumor and Microenvironment Evolution during Immunotherapy with Nivolumab. Cell, 2017. 171(4): p. 934-949 e16. [CrossRef]
- Liu, D., et al., Integrative molecular and clinical modeling of clinical outcomes to PD1 blockade in patients with metastatic melanoma. Nat Med, 2019. 25(12): p. 1916-1927. [CrossRef]
- Rosenberg, J.E., et al., Atezolizumab monotherapy for metastatic urothelial carcinoma: final analysis from the phase II IMvigor210 trial. ESMO Open, 2024. 9(12): p. 103972. [CrossRef]
- Tang, Q., et al., The role of PD-1/PD-L1 and application of immune-checkpoint inhibitors in human cancers. Front Immunol, 2022. 13: p. 964442. [CrossRef]
- Kang, H., et al., A Comprehensive Benchmark of Transcriptomic Biomarkers for Immune Checkpoint Blockades. Cancers (Basel), 2023. 15(16). [CrossRef]
- Ayers, M., et al., IFN-gamma-related mRNA profile predicts clinical response to PD-1 blockade. J Clin Invest, 2017. 127(8): p. 2930-2940. [CrossRef]
- McMahan, H.B., et al., Communication-Efficient Learning of Deep Networks from Decentralized Data. Artificial Intelligence and Statistics, Vol 54, 2017. 54: p. 1273-1282.
- Li, T., et al., Federated optimization in heterogeneous networks. Proceedings of Machine learning and systems, 2020. 2: p. 429-450.
- Abadi, M., et al. Deep learning with differential privacy. in Proceedings of the 2016 ACM SIGSAC conference on computer and communications security. 2016. [CrossRef]
- Dwork, C. and A. Roth, The algorithmic foundations of differential privacy. Foundations and trends® in theoretical computer science, 2014. 9(3-4): p. 211-487. [CrossRef]
- Rehman, M.H.U., et al., Federated learning for medical imaging radiology. Br J Radiol, 2023. 96(1150): p. 20220890. [CrossRef]
- Rieke, N., et al., The future of digital health with federated learning. NPJ Digit Med, 2020. 3: p. 119. [CrossRef]
- Choi, S.H., et al., DRG2 is required for surface localization of PD-L1 and the efficacy of anti-PD-1 therapy. Cell Death Discov, 2024. 10(1): p. 260.
- Wu, Y., et al., PD-L1 Distribution and Perspective for Cancer Immunotherapy-Blockade, Knockdown, or Inhibition. Front Immunol, 2019. 10: p. 2022. [CrossRef]
- Burr, M.L., et al., CMTM6 maintains the expression of PD-L1 and regulates anti-tumour immunity. Nature, 2017. 549(7670): p. 101-105. [CrossRef]
- Mezzadra, R., et al., Identification of CMTM6 and CMTM4 as PD-L1 protein regulators. Nature, 2017. 549(7670): p. 106-110. [CrossRef]
- Ren, Y., et al., TRAPPC4 regulates the intracellular trafficking of PD-L1 and antitumor immunity. Nat Commun, 2021. 12(1): p. 5405. [CrossRef]
- Yu, X., et al., PD-L1 translocation to the plasma membrane enables tumor immune evasion through MIB2 ubiquitination. J Clin Invest, 2023. 133(3). [CrossRef]
- Ghosh, C., et al., Sorting nexin 6 interacts with Cullin3 and regulates programmed death ligand 1 expression. FEBS Lett, 2021. 595(20): p. 2558-2569. [CrossRef]
- Abbas-Aghababazadeh, F., et al., Distributed Biomarker Discovery for Immuno-Oncology. bioRxiv, 2025: p. 2025.07. 25.666789. [CrossRef]
- Beutel, D.J., et al., Flower: A friendly federated learning research framework. arXiv preprint arXiv:2007.14390, 2020. [CrossRef]
- Yousefpour, A., et al., Opacus: User-friendly differential privacy library in PyTorch. arXiv preprint arXiv:2109.12298, 2021. [CrossRef]
- Mironov, I. Rényi differential privacy. in 2017 IEEE 30th computer security foundations symposium (CSF). 2017. IEEE. [CrossRef]
- Vickers, A.J. and E.B. Elkin, Decision curve analysis: a novel method for evaluating prediction models. Med Decis Making, 2006. 26(6): p. 565-74. [CrossRef]
- Vickers, A.J., et al., Extensions to decision curve analysis, a novel method for evaluating diagnostic tests, prediction models and molecular markers. BMC Med Inform Decis Mak, 2008. 8: p. 53. [CrossRef]
- Kang, L., et al., Comparing two correlated C indices with right-censored survival outcome: a one-shot nonparametric approach. Stat Med, 2015. 34(4): p. 685-703. [CrossRef]
- TRIPOD+AI statement: updated guidance for reporting clinical prediction models that use regression or machine learning methods. BMJ, 2024. 385: p. q902. [CrossRef]
- Hou, J., et al., The Prognostic Value and the Oncogenic and Immunological Roles of Vacuolar Protein Sorting Associated Protein 26 A in Pancreatic Adenocarcinoma. Int J Mol Sci, 2023. 24(4). [CrossRef]
- Wang, Y., et al., MLKL/retromer axis controls PD-L1 recycling to compromise antitumor immunity during VCP inhibition-induced necroptosis. Proc Natl Acad Sci U S A, 2025. 122(51): p. e2518675122. [CrossRef]
- Dong, T., et al., Targeting VPS18 hampers retromer trafficking of PD-L1 and augments immunotherapy. Sci Adv, 2024. 10(42): p. eadp4917. [CrossRef]
Figure 1.
Principal-component analysis of a pooled standardized expression, illustrating cross- cohort heterogeneity and non-IID structure. Scatter plot of the first two principal components (PC1, PC2) derived from standardized 16-gene expression profiles across five independent cohorts (Gide, Hugo, IMvigor210, Liu, Riaz). Each point is an individual patient sample, colored by source cohort, with a 68% confidence ellipse delineating each cohort’s core distribution. Axes indicate the percentage of total variance explained by PC1 (35.4%), and PC2 (15.7%). Cohort distributions are partially overlapping but distinguishable, with cohort-associated structure along the leading components, consistent with the non-independent and identically distributed (non- IID) nature of the multi-site data and encompassing biological, assay-platform, and processing differences (quantified in the main text; PERMANOVA R² = 0.43). This heterogeneity motivates federated training with cohort-local normalization rather than naive cross-cohort pooling.
Figure 1.
Principal-component analysis of a pooled standardized expression, illustrating cross- cohort heterogeneity and non-IID structure. Scatter plot of the first two principal components (PC1, PC2) derived from standardized 16-gene expression profiles across five independent cohorts (Gide, Hugo, IMvigor210, Liu, Riaz). Each point is an individual patient sample, colored by source cohort, with a 68% confidence ellipse delineating each cohort’s core distribution. Axes indicate the percentage of total variance explained by PC1 (35.4%), and PC2 (15.7%). Cohort distributions are partially overlapping but distinguishable, with cohort-associated structure along the leading components, consistent with the non-independent and identically distributed (non- IID) nature of the multi-site data and encompassing biological, assay-platform, and processing differences (quantified in the main text; PERMANOVA R² = 0.43). This heterogeneity motivates federated training with cohort-local normalization rather than naive cross-cohort pooling.
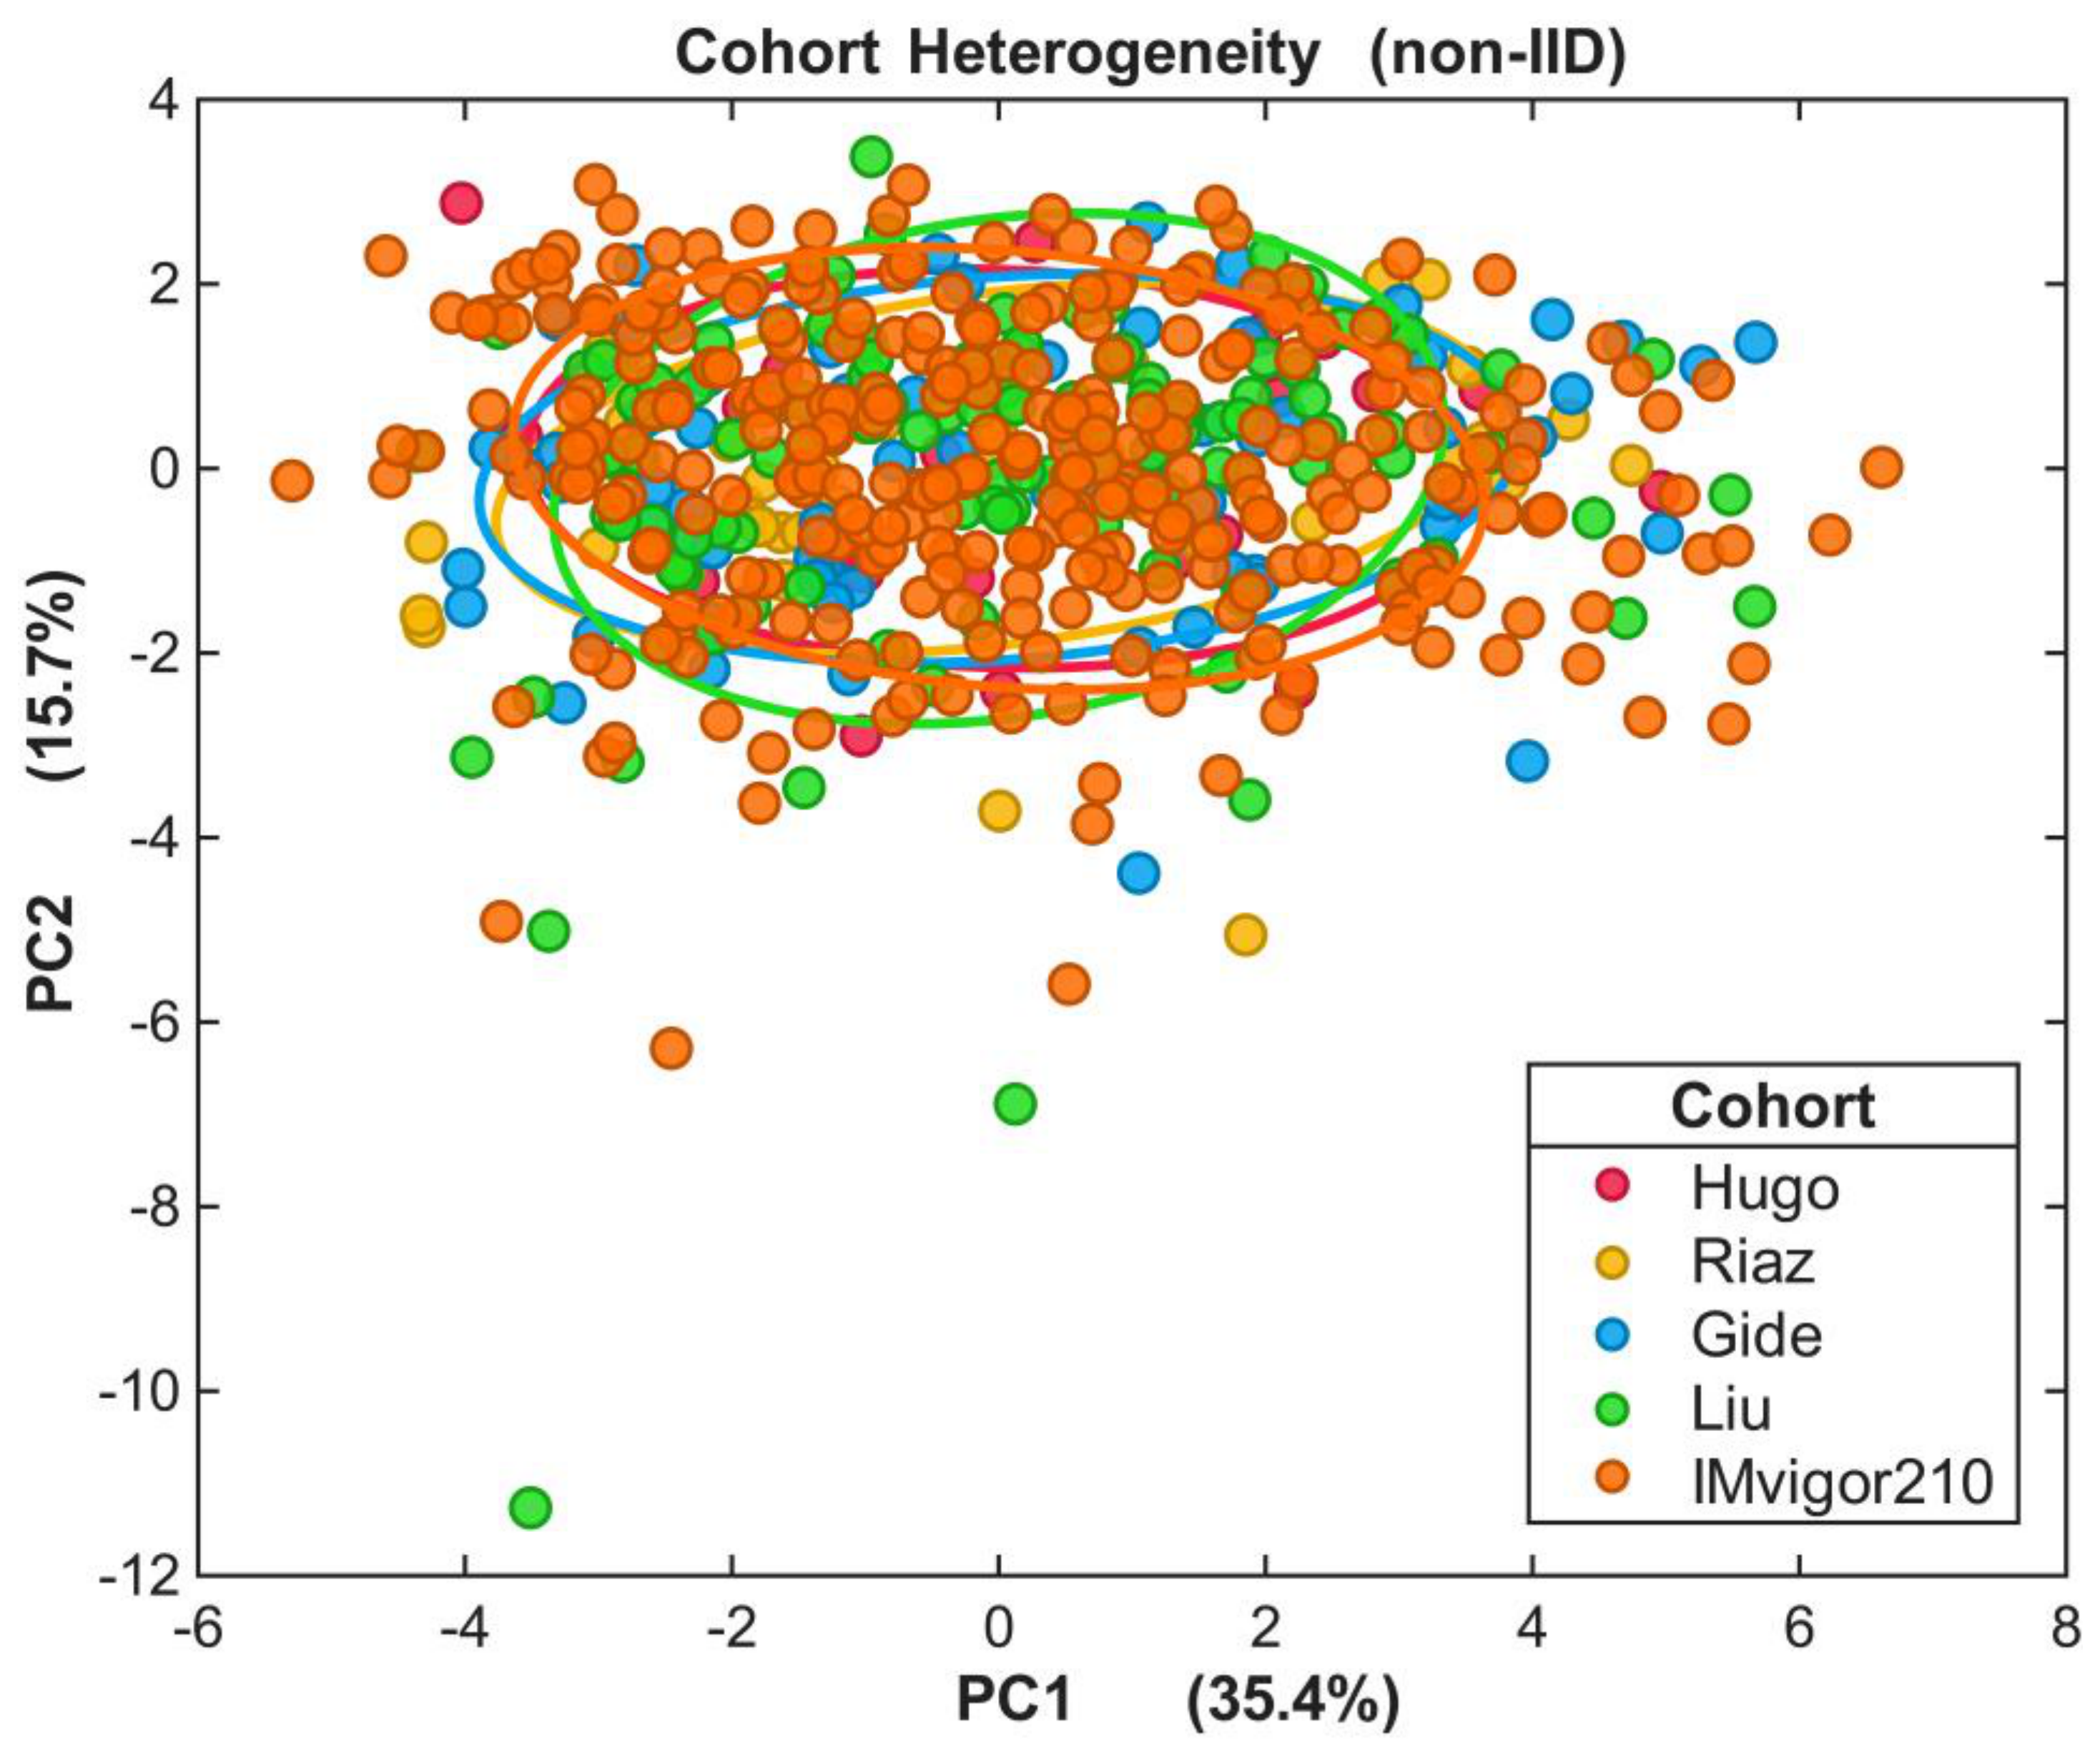

Table 1.
Characteristics of the five ICB-treated cohorts.
| Cohort | Cancer | Therapy | Platform | Expression unit | n | Responders | Non-responders | Response rate |
|---|---|---|---|---|---|---|---|---|
| Hugo | Melanoma | anti-PD-1 | RNA-seq | FPKM | 26 | 14 | 12 | 0.54 |
| Riaz | Melanoma | anti-PD-1 | RNA-seq | FPKM | 49 | 26 | 23 | 0.53 |
| Gide | Melanoma | anti-PD-1± CTLA-4 | RNA-seq | TPM | 73 | 51 | 22 | 0.7 |
| Liu | Melanoma | anti-PD-1 | RNA-seq | TPM | 119 | 63 | 56 | 0.53 |
| IMvigor210 | Urothelial | anti-PD-L1 | RNA-seq | CPM | 298 | 131 | 167 | 0.44 |
| Total | 565 | 285 | 280 | 0.5 |
1 Responder Definition: Responder = durable clinical benefit (Complete Response [CR]/ Partial Response [PR]/ Stable Disease [SD]); non-responder = Progressive Disease (PD). This classification follows the criteria established by Hugo et al [1] and was applied uniformly across all cohorts to ensure harmonized predictive labels. Expression Units: The clinical datasets quantify RNA sequencing gene expression using different standard normalization metrics: Fragments Per Kilobase of transcript per Million mapped reads (FPKM); normalizes the raw read count by accounting for both the length of the specific gene and the total number of sequencing reads in that sample. Transcripts per Million (TPM); Similar to FPKM, but normalizes for sequencing depth first, then gene length. This ensures the sum of all TPMs in a sample is identical, making it easier to directly compare the relative proportion of transcripts across different patients. Counts Per Million (CPM): Normalizes the raw read count strictly by the total number of Sequencing reads mapped in the sample (sequencing depth), without adjusting for the length of the gene. Data Provenance (Gide): The processed per-patient expression matrix (re-aligned to circumvent raw FASTQ processing) and matched clinical metadata for the Gide cohort were retrieved from the Tumor Immunotherapy Gene Expression Resource (TIGER). Data Provenance (IMvigor210): The processed expression matrix and matched clinical metadata for the IMvigor210 cohort were accessed via the curated IMvigor210CoreBiologies R data package.
Table 2.
Mean leave-one-cohort-out AUROC and Brier score by feature set, model and privacy budget (mean across five held-out cohorts and five seeds). Selected privacy budgets are shown for compactness; the complete privacy sweep is shown in Figure 2 and Figure 8. Per-cohort AUROCs with 95% bootstrap confidence intervals are shown in Figure 3.
Table 2.
Mean leave-one-cohort-out AUROC and Brier score by feature set, model and privacy budget (mean across five held-out cohorts and five seeds). Selected privacy budgets are shown for compactness; the complete privacy sweep is shown in Figure 2 and Figure 8. Per-cohort AUROCs with 95% bootstrap confidence intervals are shown in Figure 3.
| Feature set | Model | ε | Mean AUROC | Mean Brier |
|---|---|---|---|---|
| IFN-γ | Centralized | ∞ | 0.602 | 0.251 |
| IFN-γ | FL (FedProx) | ∞ | 0.608 | 0.254 |
| IFN-γ | FL (FedProx) | 1 | 0.587 | 0.264 |
| Combined | Centralized | ∞ | 0.578 | 0.256 |
| Combined | FL (FedProx) | ∞ | 0.561 | 0.271 |
| Combined | FL (FedProx) | 1 | 0.573 | 0.280 |
| Trafficking | Centralized | ∞ | 0.543 | 0.254 |
| Trafficking | FL (FedProx) | ∞ | 0.486 | 0.275 |
Disclaimer/Publisher’s Note: The statements, opinions and data contained in all publications are solely those of the individual author(s) and contributor(s) and not of MDPI and/or the editor(s). MDPI and/or the editor(s) disclaim responsibility for any injury to people or property resulting from any ideas, methods, instructions or products referred to in the content. |
© 2026 by the authors. Licensee MDPI, Basel, Switzerland. This article is an open access article distributed under the terms and conditions of the Creative Commons Attribution (CC BY) license (http://creativecommons.org/licenses/by/4.0/).
Copyright: This open access article is published under a Creative Commons CC BY 4.0 license, which permit the free download, distribution, and reuse, provided that the author and preprint are cited in any reuse.