

Submitted:
03 September 2026
Posted:
04 September 2026
You are already at the latest version
Abstract
Intellectual capital comprises human, structural, and customer capital. Traditional assessment methods, such as the Value Added Intellectual Coefficient, rely predominantly on financial reporting and do not provide a direct indicator of customer capital. This gap is particularly relevant in industries with a substantial share of intangible assets, such as the IT sector. This study examines the effect of domain technological sophistication on the financial performance (ROA, Profit Margin) of 2558 leading European IT companies by sales volume in 2023. Domain technological sophistication was formalised through an original classification of domain extensions and used as a proxy indicator of customer capital. The model also accounted for management intensity and innovation intensity, as proxies for human and structural capital, respectively, and for public status as a control variable. Multiple linear regression with robust standard errors was applied using the ordinary least squares method. Domain technological sophistication showed a statistically significant negative effect on ROA and no significant effect on Profit Margin. Management intensity demonstrated opposite-direction effects across the two models. Innovation intensity showed the strongest negative effect on both indicators. Public status showed no significant effect on either indicator. The findings suggest that domain functions primarily as a signal for external stakeholders rather than as a direct driver of operational efficiency. Its suitability as a standalone proxy for customer capital requires further verification using panel data.
Keywords:
intellectual capital
; customer capital
; domain
; innovation intensity
; management intensity
; profit margin
; return on assets
; digital maturity
1. Introduction
The intellectual capital of a company determines its competitive advantage (Edvinsson & Malone, 1997). Its structure is commonly divided into three elements – human, structural, and customer capital (Stewart, 1997). This division provides grounds for investigating the effect of each of these components on the financial performance of companies, particularly in industries with a substantial share of intangible assets, such as the IT sector.
The relationship between intellectual capital and financial performance remains an open field for scholarly debate, owing to the paradoxical results of a number of studies examining the corresponding effect of its components on the example of IT companies. In particular, the results of the reviewed works range from positive (Duc et al., 2025; Shaneeb & Sumathy, 2021; Mata et al., 2024; Joshi & Aggarwal, 2024) to negative effects (Dsouza et al., 2026) and no effect at all (Singh, 2024), and even to mixed results within a single study (Bansal et al., 2025; Lehenchuk et al., 2023). Most of these studies employed the Value Added Intellectual Coefficient (VAIC) method, which involves calculating the efficiency of intellectual capital utilisation on the basis of the value added created by a firm. This method does not account for customer capital. Improved models, in particular the Modified VAIC (MVAIC), additionally incorporate Research and Development Efficiency and Relational Capital Efficiency, thereby partially compensating for this limitation of the classical VAIC (Lehenchuk et al., 2023; Yin & Xu, 2025). This limitation is further compounded by the broader trend of economic digitalisation, which requires the modernisation of corporate accounting systems to reflect new forms of assets and business processes that emerge in the digital environment and are not always captured by traditional accounting methods (Chyzhevska et al., 2021). Because the aforementioned methods (VAIC, MVAIC) rely on financial statements and do not always capture non-financial manifestations of capital, researchers are seeking alternative, easily verifiable indicators.
For IT companies, whose operations take place predominantly in a digital environment and are associated with digital products, the level of digital presence reflects not digital transformation itself but rather a company's readiness for such transformation, that is, its digital maturity (van Tonder et al., 2024). Given that the direct measurement of digital maturity requires complex surveys or expert assessments, the search for objective proxy indicators capable of reflecting this state without recourse to additional data becomes increasingly relevant. Researchers have proposed various non-traditional web proxies for assessing the non-financial aspects of a company's activity (Yu et al., 2024; Cruciata et al., 2024). Such web proxies may include a company's domain name and website domain. The domain name provides firm recognisability, while the domain, that is, its extension, serves as an additional indicator of its digital presence. Within this study, the term “domain“ is used in a narrow sense, referring to the Top-Level Domain (TLD) of the company's website domain name, that is, the part of the URL following the final dot (for example, .com), rather than the domain name as a whole or the company's field of activity. The domain (TLD), together with the site name chosen by its owner, forms the company's complete domain name (Zimmerman & Abel, 1999). The full website address is denoted by the term “domain name“. This raises the question of whether an IT company's domain extension can serve as a valid proxy for customer capital, and whether this indicator correlates with the company's financial performance. Customer capital reflects the value that arises at the interface of a firm's interaction with its external environment, in particular with customers, partners, and the market. By its functional nature, a domain is an element of firm identification specifically for external observers; it structurally belongs to the customer component of intellectual capital rather than to its human or structural components. The proposed study develops this idea by applying an original classification of companies' domain extensions by level of digital maturity as a proxy indicator of customer capital.
Given that customer capital is only one component of intellectual capital, a comprehensive model also requires proxy indicators of human and structural capital, which within this study are represented by management intensity and innovation intensity. Accordingly, the aim of the study is to examine the effect of domain technological sophistication, as a proxy indicator of customer capital, on the financial performance (ROA, Profit Margin) of 2558 European IT companies that were market leaders in 2023, taking into account the effect of management intensity and innovation intensity indicators, as well as the control variable of a company's public status.
The scientific novelty of the study lies in formalising an IT company's domain as an objective and easily verifiable proxy indicator of customer capital, integrated into a model that comprehensively covers all three components of intellectual capital.
The practical significance of the results lies in the possibility of using the proposed methodology for the rapid assessment of the digital component of companies' intellectual capital without incurring additional costs for organising research. The findings of the study can be used by investment analysts and consulting companies in conducting due diligence, as well as by IT companies themselves for benchmarking their own proxy indicator of digital maturity level against competitors.
2. Literature Review
The inconsistency of results regarding the effect of intellectual capital on financial performance persists irrespective of the research context. In particular, the study by Bansal et al. (2025), conducted on a sample of 237 Indian companies from seven industries (including IT) using a modified VAIC model and dynamic panel models (GMM), demonstrated a robust positive effect of structural capital and capital utilisation efficiency on ROA, ROE, and ROCE, whereas the effect of human capital proved statistically insignificant in most model specifications. Similar heterogeneity was also observed by Nkambule et al. (2021) in a sample of American multinational software firms over the period 2012–2016, applying the Data Envelopment Analysis (DEA) method. Human capital showed a significant positive effect on company efficiency when considered separately; however, when combined with other IC components (innovation, process, and customer capital), its contribution became less significant, as the remaining elements partially absorbed this effect. Applying the classical VAIC, which does not account for customer capital, Singh (2024), using a sample of 50 leading Indian technology companies over the period 2009–2019, found no statistically significant relationship between intellectual capital and companies' productivity, profitability, or market valuation, whereas physical and financial capital showed a significant positive effect. The application of the same VAIC to a different sample of Indian IT companies yields the opposite result. Joshi and Aggarwal (2024), examining, on the basis of a PLS-PM model, the 10 leading IT companies of the Nifty-IT index over the period 2011–2023, found a statistically significant positive effect of intellectual capital on financial performance, accounting for 77.2% of the variation in company indicators. An opposite picture for the IT sector is recorded by the study of Dsouza et al. (2026), based on a sample of 345 publicly listed US IT companies over the period 2011–2022 (1792 observations). VAIC and all three of its components (HCE, SCE, CEE) demonstrated a statistically significant negative effect on ROA, which the authors attribute to the inefficient use of intangible assets and high short-term expenditures on personnel and infrastructure that have not yet had time to translate into financial returns. None of the reviewed studies covers the European IT market, which in itself provides grounds for empirical testing on a European sample. Moreover, the divergence in results is partly explained by the fact that researchers apply different indicators and measurement methods to denote the same components of intellectual capital, which complicates the direct comparison of findings across studies.
The problem of finding proxy indicators for intellectual capital components is further exacerbated by the fact that non-financial disclosure is voluntary in nature and depends on management decisions. Rep et al. (2019), using a sample of Croatian high-tech companies, found an extremely low level of voluntary intellectual capital disclosure (only 19%), with this indicator depending substantially only on firm size rather than on financial performance. Similar conclusions were reached by Bhasin (2011), based on a sample of Indian IT corporations, applying a content-analysis model with a defined list of specific intellectual capital terms developed by Nick Bontis (2003). The study established that the core components of intellectual capital, in particular relational, structural, and customer capital, are practically not reflected in companies' reporting. The same model was applied by Joshi et al. (2012), who compared intellectual capital disclosure among the top 20 IT companies in India and Australia and found that a low and unsystematic level of disclosure is characteristic of companies in both countries regardless of their level of economic development.
Companies that require reporting-based proxy indicators of intellectual capital face not only the limitations of accounting standards but also the inconsistency and selectivity of voluntary disclosure, which reinforces the rationale for seeking objective web proxies independent of management's reporting decisions.
In response to this problem, researchers propose various configurations of non-traditional proxy indicators. Yu et al. (2024) measure brand recognisability through the number of a company's registered trademarks. This is an example of a non-traditional, easily verifiable proxy indicator of an intellectual capital element, in particular customer or relational capital. A similar approach is applied by Cruciata et al. (2024), who use textual analysis of companies' web pages to construct a proxy indicator. This indicator correlates with an organisation's actual environmental index, confirming the suitability of web signals for assessing the non-financial aspects of a company's activity. Based on an analysis of the activities of 74 Australian public companies, the findings of Mauder (2018) demonstrate that the number of a company's LinkedIn followers (unlike Facebook and Twitter) has a positive, statistically significant effect on stock returns, which is interpreted as a signal of the company's social and relational capital. In other words, the number of followers on a specific social network has an effect on a company's performance and can be used as yet another web proxy.
Empirical studies predominantly confirm the positive effect of technological capabilities on companies' financial indicators. Oliveira et al. (2016) demonstrated that IT capabilities explain up to 48% of the variation in organisational process performance and improve companies' profit and market share growth. Ma et al. (2021) found a significant relationship between IT capabilities and firm performance through the enhancement of knowledge management and operational processes. However, Masli et al. (2011), examining a panel of companies over the period 1988–2007, revealed more complex dynamics. Companies with superior IT capabilities achieved higher levels of return on assets (ROA) and return on sales (ROS) up to 1999, but this advantage disappeared in the post-1999 period as basic technologies became widely replicated. Only companies with the highest levels of technological excellence were able to sustain superior ROA and ROS throughout the entire period. For their part, Moro-Visconti et al. (2025) confirmed a non-linear relationship, identifying a concave relationship between digital intensity and organisational financial performance based on an analysis of profitability indicators (ROS) and cash flow measures (Free Cash Flow to Equity/Revenues, Free Cash Flow to the Firm/Revenues) of European companies, which points to the existence of an optimal point of investment in digitalisation beyond which returns diminish. Valaskova et al. (2025), using a sample of 500 Slovak enterprises, likewise record a selective nature of this relationship. The level of digitalisation is statistically significantly related to total assets, earnings after taxes, and shareholders' funds, but not to total liabilities. The findings of the studies reviewed above demonstrate that the relationship between a company's technological capabilities and its financial performance depends on the time horizon, the industry, and the financial indicators selected.
This reinforces the need for a framework that would explain why observable company attributes, rather than financial indicators alone, can serve as an indicator of a firm's condition for external parties. Drawing on signalling theory, it can be assumed that certain observable company attributes are signals, that is, actions or characteristics that directly or indirectly indicate to stakeholders the intentions, motives, goals, or internal state of a firm, without requiring direct access to internal information (Zmud et al., 2010). As Connelly et al. note, an effective signal has two key characteristics, namely observability, that is, how easily external parties can notice it, and cost, which makes it difficult to falsify (Connelly et al., 2011). Wang et al. empirically confirm this relationship, showing that a higher level of information disclosure on a company's website is positively related to financial performance, with this effect being reinforced by greater readability and a more positive tone of the text (Wang et al., 2025). Mavlanova et al. distinguish signals along three dimensions (timing of purchase, cost, and ease of verification), including contact information, third-party certifications, privacy and return policies, consumer reviews, industry-specific content, payment mechanisms, and order confirmation (Mavlanova et al., 2012). Similar conclusions are reached by Sharma and Klein (2024), who analyse website features as trust signals for unfamiliar online sellers, among which authenticity attributes (professional website appearance, content quality) have the strongest effect on trust, whereas security attributes show the weakest effect according to the study's findings. The studies reviewed above generally confirm that observable, easily verifiable company attributes can serve as a reliable indicator of a firm's condition for external stakeholders even in the absence of direct access to internal information.
Among all elements of a company's digital presence, the domain occupies a special place, since, unlike website content, it is a static, publicly registered, and legally fixed element. Website disclosure or text tone can change arbitrarily and frequently, whereas changing a domain entails registration and reputational costs, which makes this signal more stable and less susceptible to falsification. As Zimmerman and Abel (1999) note, an important purpose of a domain is to identify the entity to which a website belongs, which directly links the domain to the function of enabling recognition of a company specifically by its customers and other external users. This signalling function of the domain is confirmed empirically. Nagel and Sandner, on the basis of expert interviews, show that a brand's domain extension is perceived as a signal of a company's trustworthiness, quality, security, and authenticity (Nagel & Sandner, 2015). The signalling function of the domain manifests itself not only in a marketing context but also in a broader technological one. Taplin (2023) shows that AI-based cybersecurity systems use the sender's domain as a verified identifier, assessing whether this domain has been encountered before and whether a confirmed business relationship with it exists. This indicates that the domain functions as a verified identifier not only for customers but also for automated trust-recognition systems, which further reinforces the argument for the robustness of this signal.
Empirical confirmation of this argument is provided by the study of Desmet et al. (2021), who developed and implemented, within the .eu domain registry, a system for predicting malicious registrations based on registrant data. The authors show that even malicious actors, when registering domains in bulk, are compelled to incur real economic costs in order to maintain the plausibility of registration data, which confirms the principle of “economic disincentivization“, since the cost and complexity of domain registration make it difficult to falsify this signal.
At the same time, a company's digital presence, in particular the characteristics of its domain and website, is increasingly regarded by researchers as an observable signal of its strategy, quality, and level of technological development.
The study of Altındağ and Öngel (2021), based on a sample of 495 managers from Turkish IT companies, also provides empirical confirmation of the relationship between management practices, as a proxy for human capital, and performance, showing that information management practices have a direct and positive effect on both the innovative and financial performance of a firm, thereby confirming the role of managerial capability as a component of human capital in the IT sector. A similar relationship is confirmed by the study of Mata et al. (2024), based on a sample of 308 managers from Portuguese IT companies, in which a firm's absorptive capacity, that is, its ability to accumulate and apply new knowledge, closely linked to managerial routines, mediates the effect of collaborative innovation on financial performance.
Innovation activity, as a proxy for structural capital, determines an IT company's capacity to create new products, technologies, and solutions, which directly affects its competitiveness and long-term financial performance. Accounting for this aspect in the model is important, since the effect of innovation activity on company performance manifests itself with a time lag. Campbell (2012), using a sample of American companies, showed that technological investments begin to positively affect company performance already in the year of investment, although this effect reaches its maximum only after 3–4 years, while Xie et al. (2020) confirmed a similarly long-term lag in the effect of R&D investment on the value of companies in China's technology sector. Empirical confirmation of the significance of innovation capital is provided by Wang and Chang (2005), who, using a sample of Taiwanese IT companies, demonstrated that innovation capital has a direct and positive effect on a company's financial performance. A similar relationship is confirmed by Radonić et al. (2021), who examined the perceptions of 101 experts from the Serbian IT industry, finding that, among the four components of intellectual capital, innovation capital (product reputation, copyrights, product reliability) shows the strongest relationship with a company's financial performance. The direct relationship between innovation performance and financial indicators is further confirmed by an empirical study of Turkish IT companies (Altındağ & Öngel, 2021), which demonstrated that a firm's innovation performance has a direct and positive effect on its financial and growth performance. The studies reviewed above generally confirm that innovation activity is a significant factor in the financial performance of IT companies, although its effect may manifest itself with a certain time lag.
The effect of a company's public status on its financial indicators remains contested. Kim et al. (2025), analysing 62,702 Japanese companies over the period 2002–2022, found that listed companies are more prone to earnings manipulation than non-listed ones, which indicates that short-term incentives outweigh the corporate governance benefits conferred by listing. At the same time, Capasso et al. (2005), applying a matched-pairs methodology to a sample of 30 pairs of European companies over the period 1999–2003, showed the opposite picture. Listed companies demonstrate faster revenue growth and use lower financial leverage, yet exhibit lower return on equity (ROE) compared with non-listed companies. A decline in profitability following a company's transition to public status is also confirmed by the study of Pagano et al. (1998), who, unlike the cross-sectional comparisons of Kim et al. and Capasso et al., track the same panel of Italian companies before and after their Initial Public Offering (IPO), thereby recording a persistent decline in ROA after a company's listing. A similar post-IPO decline in performance is also recorded by Mikkelson et al. (1997), using a sample of 283 American companies, although the authors attribute the main cause to company size and age rather than to earnings manipulation or changes in managerial ownership structure. The findings of these studies demonstrate the contradictory nature of listing's effect on financial performance, since the benefits of access to capital are offset by heightened pressure on managers to deliver short-term results.
The literature review conducted demonstrates that traditional methods of assessing intellectual capital are based predominantly on financial reporting and do not provide a direct indicator of customer capital. Since the domain performs the function of identifying a company specifically for its customers and external users (Zimmerman & Abel, 1999), and since its level of technological sophistication signals a company's digital orientation (Connelly et al., 2011; Nagel & Sandner, 2015), it can serve as a reliable and easily verifiable proxy indicator of customer capital. Accordingly, a positive relationship is expected between domain technological sophistication and financial performance.
H1 (ROA, PM): European IT companies with a higher level of domain technological sophistication have higher financial performance indicators (ROA, PM).
Studies of companies' public status (Kim et al., 2025; Capasso et al., 2005; Pagano et al., 1998) demonstrate contradictory results; however, for market leaders, public status is typically associated with better access to capital and enhanced corporate governance.
H2 (ROA, PM): Public IT companies in the European region have higher financial performance indicators (ROA, PM) compared with private companies.
Although the study of Altındağ and Öngel (2021) records a positive relationship between management practices and IT firm performance, management intensity, as measured in this study, reflects not the quality of practices but the share of managerial personnel, that is, rather an additional operational burden; we therefore expect a cost-related effect rather than a positive one.
H3 (ROA, PM): An increase in Management Intensity leads to a decrease in the financial performance indicators (ROA, PM) of European IT companies.
Since the effect of innovation investment manifests itself with a time lag (Campbell, 2012; Xie et al., 2020), within a single year under study we expect a rather cost-related effect of innovation intensity on financial indicators.
H4 (ROA, PM): An increase in Innovation Intensity leads to a decrease in the financial performance indicators (ROA, PM) of European IT companies.
2. Materials and Methods
The study is based on cross-sectional data covering 2558 European IT companies that represent market leaders by sales volume in 2023. The empirical basis of the study comprises secondary data obtained from the international Orbis database and companies' financial statements.
The sample covers different types of IT enterprises in accordance with the NACE Rev. 2 classification (Section J, Information and Communication): 620, Computer programming, consultancy and related activities; 631, Data processing, hosting and related activities; web portals; and 639, Other information service activities. This sample composition ensures the representativeness of the study and the possibility of generalising the findings to the European IT sector.
A requirement for the selected companies was that they be chosen from the pool of leaders by sales volume in 2023. Due to a lack of the data required for the analysis, not all such companies were included in the final sample.
The use of cross-sectional data for 2023 allows for an analysis of the effect of the determinants under study on the financial performance of IT companies without accounting for temporal dynamics, which is consistent with the aim of the study, namely to identify current relationships among the variables.
Hypotheses for ROA:
H1ROA: European IT companies with a higher level of domain technological sophistication have a higher ROA.
H2ROA: Public IT companies in the European region have a higher ROA compared with private companies.
H3ROA: Management Intensity is negatively associated with the ROA of European IT companies.
H4ROA: Innovation Intensity is negatively associated with the ROA of European IT companies.
Hypotheses for PM:
H1PM: European IT companies with a higher level of domain technological sophistication have a higher Profit Margin.
H2PM: Public IT companies in the European region have a higher Profit Margin compared with private companies.
H3PM: Management Intensity is negatively associated with the Profit Margin of European IT companies.
H4PM: Innovation Intensity is negatively associated with the Profit Margin of European IT companies.
Model specification. Regression equation:
where DV — dependent variable (ROA, PM), with i = entity; α — intercept; β — regression coefficient; Dom_tech, DList_st, Man_Int, Innov_Int — independent variables, where i = entity; ε — error term.
To empirically test the formulated hypotheses, the study variables were defined, the specification of which is presented in Table 1.
The research approach employs proxy indicators for customer, human, and structural capital as the three components of the intellectual capital of leading European IT companies. Specifically, domain technological sophistication serves as a proxy for customer capital, Management Intensity serves as a proxy for human capital, and Innovation Intensity serves as a proxy for structural capital.
The author’s approach is based on an innovative methodology for assessing the digital maturity of IT companies through the analysis of the technological level of their domain names. The concept is based on the assumption that the type of domain reflects the technological progress and digital orientation of the company (Table 2). One domain name can be used by several companies in the sample (for example, regional divisions or branches of one corporation can have different national domains). Unlike traditional self-assessment methods or expert assessments of digital maturity, domain names are an objective and easily verified indicator that allows for large-scale analysis without the need to collect complex questionnaire data.
The emergence of new domain extensions, which formed the basis of the proposed classification, is directly linked to the launch of the New gTLD Programme by the Internet Corporation for Assigned Names and Numbers (ICANN) in 2012–2013. Prior to this, the number of generic top-level domains (gTLDs) was limited to twenty-two. The new programme allowed companies and organisations to apply for their own customised top-level domains, substantially expanding their number (Musiani, 2013).
The categorical division of domain names into top-level domains that are not tied to a specific country (for example, .com, .org) and country-code domains, control over which is exercised by the respective state (for example, .de, .pl, .fr), is well established in domain name research (Sinisalo, 2018) and underlies the distinction between the “Global Strategy” and “Local Strategy” categories in the proposed classification (Table 2).
The developed classification (Table 2) makes it possible to transform the qualitative characteristics of domain extensions into a quantitative indicator of digital maturity. The conversion of scores into a percentage scale (25%–100%) ensures the convenience of interpreting the results and the possibility of comparing companies with different levels of domain technological sophistication. It is worth emphasising that each company in the sample is assessed on the basis of its primary corporate domain, even if several companies use the same root domain (for example, conscia.dk, conscia.com, conscia.no). This approach provides the foundation for the empirical testing of hypotheses concerning the relationship between the technological level of the domain and the financial indicators of IT companies, which constitutes the main aim of the study.
The research methodology is based on the application of multiple linear regression using the ordinary least squares (OLS) method to test the influence of the studied determinants on the ROA and PM indicators of European IT companies. Robust standard errors were used in both regression models to ensure the reliability of the results. Statistical analysis was performed using the Gretl software package.
3. Results
3.1. Sample
The structural distribution of the sample by type of economic activity is presented in Table 3.
The structural analysis of the sample shows that the largest share is accounted for by companies in the categories “Computer programming activities” (42.1%) and “Computer consultancy activities” (23.4%), which together form over 65% of the surveyed enterprises.
The structure of the sample by country of origin of the companies is given in Table 4.
The sample covers 36 European countries. Geographical analysis shows the predominance of Italy (16.2%), Germany (10.5%), Sweden (10.0%), and Spain (9.9%), which together account for nearly 50% of all companies under study, demonstrating a high concentration of the European IT sector.
3.2. Descriptive Statistics
Table 5 shows the descriptive statistics of all variables for our research.
Descriptive statistics demonstrate a right-sided asymmetry of the distribution for most indicators, which is manifested in the excess of the mean values over the medians for ROA, PM, Man_Int and Innov_Int. Particularly pronounced asymmetry is observed for Innov_Int with a large difference between the mean and the median. The share of companies with the status “Listed” is 7%, which emphasizes the dominance of private companies in the sample.
3.3. Diagnostic Tests
Before analysing the results of Model 1 and Model 2, these models must be tested against several mandatory requirements.
1)Multicollinearity. The presence of multicollinearity among the independent variables used in Model 1 and Model 2 was assessed using a correlation matrix (Figure 1).
The correlation matrix shows the absence of multicollinearity problems between independent variables. The highest correlation coefficient is observed between DList_st_1 and Innov_Int (0.4), which is an acceptable level and does not exceed the critical value of 0.7. Other variables are characterized by weak correlations, which indicates their independence and suitability for inclusion in the regression model.
2)F-test. The F-test confirms the statistical significance of both regression models. Model 1 with the dependent variable ROA is characterized by an F-statistic of 65.77 (p < 0.001), which indicates a high overall significance of the model and rejection of the null hypothesis that all regression coefficients are zero.
Model 2 with the dependent variable PM also confirms statistical significance with an F-statistic of 23.96 (p < 0.001). Despite the lower value of the F-statistic compared to Model 1, the model remains statistically valid for analyzing the impact of the studied factors on profitability.
3)Checking the normality of the distribution of residuals. The diagnosis of the normality of the residuals was carried out using Q-Q plots, which are presented in Figure 2.
The Q-Q plot of residuals for Model 1 (dependent variable ROA) indicates a satisfactory degree of conformity with the normal distribution. The bulk of observations (80–90%) generally follow the diagonal line, with only minor deviations at the extreme tails. The observed deviations are compensated for by the use of robust standard errors and the large sample size (n = 2558). The model satisfies the basic assumptions of regression analysis and is suitable for further application without additional adjustments.
A similar situation is observed for Model 2 (dependent variable PM). The bulk of observations generally follow the diagonal line, with only minor deviations at the extreme tails. Similar issues are observed in the form of isolated outliers in the left tail (quantiles < −35) and the right tail (quantiles > 35). The observed deviations are compensated for by the use of robust standard errors and the large sample size (n = 2558). Model 2 satisfies the basic assumptions of regression analysis and is suitable for further application without additional adjustments.
4)Heteroscedasticity. The Breusch–Pagan test confirmed the presence of heteroscedasticity in both models (p < 0.001 for both), which justifies the use of robust standard errors to ensure the correctness of the statistical inferences.
Testing for autocorrelation of residuals was not conducted, since the study is based on cross-sectional data representing different IT companies at a single point in time. Under such conditions, autocorrelation of residuals is unlikely, owing to the absence of a natural temporal ordering among observations. Autocorrelation is a relevant concern primarily for time-series or panel data, where a sequence of observations over time exists that can give rise to dependence between successive residuals.
3.4. Regression Results
The results of the empirical estimation of the regression models using the OLS method are presented in Table 6.
In Model 1 (ROA), Dom_tech, Man_Int, and Innov_Int proved to be statistically significant, whereas DList_st_1 has no statistically significant effect. Among the significant variables, all show a negative effect on ROA. Dom_tech exhibits a weak negative effect, which may reflect the short-term costs of maintaining technologically advanced domains without a corresponding return. Man_Int is likewise characterised by a negative effect, indicating a possible inefficiency associated with an excessive managerial burden. Innov_Int shows the strongest negative effect, reflecting the short-term costs of innovation activity that have not yet translated into financial results.
In Model 2 (PM), only Man_Int and Innov_Int are statistically significant, whereas Dom_tech and DList_st_1 have no statistically significant effect. Man_Int shows a positive effect on PM, which may indicate the effectiveness of managerial control over operational processes and the optimisation of the cost structure. Innov_Int retains a negative effect, confirming the hypothesis regarding the cost-intensive nature of innovation investment in the short term and its negative effect on operating profitability. The absence of a statistically significant effect of Dom_tech points to the absence of a direct relationship between the technological level of the domain and operational efficiency.
Table 7 summarises the results of the analysis conducted.
3.4. Limitations
The findings of the study should be interpreted with due regard for a number of limitations. First, the use of cross-sectional data for 2023 does not allow for the establishment of causal relationships or the analysis of dynamic effects of the factors under study. Second, the moderate explanatory power of the models (R² = 7.96% for ROA and 5.51% for PM) indicates the presence of other important determinants of financial performance not included in the analysis. Third, the proposed methodology for assessing digital maturity through domain names, while innovative, may not fully capture companies' actual level of technological sophistication. In addition, the negative coefficients for the innovation variables may reflect only short-term effects, whereas the long-term returns to innovation remain beyond the scope of the analysis. Finally, the sample is limited to leading European IT companies, which may constrain the generalisability of the findings to other geographical regions and market segments.
4. Discussion
Based on the results of the analysis conducted, H1, which posited that European IT companies with a higher level of domain technological sophistication have higher financial performance indicators (ROA, PM), was partially confirmed for ROA, since Dom_tech showed a statistically significant effect, although the direction of the relationship proved to be negative rather than positive. For PM, the hypothesis is rejected, as no statistically significant effect was found.
The negative effect of Dom_tech on ROA obtained can be explained by the fact that maintaining a technologically advanced domain (for example, .io, .tech, .ai) is associated with additional costs compared with traditional .com or country-code extensions. These costs may be reflected in ROA immediately, whereas the benefits of signalling customer capital through a technological domain are likely to materialise over a longer horizon, in particular through increased customer and partner trust. This is consistent with the logic of Zimmerman and Abel (1999) and Nagel and Sandner (2015), who emphasise that a domain functions primarily as a signal for external stakeholders rather than as a direct driver of operational efficiency, and therefore an immediate positive effect on return on assets should not be expected.
The absence of a significant relationship between Dom_tech and PM, in turn, confirms the observation of Wang et al. (2025), according to which the strength of a signal depends not only on the mere presence of a technological domain but also on the accompanying characteristics of a company's digital presence, in particular website content quality and readability. This may indicate that the domain by itself is too generalised a proxy indicator, capturing only a single dimension of a company's digital presence.
Assessing relational capital through expert surveys of 200 professionals from 60 commercial open-source software (COSS) companies, Garomssa et al. (2022) confirmed a direct positive relationship between relational capital and company success. Unlike their subjective, resource-intensive method, Dom_tech is an objective web proxy; however, the opposite direction of the result found here suggests that domain technological sophistication and the depth of customer relationships assessed by experts capture different aspects of relational capital.
A categorical approach to assessing companies' digital maturity is also applied by other researchers, albeit on the basis of different criteria. Moro-Visconti et al. (2025) classify companies by level of digital intensity based on the percentage of business processes that have undergone digitalisation, distinguishing three levels: Low Digital Intensity (less than 20% of business processes digitalised), High Digital Intensity (40–70% digitalised, including core revenue-generating activities), and Very High Digital Intensity (more than 70% digitalised, involving the use of AI, big data, or advanced analytics). In contrast to this approach, which requires detailed internal data on a company's business processes, the domain extension classification proposed in this study relies exclusively on publicly available information, which makes it suitable for large-scale analysis without the need for additional data-collection resources.
This limitation must be taken into account when interpreting the negative coefficient of Dom_tech for ROA, since it may reflect not so much a genuine causal relationship as a characteristic of the sample. Most companies in the sample (75% or more, per Table 5) have Dom_tech at the level of 75–100%, that is, they are concentrated in the upper categories of the classification, so the variation in the indicator is limited in the lower range, which could have affected the precision of the coefficient estimate. Furthermore, the classification of domains based on a fixed list of extensions does not account for possible changes over time in how individual domain zones are perceived by investors and customers.
Hypothesis H2, concerning higher financial performance indicators (ROA, PM) among public IT companies compared with private companies, is rejected for both models, since public status showed no statistically significant effect on either ROA or PM.
This result is consistent with the logic of Kim et al. (2025), who, using a sample of Japanese companies, showed that the benefits of listing are largely offset by heightened short-term managerial incentives, and with the findings of Pagano et al. (1998) and Mikkelson et al. (1997) regarding the decline in company performance following an IPO. At the same time, this contradicts the expectation of Capasso et al. (2005) concerning public companies' better access to capital. A plausible explanation lies in the structure of the sample, in which public companies account for only 7% (Table 5), which limits the statistical power of the test of this hypothesis.
Hypothesis H3, according to which an increase in Management Intensity reduces the financial performance (ROA, PM) of European IT companies, is accepted for ROA, since Man_Int showed a statistically significant negative effect, consistent with expectations. At the same time, an opposite result was obtained for PM, namely a statistically significant positive effect.
The negative effect of Man_Int on ROA is consistent with the logic that a larger share of managerial personnel represents an additional operational burden without a direct contribution to value creation, since managers, unlike operating personnel, are not directly involved in producing goods or delivering services. This is also consistent with the study's initial premise that management intensity in this model reflects a quantitative rather than a qualitative aspect of management, in contrast to the studies of Altındağ and Öngel (2021) and Mata et al. (2024), where it is the quality of management practices, rather than the share of managerial personnel, that is associated with better performance.
The positive effect of Man_Int on PM can be explained by the fact that a higher share of managerial personnel may ensure better control over operating costs and pricing, which is directly reflected in sales profitability, even if it does not improve the overall efficiency of asset utilisation. This divergence between ROA and PM illustrates the limitations of a single-proxy approach to human capital, an issue highlighted by Mata et al. (2024), where some questionnaire items measuring collaborative innovation had to be excluded owing to insufficient factor loadings, underscoring the difficulty of constructing a reliable aggregate indicator of human capital even with careful methodological preparation. Man_Int, being an objective and easily verifiable indicator, avoids this problem of subjectivity, but captures only the quantitative dimension of a company's managerial resources, leaving its qualitative characteristics, in particular competence and decision-making effectiveness, unaddressed.
An increase in Innovation Intensity, according to H4, was expected to lead to a decrease in the financial performance (ROA, PM) of European IT companies. This hypothesis is accepted for both models, since Innov_Int demonstrated a statistically significant negative effect on both ROA and PM, with this effect proving to be the strongest among all the independent variables in the study.
This result confirms the time-lag logic underlying the hypothesis itself. Campbell (2012), using a sample of American companies, showed that technological investments begin to positively affect performance only three to four years after they are made, while Xie et al. (2020) recorded a similarly long-term lag for R&D investment among companies in China's technology sector. Since the study is based on cross-sectional data for a single year, it inevitably captures companies at different stages of this cycle, and the predominance of short-term cost effects over long-term returns is fully consistent with the studies cited above.
According to Usai et al. (2021), digital technologies by themselves have almost no effect on a company's innovation performance, whereas R&D investment remains a considerably stronger predictor. This is consistent with the logic of H4, according to which an increase in Innovation Intensity is associated with a decrease in financial indicators precisely because of the short-term, cost-intensive nature of innovation activity, the returns to which have not yet had time to materialise. At the same time, the researchers emphasise that their findings concern innovation performance rather than financial performance, and therefore transferring this conclusion directly to ROA or Profit Margin requires caution and remains a compatible assumption rather than direct empirical confirmation.
The result obtained resonates with the findings of Wang and Chang (2005) and Radonić et al. (2021), who, using samples of Taiwanese and Serbian IT companies, respectively, recorded a direct positive relationship between innovation capital and financial performance. This divergence may be explained by differences in the proxy indicators employed. Wang and Chang (2005) and Radonić et al. (2021) used perceptual or composite indicators of innovation capital (product reputation, copyrights, product reliability), whereas Innov_Int in this study is calculated as the share of intangible assets in a company's total assets and therefore captures the volume of investment in innovation rather than its performance.
5. Conclusions
This study examined the effect of domain technological sophistication, as a proxy indicator of customer capital, on the financial performance (ROA, Profit Margin) of 2558 leading European IT companies by sales volume in 2023. The specificity of this sample lies in the fact that the activity of such companies takes place predominantly in a digital environment and is focused on promoting digital products, which justifies the use of domain as a proxy indicator of customer capital specifically for this market segment. The model was comprehensive, since, in addition to domain, it accounted for management and innovation intensity as proxies for human and structural capital, respectively, as well as for the public status of a company as a control variable.
The choice of domain as a proxy indicator of customer capital is grounded in its static nature. Unlike other web proxies, such as website content, the number of social media followers, or the tone of communication, which can change arbitrarily and frequently, changing a domain entails registration and reputational costs, which makes this signal more stable and less susceptible to falsification. The findings obtained demonstrate an ambiguous relationship between the intellectual capital components under study and the financial performance of leading European IT companies. Domain technological sophistication showed a significant, though negative, effect on ROA and no relationship with Profit Margin, which indicates that domain functions rather as a signal for external stakeholders, the benefits of which materialise over a longer horizon, than as a direct driver of operational efficiency. Management intensity demonstrated opposite-direction effects for ROA and Profit Margin, illustrating the limitations of this indicator as a single proxy for human capital, which captures only the quantitative, rather than the qualitative, dimension of managerial resources. Innovation intensity proved to be the strongest predictor among all the variables, demonstrating a consistent negative effect in both models, which is consistent with the time-lag logic between innovation investment and its financial returns. A company's public status showed no significant effect on either performance indicator.
The findings obtained do not provide an unambiguous answer to the question of the suitability of domain as a standalone proxy indicator of customer capital. The statistically significant, albeit negative, effect for ROA indicates that domain captures a certain dimension of a company's activity, whereas the absence of a relationship with Profit Margin points to the limited explanatory power of this indicator. Although the study sample is sufficiently large in terms of the number of companies (2558), it covers only a single year of observations, which necessitates further verification of the stability of the effect obtained using panel data to establish whether the negative effect on ROA is temporary in nature.
The scientific novelty of the study lies in formalising an IT company's domain as an objective, easily verifiable proxy indicator of customer capital, integrated into a model that covers all three components of intellectual capital. The practical significance of the results is determined by the possibility of using the proposed methodology for the rapid assessment of the digital component of companies' intellectual capital by investment analysts, consulting companies, and IT companies themselves.
The findings should be interpreted with due regard for the study's limitations, in particular the cross-sectional nature of the data and the limitation of the sample to market leaders, which constrains the generalisability of the conclusions to the IT sector as a whole. Prospects for further research are associated with the application of panel data to identify dynamic effects, as well as with expanding the range of proxy indicators for human capital to more accurately reflect its qualitative characteristics.
Author Contributions
Conceptualization, T.Z. and S.L.; methodology, T.Z.; software, T.Z.; validation, T.Z. and S.L.; formal analysis, T.Z.; investigation, T.Z.; resources, T.Z. and S.L.; data curation, T.Z.; writing—original draft preparation, T.Z.; writing—review and editing, T.Z. and S.L.; visualization, T.Z.; supervision, S.L.; project administration, S.L.; funding acquisition, not applicable. All authors have read and agreed to the published version of the manuscript.
Funding
This research received no external funding.
Institutional Review Board Statement
Not applicable.
Informed Consent Statement
Not applicable.
Data Availability Statement
The data supporting the results of this study are openly available in Zenodo at https://doi.org/10.5281/zenodo.21344674 (Zavalii, 2026).
Acknowledgments
During the preparation of this manuscript, the authors used Claude (Anthropic, Claude Sonnet 5) to improve the translation of the manuscript text, as well as for language editing and improving readability. All content was reviewed, edited, and approved by the authors, who take full responsibility for the content of this publication.
Conflicts of Interest
The authors declare no conflicts of interest.
Abbreviations
The following abbreviations are used in this manuscript:
| CEE | Customer Capital Efficiency |
| COSS | Commercial Open-Source Software |
| DEA | Data Envelopment Analysis |
| GMM | Generalized Method of Moments |
| gTLD | Generic Top-Level Domain |
| HCE | Human Capital Efficiency |
| IC | Intellectual Capital |
| ICANN | Internet Corporation for Assigned Names and Numbers |
| IPO | Initial Public Offering |
| MVAIC | Modified Value Added Intellectual Coefficient |
| NACE | Statistical Classification of Economic Activities in the European Union |
| OLS | Ordinary Least squares |
| PLS-PM | Partial Least Squares Path Modeling |
| PM | Profit Margin |
| ROA | Return on Assets |
| ROCE | Return on Capital Employed |
| ROE | Return on Equity |
| ROS | Return on Sales |
| SCE | Structural Capital Efficiency |
| TLD | Top-Level Domain |
| VAIC | Value Added Intellectual Coefficient |
References
- Altındağ, Ö., & Öngel, V. (2021). Information management, organizational intelligence, and innovation performance triangle: Empirical research on Turkish IT firms. SAGE Open, 11(4), 1–18. [CrossRef]
- Bansal, A., Singh, S., & Bansal, P. (2025). The intellectual capital-performance nexus: Analyzing financial returns through static and dynamic models. International Research Journal of Multidisciplinary Scope, 6(1), 911–926. [CrossRef]
- Bhasin, M. L. (2011). Disclosure of intellectual capital in annual reports: An empirical study of the Indian IT corporations. Modern Economy, 2(5), 455–467. [CrossRef]
- Bontis, N. (2003). Intellectual capital disclosure in Canadian corporations. Journal of Human Resource Costing and Accounting, 7(1), 9–20. [CrossRef]
- Campbell, M. (2012). What a difference a year makes: Time lag effect of information technology investment on firm performance. Journal of Organizational Computing and Electronic Commerce, 22(3), 237–255. [CrossRef]
- Capasso, A., Rossi, M., & Simonetti, B. (2005). Ownership structure heterogeneity and performance: A comparison between listed and unlisted companies. SSRN. [CrossRef]
- Chyzhevska, L., Voloschuk, L., Shatskova, L., & Sokolenko, L. (2021). Digitalization as a vector of information systems development and accounting system modernization. Studia Universitatis “Vasile Goldis” Arad. Economics Series, 31(4), 18–39. [CrossRef]
- Connelly, B. L., Certo, S. T., Ireland, R. D., & Reutzel, C. R. (2011). Signaling theory: A review and assessment. Journal of Management, 37(1), 39–67. [CrossRef]
- Cruciata, P., Pulizzotto, D., & Beaudry, C. (2024). First impressions on sustainable innovation matter, using NLP to replicate B-lab environmental index by analyzing companies' homepages. Technological Forecasting & Social Change, 205, 123455. [CrossRef]
- Desmet, L., Spooren, J., Vissers, T., Janssen, P., & Joosen, W. (2021). Premadoma: An operational solution to prevent malicious domain name registrations in the .eu TLD. Digital Threats: Research and Practice, 2(1), 1–24. [CrossRef]
- Dsouza, S., Kallach, L., Demiraj, R., & Zaidi, S. F. H. (2026). Unveiling the power of intellectual capital in driving financial performance: A deep dive into the IT sector. Emerging Science Journal, 10(1), 165–183. [CrossRef]
- Duc, K. H., Tai, D. D., & Van Hau, N. (2025). The impact of intellectual capital on financial performance in information technology and telecommunications firms. Financial and Credit Activity: Problems of Theory and Practice, 4(63), 264–278. [CrossRef]
- Edvinsson, L., & Malone, M. S. (1997). Intellectual capital: Realizing your company's true value by finding its hidden brainpower. HarperBusiness.
- Garomssa, S. D., Kannan, R., Chai, I., & Riehle, D. (2022). How software quality mediates the impact of intellectual capital on commercial open-source software company success. IEEE Access, 10, 47827–47842. [CrossRef]
- Joshi, M., Ubha, D. S., & Sidhu, J. (2012). Intellectual capital disclosures by Indian and Australian information technology companies: A comparative analysis. Journal of Intellectual Capital, 13(4), 582–598. [CrossRef]
- Joshi, N., & Aggarwal, A. (2024). Modelling the impact of intellectual capital on financial performance: A case of Indian IT companies. Intellectual Economics, 18(1), 34–58. [CrossRef]
- Kim, H., Yasuda, Y., & Iwata, K. (2025). Listing status, stock liquidity, and earnings management: Evidence from listed and unlisted firms in Japan [Preprint]. https://dx.doi.org/10.2139/ssrn.5334509.
- Lehenchuk, S., Zeytinoglu, E., Hrabchuk, I., Zhalinska, I., & Oleksich, Z. (2023). Nexus between intellectual capital, financial performance and sustainable growth: Evidence from the Turkish ICT industry. Marketing and Management of Innovations, 2, 152–162. [CrossRef]
- Ma, F., Khan, F., Khan, K. U., & XiangYun, S. (2021). Investigating the impact of information technology, absorptive capacity, and dynamic capabilities on firm performance: An empirical study. SAGE Open, 11(4), 1–18. [CrossRef]
- Masli, A., Richardson, V. J., Sanchez, J. M., & Smith, R. E. (2011). Returns to IT excellence: Evidence from financial performance around information technology excellence awards. International Journal of Accounting Information Systems, 12(3), 189–205.
- Mata, M. N., Martins, J. M., & Inácio, P. L. (2024). Collaborative innovation and absorptive capacity as an antecedent on IT firm financial performance. Journal of the Knowledge Economy, 15(4), 6339–6361. [CrossRef]
- Mauder, P. (2018). The impact of social media followers on corporate value: An investigation of Australian firms. The International Technology Management Review, 7(1), 1–12. https://link.springer.com/article/10.2991/itmr.7.1.1.
- Mavlanova, T., Benbunan-Fich, R., & Koufaris, M. (2012). Signaling theory and information asymmetry in online commerce. Information & Management, 49(5), 240–247. [CrossRef]
- Mikkelson, W. H., Partch, M. M., & Shah, K. (1997). Ownership and operating performance of companies that go public. Journal of Financial Economics, 44(2), 281–307. [CrossRef]
- Moro-Visconti, R., Sánchez García, J., López Pascual, J., & Cruz Rambaud, S. (2025). Digitalization intensity and its impact on financial performance: The role of scalable platforms. Finance Research Letters, 74, 106772.
- Musiani, F. (2013). New global top-level domain names: Europe, the challenger. Internet Policy Review, 2(2). [CrossRef]
- Nagel, A., & Sandner, P. (2015). Evaluation of new generic top level domains from a brand and a trademark perspective. International Journal of Management and Marketing Research, 8(1), 93–112.
- Nkambule, N. A., Wang, W.-K., Ting, I. W. K., & Lu, W.-M. (2021). Intellectual capital and firm efficiency of US multinational software firms. Journal of Intellectual Capital, 23(6), 1404–1434. [CrossRef]
- Oliveira, D. de L., Maçada, A. C. G., & Oliveira, G. D. (2016). Business value of IT capabilities: Effects on processes and firm performance in a developing country. Review of Business Management, 18(60), 245–266. [CrossRef]
- Pagano, M., Panetta, F., & Zingales, L. (1998). Why do companies go public? An empirical analysis. The Journal of Finance, 53(1), 27–64. https://www.jstor.org/stable/117434.
- Radonić, M., Milosavljević, M., & Knežević, S. (2021). Intangible assets as financial performance drivers of IT industry: Evidence from an emerging market. E&M Economics and Management, 24(2), 119–135. [CrossRef]
- Rep, A., Žager, K., & Oliveira, C. (2019). The role of firm characteristics in voluntary disclosure of IC information and its importance for high-tech companies. Journal of Information and Organizational Sciences, 43(2), 185–209. [CrossRef]
- Shaneeb, P., & Sumathy, M. (2021). Impact of intellectual capital on firm performance in Indian IT companies. Journal of Contemporary Issues in Business and Government, 27(2), 4335–4340. [CrossRef]
- Sharma, V. M., & Klein, A. (2024). A signaling theory-based analysis of website features, investment perception and trust propensity in initial trust formation on unfamiliar small online retailers. Journal of Marketing Theory and Practice. [CrossRef]
- Singh, R. D. (2024). The impact of intellectual capital on financial performance: An empirical investigation of Indian technology industry. Journal of Management Research and Analysis, 11(2), 123–130. [CrossRef]
- Sinisalo, T. J. (2018). .eu regulations under Brexit. Baltic Journal of European Studies, 8(2), 121–144. [CrossRef]
- Stewart, T. A. (1997). Intellectual capital: The new wealth of organizations. Currency Doubleday.
- Taplin, R. (2023). Artificial intelligence, intellectual property, cyber risk and robotics: An overview. In R. Taplin (Ed.), Artificial intelligence, intellectual property, cyber risk and robotics: A new digital age (pp. 1–17). Routledge. [CrossRef]
- Usai, A., Fiano, F., Messeni Petruzzelli, A., Paoloni, P., Farina Briamonte, M., & Orlando, B. (2021). Unveiling the impact of the adoption of digital technologies on firms' innovation performance. Journal of Business Research, 133, 327–336. [CrossRef]
- Valaskova, K., Nagy, M., & Juracka, D. (2025). Digital transformation and financial performance: An empirical analysis of strategic alignment in the digital age. Journal of Enterprising Communities: People and Places in the Global Economy, 19(5), 1178–1205. [CrossRef]
- van Tonder, C., Bossink, B., Schachtebeck, C., & Nieuwenhuizen, C. (2024). Key dimensions that measure the digital maturity levels of small and medium-sized enterprises (SMEs). Journal of Technology Management & Innovation, 19, 110–130. [CrossRef]
- Wang, W.-Y., & Chang, C. (2005). Intellectual capital and performance in causal models: Evidence from the information technology industry in Taiwan. Journal of Intellectual Capital, 6(2), 222–236. [CrossRef]
- Wang, Y., Wang, T., Li, Y., & Li, J. (2025). Website disclosure and financial performance, evidence from U.S. hospitals using a textual analysis approach. International Journal of Accounting Information Systems, 56, 100741. [CrossRef]
- Xie, H., Yang, J., Yu, W., Yang, Y., & Wu, W. (2020). The time-lag effect of R&D investment on the value of listed companies in China: A cross-industry analysis. SAGE Open, 10(2). [CrossRef]
- Yin, J., & Xu, J. (2025). Intellectual capital, digital transformation and firms' financial performance: Evidence from ecological protection and environmental governance industry in China. PLOS ONE, 20(1), e0316724. [CrossRef]
- Yu, S., Liu, Y., & Hyun, E.-j. (2024). From technology to traffic: How website technological sophistication, brand recognition, and business model innovation drive consumer traffic in Korean e-commerce. Journal of Theoretical and Applied Electronic Commerce Research, 19(3), 2051–2069. [CrossRef]
- Zimmerman, M., & Abel, S. M. (1999). Securing and protecting a domain name for your web site: Trademarks, trade names and domain names in cyberspace. Computer Law & Security Report, 15(6), 363–378.
- Zmud, R. W., Shaft, T., Zheng, W., & Croes, H. (2010). Systematic differences in firm's information technology signaling: Implications for research design. Journal of the Association for Information Systems, 11(3), 149–181.
Figure 1.
Correlation matrix of independent variables. Note: Generated using Gretl software package. Source: compiled by authors.
Figure 1.
Correlation matrix of independent variables. Note: Generated using Gretl software package. Source: compiled by authors.
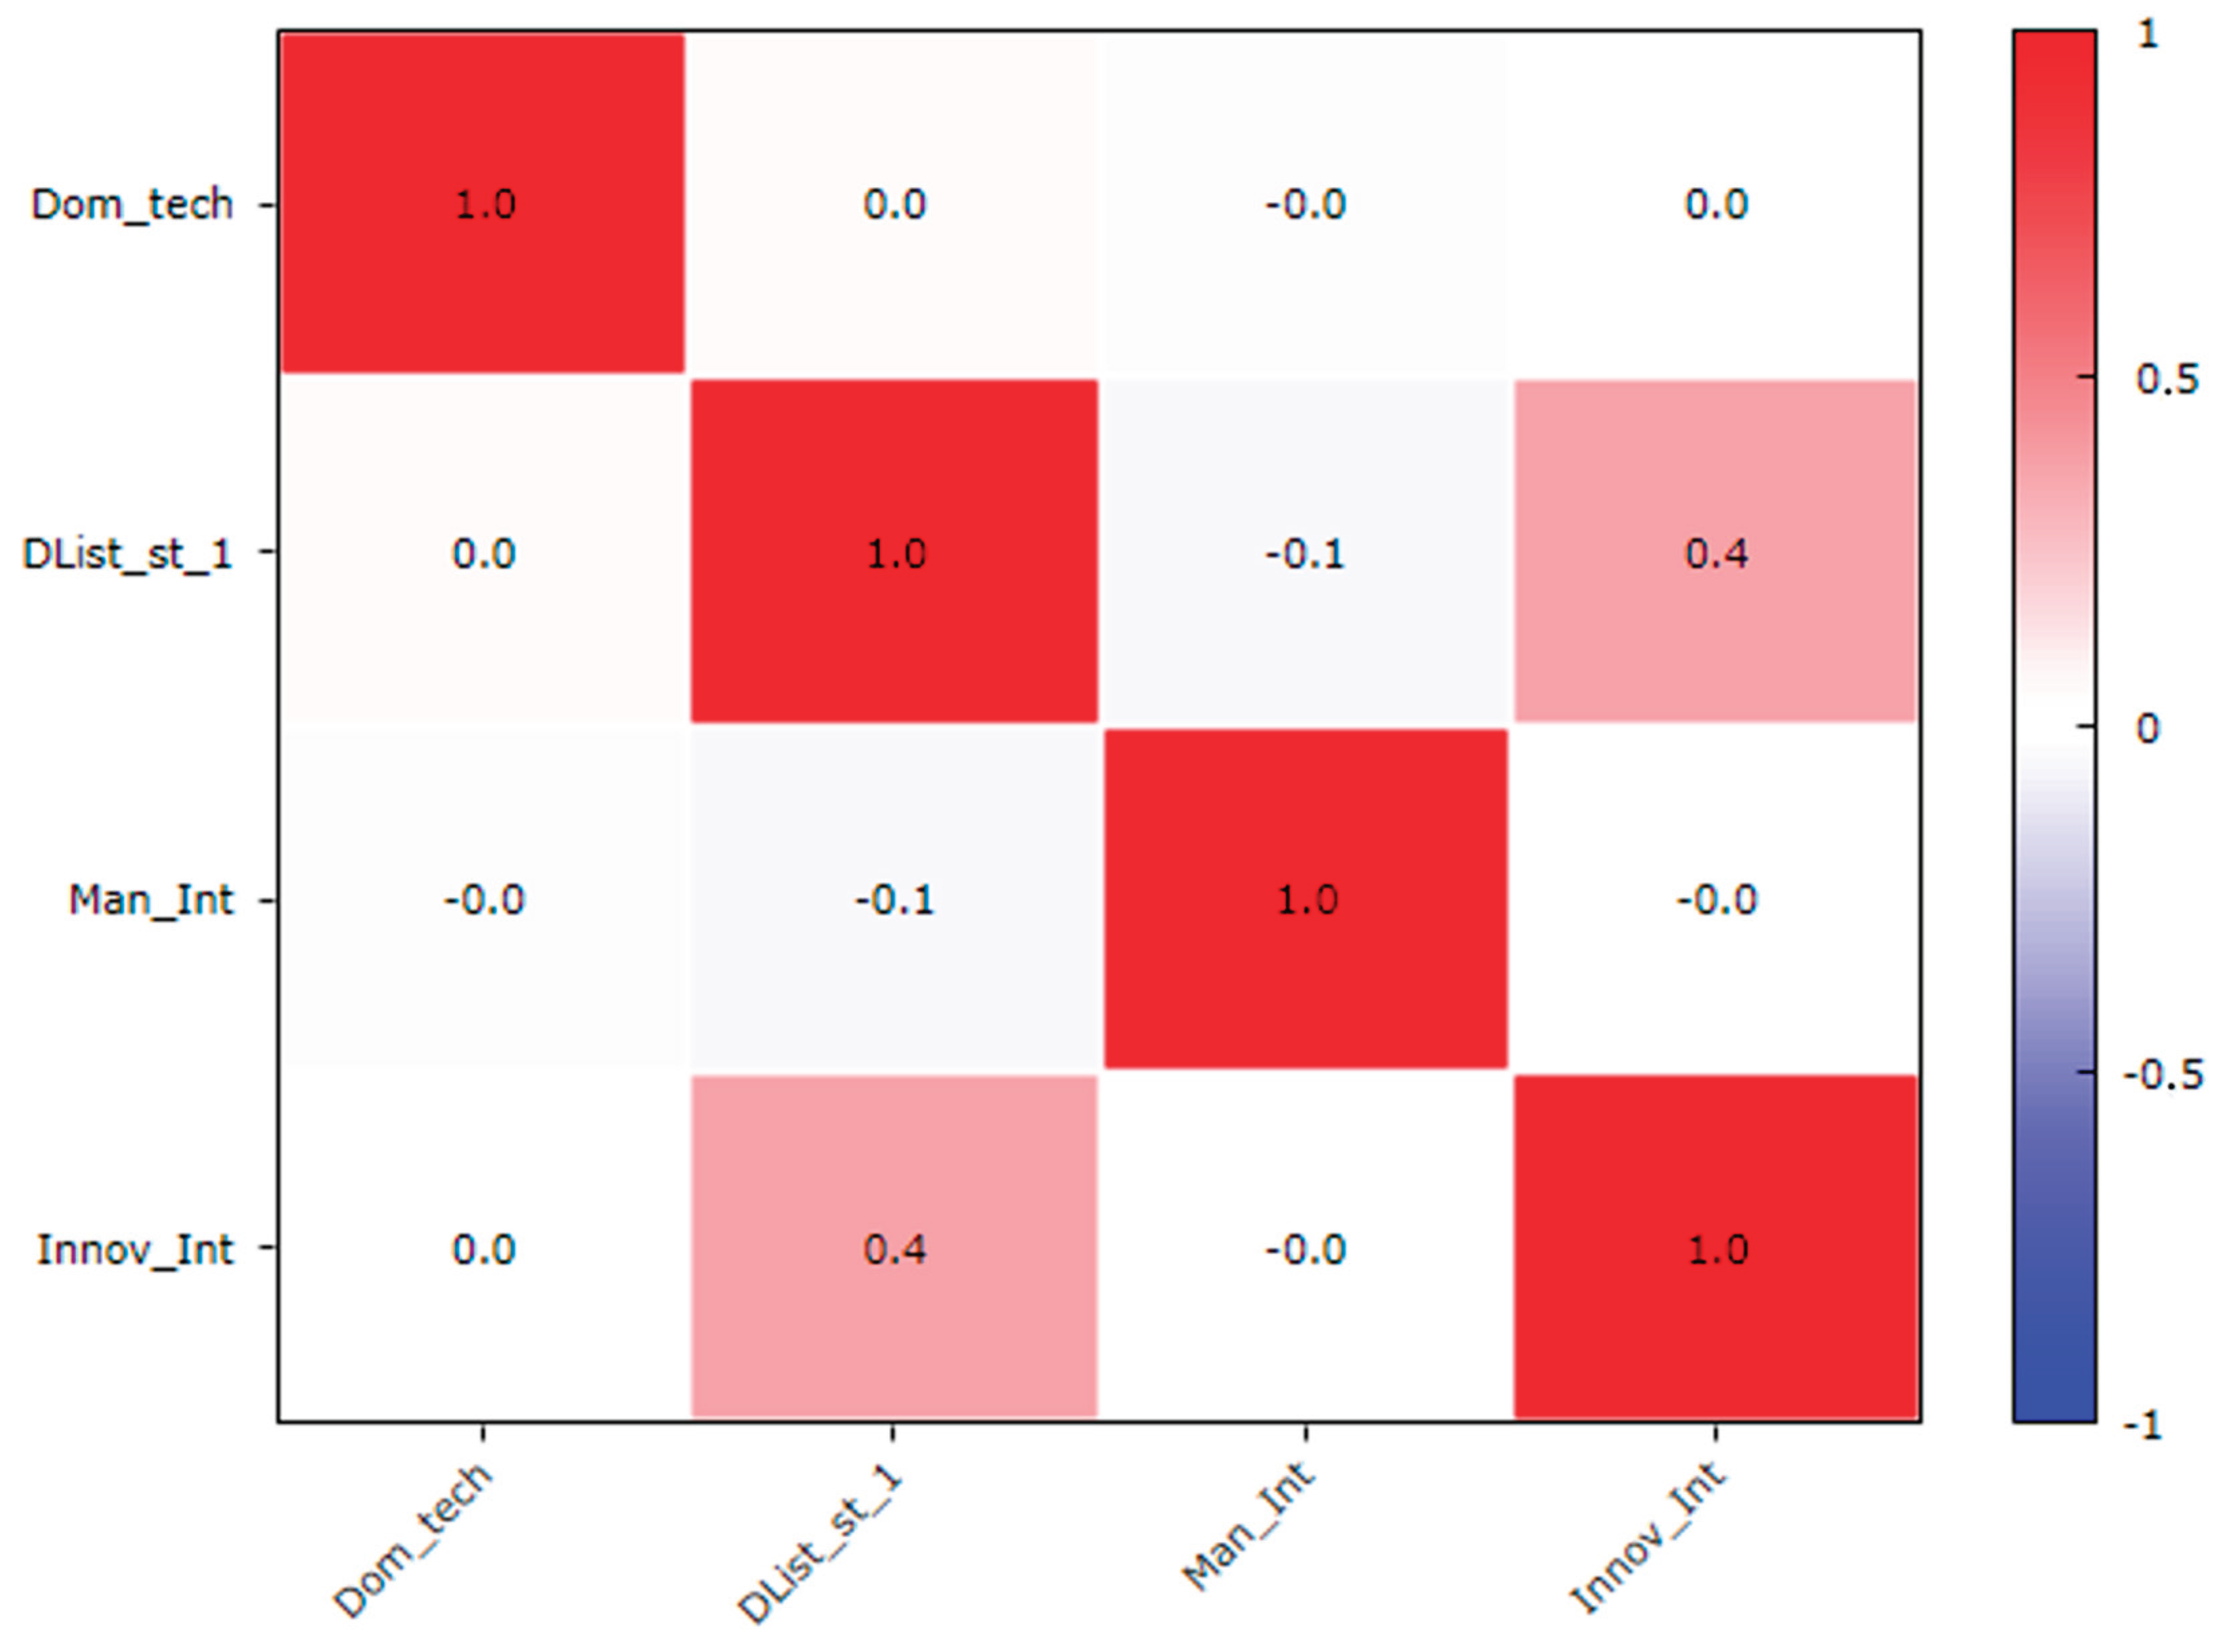
Figure 2.
Diagnostic of residuals normality in regression models (Q-Q plots). Note: Generated using Gretl software package. Source: compiled by authors.
Figure 2.
Diagnostic of residuals normality in regression models (Q-Q plots). Note: Generated using Gretl software package. Source: compiled by authors.
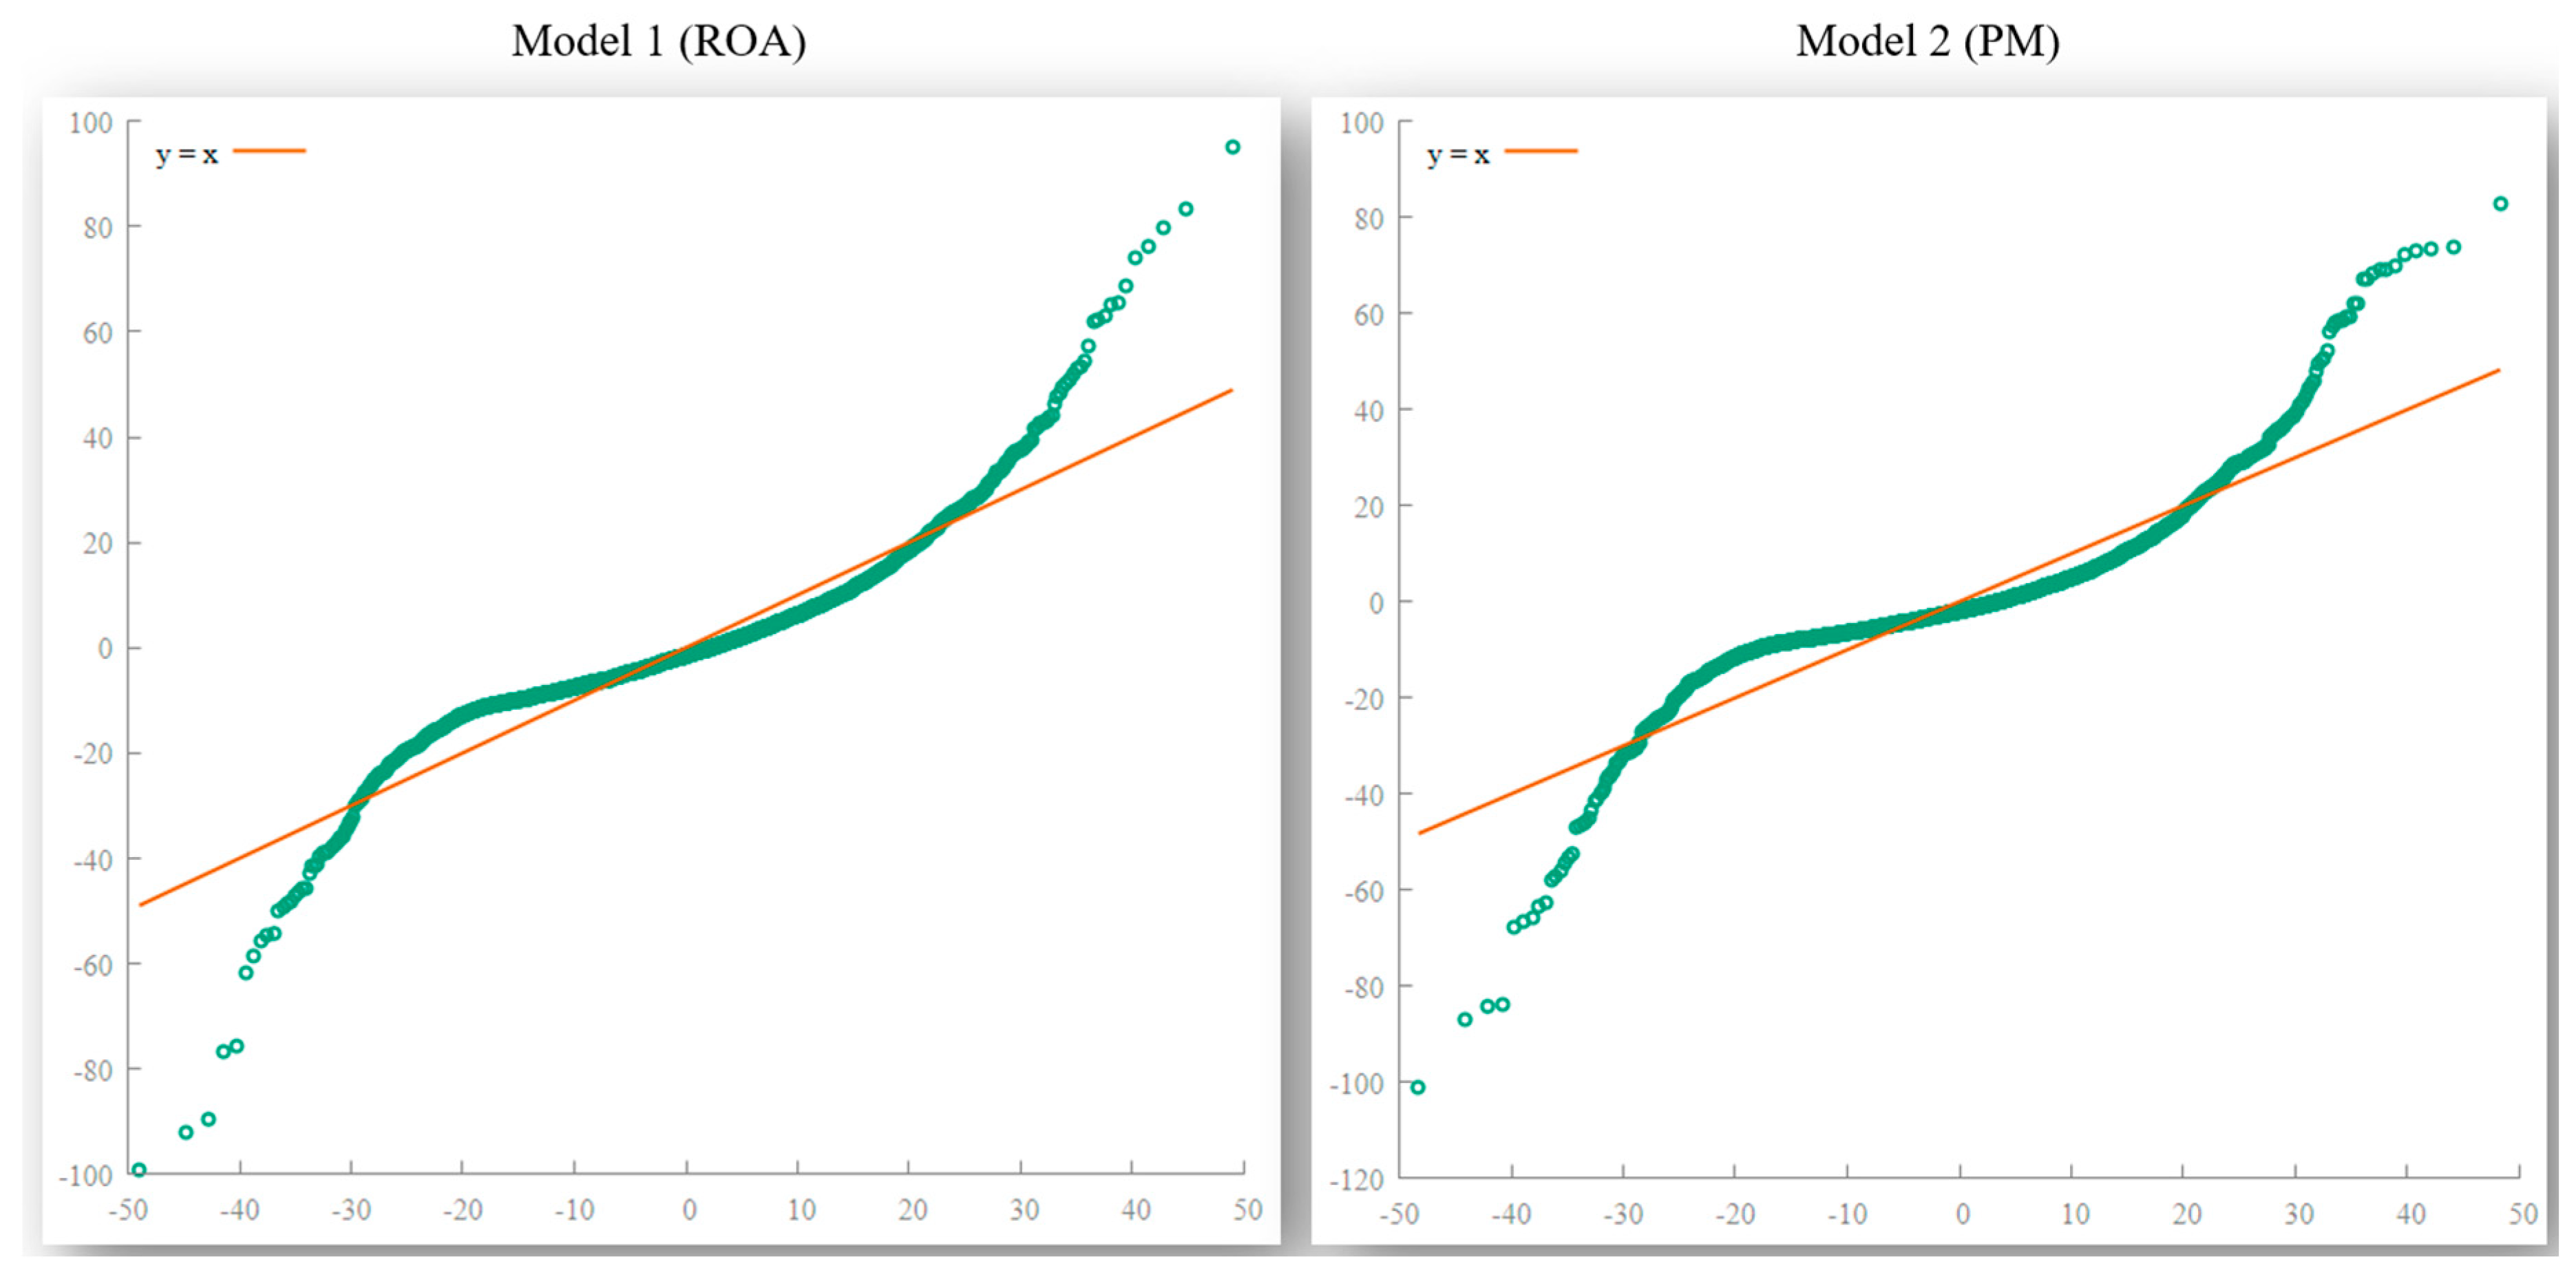

Table 1.
Summary of variables used in study.
| Variable | Calculation Method | Abbreviation | ||
|---|---|---|---|---|
| Variable Name | Dummy | |||
| Dependent variables | ||||
| Return on assets, % | Net income / Total assets × 100 % | ROA | - | |
| Profit margin | Profit (Loss) before tax / Sales × 100 % | PM | - | |
| Independent variables | ||||
| Domain technological sophistication, % | Domain-based digital maturity index | Dom_tech | - | |
| Management intensity, % | Number of directors and managers / Number of employees × 100 % | Man_Int | - | |
| Innovation intensity, % | Intangible assets / Total assets × 100 % | Innov_Int | - | |
| Control variable | ||||
| Listing status | Listed (yes) or Unlisted / Delisted (no) | List_st | DList_st_1 | |
Note: Dummy variable = binary variables (1 = yes/present, 0 = no/absent). Source: compiled by authors.
Table 2.
Classification of domains by level of digital maturity.
| Digital maturity level | Domains | Score | % |
|---|---|---|---|
| The highest level of innovation | .io, .tech, .ai, .cloud, .software, .digital | 4 | 100% |
| Global strategy | .com, .org, .net | 3 | 75% |
| Specialized strategy | .info, .biz, .one, .aero, .group, .events, .capital, .solutions, .beer, .health, .co, .online | 2 | 50% |
| Local strategy | .de, .fr, .it, .es, .pl, .uk, .nl, .be, .se, .no, .fi, .dk, .at, .ch, .gr, .hr, .tr, .hu, .mt, .ro, .pt, .is, .si, .bg, .sk, .ee, .lv, .lt, .cz, .eu, .md, .rs, .cn, .jp, .ca, .br, .tw, .pk, .lk, .ms, .cr, .cx, .tv, .nu, .za, .ua, .ie, .us | 1 | 25% |
Source: compiled by authors.
Table 3.
Sample distribution by NACE activity codes (by frequency).
| NACE Code | Count | % | Description |
|---|---|---|---|
| 6201 | 1077 | 42.1 | Computer programming activities |
| 6202 | 598 | 23.4 | Computer consultancy activities |
| 6209 | 435 | 17.0 | Other information technology service activities |
| 6311 | 197 | 7.7 | Data processing, hosting and related activities |
| 6203 | 108 | 4.2 | Computer facilities management activities |
| 6312 | 56 | 2.2 | Web portals |
| 6200 | 47 | 1.8 | Computer programming, consultancy and related activities |
| 6399 | 26 | 1.0 | Other information service activities |
| 6391 | 10 | 0.4 | News agency activities |
| 6390 | 2 | 0.1 | Other information service activities |
| 6300 | 1 | 0.0 | Information service activities |
| 6310 | 1 | 0.0 | Data processing, hosting and related activities |
| × | 2558 | 100.0 | × |
Source: compiled by authors.
Table 4.
Sample distribution by country (by frequency).
| No. | Country | Count | % | No. | Country | Count | % | Total |
|---|---|---|---|---|---|---|---|---|
| 1 | Italy | 415 | 16.2 | 19 | Slovakia | 28 | 1.1 | × |
| 2 | Germany | 269 | 10.5 | 20 | Serbia | 28 | 1.1 | × |
| 3 | Sweden | 257 | 10.0 | 21 | Croatia | 26 | 1.0 | × |
| 4 | Spain | 253 | 9.9 | 22 | Slovenia | 20 | 0.8 | × |
| 5 | Poland | 188 | 7.3 | 23 | Lithuania | 18 | 0.7 | × |
| 6 | Belgium | 164 | 6.4 | 24 | Ukraine | 17 | 0.7 | × |
| 7 | Norway | 150 | 5.9 | 25 | Czech Republic | 17 | 0.7 | × |
| 8 | Finland | 123 | 4.8 | 26 | Estonia | 12 | 0.5 | × |
| 9 | Portugal | 80 | 3.1 | 27 | Latvia | 12 | 0.5 | × |
| 10 | Denmark | 78 | 3.0 | 28 | Iceland | 7 | 0.3 | × |
| 11 | France | 72 | 2.8 | 29 | Luxembourg | 3 | 0.1 | × |
| 12 | Romania | 64 | 2.5 | 30 | North Macedonia | 3 | 0.1 | × |
| 13 | Hungary | 56 | 2.2 | 31 | Bosnia and Herzegovina | 3 | 0.1 | × |
| 14 | Bulgaria | 45 | 1.8 | 32 | Switzerland | 2 | 0.1 | × |
| 15 | Netherlands | 43 | 1.7 | 33 | Republic of Moldova | 2 | 0.1 | × |
| 16 | Austria | 38 | 1.5 | 34 | Türkıye | 2 | 0.1 | × |
| 17 | United Kingdom | 33 | 1.3 | 35 | Ireland | 1 | 0.0 | × |
| 18 | Greece | 28 | 1.1 | 36 | Malta | 1 | 0.0 | × |
| × | × | 2356 | × | × | × | 202 | × | 2558 |
| × | × | × | 92.0 | × | × | × | 8.0 | 100.0 |
Source: compiled by authors.
Table 5.
Descriptive statistics.
| Variables | Mean | Median | Standard Deviation | Minimum | Maximum |
|---|---|---|---|---|---|
| ROA | 8.82 | 6.95 | 14.40 | -88.59 | 96.69 |
| PM | 7.14 | 5.53 | 14.00 | -93.30 | 91.67 |
| Dom_tech | 50.45 | 75.00 | 25.25 | 25.00 | 100.00 |
| Man_Int | 12.89 | 6.67 | 18.48 | 0.03 | 136.36 |
| Innov_Int | 11.32 | 1.83 | 18.35 | 0.00 | 95.00 |
| DList_st_1 | 0.07 | 0.00 | 0.25 | 0.00 | 1.00 |
Source: compiled by authors.
Table 6.
Regression results (OLS model using the observations: 1-2558).
| Variables | Const | Dom_tech | DList_st_1 | Man_Int | Innov_Int | R2, % |
|---|---|---|---|---|---|---|
| ROA | 12.76*** | -0.02** | -1.02 | -0.02* | -0.21*** | 7.96 |
| PM | 9.38*** | -0.01 | 0.41 | 0.03* | -0.18*** | 5.51 |
Notes: *** – significant at the 1 % level; ** – significant at the 5 % level; * – significant at the 10 % level. Source: compiled by authors.
Table 7.
Hypothesis testing results of Models (via OLS, N=2558).
| Hypothesis | Dependent variable | Independent variable | Hypothesis status | Effect type |
|---|---|---|---|---|
| H1ROA | ROA | Dom_tech | accepted | significant, negative |
| H2ROA | DList_st_1 | rejected | insignificant | |
| H3ROA | Man_Int | accepted | significant, negative | |
| H4ROA | Innov_Int | accepted | significant, negative | |
| H1PM | PM | Dom_tech | rejected | insignificant |
| H2PM | DList_st_1 | rejected | insignificant | |
| H3PM | Man_Int | accepted | significant, positive | |
| H4PM | Innov_Int | accepted | significant, negative |
Source: compiled by authors.
Disclaimer/Publisher’s Note: The statements, opinions and data contained in all publications are solely those of the individual author(s) and contributor(s) and not of MDPI and/or the editor(s). MDPI and/or the editor(s) disclaim responsibility for any injury to people or property resulting from any ideas, methods, instructions or products referred to in the content. |
© 2026 by the authors. Licensee MDPI, Basel, Switzerland. This article is an open access article distributed under the terms and conditions of the Creative Commons Attribution (CC BY) license.
Copyright: This open access article is published under a Creative Commons CC BY 4.0 license, which permit the free download, distribution, and reuse, provided that the author and preprint are cited in any reuse.