

Submitted:
04 September 2026
Posted:
04 September 2026
You are already at the latest version
Abstract
Digital Twins (DTs) are increasingly proposed as decision-support environments for complex urban and infrastructural systems, yet documented applications to urban river corridors remain limited. This paper applies a DT methodology, developed within the Agenzia del Demanio guidelines prepared by CITERA, to the urban stretch of the Tiber River in Rome. The case study covers approximately 8 km of the urban stretch between Ponte Milvio and the Tiber Island, with detailed survey and documentation concentrated on the sixteen bridges and the adjoining banks between Ponte della Musica and Ponte Palatino and was carried out within an AUBAC-CITERA research agreement. Three objectives were adopted: condition-based maintenance of riverbed and bank hydraulic works, hydraulic-risk monitoring, and hydro-pluviometric monitoring in support of flood-risk and water-governance decisions. The application produced high-resolution point clouds, Scan-to-BIM information models of the sixteen bridges exported in IFC 4.3, geospatial contextualisation in Autodesk InfraWorks, and a target architecture for federation with AUBAC's WebGIS environment and future monitoring flows. Sensor deployment, continuous data flows, machine-learning components, dashboard operation and indicator validation remain planned and not yet operational. The system should therefore be understood as a digital model and target DT architecture prepared for evolution towards a digital shadow and, subsequently, an operational Digital Twin. The contribution lies in documenting how a pre-existing methodology performs in a complex institutional urban-river context, what information assets it yields, and which implementation constraints must be addressed before an operational DT can be claimed.
Keywords:
digital twin
; digital model
; urban river corridor
; Tiber River
; scan-to-BIM
; BIM-GIS integration
; IFC 4.3
; flood risk management
; hydro-pluviometric monitoring
; sustainable water governance
1. Introduction
The twin challenge of decarbonisation and digitalisation is redefining the priorities of the construction sector and of territorial management worldwide [1,2]. The United Nations 2030 Agenda recognises science, technology and innovation as a cross-cutting enabling factor for most of the Sustainable Development Goals (SDGs), well beyond the explicit scope of SDG 9 on resilient infrastructure and innovation [1,3]. At the European level, the symbiosis between the ecological transition and the digital transition, the so-called twin transition, has become a strategic policy direction, invoked both in European Commission documents and, in Italy, in the National Recovery and Resilience Plan [4,5]. Within this framework, the digitalisation of planning, design, construction and management processes for the built environment represents an essential lever for achieving energy efficiency, environmental and economic sustainability, safety and resilience objectives [6,7].
The Digital Twin (DT), understood as a virtual representation of real-world entities and processes synchronised with a specified frequency and fidelity, is emerging as an enabling technology for the digitalisation of the AECO sector (Architecture, Engineering, Construction and Operation) [8,9]. The concept was originally formulated by Grieves as the “Mirrored Spaces Model” for product lifecycle management [10] and first formalised in the aerospace domain by Glaessgen and Stargel as an integrated, multiphysics, multiscale probabilistic simulation fed by the best available physical models, sensor updates and operational history [11]; both formulations converge on three constitutive elements: the physical twin, the virtual twin, and the bidirectional data flow connecting them. Supported by AI, ML and IoT, the DT supports decision-making and enables simulation, prediction, monitoring and optimisation of the physical twin’s performance throughout its life cycle [8,12,13]. Since its formulation, the literature has grown exponentially, accompanied by considerable terminological heterogeneity [14,15]. Kritzinger et al. proposed a now well-established classification distinguishing, by degree of data-flow integration, between Digital Model, Digital Shadow and Digital Twin proper [16], and further systematic reviews have consolidated the paradigm’s enabling technologies, challenges and research trajectories [17,18,19,20]. On the standardisation front, the ISO 23247 series [21] defines a reference architecture for DTs in manufacturing, while the Gemini Principles of the Centre for Digital Built Britain outline the values (public good, value creation, quality, security, openness, federation) for national digital twins of the built environment [22].
Despite the maturity reached in manufacturing and aerospace [16,23,24], research on and application of DTs in the built environment remain at an earlier stage [8,25], marked by a proliferation of not always consistent definitions and taxonomies and by limited standardisation of implementation processes [26,27,28,29]. The transfer of the DT paradigm from manufacturing to construction is itself the subject of lively debate [30]: Sacks et al. defined the Construction Digital Twin as an information system centred on construction-site data and the Plan-Do-Check-Act cycle for production control [9], while Boje et al. traced its evolution from Building Information Modelling (BIM), stressing the need for semantic enrichment and intelligent services [26]; Deng et al. examined the BIM–DT distinction through a five-level evolutionary scale from static representations to autonomous intelligent ecosystems [31]. Recent reviews converge on the main application areas along the life cycle: design-decision support through what-if analysis [28,32], monitoring of construction progress and site safety [33,34], and operational management, predictive maintenance and energy efficiency [35,36]. A parallel strand addresses non-functional requirements, such as trust, cybersecurity and traceability, including through blockchain integration [37,38]. Significant barriers persist, however: supply-chain fragmentation, data quality and interoperability, implementation costs, and a shortage of skills [8,27,39,40], since data from a single source are often incomplete and must be interpreted, processed and cross-checked to generate useful information [9,41,42].
At the urban scale, the DT is configured as a dynamic evolution of traditional 3D city models and GIS systems [42,43]. Pioneering experiences such as the digital twin of Herrenberg, which combines a 3D model, space syntax, mobility and wind-flow simulation, and virtual reality for civic participation [44], and that of Zurich for urban planning [45] have demonstrated the potential of Urban Digital Twins (UDTs) to support public decision-making, and the most recent systematic reviews analyse their technologies, architectures and adoption challenges [46,47,48,49], highlighting open questions of governance, interoperability and the sustainability of management models [29]. The definition of measurable indicators is central to this domain: standards such as ISO 37122 [50] provide sets of indicators for smart cities to which UDT indicators can, where possible, be anchored [51].
In parallel, the scientific community has extended the DT paradigm to the natural environment, from the planetary scale, with initiatives such as the European Commission’s Destination Earth and digital twins of the terrestrial hydrological cycle [52,53,54], down to the basin and city scale [55]. Established applications include the management of urban drainage and stormwater systems [56,57], the prevention of hydrogeological risk through Web-GIS and UDT platforms [58,59], the navigation of urban flood dynamics through geospatial twins [60,61], and multi-hazard, multi-scale assessment [62]. Of particular relevance is the Florence DT for the protection of the Arno and its historic urban landscape, which integrates multi-sensor geomatic solutions within a climate-risk management framework [63]; this is the closest antecedent to the present case study in combining built-heritage and river-hazard concerns. As for the Tiber, the literature documents a centuries-long co-evolution between the urban development of Rome and flood dynamics [64], alongside well-established hydrological and hydraulic studies on extreme floods and inundation probability [65,66], within a planning framework defined by the Floods Directive 2007/60/EC [67] and the Flood Risk Management Plan of the Central Apennine District [68].
At the technological level, the literature converges on a core set of DT-enabling technologies: IoT for synchronising the physical and virtual twins, cloud and edge computing for scalability and low latency, 5G networks, BIM for the geometric-informational replica, and AI/ML and big-data analytics for knowledge extraction. The Digital Twin Consortium has introduced the Digital Twin Capabilities Periodic Table (CPT), a technology-agnostic tool organising capabilities into six groupings (Data Services, Integration, Intelligence, User Experience, Management and Trustworthiness) to guide the definition of platform requirements [69], while interoperability is safeguarded by open standards such as the ISO 19650 series [70] for information management, the IFC format in its version 4.3 extended to infrastructure [71], and BIM-GIS georeferencing and integration practices [72,73].
Alongside these conceptual and technological references, structured methodological guidance for designing DT platforms in the built and natural environment has become available in recent years, including the operational methodology published in the guidelines of the Agenzia del Demanio [74], which links intervention categories, process phases and management objectives to the corresponding information requirements, performance indicators, capabilities and enabling technologies. The availability of such reference frameworks shifts part of the research agenda from the formulation of new methodologies towards the evidence base on their use: as the reviews cited above observe, published DT experiences in the built environment are still predominantly reported as self-contained demonstrators, and comparability and replicability across projects remain open challenges [28,29,46,49,75]. On the basis of the sources reviewed here, it appears that application studies documenting, in a traceable way, how an existing methodology behaves once applied to a complex real-world context, which information assets it actually yields, and which constraints emerge during implementation, are still comparatively few; this observation is offered as a reading of the literature surveyed and not as an exhaustive claim. The gap addressed by this paper is therefore an application gap rather than a methodological one, and it is particularly evident for urban river corridors, where engineered structures, natural processes, hydraulic risk and institutional water governance intersect, and where the information base is typically fragmented between built-asset and hydrological domains.
Table 1 positions the present case study with respect to selected reference experiences, along the dimensions most relevant to an application study: scale, management objectives, the information assets actually produced, the implementation status reached and the technologies employed.
1.1. Aim, Research Questions and Contributions
Within this framework, the Central Apennine River Basin District Authority (AUBAC), the public authority responsible for river-basin planning, water-governance planning and flood/hydrogeological-risk planning in the Central Apennine District under the Water Framework Directive 2000/60/EC and the Floods Directive 2007/60/EC, signed with the CITERA (Interdepartmental Research Centre Territory, Building, Restoration and Environment of Sapienza University of Rome) the research agreement “Study and research activities for the development of a Digital Twin of the urban stretch of the Tiber River in Rome”, within which the application documented in this paper was carried out.
The aim of this paper is to document and analyse the application of the previously published Digital Twin methodology of the Agenzia del Demanio guidelines [74] to the urban stretch of the Tiber River in Rome, and to report the information assets, architecture and implementation constraints that resulted from it. The methodology applied here was previously developed within the guidelines of the Agenzia del Demanio, prepared by the CITERA research centre of Sapienza University of Rome, to which some of the authors are affiliated [74]. In the present study it is adopted as a pre-existing reference framework and is neither extended nor modified; the empirical results reported are attributable to its application to the Tiber case study and not to a validation of the framework itself.
Accordingly, the study addresses three research questions:
RQ1. How can a previously published Digital Twin methodology be applied to an urban river corridor that integrates built infrastructure and natural-system monitoring?
RQ2. What information assets, surveying products and digital representations can be generated through its application to the Tiber River case study?
RQ3. What are the main implementation challenges, current maturity levels and remaining requirements for the evolution from a prototype digital representation towards an operational Digital Twin?
The paper accordingly offers four contributions, all situated at the level of the application:
1. an application contribution: a documented account of how an established Digital Twin methodology was applied to a complex urban river corridor of national relevance, including the way in which management objectives were adopted for the corridor and the way in which context constraints governed operational choices;
2. a technical contribution: the documentation of the survey, Scan-to-BIM, IFC 4.3 and BIM-GIS workflow through which the digital information foundation of the corridor was generated, including the treatment of non-detectable portions and of interoperability requirements;
3. a system contribution: the definition of an integrated Digital Twin architecture for the river stretch, connecting geometric, geospatial, hydrological and monitoring information within a single information environment, together with the conceptual configuration of the hydro-pluviometric monitoring network;
4. an empirical contribution: the identification of implementation constraints, of the maturity level actually reached by each component, and of the open issues emerging from the case study, reported so as to distinguish explicitly between what has been implemented and what remains planned.
The geometric survey of bridges and banks responds to the need for an accurate knowledge base for the hydraulic-environmental component of the Digital Twin architecture, and does not constitute the object of a detailed structural analysis. Structural Health Monitoring and Bridge Weigh-in-Motion belong to adjacent application domains [76,77,78] that fall outside the scope documented here.
The remainder of this paper is organised as follows. Section 2 summarises the reference methodology adopted and describes the materials and operational procedures of the application. Section 3 presents the case study, the objectives adopted for the river corridor and the resulting information, indicator and technology requirements. Section 4 reports the results of the application, namely the Digital Twin architecture, the survey and modelling products, the geospatial integration, the monitoring configuration and the maturity reached by each component. Section 5 discusses the findings, the implementation challenges and the limitations of the study, and Section 6 draws the conclusions and outlines future developments.
2. Materials and Methods
This section describes the reference methodology adopted for structuring the application (Section 2.1), the case-study materials and the application protocol (Section 2.2), and the procedures followed for data acquisition, information modelling, geospatial integration and the configuration of the Digital Twin architecture (Section 2.3, Section 2.4, Section 2.5 and Section 2.6).
2.1. Reference Methodology
The application documented in this paper was structured according to the Digital Twin methodology previously developed and published in the guidelines of the Agenzia del Demanio [74]. The present study adopts the framework as a structured reference for the Tiber River application, while making explicit that the framework originates from guidelines prepared by CITERA for the Agenzia del Demanio and is therefore transparently attributable to the authors’ own research environment rather than adopted as an independent external standard.
For the purposes of this paper, only those elements of the reference methodology that are necessary to follow the case study are recalled here; the reader is referred to the published guidelines for the complete framework, its taxonomies and its supporting tool. In summary, the methodology requires a Digital Twin project to be characterised, before any technological choice, by three descriptors: the intervention category (new construction, regeneration of the existing, transformation), the process phase (design, execution, operation) and the management objectives pursued, the latter organised into families that include, alongside energy efficiency, environmental and economic sustainability, use and enhancement and safety & security, the management of the natural and built environment, which covers soil defence, resilience of the built environment, hazard-condition monitoring, environmental-quality monitoring and hydro-pluviometric monitoring. Once a project is characterised in these terms, the methodology associates the resulting configuration with the corresponding information requirements (the input data the platform must acquire, in continuous or discontinuous flow, from heterogeneous sources), with performance indicators that make the effectiveness of the architecture measurable, and with the capabilities the platform must possess, expressed with reference to the Digital Twin Capabilities Periodic Table of the Digital Twin Consortium [69] and articulated into the six groupings Data Services, Integration, Intelligence, User Experience, Management and Trustworthiness, each associated with candidate enabling technologies and technological solutions. The methodology further adopts the Plan-Do-Check-Act continuous-improvement cycle [79] as the frame within which indicators are defined, populated, analysed and translated into corrective actions.
Two consequences of adopting this reference framework are relevant to the reading of the present study. First, the characterisation of the case study in terms of intervention category, process phase and objectives precedes and orients the identification of information requirements and of candidate technologies, so that each instrumental choice is documented as a consequence of a stated management objective. Second, the reference framework identifies candidate enabling technologies and solutions: the operational selection among them, reported in Section 3 and Section 4, was made for this case study according to the context constraints of each element of the stretch, following explicit and documented criteria.
2.2. Case-Study Materials and Application Protocol
The case study concerns the urban stretch of the Tiber River in Rome and was carried out within the AUBAC–CITERA research agreement described in Section 1.1. The materials of the application comprise: the territorial, hydrological and planning documentation made available by AUBAC, including the hazard delineations of the Flood Risk Management Plan of the Central Apennine District [68] and the thematic layers published through the authority’s WebGIS environment [80,81]; the geometric survey data acquired ex novo for this study on the sixteen bridges and the adjoining banks of the stretch; and the information models derived from them.
The application protocol followed four operational stages, described in Section 2.3 to Section 2.6: acquisition of geometric and geospatial data; Scan-to-BIM information modelling; BIM-GIS integration and geospatial contextualisation; and definition of the Digital Twin architecture together with the conceptual configuration of the hydro-pluviometric monitoring component. Ponte della Musica “Armando Trovajoli” was adopted as the reference element on which the full sequence was first carried out, and the same sequence was then extended to the remaining fifteen bridges and to the banks of the stretch.
Verification of the information products concerned the geometric consistency with the survey data, the traceability of the elements, and the interoperability of the formats, in accordance with the ISO 19650 series and BIM-GIS integration practices [70,72]. Throughout this paper, “verified” denotes an internal check of geometric consistency, semantic traceability and format exchangeability; it does not imply metrological certification or a TLS–SLAM benchmark, since no common threshold values were applied for RMSE, density, completeness or IFC compliance. These metrics belong to the quantitative protocol of the operational phase and will be reported separately for TLS and SLAM.
2.3. Geometric and Geospatial Data Acquisition
Geometric acquisition was carried out through two complementary techniques, both included among the technologies associated with the data-acquisition-and-ingestion capability in the reference methodology: multi-station terrestrial laser scanning (TLS) and SLAM mobile mapping performed with an Emesent Hovermap ST-X system, used backpack-mounted or hand-carried. A DJI Matrice 350 RTK unmanned aerial platform was employed for the acquisition of aerial imagery and orthophotos of the banks and of the portions not reachable from the ground.
The selection between TLS and SLAM was made, element by element, according to documented context constraints: accessibility of the element and of its surroundings, presence of pedestrian and vehicular traffic during the acquisition window, geometric complexity of the structure, and safety conditions. Multi-station TLS was selected where traffic conditions allowed static occupation of multiple stations and where maximum surface coverage and point density were required; SLAM mobile mapping was selected for elements characterised by continuous pedestrian and vehicular traffic and by extended, articulated areas, where acquisition time and robustness to anthropic disturbance prevailed as criteria. The comparison between the two techniques reported in Section 4.2 is exploratory and qualitative and does not derive from a controlled benchmark with homogeneous sessions.
Acquisition was planned so as to cover the riverbed interfaces, the bank hydraulic works (embankment and retaining walls) and the crossing structures. Portions that could not be reached because of the presence of water, of physical barriers or of unsuitable safety conditions were recorded as such and handled at the modelling stage as described in Section 2.4.
2.4. Scan-to-BIM and Information Modelling
The registered point clouds were transposed into information models through a Scan-to-BIM workflow. Elements directly detectable in the point cloud were modelled on the basis of the acquired geometry; portions that the survey could not reach were reconstructed parametrically according to a conservative criterion and explicitly flagged, so that reconstructed geometry remains distinguishable from surveyed geometry within the model; this treatment is consistent with established practice in the information modelling of historic masonry crossings [82,83].
The resulting models were semantically structured through Property Sets (Psets), classification and persistent coding, and prepared for sharing within a Common Data Environment compliant with the ISO 19650 series [70]. Export was performed in the open IFC 4.3 format [71], adopted as the target schema for infrastructure assets and as the basis for subsequent integration with GIS systems and territorial-management platforms. Each entity was prepared to receive a stable identifier and linking keys to the hydrological-hydraulic observations of the relevant section or corridor portion, to be introduced gradually as the monitoring component becomes operational.
IFC 4.3 is therefore adopted here as an open target schema and as semantic preparation. No conformance report, exchange MVD/IDS or completed GIS federation is presented in this paper, and the suitability of the models for federation remains a design hypothesis to be verified through a validator, definitive georeferencing and import/export testing.
2.5. BIM-GIS Integration and Geospatial Contextualisation
Geospatial contextualisation was performed by importing the IFC 4.3 models, together with the bank survey, into Autodesk InfraWorks, an infrastructure-modelling environment supporting the joint visualisation of the corridor geometry and of its territorial context and the preparation of subsequent hydraulic and monitoring analyses. At this application stage InfraWorks serves as a geospatial-contextualisation and integrated-visualisation environment; the model thus prepared constitutes the reference geometric input for future hydraulic simulations, which remain the responsibility of dedicated hydraulic-modelling tools not implemented in the case study. The data flow described here, from the Scan-to-BIM models to their export in IFC 4.3 and their import into InfraWorks, therefore covers geometric and contextual preparation up to, but not including, the execution of simulations.
Definitive georeferencing in the UTM 33N system (EPSG:32633) and federation with AUBAC’s Territorial Information System and WebGIS environment were defined as requirements of the architecture and prepared for, but not completed within the period covered by this study; their status is reported in Section 4.4 and Section 4.7.
2.6. Digital Twin Architecture and Monitoring Configuration
On the basis of the objectives adopted for the corridor and of the information requirements identified through the reference methodology, an architecture for the Digital Twin of the river stretch was defined, organised into an input stage, an integration stage and a visualisation–analysis stage, and a conceptual configuration of the hydro-pluviometric monitoring network for the reference stretch was prepared. The architecture and the monitoring configuration are design outputs of the case study: with the exception of the components explicitly reported as implemented in Section 4.7, they describe a target state still to be implemented. No sensor configuration aimed at diagnosing the structural response of the bridges is envisaged within the application scope documented here. The architecture is presented in Section 4.1 and the monitoring configuration in Section 4.5.
3. Case Study: The Urban Stretch of the Tiber River in Rome
3.1. Case-Study Context and Rationale
The case study concerns the urban stretch of the Tiber for a length of approximately 8 km between Ponte Milvio and the Tiber Island; within this stretch, the detailed survey covered the sixteen bridges and the banks between Ponte della Musica “Armando Trovajoli” and Ponte Palatino, corresponding to the sub-stretch subject to detailed digital documentation within the present study (Figure 1).
The stretch crosses the historic heart of Rome, where the co-evolution between the city and the river is documented by over two millennia of socio-hydrological history [64], and where hydraulic risk, although mitigated by the nineteenth-century embankment walls, remains the subject of planning and study [65,66,68]. Several features make this stretch a relevant case for an application study. The corridor is a continuous linear system in which engineered elements and natural processes are inseparable: bridges and banks are simultaneously heritage and infrastructural assets and boundary elements of the flow section, so that their geometry conditions hydraulic behaviour and their conservation depends on it. The stretch concentrates, within a few kilometres, a high density of crossings of different age, material and structural typology, a densely used public space along the quays, and a floodplain that includes the historic centre of a capital city. Its management responsibilities are distributed among several authorities, and hydraulic-risk planning for the stretch is framed by the Floods Directive [67] and by the Flood Risk Management Plan of the Central Apennine District [68], which fall within AUBAC’s institutional mission.
This combination makes the selected stretch a suitable test bed for the application documented here. Hydraulic-risk planning, maintenance of riverbed and bank hydraulic works, accessibility of public spaces and the protection of cultural and infrastructural assets converge within a single linear system. The detailed documentation of sixteen bridges and the adjoining banks therefore provides not only a geometric survey of individual artefacts, but a continuous information base for a strategic urban-river corridor, allowing survey-derived information models, official flood-risk planning layers and hydro-pluviometric monitoring requirements to be progressively integrated into a Digital Twin architecture.
The information base available at the outset was correspondingly fragmented. Territorial, hydrological and hazard information was available through the authority’s planning instruments and WebGIS environment, including PGRA hazard delineations, hydrological themes and hydraulic-works inventories [68,80,81]; hydrological and hydraulic knowledge of the stretch is supported by a well-established tradition of studies on extreme floods and inundation probability in Rome [65,66]. What was missing was an accurate, homogeneous and interoperable geometric description of the corridor’s physical boundary, that is of the crossings and of the bank hydraulic works, together with an information structure capable of associating that geometry with hydrological-hydraulic observations. Filling this gap was the primary purpose of the application described here.
3.2. Case-Study Objectives and Digital Twin Scope
Following the reference methodology [74], the case study was characterised as an intervention of regeneration of the existing built environment, since the project intervenes on existing assets, optimising their management without changing their use, and within the operation phase, being aimed at improving the management and monitoring of the river stretch, including the sixteen bridges and the adjoining banks.
Three management objectives were adopted for the corridor, in agreement with the competent authority and consistently with its statutory remit: condition-based maintenance of riverbed and bank hydraulic works, understood here as predictive maintenance based on repeated geometric and hydromorphological observations; hydraulic-risk monitoring in support of the resilience of critical infrastructure and of the territory; and hydro-pluviometric monitoring in support of flood-risk and water-governance decision processes. Table 2 summarises this characterisation and its operational meaning for the case study.
Within the family management of the natural and built environment defined by the reference methodology, this first objective corresponds specifically to the resilience-of-the-built-environment sub-category, as it concerns the conservation and condition-based upkeep of the riverbed and bank hydraulic works that bound the flow section, while the second and third objectives correspond to hazard-condition monitoring and to hydro-pluviometric monitoring in support of water governance, respectively.
The first objective pursues the scheduling of interventions on the riverbed and on the bank hydraulic works through the periodic comparison of geometric surveys; the second concerns the oversight of the conditions affecting flow and the exposure of the corridor; the third connects the case study with AUBAC’s wider institutional mission in basin-scale water governance and with the observation chains that support planning and risk-management decisions under the Water Framework Directive, the Floods Directive and the Flood Risk Management Plan [67,68].
The scope of the Digital Twin follows directly from this characterisation. Critical-infrastructure elements are represented as exposed to, or interfering with, river dynamics, and as beneficiaries of the system’s forecasting capability; the quantities monitored are hydrological, hydraulic and environmental; the structural response of the bridges lies outside this scope. Structural Health Monitoring and traffic-load control constitute adjacent Digital Twin application domains, widely addressed in the literature [51,76,84,85], which do not fall within the application scope documented here. This scoping has a cost, discussed in Section 5: the geometric detail collected on the bridges (intrados and extrados) is not exploited for structural diagnostic purposes within this study.
Although some information requirements are shared among the three objectives, their operational differentiation emerges along three dimensions, namely time horizon, decision purpose and prevailing data type, summarised in Table 3.
3.3. Information Requirements Adopted for the Case Study
Based on the objectives identified for the case study and following the reference methodology, the information requirements of the platform were specified for each objective. They are reported in Table 4 to Table 6 as the input data adopted for the Tiber application, together with their units of measurement.
For condition-based maintenance of riverbed and bank hydraulic works (Table 4), the requirements refer to the river component of the corridor, that is the riverbed and the bank hydraulic works (embankments, retaining walls), leaving aside the structure of the bridges. The objective is to move from cyclical maintenance to programming based on the periodic comparison of geometric surveys and hydromorphological data: the Digital Twin supports the early identification of sedimentation, scour and bank-erosion phenomena, orienting interventions also as a function of low-flow hydrological windows, consistent with the literature on data-driven predictive maintenance [76,86,87].
Geometric and information models form the base of this information set, while the periodic comparison between successive surveys transforms inspection from a one-off event into a continuous, quantifiable process, applied to the riverbed and to the bank hydraulic works. Historical maintenance data, once processed with machine-learning algorithms, a stage not yet implemented (Section 4.7), will feed the updating of intervention priorities. Here too, the geometric survey (point cloud) constitutes an input to the corridor’s information base and not the object of an in-depth structural analysis of the bridges.
For hydraulic-risk monitoring (Table 5), the information set is enriched with environmental and territorial context data: geospatial, topographic, geological and hydrogeological data, the geometry of the sections and of the interferences, water levels and discharge, real-time and historical weather conditions, territorial-hazard data and emergency plans, consistent with the multi-hazard approach proposed in the literature [58,62,68]. Monitoring pursues the timely recognition of anomalous hydrological-hydraulic conditions, the assessment of flood scenarios and support for the activation of the competent-authority protocols.
In the presence of extreme events, the integration between the information model, the hydro-pluviometric network and environmental monitoring is intended to make it possible to assess the evolution of hydraulic conditions along the stretch and to support the activation of the emergency and civil-protection protocols provided for by the planning instruments.
For hydro-pluviometric monitoring in support of flood-risk and water-governance decisions (Table 6), the information set centres on the observation chain of the river reach: real-time water-level (stage) data, catchment rainfall in real time and in historical series, discharge and flow velocity, geomorphological and bathymetric surveys of the riverbed, PGRA hazard maps and flood scenarios, and data from scour and sediment-transport sensors. These inputs are intended to feed the near-real-time model-observation comparison supporting early warning, planning and technical assessment under the Floods Directive and the district planning instruments [60,61,68,85].

Table 6.
Input data adopted for the hydro-pluviometric-monitoring objective.
| Input | Unit of measurement |
|---|---|
| Real-time water-level data (stage) | m, m a.s.l. |
| Catchment rainfall data (real-time and historical) | mm, mm/h |
| Discharge and flow velocity | m³/s, m/s |
| Geomorphological and bathymetric riverbed surveys | m, m², pts/m² |
| Hazard maps and flood scenarios (PGRA) | return period, hazard index |
| Data from scour and sediment-transport sensors | mm, ppm |
3.4. Performance Indicators Adopted for the Case Study
For each objective, a set of six performance indicators was adopted to make the effectiveness of the architecture measurable, derived where possible from parameters already present in regulations, technical standards and indicator standards [50,85]. The indicators are reported in Table 7 to Table 9. They are proposed for this application and have not yet been validated against real operational data, which will become available only once the monitoring network is installed (Section 4.7). Structural-health and traffic indicators, relevant to adjacent application domains, were not adopted for this case study.
For condition-based maintenance of riverbed and bank hydraulic works (Table 7), indicators relating to intervention scheduling and to the updating of the knowledge base prevail.
For hydraulic-risk monitoring (Table 8), the temporal dimension prevails, with lead time and response speed, together with the availability of the observation chain and the reliability of alerting, also measured by the ratio between validated and generated alarms [61].
For hydro-pluviometric monitoring in support of water governance (Table 9), indicators of the effectiveness of the forecasting system prevail: flood advance-warning lead time, the accuracy of water-level forecasts against observations, alert reliability, the update latency of model scenarios, coverage of the monitoring network along the stretch, and the reduction in competent-authority protocol activation times, consistent with the objectives of the Floods Directive and with the literature on early warning in urban river systems [60,61,85].
Table 9.
Performance indicators adopted for the hydro-pluviometric-monitoring objective.
| KPI | Unit of measurement |
|---|---|
| Flood advance-warning lead time | hours |
| Accuracy of water-level forecasts | %, cm |
| No. validated early-warning alerts / no. alerts generated | % |
| Model–observation scenario-update latency | min |
| Coverage of the monitoring network along the stretch | %, km |
| Reduction in competent-authority protocol activation time | % |
Within the PDCA cycle adopted by the reference methodology, these indicators will be fed by data collected during operation (Do), analysed against the expected targets (Check), and translated into corrective actions and improvement strategies (Act), enabling the progressive validation of the operational thresholds [79].
3.5. Capabilities and Technologies Adopted in the Application
The objectives, information requirements and indicators set out above were translated into the platform capabilities required for the case study, expressed according to the six groupings of the Capabilities Periodic Table [69], and, for each capability area, into the technologies actually adopted or planned for the Tiber application. Table 10 reports this configuration together with the implementation status of each area, so that technologies effectively deployed in the case study are distinguished from those that belong to the target architecture. Candidate technologies and solutions listed in the reference methodology but not retained for this application are not reproduced here.
The selection recorded in Table 10 was made as an application decision within the reference framework, on the basis of the technical criteria described in Section 2.3 for acquisition (accessibility, traffic conditions, geometric complexity, safety, acquisition time), of interoperability requirements for modelling and integration (open schema, compliance with the ISO 19650 series, compatibility with the authority’s existing geospatial environment), and of the institutional context for the platform and monitoring layers (continuity with the existing hydrometric network of the stretch and with the authority’s information system).
With reference to the hydro-pluviometric-monitoring objective, the same capability structure specialises in the hydrological domain: the acquisition capability integrates hydro-pluviometric stations, the aggregation capability connects with existing hydrometric networks along the stretch, while within the Intelligence area the simulation capability extends to hydrological-hydraulic modelling for the near-real-time generation of flood scenarios and to the continuous model-observation comparison supporting early warning [54,56,57,61].
4. Results
This section reports the results of the application: the Digital Twin architecture defined for the river stretch (Section 4.1), the survey products (Section 4.2), the information models (Section 4.3), the geospatial integration (Section 4.4), the monitoring configuration and user-facing outputs (Section 4.5), the extension of the workflow to the whole stretch and the information assets produced (Section 4.6), and the maturity reached by each component together with the implementation roadmap (Section 4.7).
4.1. Digital Twin Architecture of the River Stretch
Within the architecture defined for the case study, bridges and banks appear as geometric components and as interfaces between the watercourse and the urban fabric. The architecture, illustrated in Figure 2, is organised into three main stages, input, integration and visualisation–analysis, which structure data handling from physical reality to information useful for decision-making [13,15]. For the reading of Figure 2, the as-is state comprises surveys, point clouds, Scan-to-BIM/IFC models, contextualisation in InfraWorks and interface prototypes; the to-be state comprises operational georeferencing and federation, installed hydro-pluviometric sensors, continuous data flows, ML models and a dashboard fed by real data. The to-be components are architectural-target requirements still to be implemented.
Input stage (physical-entity data). This stage comprises building the geometric-informational replica, made of TLS/SLAM point clouds and of the as-built model exported in IFC 4.3, and acquiring dynamic flows from the hydro-pluviometric network of the section (stage gauges, rain gauges, ADCP current meters, scour sensors and piezometers), together with meteorological and territorial data, with acquisition, streaming, transformation (ETL) and OT/IoT security services [7,9]. Scan-to-BIM modelling, reported in Section 4.3, falls within this stage and constitutes the twin’s foundational level.
Integration stage (data connection). In the target configuration the data flow into the DT’s cloud platform, where the information model, georeferenced in the UTM 33N system, is federated with AUBAC’s Territorial Information System through BIM-GIS integration [71,72]; REST APIs, the MQTT/LoRaWAN protocols and a CDE compliant with the ISO 19650 series ensure interoperability and traceability, time-series databases ensure historicisation, and encryption and event logging ensure the system’s trustworthiness [37,70].
Visualisation–analysis stage (virtual-entity data). In the target configuration the digital shadow evolves into a predictive DT through ML algorithms for anomaly detection on hydrological time series, forecasting of levels and discharges, and updating of operational thresholds [16,31]. Flood early warning, continuous model–observation comparison, indicator dashboards and what-if simulations are intended to support risk-management and civil-protection decisions, closing the PDCA continuous-improvement cycle [79,88].
4.2. Geometric Survey and Point Clouds
On the reference element, Ponte della Musica “Armando Trovajoli”, the geometric complexity of the structure and the favourable condition of the absence of vehicular traffic, with very limited pedestrian traffic, guided the choice towards the terrestrial laser scanner with multi-station acquisitions, so as to ensure complete coverage of the accessible surfaces and maximum data density [89]. For the other fifteen bridges, characterised by pedestrian and vehicular traffic and by large, complex areas, SLAM mobile mapping with the Emesent Hovermap ST-X system, used backpack-mounted or hand-carried, was selected: during comparative trial days it returned less noisy data in the presence of anthropic disturbance and required contained acquisition times. The same selection logic was extended to the banks of the stretch, which were likewise surveyed using SLAM mobile mapping.
This comparison is exploratory and qualitative, and does not derive from a controlled benchmark with homogeneous sessions: time, density, RMSE, occlusions and repeatability were not recorded in a comparable way, so the expressions “less noisy” and “contained time” report field observations from the trial days. A controlled quantitative comparison on an overlapping test area is a priority for future work.
The survey campaign produced, across the sixteen bridges and the adjoining banks, point clouds totalling approximately 3.2 billion points (3,218 million in total). On the reference element, Ponte della Musica “Armando Trovajoli”, multi-station TLS from 22 scan positions returned about 500 million points, with a mean density of 80,000 points/m² on the surveyed surfaces and an overall acquisition time of approximately 2 h; on the remaining fifteen crossings and on the banks, SLAM mobile mapping returned on the order of 7–30 million points per bridge and 80–660 million points per bank tract, with mean densities of about 2,000–4,000 points/m² on the bridges and 6,000–10,000 points/m² on the banks, corresponding to a mean Euclidean distance between neighbouring points of 10–20 mm. Acquisition times were of about 15–35 minutes per bridge and 30–90 minutes per bank tract (each roughly 1.3–1.6 km long, surveyed back and forth), the instrument being backpack-mounted and carried on foot at a normal walking pace of 4–5 km/h; the effective survey rate along the banks was however lower, of the order of 2–2.5 km/h, because each tract was covered back and forth and the pace was reduced to ensure point overlap and loop closure. Every SLAM trajectory was closed on its starting point on the bridges and run back and forth along the bank tracts; loop closure and point overlap limited trajectory drift, and no macroscopic drift was observed during the internal quality checks (Table 11).
All clouds were given RGB colourisation derived from GoPro 360 video acquired simultaneously with the scan. Full processing, including colourisation in Emesent Aura, required 3–4 hours per bridge and about 6 hours per bank tract on a workstation with 32 GB RAM, an Intel Core i9 CPU at 2.00 GHz and an NVIDIA GeForce RTX 4080 16 GB GPU, for a cumulative field time of approximately 17 hours and a cumulative processing time of approximately 104 hours (96–112 h). The resulting files range from 0.5 to 1 GB per bridge and from 10 to 13 GB per bank tract in .las format, the latter reduced to 2–3 GB in the subsampled version prepared to contain file size for downstream use.
Figure 3 shows an excerpt of the point cloud resulting from the survey of the Ponte della Musica “Armando Trovajoli” and the adjoining banks, acquired through multi-station terrestrial laser scanning and SLAM mobile mapping, prior to its transposition into the Scan-to-BIM workflow.
4.3. Information Models in IFC 4.3
The point clouds were transposed into information models following the Scan-to-BIM workflow described in Section 2.4, with declared handling of non-detectable portions through conservative parametric reconstruction. The models were semantically structured through Property Sets (Psets), classification and persistent coding, and prepared for sharing within a Common Data Environment compliant with the ISO 19650 series in the open IFC 4.3 format, deemed suitable for integration with GIS systems and territorial-management platforms. Each entity may also be given a stable identifier and linking keys to the hydrological-hydraulic observations of the relevant section or corridor portion, to be introduced gradually as the Data Services and Intelligence components are implemented.
The Scan-to-BIM models were produced at a Level of Development of LOD 300 (equivalent to LOD C of UNI 11337-4) and a Level of Information Need, per UNI EN 17412-1, of G2 “defined” for the geometric component, uniform across all modelled categories, that is geometry reliable in dimension, position and functional envelope without constructional micro-detail; A1 for the alphanumeric component (identification code, prevailing material, state of conservation, year of construction, date of last inspection, link to documentation) and D0–D1 for the documentary component, and exported using the IFC 4.3 infrastructure entities IfcBridge and IfcBridgePart for the spatial breakdown of each crossing, together with IfcBeam (main arches, longitudinal box girders, cross-beams and edge beams), IfcColumn (river piers, abutment piers and inclined columns), IfcMember (diagonal bracing and hangers), IfcSlab (deck slabs and walking surfaces), IfcWall (abutments and structural and non-structural walls), IfcFooting (pier bases and foundations), IfcBearing (elastomeric and pendulum bearings), IfcTendon (transverse post-tensioning stays), IfcRailing (parapets, balustrades and road restraint barriers), IfcCovering (claddings, copings and string courses), IfcLightFixture and IfcPipeSegment (lighting poles and linear drainage channels), IfcGeographicElement (topography and public green) and IfcBuildingElementProxy for elements without a dedicated mapping. Each entity carries the persistent alphanumeric code defined in the project coding scheme, built as bridge prefix (e.g., PDM for Ponte della Musica, PCA for Ponte Cavour), discipline (ARC, STR, MEP, URB), element type and, where significant, material and thickness; the models were authored in Revit 2024, organised by discipline and, at the present stage, held in internal coordinates pending georeferencing to UTM 33N (EPSG:32633). The sixteen bridges were modelled individually, whereas the adjoining banks, although fully surveyed, were not modelled at this stage and therefore carry no reconstructed geometry. Across the modelled bridges, on average approximately 83% of each model’s geometry was modelled directly from surveyed data and approximately 17% was reconstructed parametrically according to the conservative criterion of Section 2.4 and explicitly flagged, so that reconstructed geometry remains distinguishable from surveyed geometry within the model; the reconstructed proportion varied markedly from one bridge to another, from 0% where the structure was surveyed in full and required no reconstruction to about 50% for the crossing where an active construction site obstructed the acquisition and forced parametric reconstruction of the affected portions; the other, higher proportions were driven mainly by the impossibility of surveying the extrados, the largest single gap on the reference element being the central portion of the deck intrados, which was not reachable by the survey and was reconstructed from official design documentation.
As stated in Section 2.4, no conformance report, exchange MVD/IDS or completed GIS federation is presented: the suitability of the models for federation remains a design hypothesis to be verified through a validator, definitive georeferencing and import/export testing. The aim at this stage is to produce reliable and traceable geometric data for the architecture of the river Digital Twin, without entering into the detailed structural modelling of the individual structures.
4.4. Geospatial Contextualisation and BIM-GIS Integration
The resulting models, together with the bank survey, were integrated into Autodesk InfraWorks (Figure 4), which allows their geospatial contextualisation and their preparation for hydraulic and monitoring analyses. As noted in Section 2.5, InfraWorks serves here as a geospatial-contextualisation and integrated-visualisation environment for the Scan-to-BIM data imported in the open IFC 4.3 format; the model thus prepared constitutes the reference geometric input for possible future hydraulic simulations, which remain the responsibility of dedicated hydraulic-modelling tools not yet implemented in the case study.
The geospatial side of the integration is already institutionally supported by AUBAC’s district-scale WebGIS and diagnostic Digital Twin environment, implemented within the authority’s institutional digitalisation programme using the Esri ArcGIS Enterprise platform with Experience Builder and made publicly accessible [80,81]. As documented in the related AUBAC case study [81], this environment currently operates at district scale as a public knowledge, planning and decision-support infrastructure, exposing the knowledge and hazard themes of the basin through activatable layer groups such as Hydrology, Environmental Monitoring, Water Resources Management, Hydrogeological Risk (sub-basin PAI, PGRA, hydraulic works, RenDIS interventions), Planning and Territory, and Transport, and offering layer-query functions, place-name search, multi-map comparison, attribute tables and 3D views (Figure 5). Activating the PGRA layer on the urban stretch of the Tiber shows how the digital representation of the stretch can already today be consulted within the context of the currently effective hydraulic-hazard delineations.
This relationship also clarifies the distinction between the present paper and the previously published AUBAC district-scale Digital Twin case study [81]. While [81] documents the institutional development of AUBAC’s WebGIS/Digital Twin environment at river-basin district scale, the present study focuses on a specific urban-river corridor and on the Scan-to-BIM, IFC 4.3 and BIM-GIS workflow through which bridge and bank geometries are transformed into a federable information base for future hydro-pluviometric monitoring.
The IFC 4.3 information models of the bridges, together with the surveyed point clouds of the adjoining banks, once georeferencing in the UTM 33N system is completed, are intended to be federated within this environment, which would constitute the geospatial interface of the river-corridor Digital Twin. Through the WebGIS, the district’s thematic layers, the BIM models and, eventually, the IoT sensor flows would converge into a single access point for technical assessment, planning support and management of the urban stretch of the Tiber, following the BIM-GIS integration paradigm discussed in the literature [58,63,72]. At the time of the study, the verified evidence concerns the consultation of the thematic layers and PGRA delineations in the existing portal. The federation of the IFC models, dedicated API services and the ingestion of IoT flows have not been tested end-to-end and must therefore be regarded as to-be components; the maturity level reached is one of architectural and interface definition, not of operational interoperability.
4.5. Configuration of the Hydro-Pluviometric Monitoring Component
On the basis of the information requirements reported in Section 3.3, a preliminary configuration of the hydro-pluviometric network for the reference stretch was defined. This configuration is a design output: no sensor has been installed within the period covered by this study. No sensor configuration aimed at diagnosing the structural response of the bridges is envisaged within the application scope documented here.
To address the hydro-pluviometric-monitoring objective, the sensing infrastructure extends beyond the bridge itself to encompass the surrounding river reach (Figure 6). Radar water-level gauges installed beneath the bridge deck and ultrasonic sensors mounted on the embankment walls would provide redundant water-level measurements. Acoustic Doppler Current Profilers (ADCPs) positioned on the riverbed would continuously measure flow velocity and discharge, while scour sensors installed around piers and foundations would monitor the evolution of local scour. Piezometers embedded within the embankment walls would measure pore-water pressure and seepage conditions. The network is further complemented by meteorological and rainfall stations installed in elevated locations, cameras positioned along the quays equipped with computer-vision algorithms for the detection of water levels, vessel traffic and floating debris, as well as visual or acoustic early-warning devices where foreseen by the competent authorities. This configuration is designed to operate in continuity with the existing historical hydrometric network of the monitored stretch [56,61,90].
Since the quays are a heavily used public space, the computer-vision processing applied to the camera streams targets river and infrastructure conditions and not the identification of individuals, in line with privacy-by-design and data-ownership requirements; a formal data-protection impact assessment specific to camera placement and image-retention policy remains a governance responsibility of AUBAC prior to deployment and is not addressed further in this study. The alert water levels (attention, pre-alarm, alarm) defined by civil-protection planning constitute the system’s operational thresholds [68]. At this stage, attention, pre-alarm and alarm are logical classes of the architecture, to which numerical values still have to be assigned: the thresholds will need to be associated with the specific station and hydrometric section, with the current version of the official plan, and with local hydraulic calibration; their automatic transfer between different sections of the river is not assumed.
The intended functioning of the monitoring system is described by the flow chart in Figure 7. Hydro-pluviometric data, acquired at the edge and transmitted to the cloud platform, are synchronised with the BIM-GIS model and analysed against the attention and alarm levels set for the hydrometric quantities: exceeding a critical threshold generates an alert in the information environment and supports notification, coordination or protocol activation by the competent authorities according to the applicable institutional procedures; the detection of a rapidly rising trend generates a proactive alert and intensifies monitoring; the return of values to normal determines the controlled closure of the event [60,61]. ML algorithms are foreseen to update forecasts and dynamic thresholds based on the model-observation comparison; the outcomes of the checks and of the actions taken feed back into the twin through historicisation and model recalibration [86,87].
User-facing output is provided through a dashboard integrated with the information model (Figure 8), designed in line with the User Experience capabilities identified for the case study: summary indicators of water level, discharge, precipitation, advance-warning lead time, data quality and availability, and the ratio between validated and generated alerts, historical series with operational thresholds, traffic-light status of the observed sections, and an event log [36,88]. The dashboard is intended to allow AUBAC technical units to follow the evolution of hydrological-hydraulic conditions and to support planning, technical assessment and coordination with the competent authorities, turning the indicators adopted in Section 3.4 into decision-support tools. At the current stage the dashboard is a prototype fed with simulated values.
4.6. Extension to the Whole Stretch and Information Assets Produced
Extending the workflow to the other fifteen bridges and to the banks of the stretch replicated the same sequence, with the acquisition solution selected according to the context constraints of each element, as described in Section 2.3. The campaign produced a high-resolution point cloud for each element of the stretch and a corresponding IFC 4.3 information model for each of the sixteen bridges (Table 11), whereas the adjoining bank tracts, although fully surveyed as point clouds, were not modelled at this stage; in some cases, the acquisition of certain portions was partial or not feasible due to the inaccessibility of the areas concerned, caused by the presence of the river, physical barriers or unsuitable safety conditions, and was handled with the conservative parametric reconstruction described for the reference element.
The assets produced, semantically structured and prepared for georeferencing in the UTM 33N system (EPSG:32633), are intended to enable four practical advantages for AUBAC: geospatial consistency, with overlay of the geometries onto official cadastral maps and orthophotos; institutional integration with the Territorial Information System; scalability for environmental and hydraulic simulations, flood risk and hydrogeological instability; and traceability of survey campaigns and hydraulic-environmental management interventions [63,72]. Geodetic realignment and the integration of management parameters constitute the fundamental requirement for the evolution of the information model towards the operational Digital Twin.
4.7. Implementation Status, Maturity and Roadmap
Table 12 summarises the current maturity level of the main components of the system, distinguishing implemented, planned and to-be-verified elements, and consolidating in a single overview the maturity caveats reported throughout this section.
Operational implementation of the Digital Twin follows the 24-month roadmap in Figure 9, organised according to a phased approach similar to that adopted in other complex contexts [88]. Activities begin with UTM 33N georeferencing and integration with AUBAC’s Territorial Information System, followed by the consolidation of management parameters, the progressive installation of the hydro-pluviometric network (stage gauges, rain gauges, current meters and scour sensors) and the start of continuous data collection. Training of models on historical and observed data leads to intermediate indicator validation at month twelve and to the optimisation of forecasts and operational thresholds [40,87]. The 24-month period is an implementation-and-collection horizon, chosen so as to cover at least one complete hydrological cycle in addition to the installation and commissioning phases; it is not a statistically validated minimum duration for river systems. The baseline, the number of events, the criteria at months 12 and 24, and the statistical method will be pre-specified before validation. The phased approach follows [88], which does not in itself provide evidence on duration specific to the river domain.
The benefits expected from the completion of this roadmap, greater completeness, availability and timeliness of the observational picture; reduced acquisition and update latency; increased advance-warning lead time; reduced forecast error and false alarms; and greater timeliness in activating the competent-authority protocols, are evaluation endpoints still to be measured, and are reported here as expected results. The comparison will be set against ordinary management practice prior to installation, defining ex ante the time window, minimum data quality, event severity and uncertainty intervals.
5. Discussion
The application documented here shows, first of all, that an existing Digital Twin methodology, formulated for the built environment and published as guidance for public asset owners, can be carried through end-to-end on an urban river corridor without adaptation of its structure: the corridor could be characterised in terms of intervention category, process phase and management objectives, and that characterisation could be carried down to information requirements, indicators and technology choices for elements, bridges and bank hydraulic works, that the framework addresses as built assets but that here act as boundary conditions of a natural process. The exercise is informative precisely because the case sits at the boundary of the framework’s original domain.
Second, the case study shows what an application of this kind yields in practice. The tangible outcome after the first phase is an information foundation: high-resolution point clouds for the sixteen bridges and the adjoining banks, and semantically structured IFC 4.3 models for the sixteen bridges, contextualised geospatially and prepared for federation with the competent authority’s information system. This is a substantial but partial result, and the distinction matters for how such applications are reported: the geometric and informational layers of the twin are implemented, while the layers that would make it a Digital Twin in the strict sense of Kritzinger et al. [16], namely automated and validated data flows from the physical system to the virtual environment and feedback from analysis to management action, remain planned. In the terms of that classification, what the case study has produced so far is a digital model of the corridor and a target Digital Twin architecture, prepared, by design, for evolution towards a digital shadow and then a digital twin as the monitoring network and the data flows are implemented.
Third, the application makes explicit a sequence that is often left implicit in single-case DT reports: from the management objective to the information requirement, and from there to the acquisition technique, the information model, the integration environment and the monitoring configuration. The selection criteria at each step are documented here alongside the final technological stack, so that another authority facing a comparable corridor can follow the reasoning.
Read against the three research questions, the findings set out above answer RQ1 in the affirmative, the methodology having proved applicable end-to-end and without structural adaptation; they answer RQ2 with the information base described in this section; and they answer RQ3 by placing the corridor, today, at the stage of a digital model and a target architecture, with the four implementation challenges examined in Section 5.2.
5.1. Applying a Built-Environment Methodology to an Urban River System
Extending a DT methodology conceived for built assets to an urban river system required a specific interpretative effort. The literature has predominantly addressed this domain through separate components: urban drainage [56,57], hydrogeological risk [58,59], flood dynamics [60,61] and structural monitoring of bridges [76,86,91], but rarely in an integrated way. The three objectives adopted for the corridor, condition-based maintenance of riverbed and bank hydraulic works, oversight of hydraulic risk and hydro-pluviometric monitoring in support of water-governance decisions, reflect the need for a unified reading of the urban stretch of the Tiber, in keeping with AUBAC’s institutional mission and in analogy with the Florentine experience on the Arno [63].
The most consequential interpretative decision concerned the role of the bridges. Within the scope adopted here, bridges and banks are represented as geometric interfaces exposed to, or interfering with, the flow; structural diagnosis lies outside this representation. This scoping aligns the application with the statutory remit of the competent authority, but it has an evident cost: the geometric detail collected on the crossings, including intrados and extrados, is not exploited for structural diagnostic purposes. The same information base could support a Structural Health Monitoring reading of the same corridor under a different objective configuration and a different institutional owner, which is one of the more transferable observations emerging from this case.
The articulation of the architecture according to the input–integration–visualisation/analysis structure, already used by the same research group in the hospital domain [88], proved usable in the river context as well, although further application contexts would be needed to establish whether this indicates cross-sector transferability.
5.2. Implementation Challenges
Four classes of difficulty emerged during the application, and they are reported here because they are likely to recur in comparable settings.
Acquisition in a live public space. The quays and bridges of central Rome are in continuous use. Traffic, pedestrian flows and safety constraints determined, element by element, which acquisition technique was feasible, and made a uniform survey protocol across the sixteen crossings impossible. Portions in contact with the water, or shielded by physical barriers, could not be reached at all and had to be reconstructed parametrically, with an explicit and traceable declaration of which geometry is surveyed and which is reconstructed.
Georeferencing. The survey was carried out in local coordinates, and definitive georeferencing in UTM 33N had not been completed within the period covered by this study. This is the single most binding constraint on the evolution of the information base: without geodetic realignment, federation with the authority’s Territorial Information System, overlay onto official cartography, and any coupling with hydraulic models remain unavailable. In applications of this kind the geodetic frame should be fixed at the outset, before the integration stage.
Semantic and interoperability preparation. Exporting to IFC 4.3 and structuring the models with Psets, classification and persistent coding is a necessary but not sufficient condition for BIM-GIS federation. Without a conformance check, an agreed exchange specification and tested import/export cycles, interoperability remains a design hypothesis. The present study reports it as such.
Institutional and governance constraints. The monitoring configuration involves a public river corridor and a heavily frequented public space, with responsibilities distributed among several authorities. Reconciliation of the proposed hydro-pluviometric network with pre-existing monitoring infrastructure operated by other authorities along the same reach, the association of alert thresholds with specific stations and with the current version of the official planning instruments, and the data-protection assessment required for camera-based monitoring are governance preconditions of deployment, and they condition the timeline more than the technology does.
5.3. Implications for Asset and Hydraulic-Risk Management and for BIM-GIS Integration
For the management of riverbed and bank hydraulic works, the information base produced converts inspection from an episodic activity into a comparable one: successive surveys of the same geometry make sedimentation, scour and bank erosion measurable over time, which is the precondition for moving from cyclical to condition-based scheduling of interventions. The value of this is realised only if survey campaigns are repeated on a defined cycle and referenced to a stable geodetic frame, which returns to the constraint identified above.
For hydraulic-risk management, the case study indicates that the geometric description of the corridor’s boundary is an operationally relevant, and often missing, component of the risk information chain. Cross-section geometry, the position and shape of physical interferences and the elevation of bank works are inputs to hydraulic behaviour, and holding them in an interoperable, updatable model alongside hazard delineations and hydro-pluviometric observations is what would allow the model–observation comparison foreseen in the architecture. Until the monitoring network is installed, this capacity is prepared but not demonstrated.
For BIM-GIS integration, the case is instructive in showing where the effort actually lies. The two environments were brought into contact without difficulty at the level of visualisation and contextualisation, whereas the operational federation, that is georeferencing, persistent identity across environments, API exposure and ingestion of dynamic flows, is where the unresolved work is concentrated. This is consistent with the findings of the GeoBIM benchmark literature [72] and suggests that reports of BIM-GIS integration should state explicitly which of these two levels they have reached. The adoption of the IFC 4.3 open schema and the preparation for UTM 33N georeferencing lay the groundwork for federation in the direction of the openness and federation principles promoted by the Gemini Principles [22,71,72].
5.4. Limitations
The study presents several limitations, which follow from the prototype status of the system and from the single-case design.
The information model currently operates in local coordinates, in the absence of an original georeferencing of the survey; the integration of management parameters and the validation of the reconstructed parts are scheduled for the next phase. The stretch’s hydro-pluviometric network has not yet been implemented: the indicators and operational thresholds adopted are therefore to be understood as proposed and not yet validated with real data; their validation will follow the gradual approach and the two-year roadmap described in Section 4.7. Acquisition of some portions was partial for certain elements due to accessibility constraints, with potential information gaps that conservative parametric-reconstruction techniques mitigate but do not eliminate [91,92]. The comparison between terrestrial laser scanning and SLAM mobile mapping reported in Section 4.2 is exploratory and qualitative, not a controlled benchmark. Machine-learning components for anomaly detection and forecasting are not operational, and BIM-GIS federation has not been tested end-to-end. The numeric alert thresholds recalled in Section 4.5 are, at this stage, placeholders for a calibrated hydraulic model still to be developed; their derivation, and the reconciliation of the proposed hydro-pluviometric network with any pre-existing monitoring infrastructure operated by other competent authorities along the same reach, are identified as open items for the operational phase, together with the incorporation of climate-adjusted rainfall scenarios.
A limitation of a different order concerns the status of the evidence reported here with respect to the reference methodology. No claim is made, on the basis of this application, about the general validity, completeness or superiority of the methodological framework adopted, nor about its behaviour under different intervention categories, process phases or objectives. Conversely, the difficulties reported in Section 5.3 are attributable to the case and to its institutional and physical context, and should not be read as deficiencies of the reference framework.
5.5. Transferability
The transferability of what is reported here is best stated in graded terms. The survey-to-IFC workflow, including the criteria for choosing between static and mobile acquisition under traffic and accessibility constraints and the conservative treatment of non-detectable portions, is the most directly transferable element, and applies to any masonry or mixed-typology crossing portfolio along an embanked urban river. The scoping decision, which treats crossings as hydraulic interfaces and not as structural assets, is transferable wherever the information owner is a water or basin authority; for an infrastructure operator it would need to be revisited. The architecture and the monitoring configuration are transferable as a scheme, but their parameters, particularly alert thresholds, station placement and the articulation with existing hydrometric networks, are strictly local. Any wider claim would require application to at least one further corridor and one further institutional context, which is identified in Section 6 as a priority for future work.
6. Conclusions and Future Developments
This study investigated the application of a previously published Digital Twin methodology to the urban stretch of the Tiber River in Rome. The methodology, developed and published in the guidelines of the Agenzia del Demanio [74], was adopted as a reference framework and was neither developed nor modified by the present work, whose contribution lies in documenting and analysing its application to a complex urban river corridor.
The case study is of national relevance and of a kind that is comparatively rarely documented: an embanked historic river reach crossing the centre of a capital city, in which sixteen crossings, the bank hydraulic works and a densely used public space coexist with a floodplain of very high exposure, and in which management responsibilities are institutionally distributed. Applying the reference methodology to this corridor made it possible to characterise the case in terms of intervention category, process phase and management objectives, and to derive from that characterisation the information requirements, performance indicators and technology choices adopted for the application.
The application produced a coherent set of information assets. A survey campaign combining multi-station terrestrial laser scanning and SLAM mobile mapping, complemented by UAV imagery, generated high-resolution point clouds for the sixteen bridges and the adjoining banks. The point clouds of the sixteen bridges were transposed, through a Scan-to-BIM workflow, into semantically structured information models exported in the open IFC 4.3 format, with explicit distinction between surveyed and conservatively reconstructed geometry, and were contextualised geospatially in an infrastructure-modelling environment, while the adjoining bank tracts were surveyed but not modelled at this stage. A Digital Twin architecture for the river stretch was defined, organised into input, integration and visualisation–analysis stages, together with a conceptual configuration of the hydro-pluviometric monitoring network and a prototype operational dashboard.
The maturity of these components is uneven, and the distinction is essential to the reading of this paper. The geometric survey, the Scan-to-BIM information models and the geospatial contextualisation are implemented; consultation of the hazard layers relies on a pre-existing institutional WebGIS environment. Definitive UTM 33N georeferencing and BIM-GIS federation, installation of the hydro-pluviometric network, continuous data flows and the cloud platform, machine-learning components and validation of the performance indicators against real data are planned and not yet operational. What exists today is therefore a prototype digital representation of the corridor, prepared for, but not yet functioning as, an operational Digital Twin.
Even at this stage, the results indicate a concrete potential for hydraulic-risk management and for hydro-pluviometric monitoring in support of water governance: an interoperable geometric description of the corridor’s boundary, maintained alongside hazard delineations and, in perspective, hydro-pluviometric observations, addresses an information gap that the risk-management chain currently fills only partially, and supports the periodic comparison on which condition-based maintenance of riverbed and bank hydraulic works depends. The value of BIM-GIS integration emerges from the case in a specific form: contextualisation is readily achieved, whereas operational federation, geodetic realignment, persistent identity, API exposure and ingestion of dynamic flows, is where the decisive effort lies. The main critical issues identified are the absence of definitive georeferencing, the partial coverage of portions inaccessible during acquisition, the untested status of end-to-end interoperability, and the governance preconditions attached to the monitoring network and to camera-based observation.
The case study therefore demonstrates the practical applicability of the reference methodology in a complex urban-river environment, while full operational validation of the Digital Twin remains future work. Subject to these caveats, the results support the potential of Digital Twin architectures as enabling technologies of the twin transition in the AECO sector and provide a documented reference for authorities intending to undertake comparable applications in other urban river contexts, contributing to the resilience, sustainability and data-driven territorial-management objectives promoted by the 2030 Agenda: most directly SDG 9 (resilient infrastructure and innovation), SDG 11 (sustainable cities and communities) and SDG 13 (climate action), and, through the hydro-pluviometric and water-governance objective, SDG 6 (clean water and sanitation). The sustainability mechanism is therefore not limited to digitalisation as such. It lies in the possibility of making riverbed and bank maintenance more condition-based, reducing unnecessary survey repetition and poorly targeted interventions, improving the availability of risk-relevant information, and preparing the observation chain required for more timely flood-risk assessment.
Future work follows directly from the open points identified above. The first priority is the implementation of the two-year roadmap for installing the hydro-pluviometric monitoring network, which will allow the indicators adopted in Section 3.4 to be monitored and experimentally validated against real operational data, and the geodetic realignment of the information model in UTM 33N, which conditions federation with AUBAC’s Territorial Information System. In parallel, a controlled, quantitative comparison between TLS and SLAM acquisition on an overlapping test area is planned, assessing point-cloud density, RMSE, acquisition time and repeatability, so as to substantiate the technique-selection criteria applied in this case study. A further development concerns the integration of Tiber hydraulic models into the Digital Twin, enabling coupled simulation of the river stretch, bridges and banks under flood scenarios, incorporating climate-adjusted rainfall and discharge projections alongside historical design values. End-to-end testing of BIM-GIS federation, including IFC conformance checking and an agreed exchange specification, is required before interoperability can be claimed. Beyond the urban stretch examined here, the approach will be extended to the extra-urban reaches of the river basin, and machine-learning algorithms will be tested for anomaly detection and forecasting on real hydrological time series. Finally, the adoption of advanced trustworthiness mechanisms will be pursued, including an assessment of the security risks specific to Digital Twins and a data-protection impact assessment for camera-based monitoring. Application of the same reference methodology to at least one further river corridor and one further institutional context would be needed to test the transferability of the observations reported here.
Author Contributions
Conceptualization, R.R., E.P., S.A., V.A.T. and M.C.; methodology, R.R., E.P., S.A., V.A.T. and M.C.; software, V.A.T.; validation, E.P., S.A., V.A.T. and M.C.; formal analysis, R.R., E.P., S.A. and M.C.; investigation, R.R., E.P. and V.A.T.; resources, E.P., V.A.T. and M.C.; data curation, E.P., V.A.T. and M.C.; writing-original draft preparation, R.R., E.P., V.A.T. and M.C.; writing-review and editing, R.R., E.P., S.A., V.A.T. and M.C.; visualization, R.R., E.P., V.A.T. and M.C.; supervision, R.R., E.P., S.A. and M.C.; project administration, E.P. and M.C.; funding acquisition, E.P. and M.C. All authors have read and agreed to the published version of the manuscript.
Funding
This research was funded by the Central Apennine River Basin District Authority (AUBAC) through an inter-institutional agreement pursuant to Art. 15 of Law 241/1990 between public administrations, under the AUBAC-CITERA research agreement “Study and research activities for the development of a Digital Twin of the urban stretch of the Tiber River in Rome”, grant/agreement number 2025-URM1100-0000203.
Institutional Review Board Statement
Not applicable.
Informed Consent Statement
Not applicable.
Data Availability Statement
Publicly available planning and geospatial datasets analyzed in this study can be accessed through the AUBAC WebGIS portal at: https://webgis.abdac.it/portal (accessed on 25 August 2026). Survey-derived point clouds, Scan-to-BIM models and prototype dashboard materials are not publicly available at this stage because they are deliverables of an ongoing institutional research agreement and are subject to technical validation and authorization by the data-owning institutions.
Acknowledgments
The authors acknowledge the Central Apennine River Basin District Authority (AUBAC) and the CITERA Interdepartmental Research Centre of Sapienza University of Rome for the institutional framework within which the research agreement was developed. The authors are grateful to Simone Satta and Daniele Moretti (AUBAC, Remote Sensing and Territorial Information Systems Division) and to Alessandro Agostinelli (CITERA, Sapienza University of Rome) for carrying out the geometric survey campaign. During the preparation of this manuscript, the authors used ChatGPT (OpenAI, GPT-5.6; accessed in August 2026) to support language refinement, improve the clarity of presentation and refine figures; the authors reviewed and edited the output and take full responsibility for the content.
Conflicts of Interest
M.C. is the Secretary General of the Central Apennine River Basin District Authority (AUBAC), which funded this research through an inter-institutional agreement (Art. 15, Law 241/1990) with CITERA, Sapienza University of Rome, for AUBAC’s institutional planning purposes. The decision to prepare and submit the manuscript was subsequent to the institutional research activity and was made by the authors. M.C. contributed to the study as a co-author, as detailed in the Author Contributions; his institutional role at AUBAC did not influence the study design, the analysis and interpretation of the results, or their independent presentation. M.C. and S.A. serve as Guest Editors of the Special Issue to which this manuscript is submitted; they were not involved in its editorial handling, reviewer selection, peer review, or editorial decision, in accordance with the journal’s conflict-of-interest procedures. AUBAC provided the institutional framework, funding and access to institutional planning and geospatial information within the research agreement; the scientific analysis, interpretation of the results, manuscript preparation and decision to submit the article were the responsibility of the authors. The authors declare no other conflicts of interest.
Abbreviations
The following abbreviations are used in this manuscript:
| AECO | Architecture, Engineering, Construction and Operation |
| ADCP | Acoustic Doppler Current Profiler |
| AI/ML | Artificial Intelligence / Machine Learning |
| AUBAC | Central Apennine River Basin District Authority |
| BIM | Building Information Modelling |
| CDE | Common Data Environment |
| CPT | Digital Twin Capabilities Periodic Table |
| DT/UDT | Digital Twin / Urban Digital Twin |
| GIS | Geographic Information System |
| IFC | Industry Foundation Classes |
| IoT | Internet of Things |
| KPI | Key Performance Indicator |
| PDCA | Plan-Do-Check-Act |
| PGRA | Flood Risk Management Plan (Piano di Gestione del Rischio di Alluvioni) |
| SLAM | Simultaneous Localization and Mapping |
| TLS | Terrestrial Laser Scanning |
| UAV | Unmanned Aerial Vehicle |
References
- United Nations. Transforming Our World: The 2030 Agenda for Sustainable Development; Resolution A/RES/70/1; United Nations: New York, NY, USA, 2015. [Google Scholar]
- IPCC. Climate Change 2022: Mitigation of Climate Change. Contribution of Working Group III to the Sixth Assessment Report of the Intergovernmental Panel on Climate Change; Cambridge University Press: Cambridge, UK, 2022. [Google Scholar]
- UNCTAD. The Impact of Rapid Technological Change on Sustainable Development; Report of the Secretary General E/CN.16/2019/2; United Nations: Geneva, Switzerland, 2019. [Google Scholar]
- Muench, S.; Stoermer, E.; Jensen, K.; Asikainen, T.; Salvi, M.; Scapolo, F. Towards a Green and Digital Future. Key Requirements for Successful Twin Transitions in the European Union; EUR 31075 EN; Publications Office of the European Union: Luxembourg, 2022. [Google Scholar]
- Governo Italiano. Piano Nazionale di Ripresa e Resilienza (PNRR); Roma, Italia, 2021.
- Casini, M. Construction 4.0: Advanced Technology, Tools and Materials for the Digital Transformation of the Construction Industry; Woodhead Publishing: Duxford, UK, 2022; ISBN 9780128217979. [Google Scholar]
- Piras, G.; Agostinelli, S.; Muzi, F. Digital Twin Framework for Built Environment: A Review of Key Enablers. Energies 2024, 17, 436. [Google Scholar] [CrossRef]
- AlBalkhy, W.; Karmaoui, D.; Ducoulombier, L.; Lafhaj, Z.; Linner, T. Digital twins in the built environment: Definition, applications, and challenges. Autom. Constr. 2024, 162, 105368. [Google Scholar] [CrossRef]
- Sacks, R.; Brilakis, I.; Pikas, E.; Xie, H.S.; Girolami, M. Construction with digital twin information systems. Data-Centric Eng. 2020, 1, e14. [Google Scholar] [CrossRef]
- Grieves, M.; Vickers, J. Digital Twin: Mitigating Unpredictable, Undesirable Emergent Behavior in Complex Systems. In Transdisciplinary Perspectives on Complex Systems; Kahlen, F.-J., Flumerfelt, S., Alves, A., Eds.; Springer: Cham, Switzerland, 2017; pp. 85–113. [Google Scholar] [CrossRef]
- Glaessgen, E.; Stargel, D. The Digital Twin Paradigm for Future NASA and U.S. Air Force Vehicles. In Proceedings of the 53rd AIAA/ASME/ASCE/AHS/ASC Structures, Structural Dynamics and Materials Conference, Honolulu, HI, USA, 23–26 April 2012. [Google Scholar] [CrossRef]
- Kaur, M.J.; Mishra, V.P.; Maheshwari, P. The Convergence of Digital Twin, IoT, and Machine Learning: Transforming Data into Action. In Digital Twin Technologies and Smart Cities; Farsi, M., Daneshkhah, A., Hosseinian-Far, A., Jahankhani, H., Eds.; Springer: Cham, Switzerland, 2020; pp. 3–17. [Google Scholar] [CrossRef]
- Qi, Q.; Tao, F.; Hu, T.; Anwer, N.; Liu, A.; Wei, Y.; Wang, L.; Nee, A.Y.C. Enabling technologies and tools for digital twin. J. Manuf. Syst. 2021, 58, 3–21. [Google Scholar] [CrossRef]
- Jones, D.; Snider, C.; Nassehi, A.; Yon, J.; Hicks, B. Characterising the Digital Twin: A systematic literature review. CIRP J. Manuf. Sci. Technol. 2020, 29, 36–52. [Google Scholar] [CrossRef]
- Semeraro, C.; Lezoche, M.; Panetto, H.; Dassisti, M. Digital twin paradigm: A systematic literature review. Comput. Ind. 2021, 130, 103469. [Google Scholar] [CrossRef]
- Kritzinger, W.; Karner, M.; Traar, G.; Henjes, J.; Sihn, W. Digital Twin in manufacturing: A categorical literature review and classification. IFAC-PapersOnLine 2018, 51, 1016–1022. [Google Scholar] [CrossRef]
- VanDerHorn, E.; Mahadevan, S. Digital Twin: Generalization, characterization and implementation. Decis. Support Syst. 2021, 145, 113524. [Google Scholar] [CrossRef]
- Fuller, A.; Fan, Z.; Day, C.; Barlow, C. Digital Twin: Enabling Technologies, Challenges and Open Research. IEEE Access 2020, 8, 108952–108971. [Google Scholar] [CrossRef]
- Rasheed, A.; San, O.; Kvamsdal, T. Digital Twin: Values, Challenges and Enablers From a Modeling Perspective. IEEE Access 2020, 8, 21980–22012. [Google Scholar] [CrossRef]
- Botín-Sanabria, D.M.; Mihaita, A.-S.; Peimbert-García, R.E.; Ramírez-Moreno, M.A.; Ramírez-Mendoza, R.A.; Lozoya-Santos, J.d.J. Digital Twin Technology Challenges and Applications: A Comprehensive Review. Remote Sens. 2022, 14, 1335. [Google Scholar] [CrossRef]
- ISO 23247-1:2021; Automation Systems and Integration—Digital Twin Framework for Manufacturing—Part 1: Overview and General Principles. International Organization for Standardization: Geneva, Switzerland, 2021.
- Bolton, A.; Butler, L.; Dabson, I.; Enzer, M.; Evans, M.; Fenemore, T.; Harradence, F.; et al. Gemini Principles; Centre for Digital Built Britain: Cambridge, UK, 2018. [Google Scholar] [CrossRef]
- Tao, F.; Zhang, H.; Liu, A.; Nee, A.Y.C. Digital Twin in Industry: State-of-the-Art. IEEE Trans. Ind. Inform. 2019, 15, 2405–2415. [Google Scholar] [CrossRef]
- Wagner, R.; Schleich, B.; Haefner, B.; Kuhnle, A.; Wartzack, S.; Lanza, G. Challenges and Potentials of Digital Twins and Industry 4.0 in Product Design and Production for High Performance Products. Procedia CIRP 2019, 84, 88–93. [Google Scholar] [CrossRef]
- Brilakis, I.; Pan, Y.; Borrmann, A.; Mayer, H.-G.; Rhein, F.; Vos, C.; Pettinato, E.; Wagner, S. Built Environment Digital Twinning; Report of the International Workshop on Built Environment Digital Twinning; TUM Institute for Advanced Study and Siemens AG: Munich, Germany, 2019. [Google Scholar]
- Boje, C.; Guerriero, A.; Kubicki, S.; Rezgui, Y. Towards a semantic Construction Digital Twin: Directions for future research. Autom. Constr. 2020, 114, 103179. [Google Scholar] [CrossRef]
- Opoku, D.-G.J.; Perera, S.; Osei-Kyei, R.; Rashidi, M. Digital twin application in the construction industry: An overview. J. Build. Eng. 2021, 40, 102726. [Google Scholar] [CrossRef]
- Shahzad, M.; Shafiq, M.T.; Douglas, D.; Kassem, M. Digital Twins in Built Environments: An Investigation of the Characteristics, Applications, and Challenges. Buildings 2022, 12, 120. [Google Scholar] [CrossRef]
- Weil, C.; Bibri, S.E.; Longchamp, R.; Golay, F.; Alahi, A. Urban Digital Twin Challenges: A Systematic Review and Perspectives for Sustainable Smart Cities. Sustain. Cities Soc. 2023, 99, 104862. [Google Scholar] [CrossRef]
- Davila Delgado, J.M.; Oyedele, L. Digital Twins for the built environment: Learning from conceptual and process models in manufacturing. Adv. Eng. Inform. 2021, 49, 101332. [Google Scholar] [CrossRef]
- Deng, M.; Menassa, C.C.; Kamat, V.R. From BIM to digital twins: A systematic review of the evolution of intelligent building representations in the AEC-FM industry. J. Inf. Technol. Constr. 2021, 26, 58–83. [Google Scholar] [CrossRef]
- Abou-Ibrahim, H.; Lappalainen, E.; Seppänen, O. Digital Twin of a Design Process: An Exploratory Study. In Proceedings of the 30th Annual Conference of the International Group for Lean Construction (IGLC30), Edmonton, AB, Canada, 25–31 July 2022; pp. 1198–1209. [Google Scholar] [CrossRef] [PubMed]
- Pal, A.; Lin, J.J.; Hsieh, S.-H.; Golparvar-Fard, M. Automated vision-based construction progress monitoring in built environment through digital twin. Dev. Built Environ. 2023, 16, 100247. [Google Scholar] [CrossRef]
- Teizer, J.; Johansen, K.W.; Schultz, C. The Concept of Digital Twin for Construction Safety. In Proceedings of the Construction Research Congress 2022, Arlington, VA, USA, 9–12 March 2022; pp. 1156–1165. [Google Scholar] [CrossRef]
- Moretti, N.; Xie, X.; Garcia, J.; Chang, J.; Parlikad, A.K. Digital twin-based built environment asset management services development. IOP Conf. Ser. Earth Environ. Sci. 2022, 1101, 092023. [Google Scholar] [CrossRef]
- Lu, Q.; Parlikad, A.K.; Woodall, P.; Don Ranasinghe, G.; Xie, X.; Liang, Z.; Konstantinou, E.; Heaton, J.; Schooling, J. Developing a Digital Twin at Building and City Levels: Case Study of West Cambridge Campus. J. Manag. Eng. 2020, 36, 05020004. [Google Scholar] [CrossRef]
- Teisserenc, B.; Sepasgozar, S. Project Data Categorization, Adoption Factors, and Non-Functional Requirements for Blockchain Based Digital Twins in the Construction Industry 4.0. Buildings 2021, 11, 626. [Google Scholar] [CrossRef]
- Guikema, S.; Flage, R. Digital twins as a security risk? Risk Anal. 2025, 45, 269–273. [Google Scholar] [CrossRef] [PubMed]
- Ammar, A.; Nassereddine, H.; AbdulBaky, N.; AbouKansour, A.; Tannoury, J.; Urban, H.; Schranz, C. Digital Twins in the Construction Industry: A Perspective of Practitioners and Building Authority. Front. Built Environ. 2022, 8, 834671. [Google Scholar] [CrossRef]
- Thomas, E.; Bowman, J. Harnessing the Data Advantage in Construction; Autodesk & FMI: San Rafael, CA, USA, 2021. [Google Scholar]
- Floridi, L. The Philosophy of Information; Oxford University Press: Oxford, UK, 2013. [Google Scholar]
- Batty, M. Digital twins. Environ. Plan. B Urban Anal. City Sci. 2018, 45, 817–820. [Google Scholar] [CrossRef]
- Ketzler, B.; Naserentin, V.; Latino, F.; Zangelidis, C.; Thuvander, L.; Logg, A. Digital Twins for Cities: A State of the Art Review. Built Environ. 2020, 46, 547–573. [Google Scholar] [CrossRef]
- Dembski, F.; Wössner, U.; Letzgus, M.; Ruddat, M.; Yamu, C. Urban Digital Twins for Smart Cities and Citizens: The Case Study of Herrenberg, Germany. Sustainability 2020, 12, 2307. [Google Scholar] [CrossRef]
- Schrotter, G.; Hürzeler, C. The Digital Twin of the City of Zurich for Urban Planning. PFG J. Photogramm. Remote Sens. Geoinf. Sci. 2020, 88, 99–112. [Google Scholar] [CrossRef]
- Ferré-Bigorra, J.; Casals, M.; Gangolells, M. The adoption of urban digital twins. Cities 2022, 131, 103905. [Google Scholar] [CrossRef]
- Lehtola, V.V.; Koeva, M.; Oude Elberink, S.; Raposo, P.; Virtanen, J.-P.; Vahdatikhaki, F.; Borsci, S. Digital twin of a city: Review of technology serving city needs. Int. J. Appl. Earth Obs. Geoinf. 2022, 114, 102915. [Google Scholar] [CrossRef]
- Mylonas, G.; Kalogeras, A.; Kalogeras, G.; Anagnostopoulos, C.; Alexakos, C.; Muñoz, L. Digital Twins From Smart Manufacturing to Smart Cities: A Survey. IEEE Access 2021, 9, 143222–143249. [Google Scholar] [CrossRef]
- Centre for Digital Built Britain. On the Governance of City Digital Twins; CDBB Monthly Paper; University of Cambridge: Cambridge, UK, 2019. [Google Scholar]
- ISO 37122:2019; Sustainable Cities and Communities–-Indicators for Smart Cities. International Organization for Standardization: Geneva, Switzerland, 2019.
- Callcut, M.; Cerceau Agliozzo, J.-P.; Varga, L.; McMillan, L. Digital Twins in Civil Infrastructure Systems. Sustainability 2021, 13, 11549. [Google Scholar] [CrossRef]
- Bauer, P.; Stevens, B.; Hazeleger, W. A digital twin of Earth for the green transition. Nat. Clim. Change 2021, 11, 80–83. [Google Scholar] [CrossRef]
- Nativi, S.; Mazzetti, P.; Craglia, M. Digital Ecosystems for Developing Digital Twins of the Earth: The Destination Earth Case. Remote Sens. 2021, 13, 2119. [Google Scholar] [CrossRef]
- Brocca, L.; Barbetta, S.; Camici, S.; Ciabatta, L.; Dari, J.; Filippucci, P.; Massari, C.; et al. A Digital Twin of the terrestrial water cycle: A glimpse into the future through high-resolution Earth observations. Front. Sci. 2024, 1, 1190191. [Google Scholar] [CrossRef]
- Maimour, M.; Ahmed, A.; Rondeau, E. Survey on digital twins for natural environments: A communication network perspective. Internet Things 2024, 25, 101070. [Google Scholar] [CrossRef]
- Bartos, M.; Kerkez, B. Pipedream: An interactive digital twin model for natural and urban drainage systems. Environ. Model. Softw. 2021, 144, 105120. [Google Scholar] [CrossRef]
- Hou, X.; Qin, L.; Xue, X.; Xu, S.; Yang, Y.; Liu, X.; Li, M. A city-scale fully controlled system for stormwater management: Consideration of flooding, non-point source pollution and sewer overflow pollution. J. Hydrol. 2021, 603, 127155. [Google Scholar] [CrossRef]
- Aschieri, D.L.D.; Sobrino, N.; Macii, E. Web-GIS Application for Hydrogeological Risk Prevention: The Case Study of Cervo Valley. Sustainability 2024, 16, 9833. [Google Scholar] [CrossRef]
- Barrile, V.; Genovese, E.; Maesano, C.; Calluso, S.; Manti, M.P. Developing an Urban Digital Twin for Environmental and Risk Assessment: A Case Study on Public Lighting and Hydrogeological Risk. Future Internet 2025, 17, 110. [Google Scholar] [CrossRef]
- Mandal, D.; Zou, L.; Wadhwa, A.; Wilkho, R.S.; Cai, Z.; Zhou, B.; Ye, X.; Newman, G.; Gharaibeh, N.; Güneralp, B. FlowsDT: A geospatial digital twin for navigating urban flood dynamics. Comput. Environ. Urban Syst. 2026, 126, 102414. [Google Scholar] [CrossRef] [PubMed]
- Savić, D. Urban Flood Risk and Resilience: How Can We Protect Our Cities from Flooding? Hydrology 2025, 12, 78. [Google Scholar] [CrossRef]
- Ugliotti, F.M.; Daud, M.; Iacono, E. Spatial Insights for Building Resilience: The Territorial Risk Management & Analysis Across Scale Framework for Bridging Scales in Multi-Hazard Assessment. Smart Cities 2025, 8, 27. [Google Scholar] [CrossRef]
- Tucci, G.; Fiorini, L.; Meucci, A.; Conti, A. Integrated Geomatic Solutions for the Digital Twin of Florence: Protecting the Arno River and Its Historic Urban Landscape from Climate Risks. Int. Arch. Photogramm. Remote Sens. Spat. Inf. Sci. 2025, XLVIII-G-2025, 1463–1470. [Google Scholar] [CrossRef]
- Ridolfi, E.; Lucantonio, M.; Di Baldassarre, G.; Moccia, B.; Napolitano, F.; Russo, F. The interplay between the urban development of Rome (Italy) and the Tiber River floods: A review of two millennia of socio-hydrological history. Ambio 2025, 54, 198–210. [Google Scholar] [CrossRef] [PubMed]
- Calenda, G.; Mancini, C.P.; Volpi, E. Selection of the probabilistic model of extreme floods: The case of the River Tiber in Rome. J. Hydrol. 2009, 371, 1–11. [Google Scholar] [CrossRef]
- Natale, L.; Savi, F. Monte Carlo analysis of probability of inundation of Rome. Environ. Model. Softw. 2007, 22, 1409–1416. [Google Scholar] [CrossRef]
- European Parliament and Council. Directive 2007/60/EC of 23 October 2007 on the Assessment and Management of Flood Risks. Off. J. Eur. Union 2007, L288, 27–34. [Google Scholar]
- Autorità di Bacino Distrettuale dell’Appennino Centrale. Piano di Gestione del Rischio di Alluvioni del Distretto Idrografico dell’Appennino Centrale—II Ciclo; AUBAC: Roma, Italia, 2021. [Google Scholar]
- Consortium, Digital Twin. Digital Twin Capabilities Periodic Table; Object Management Group: Boston, MA, USA, 2022; Available online: https://www.digitaltwinconsortium.org/initiatives/capabilities-periodic-table/ (accessed on 15 July 2026).
- EN ISO 19650-1:2018; Organization and Digitization of Information about Buildings and Civil Engineering Works, Including Building Information Modelling (BIM)—Information Management Using Building Information Modelling—Part 1: Concepts and Principles. ISO: Geneva, Switzerland, 2018.
- ISO 16739-1:2024; Industry Foundation Classes (IFC) for Data Sharing in the Construction and Facility Management Industries—Part 1: Data Schema. ISO: Geneva, Switzerland, 2024.
- Noardo, F.; Harrie, L.; Arroyo Ohori, K.; Biljecki, F.; Ellul, C.; Krijnen, T.; Eriksson, H.; et al. Tools for BIM-GIS Integration (IFC Georeferencing and Conversions): Results from the GeoBIM Benchmark 2019. ISPRS Int. J. Geo-Inf. 2020, 9, 502. [Google Scholar] [CrossRef]
- Jiang, F.; Ma, L.; Broyd, T.; Chen, K. Digital twin and its implementations in the civil engineering sector. Autom. Constr. 2021, 130, 103838. [Google Scholar] [CrossRef]
- Agenzia del Demanio – Design Department and Sapienza University of Rome – Department of Planning, Design, and Technology of Architecture (PDTA), “Twin Handbook,” technical report, Implementing Agreement for Technical-Scientific Cooperation, Rome, June 11, 2024. Available online: https://citera.web.uniroma1.it/sites/default/files/allegati/2026-08/FASE-4-Twin-Handbook.pdf (accessed on 30 August 2026).
- Gürdür Broo, D.; Schooling, J. Digital twins in infrastructure: Definitions, current practices, challenges and strategies. Int. J. Constr. Manag. 2023, 23, 1254–1263. [Google Scholar] [CrossRef]
- Costin, A.; Adibfar, A.; Bridge, J. Digital Twin Framework for Bridge Structural Health Monitoring Utilizing Existing Technologies: New Paradigm for Enhanced Management, Operation, and Maintenance. Transp. Res. Rec. 2024, 2678, 1095–1106. [Google Scholar] [CrossRef]
- Farrar, C.R.; Worden, K. An introduction to structural health monitoring. Philos. Trans. R. Soc. A 2007, 365, 303–315. [Google Scholar] [CrossRef] [PubMed]
- Lydon, M.; Taylor, S.E.; Robinson, D.; Mufti, A.; O’Brien, E.J. Recent developments in bridge weigh in motion (B-WIM). J. Civ. Struct. Health Monit. 2016, 6, 69–81. [Google Scholar] [CrossRef]
- Deming, W.E. Out of the Crisis; MIT Center for Advanced Engineering Study: Cambridge, MA, USA, 1982. [Google Scholar]
- Autorità di Bacino Distrettuale dell’Appennino Centrale. AUBAC Digital Twin–-Portale WebGIS. Available online: https://webgis.abdac.it/portal/apps/experiencebuilder/experience/?id=c59f7b386ca24729852cf2dcf8e2f936 (accessed on 16 July 2026).
- Casini, M. From WebGIS to a Digital Twin for Sustainable Water Governance and Climate-Resilient River Basin District Planning: The AUBAC Case in Central Italy. Sustainability 2026, 18, 2168. [Google Scholar] [CrossRef]
- León-Robles, C.A.; Reinoso-Gordo, J.F.; González-Quiñones, J.J. Heritage Building Information Modeling (H-BIM) Applied to A Stone Bridge. ISPRS Int. J. Geo-Inf. 2019, 8, 121. [Google Scholar] [CrossRef]
- Conti, A.; Fiorini, L.; Massaro, R.; Santoni, C.; Tucci, G. HBIM for the preservation of a historic infrastructure: The Carlo III bridge of the Carolino Aqueduct. Appl. Geomat. 2022, 14, 41–51. [Google Scholar] [CrossRef]
- Morgese, M.; Ansari, F.; Domaneschi, M.; Cimellaro, G.P. Post-collapse analysis of Morandi’s Polcevera viaduct in Genoa, Italy. J. Civ. Struct. Health Monit. 2020, 10, 69–85. [Google Scholar] [CrossRef]
- Ministero delle Infrastrutture e dei Trasporti, Consiglio Superiore dei Lavori Pubblici. Linee Guida per la Classificazione e Gestione del Rischio, la Valutazione della Sicurezza ed il Monitoraggio dei Ponti Esistenti; MIT: Roma, Italia, 2020. [Google Scholar]
- Mahmoodian, M.; Shahrivar, F.; Setunge, S.; Mazaheri, S. Development of Digital Twin for Intelligent Maintenance of Civil Infrastructure. Sustainability 2022, 14, 8664. [Google Scholar] [CrossRef]
- Errandonea, I.; Beltrán, S.; Arrizabalaga, S. Digital Twin for maintenance: A literature review. Comput. Ind. 2020, 123, 103316. [Google Scholar] [CrossRef]
- Cumo, F.; Giovenale, A.M.; Pennacchia, E.; Tiburcio, V.A. Towards a Healthier Hospital Environment: The Role of Digital Twins in Achieving Optimal Environmental Comfort. Digit. Twins Appl. 2025, 2, e70002. [Google Scholar] [CrossRef]
- Sammartano, G.; Spanò, A. Point clouds by SLAM-based mobile mapping systems: Accuracy and geometric content validation in multisensor survey and stand-alone acquisition. Appl. Geomat. 2018, 10, 317–339. [Google Scholar] [CrossRef]
- Seo, J.; Duque, L.; Wacker, J. Drone-enabled bridge inspection methodology and application. Autom. Constr. 2018, 94, 112–126. [Google Scholar] [CrossRef]
- Ye, C.; Butler, L.; Calka, B.; Iangurazov, M.; Lu, Q.; Gregory, A.; Girolami, M.; Middleton, C. A Digital Twin of Bridges for Structural Health Monitoring. In Proceedings of the 12th International Workshop on Structural Health Monitoring, Stanford, CA, USA, 10–12 September 2019. [Google Scholar] [CrossRef] [PubMed]
- Angjeliu, G.; Coronelli, D.; Cardani, G. Development of the simulation model for Digital Twin applications in historical masonry buildings. Comput. Struct. 2020, 238, 106282. [Google Scholar] [CrossRef]
Figure 1.
Urban stretch of the Tiber River under investigation.
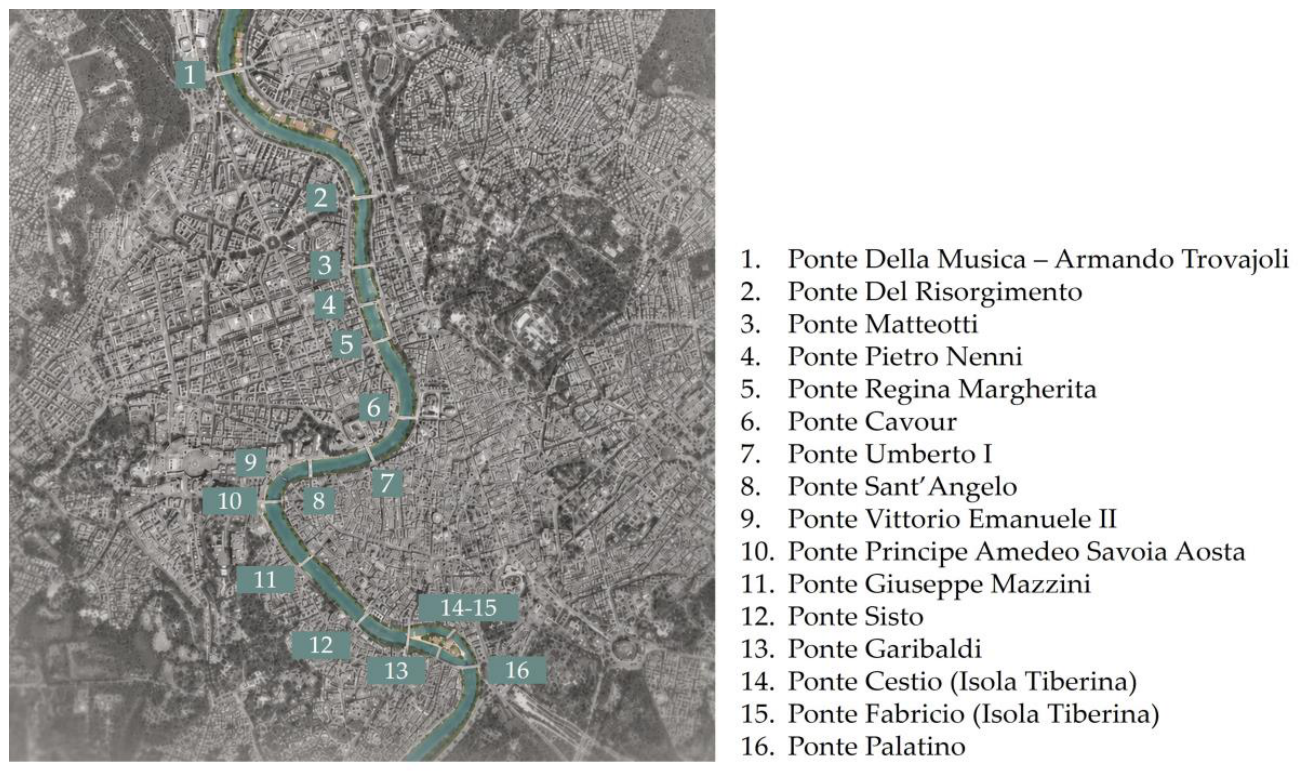
Figure 2.
Architecture of the hydrological-hydraulic Digital Twin of the river stretch: data flow between the physical entity, the exchange platform, the digital twin and AUBAC decision-makers, with feedback to observation and management activities. Steps involving civil protection and other bodies denote coordination with the competent authorities according to applicable procedures, not autonomous functions of the authority.
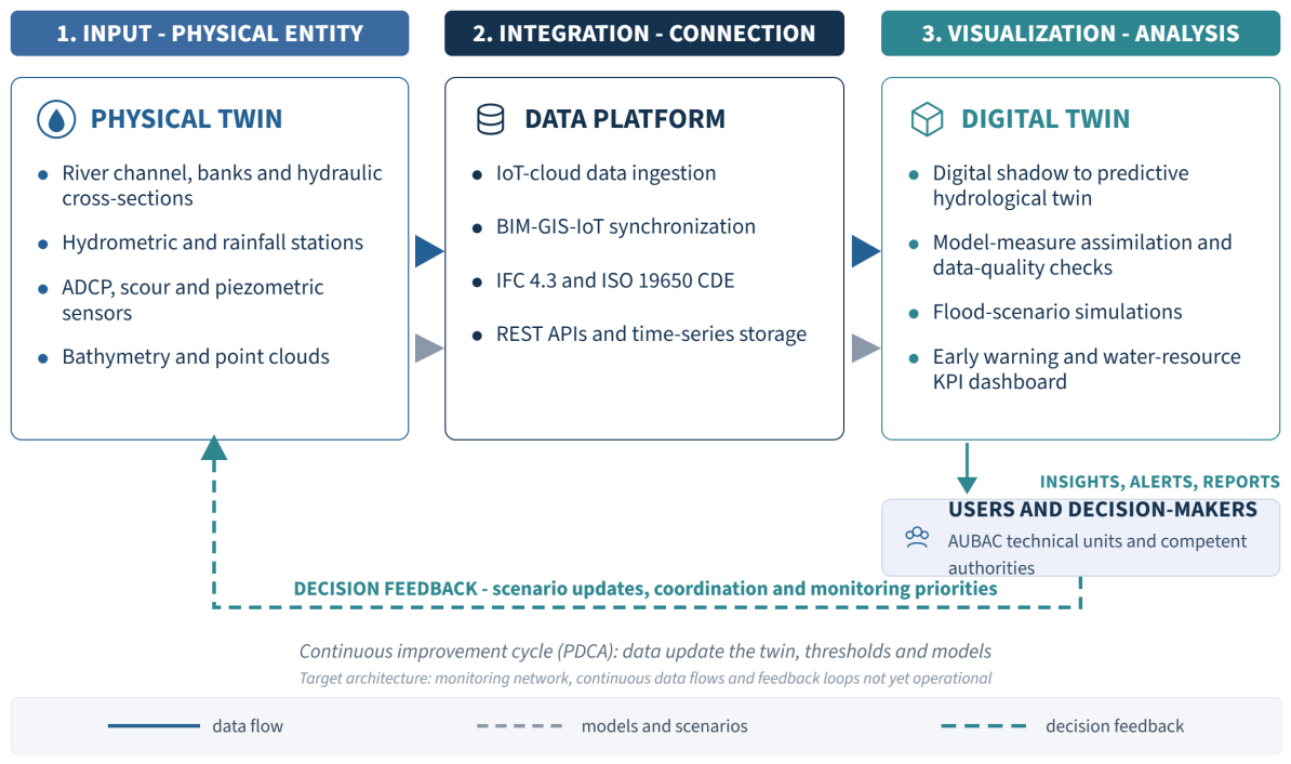
Figure 3.
Point cloud of the Ponte della Musica “Armando Trovajoli” and the adjoining banks, from multi-station terrestrial laser scanning and SLAM mobile-mapping survey.
Figure 3.
Point cloud of the Ponte della Musica “Armando Trovajoli” and the adjoining banks, from multi-station terrestrial laser scanning and SLAM mobile-mapping survey.
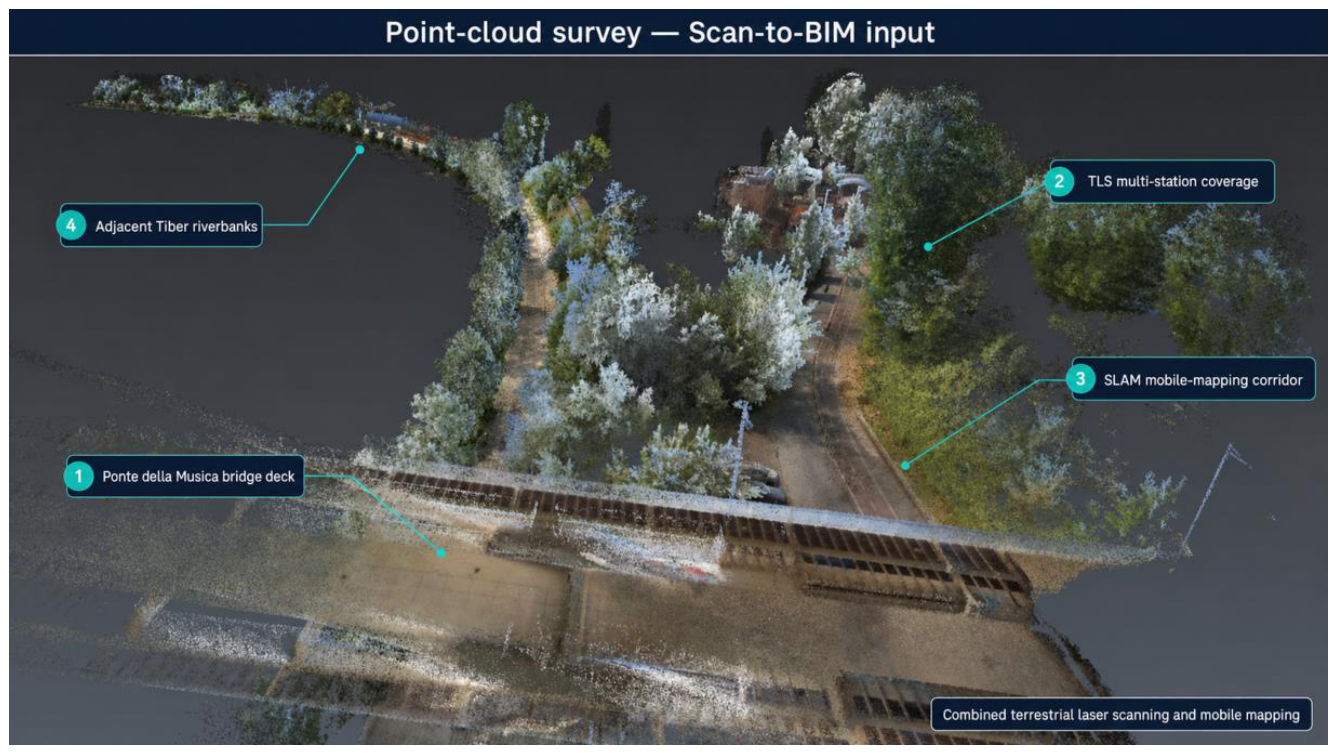
Figure 4.
View of the river-stretch model in Autodesk InfraWorks: integration of the Scan-to-BIM geometric survey within the geospatial context, in support of hydraulic simulations and corridor observation. The BIM-GIS federation shown is prepared but not yet operational (see Section 4.7).
Figure 4.
View of the river-stretch model in Autodesk InfraWorks: integration of the Scan-to-BIM geometric survey within the geospatial context, in support of hydraulic simulations and corridor observation. The BIM-GIS federation shown is prepared but not yet operational (see Section 4.7).
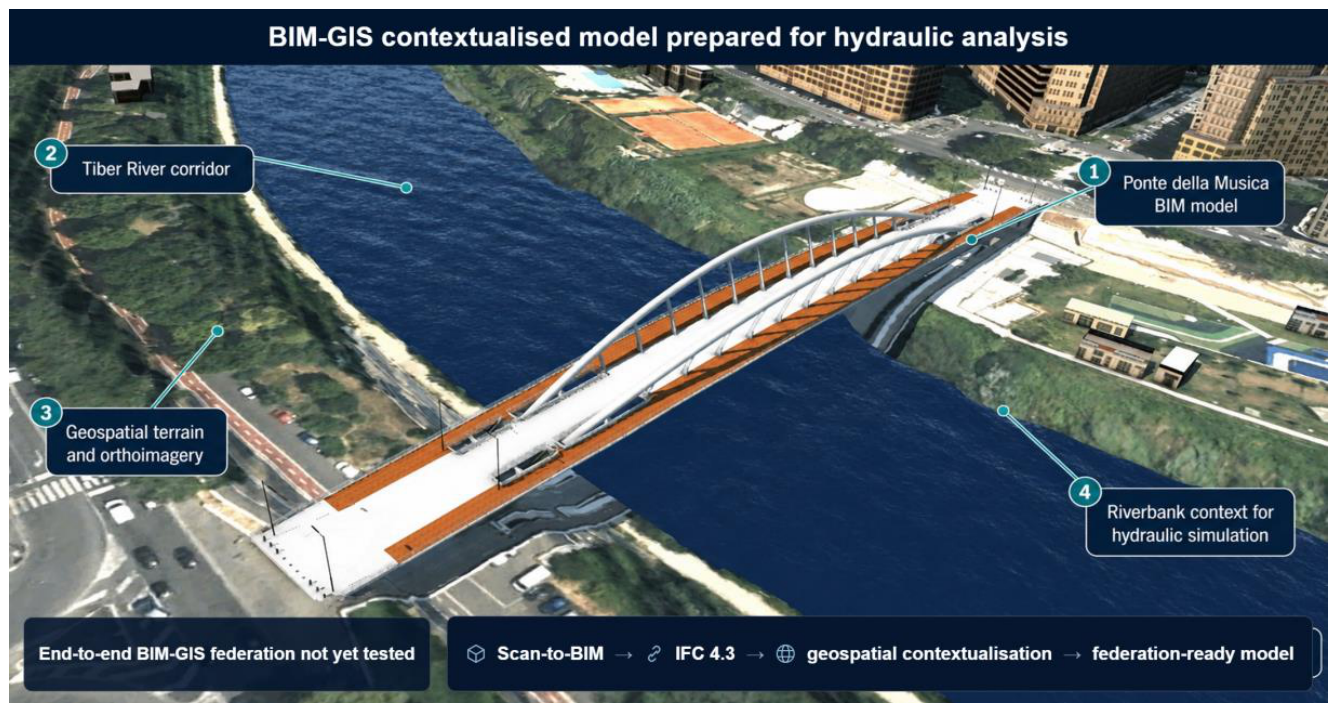
Figure 5.
The “AUBAC Digital Twin” WebGIS portal: study stretch between Ponte della Musica and Ponte Palatino, including the Tiber Island, with the banks of the Tiber highlighted and the location of the Central Apennine hydrographic district (basemap source: webgis.abdac.it).
Figure 5.
The “AUBAC Digital Twin” WebGIS portal: study stretch between Ponte della Musica and Ponte Palatino, including the Tiber Island, with the banks of the Tiber highlighted and the location of the Central Apennine hydrographic district (basemap source: webgis.abdac.it).
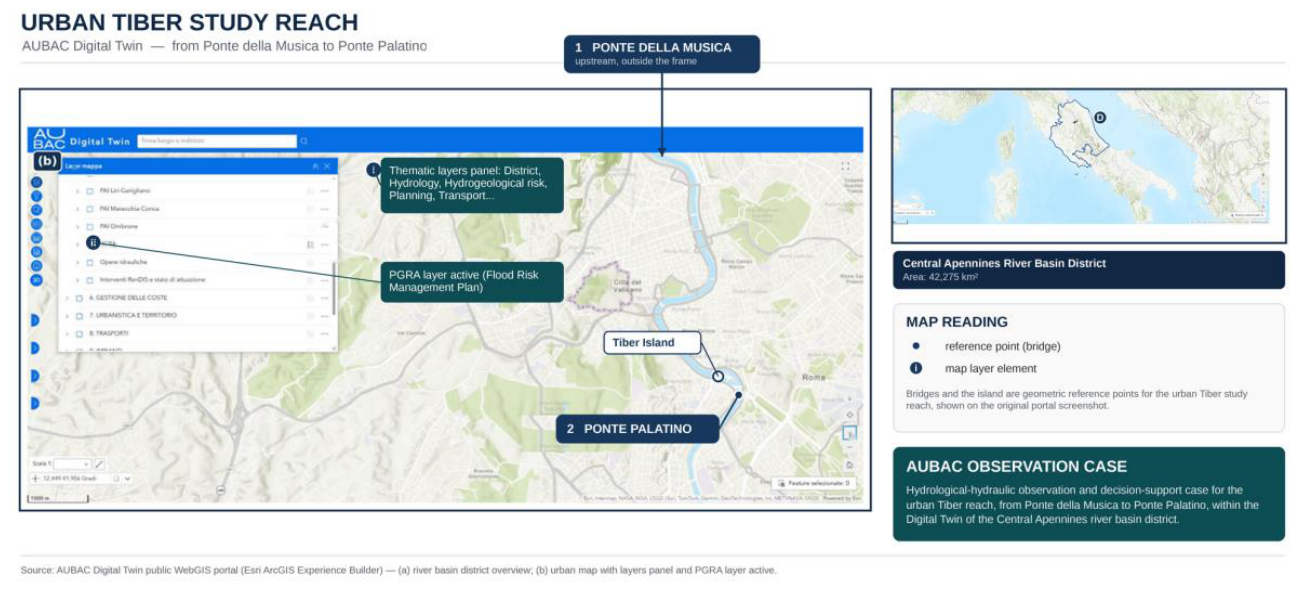
Figure 6.
Layout scheme of the hydro-pluviometric sensing configuration on the typical cross-section of the urban stretch, with the alert water levels.
Figure 6.
Layout scheme of the hydro-pluviometric sensing configuration on the typical cross-section of the urban stretch, with the alert water levels.
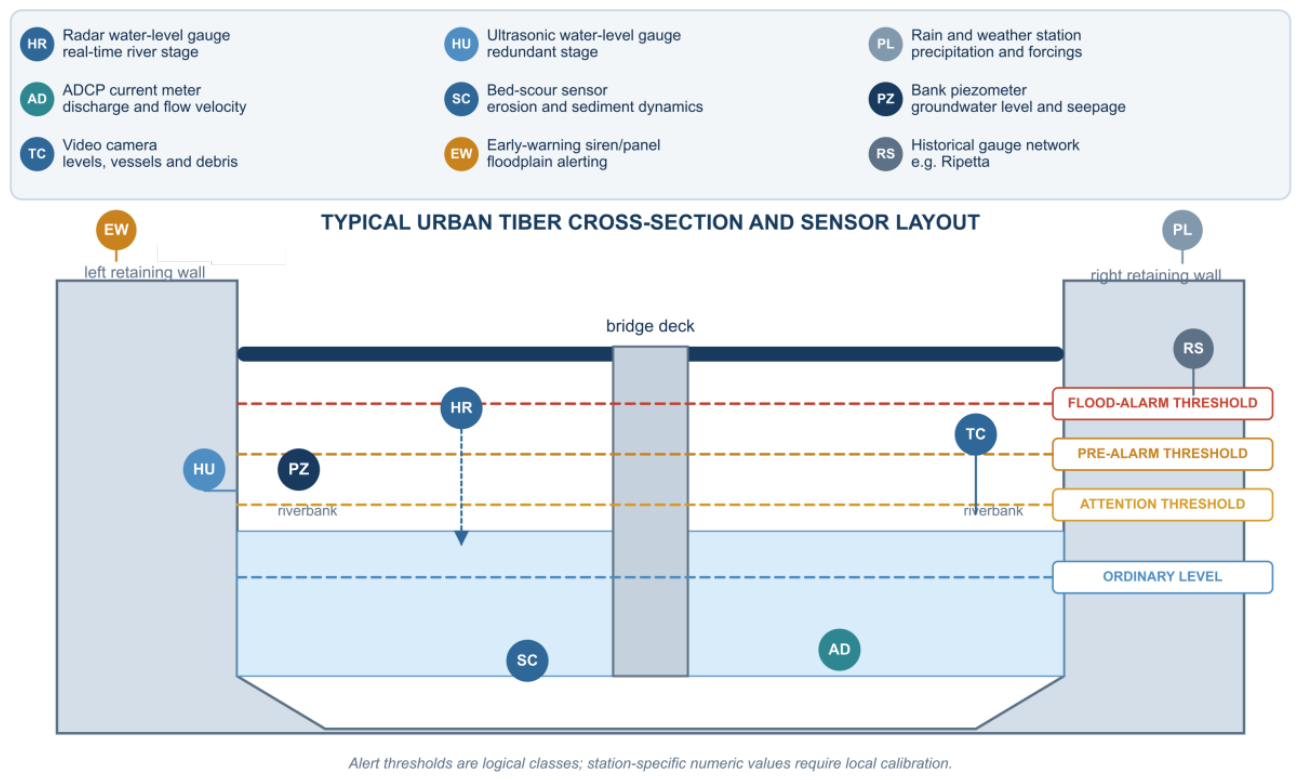
Figure 7.
Flow chart of hydrological-hydraulic monitoring: acquisition, forecasting, alerting, protocol activation and feedback for recalibration of the Digital Twin. The institutional steps denote coordination with the competent authorities according to applicable procedures, not autonomous operational actions.
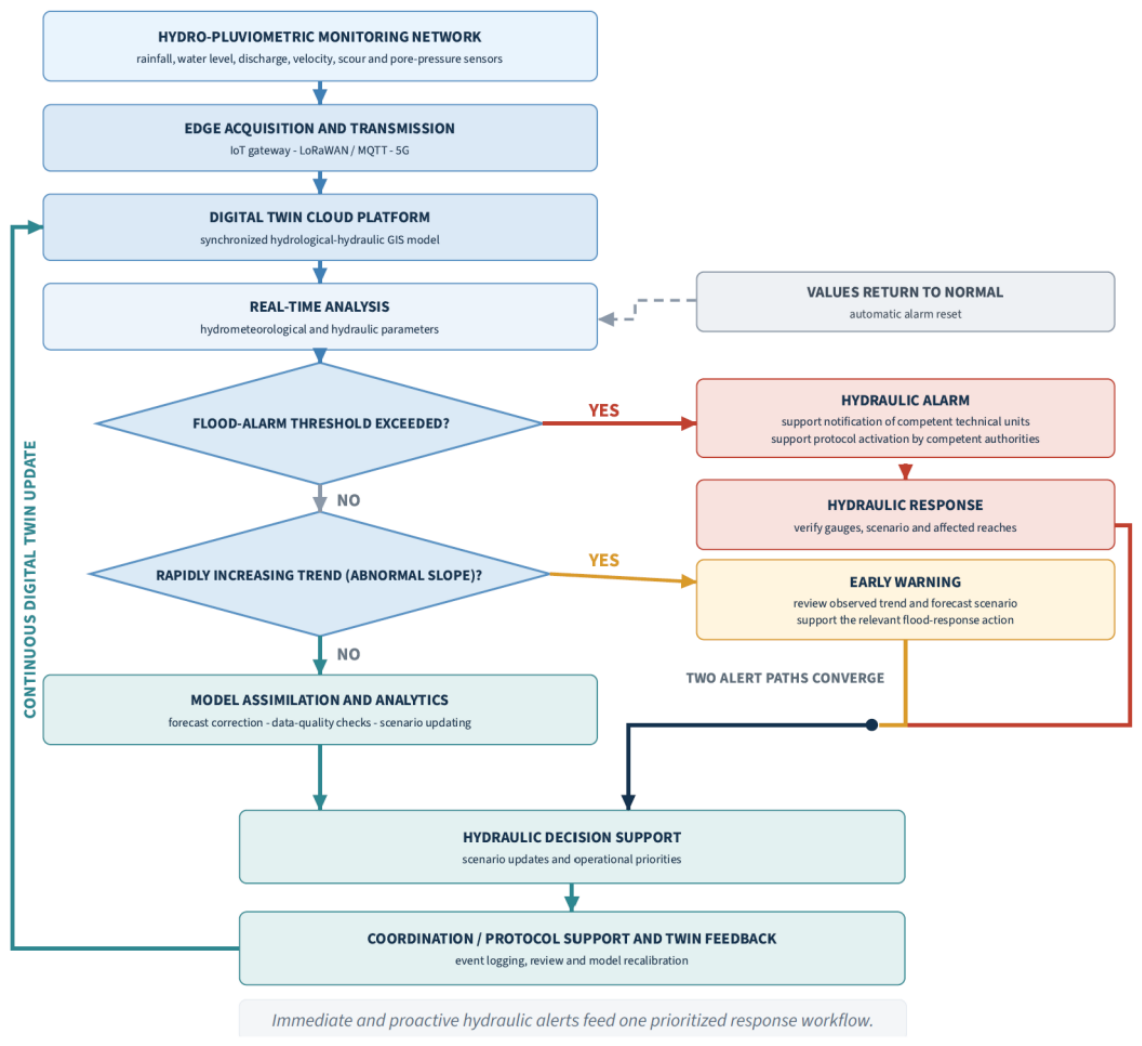
Figure 8.
Prototype dashboard for hydro-pluviometric monitoring: hydrological-hydraulic indicators, forecasts, data quality and event log. The numerical values and states displayed are simulated for demonstration purposes and do not derive from real monitoring data, which are not yet available in the absence of the installed network.
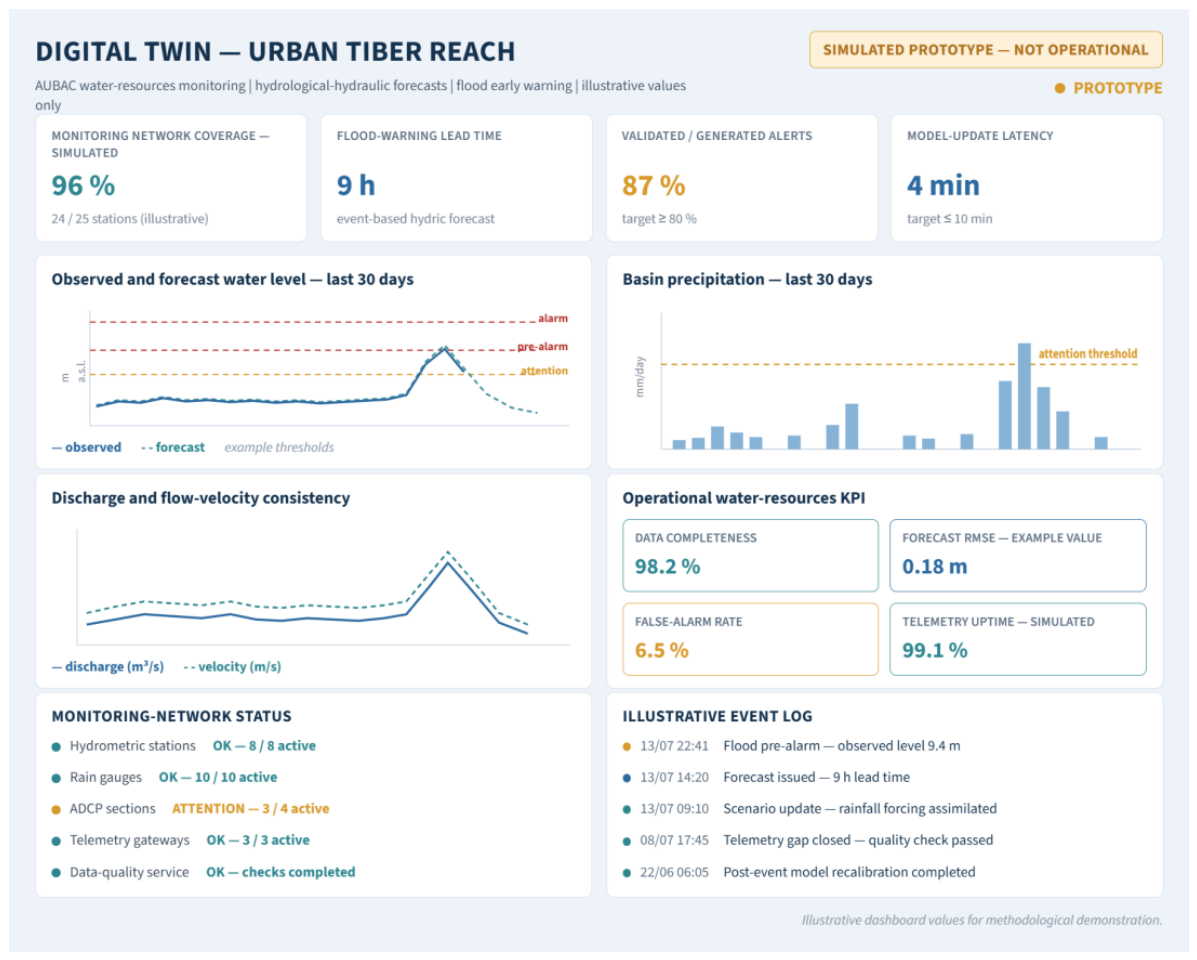
Figure 9.
Implementation and validation roadmap for the river-stretch Digital Twin (24 months): hydro-pluviometric network, model calibration, intermediate indicator validation and final verification.
Figure 9.
Implementation and validation roadmap for the river-stretch Digital Twin (24 months): hydro-pluviometric network, model calibration, intermediate indicator validation and final verification.
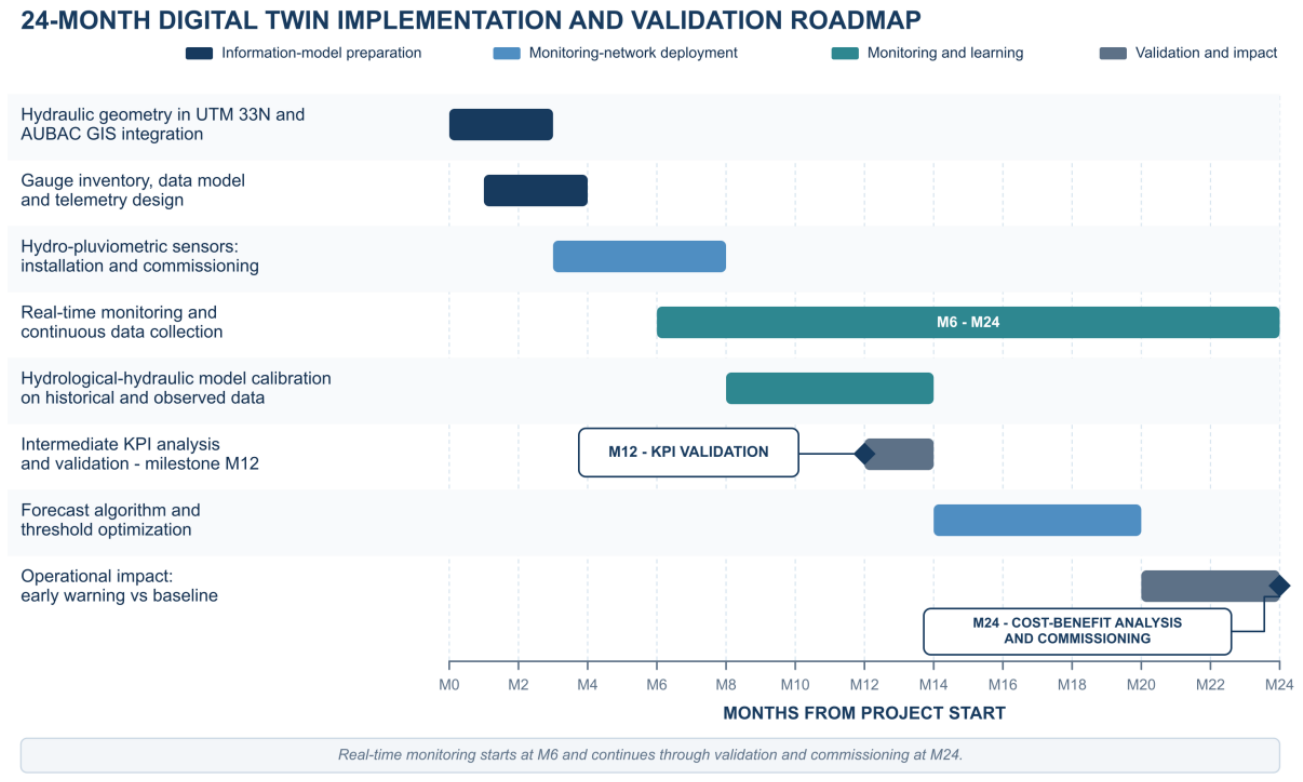
Table 1.
Comparative overview of selected Digital Twin experiences relevant to the present case study.
Table 1.
Comparative overview of selected Digital Twin experiences relevant to the present case study.
| Case study | Scale | Main management objectives | Information assets produced | Implementation status | Technologies employed |
|---|---|---|---|---|---|
| Herrenberg [44] | Urban | Participatory planning, mobility, urban comfort | 3D city model, simulation outputs, VR environment | Demonstrative / pilot | 3D city model, space syntax, wind-flow simulation, VR |
| Zurich [45] | Urban | Urban planning | 3D city model, municipal geodata services | Operational | 3D city model, GIS platform |
| Florence / Arno [63] | Urban-riverine | Hydraulic and landscape protection of the river system | Multi-sensor geomatic datasets of the river corridor | Under development | Multi-sensor geomatic solutions |
| Tiber River (this study) | Urban-riverine (river reach and exposed interfaces) | Condition-based maintenance, hydraulic-risk monitoring, hydro-pluviometric monitoring | Point clouds of 16 bridges and adjoining banks; Scan-to-BIM IFC 4.3 models of the 16 bridges; geospatial contextualisation; DT architecture and monitoring configuration at design stage | Prototype: geometric and information layers implemented; monitoring, data flows and indicator validation planned | TLS, SLAM mobile mapping, Scan-to-BIM, IFC 4.3, GIS/InfraWorks, planned IoT hydro-pluviometric sensing |
Table 2.
Characterisation of the case study and operational meaning of each descriptor.
| Descriptor | Case-study selection | Operational meaning within the case study |
|---|---|---|
| Intervention category | Regeneration of the existing built environment | Frames the case study within the existing urban river corridor, including its interfaces with bridges and riverbanks. |
| Process phase | Operation | Refers to the management phase, supporting observation, monitoring and decision-making during the operational stage. |
| Objective 1 | Management of the natural and built environment: condition-based maintenance of riverbed and bank hydraulic works | Supports the planning of interventions on the riverbed and hydraulic structures through the periodic comparison of surveys, models and historical data. |
| Objective 2 | Management of the natural and built environment: hydraulic-risk monitoring | Supports the monitoring of hydrological and hydraulic conditions, as well as of the interferences affecting flow dynamics and the resilience of the river corridor. |
| Objective 3 | Management of the natural and built environment: hydro-pluviometric monitoring | Supports the observation chains and modelling components used for flood-risk and water-governance decision processes. |
Table 3.
Relationship between the objectives adopted for the case study, their decision-making function and the prevailing data types.
Table 3.
Relationship between the objectives adopted for the case study, their decision-making function and the prevailing data types.
| Objective | Temporal horizon | Decision-making purpose | Predominant data type |
|---|---|---|---|
| Condition-based maintenance of riverbed and bank hydraulic works | Periodic (cyclic comparison of surveys) | Planning of routine management interventions for river components, including the riverbed and bank hydraulic structures | Survey-derived geometric data, point clouds and Scan-to-BIM models |
| Hydraulic-risk monitoring | Continuous / real-time | Identification of conditions affecting flow dynamics and the exposure of the river corridor, without structural assessment of hydraulic crossings | Hydrological–hydraulic, geospatial and geometric data related to cross-sections and physical interferences |
| Hydro-pluviometric monitoring in support of water governance | Continuous / real-time | Support to flood-risk and water-governance decision processes in accordance with the Water Framework Directive, the Floods Directive and district planning instruments | Hydro-pluviometric data from monitoring networks |
Table 4.
Input data adopted for the condition-based maintenance objective.
| Input | Unit of measurement |
|---|---|
| Geometric and information models (BIM/InfraWorks) | m, m², m³ |
| Periodic surveys of the riverbed and riverbanks (point clouds and drone-derived orthophotos) | points/m², RGB |
| Hydromorphological data (sedimentation, scour and bank erosion) | mm, m³, mm/year |
| Environmental sensor data (water level, humidity) | various |
| Historical records of hydraulic maintenance activities | date, intervention type, cost |
| Number of routine and extraordinary maintenance interventions | dimensionless |
Table 5.
Input data adopted for the hydraulic-risk-monitoring objective.
| Input | Unit of measurement |
|---|---|
| Geometric and information models of the corridor, riverbed, banks and crossings | m, m², m³ |
| Geospatial, topographic, geological and hydrogeological data | m, km, m², km², %, mm, ppm |
| Point clouds, orthophotos and river cross-sections | pts/m², RGB, m |
| Water levels, discharge and flow velocity at control sections | m, m³/s, m/s |
| Meteorological data, real-time and historical | °C, %, mm, mm/h, km/h, hPa |
| Data from the hydro-pluviometric network and early-warning systems; PGRA hazard and emergency-plan data | m, mm, mm/h, m³/s, m/s; event frequency, intensity, hazard class |
Table 7.
Performance indicators adopted for the condition-based maintenance objective.
| KPI | Unit of measurement |
|---|---|
| Ratio of predictive to corrective maintenance | % |
| Advance-warning lead time | hours, days |
| Downtime reduction | % |
| Digital vs. physical inspection time | person-hours, person-days |
| Extension of remaining useful life | years |
| Maintenance ROI | % |
Table 8.
Performance indicators adopted for the hydraulic-risk-monitoring and corridor-resilience objective.
Table 8.
Performance indicators adopted for the hydraulic-risk-monitoring and corridor-resilience objective.
| KPI | Unit of measurement |
|---|---|
| Hydraulic advance-warning lead time | hours, days |
| Response time to water events | min, hours |
| Availability of the monitoring and alert chain | % |
| No. validated early-warning alerts / no. alerts generated | % |
| Scenario-update latency | s, min |
| Time to activate competent-authority protocols | min, hours |
Table 10.
Capabilities required for the case study, technologies adopted or planned for the Tiber application, and implementation status.
Table 10.
Capabilities required for the case study, technologies adopted or planned for the Tiber application, and implementation status.
| Capability area | Capabilities required for the case study | Technologies adopted | Status |
|---|---|---|---|
| Data Services | Data acquisition and ingestion; data transmission; real-time processing; data aggregation; historical time-series storage; storage and archiving | TLS multi-station acquisition; SLAM mobile mapping (Emesent Hovermap ST-X); UAV imagery (DJI Matrice 350 RTK); IoT hydro-pluviometric sensing (radar and ultrasonic stage gauges, rain gauges, ADCP current meters, scour sensors, piezometers); IoT transmission protocols; cloud/edge services; time-series storage; CDE for information deliverables | Acquisition of geometric data implemented; sensing, transmission, streaming and time-series storage planned |
| Integration | Engineering-systems integration (BIM-GIS); OT/IoT systems integration; API services | IFC 4.3 exchange; Autodesk InfraWorks contextualisation; Esri ArcGIS Enterprise WebGIS environment of the authority; UTM 33N georeferencing and federation with the Territorial Information System; IoT gateway and API services | BIM-GIS contextualisation implemented; georeferencing, federation, OT/IoT integration and API services planned |
| Intelligence | Alerts and notifications; data analysis; forecasting; machine learning; simulation | Hydrological-hydraulic modelling for flood-scenario generation; anomaly detection and forecasting on hydrological time series; dynamic-threshold updating; alerting chain | Planned; no analytical or machine-learning component operational at the time of writing |
| User Experience | Basic visualisation; real-time monitoring; dashboards | Model and point-cloud viewers; WebGIS consultation of hazard and thematic layers; prototype operational dashboard for hydrological-hydraulic indicators | WebGIS consultation and model visualisation implemented; operational dashboard prototyped with simulated values |
| Management | Device management; system monitoring and alerts; event logging | Device-management and platform-monitoring services; event logging for auditability and service continuity | Planned |
| Trustworthiness | Data encryption; device security; authentication; confidentiality and privacy by design; reliability | Encryption and access control; authentication protocols; privacy-by-design provisions for camera-based monitoring; redundancy of water-level measurement | Design requirements defined; implementation planned, subject to the governance provisions recalled in Section 4.5 |
Table 11.
Summary of the survey-derived assets per element (16 bridges and 8 adjoining bank tracts): acquisition technique, point-cloud size and density, acquisition time, level of development / information need, and share of parametrically reconstructed geometry.
Table 11.
Summary of the survey-derived assets per element (16 bridges and 8 adjoining bank tracts): acquisition technique, point-cloud size and density, acquisition time, level of development / information need, and share of parametrically reconstructed geometry.
| Element | Technique | Scan pos. / trajectory | Points (millions) | Mean density (pts/m²) | Acquisition time | LOD | Reconstructed geometry (%) |
|---|---|---|---|---|---|---|---|
| Ponte della Musica “A. Trovajoli” (reference) | TLS | 22 | 500 | 80,000 | 2 h | LOD 300 | ≈ 32 |
| Ponte del Risorgimento | SLAM | closed loop | 9 | 2,500 | ~20 min | LOD 300 | ≈ 15 |
| Ponte Matteotti | SLAM | closed loop | 14 | 3,000 | ~20 min | LOD 300 | ≈ 35 |
| Ponte Pietro Nenni | SLAM | closed loop | 7 | 2,000 | ~15 min | LOD 300 | ≈ 50 |
| Ponte Regina Margherita | SLAM | closed loop | 15 | 2,500 | ~20 min | LOD 300 | ≈ 3 |
| Ponte Cavour | SLAM | closed loop | 13 | 2,500 | ~25 min | LOD 300 | ≈ 15 |
| Ponte Umberto I | SLAM | closed loop | 14 | 3,000 | ~20 min | LOD 300 | ≈ 5 |
| Ponte Sant’Angelo | SLAM | closed loop | 15 | 2,500 | ~35 min | LOD 300 | ≈ 30 |
| Ponte Vittorio Emanuele II | SLAM | closed loop | 12 | 2,000 | ~25 min | LOD 300 | ≈ 10 |
| Ponte Principe Amedeo Savoia Aosta | SLAM | closed loop | 12 | 2,000 | ~25 min | LOD 300 | ≈ 10 |
| Ponte Giuseppe Mazzini | SLAM | closed loop | 20 | 4,000 | ~20 min | LOD 300 | ≈ 3 |
| Ponte Sisto | SLAM | closed loop | 11 | 2,500 | ~20 min | LOD 300 | ≈ 3 |
| Ponte Garibaldi | SLAM | closed loop | 30 | 4,000 | ~25 min | LOD 300 | 0 |
| Ponte Cestio (Isola Tiberina) | SLAM | closed loop | 11 | 3,500 | ~20 min | LOD 300 | 0 |
| Ponte Fabricio (Isola Tiberina) | SLAM | closed loop | 10 | 2,500 | ~35 min | LOD 300 | ≈ 20 |
| Ponte Palatino | SLAM | closed loop | 15 | 2,500 | ~30 min | LOD 300 | ≈ 40 |
| S1 — Banks — P. della Musica–P. del Risorgimento (left) | SLAM | back-and-forth (~1.3 km) | 660 | 8,000 | ~60 min | n/a (not modelled) | n/a |
| S2 — Banks — P. del Risorgimento–P. Cavour (left) | SLAM | back-and-forth (~1.6 km) | 390 | 10,000 | ~80 min | n/a (not modelled) | n/a |
| S3 — Banks — P. Cavour–P. G. Mazzini (left) | SLAM | back-and-forth (~1.6 km) | 80 | 7,000 | ~90 min | n/a (not modelled) | n/a |
| S4 — Banks — P. G. Mazzini–P. Palatino (left) | SLAM | back-and-forth (~1.4 km) | 330 | 10,000 | ~70 min | n/a (not modelled) | n/a |
| S5 — Banks — P. del Risorgimento–P. Cavour (right) | SLAM | back-and-forth (~1.6 km) | 350 | 10,000 | ~80 min | n/a (not modelled) | n/a |
| S6 — Banks — P. Cavour–P. G. Mazzini (right) | SLAM | back-and-forth (~1.6 km) | 100 | 6,000 | ~80 min | n/a (not modelled) | n/a |
| S7 — Banks — P. G. Mazzini–P. Palatino (right) | SLAM | back-and-forth (~1.4 km) | 400 | 10,000 | ~80 min | n/a (not modelled) | n/a |
| S8 — Banks — Isola Tiberina | SLAM | back-and-forth (~0.7 km, island) | 200 | 10,000 | ~30 min | n/a (not modelled) | n/a |
| Subtotal — 16 bridges | TLS + SLAM | — | ≈ 708 | ≈ 2,730 (SLAM); 80,000 (TLS) | ≈ 8 h field / ≈ 56 h proc. | LOD 300 | ≈ 17 (mean) |
| Subtotal — 8 bank tracts | SLAM | — | ≈ 2,510 | ≈ 8,875 (mean) | ≈ 9.5 h field / ≈ 48 h proc. | n/a (not modelled) | n/a |
| Total / mean over the stretch (16 bridges + 8 bank tracts) | TLS + SLAM | — | ≈ 3,218 total | SLAM ≈ 4,870; TLS 80,000 (ref) | ≈ 17 h field / ≈ 104 h proc. | LOD 300 | ≈ 17 (mean, 16 bridges) |
LOD per UNI 11337-4 (LOD 300 ≈ LOD C); all modelled bridges share the same Level of Information Need (LOIN, UNI EN 17412-1): G2 (geometric), A1 (alphanumeric), D0–D1 (documentary).
Table 12.
Maturity level of the Digital Twin components developed for the Tiber River case study.
| Component | Status | Note |
|---|---|---|
| TLS/SLAM geometric survey of the 16 bridges and adjacent banks | Implemented | Point clouds acquired for the whole study stretch |
| Scan-to-BIM information models (IFC 4.3) | Implemented | Semantic structuring (Psets, classification, persistent coding) completed; management parameters to be added |
| Geospatial contextualisation in Autodesk InfraWorks | Implemented | Supports visualisation and future hydraulic simulations |
| Consultation of hazard layers on the AUBAC WebGIS portal | Implemented (pre-existing institutional system) | PGRA layer verified on the study stretch |
| UTM 33N georeferencing and BIM-GIS federation | Planned | Prerequisite for operational integration with AUBAC’s Territorial Information System |
| Hydro-pluviometric sensor network | Planned | Preliminary configuration defined; installation not yet started |
| Continuous data flow and cloud DT platform | Planned | Architecture defined in Section 4.1; not yet operational |
| ML-based anomaly detection and forecasting | Planned | Requires historical/real-time data not yet available |
| Indicator validation against real data | Planned | Scheduled within the 24-month roadmap |
Disclaimer/Publisher’s Note: The statements, opinions and data contained in all publications are solely those of the individual author(s) and contributor(s) and not of MDPI and/or the editor(s). MDPI and/or the editor(s) disclaim responsibility for any injury to people or property resulting from any ideas, methods, instructions or products referred to in the content. |
© 2026 by the authors. Licensee MDPI, Basel, Switzerland. This article is an open access article distributed under the terms and conditions of the Creative Commons Attribution (CC BY) license (http://creativecommons.org/licenses/by/4.0/).
Copyright: This open access article is published under a Creative Commons CC BY 4.0 license, which permit the free download, distribution, and reuse, provided that the author and preprint are cited in any reuse.