
Submitted:
09 September 2026
Posted:
10 September 2026
You are already at the latest version
Abstract
The information technology (IT) sector is one of the fastest growing contributors to employment and export earnings in Pakistan, yet timely and detailed evidence on the skills and roles employers actually demand remains scarce. This study addresses that gap by analysing 3,734 IT job advertisements collected from LinkedIn for locations in Pakistan. The advertisements span 1,794 distinct job titles, 1,420 companies, and 49 cities. Postings were manually collected from publicly visible listings, cleaned, and classified into six IT domains and twenty-two subcategories, and were examined along the dimensions of occupational structure, geographic distribution, employer concentration, work arrangement, employment type, industry, and applicant competition. To compare competition across advertisements of differing ages, an exposure-adjusted measure of application intensity (applicants per posting-hour) was used. The results show that Software Development dominates advertised demand (75.76% of postings), while Artificial Intelligence and Data Science together form a substantial and highly contested second cluster (20.17%). Competition is strongly inverse to volume: specialised fields such as Computer Vision (9.18) and Data Science (8.93) attract far higher application intensity than high-volume categories such as Software Development (1.71). Hiring is geographically concentrated in Punjab, Sindh, and the Islamabad Capital Territory, and is dominated by a small number of large employers. Remote and full-time positions attract disproportionately high competition. The findings provide current, platform-specific evidence on the structure of Pakistan’s advertised IT labour market and demonstrate a transparent, reproducible framework for deriving labour-market intelligence from public job postings, while explicitly acknowledging the interpretive limits of single-platform vacancy data.
Keywords:
labour-market analysis
; online job postings
; data-driven workforce intelligence
I. Introduction
Information technology has become central to Pakistan’s economic strategy. It contributes a growing share of export earnings, anchors national digitalisation efforts, and offers one of the few large-scale avenues of skilled employment for a young and expanding workforce. As the sector matures, the value of the labour market increasingly depends less on the sheer number of available workers and more on whether their skills match what employers require. This makes reliable, current information about employer demand a matter of real economic consequence, and yet such information remains difficult to obtain in the Pakistani context.
Conventional instruments for measuring labour demand, including household surveys, employer surveys, administrative records, and official vacancy statistics, provide representative and carefully constructed evidence, but they share two limitations that are especially costly for technology occupations. They are usually published only after a substantial delay, and they describe demand at a level of aggregation that obscures the specific technologies, tools, and experience levels employers seek. In a field where the skills in demand can shift within a single year, evidence that is both slow to arrive and coarse in detail offers limited guidance to the people who must act on it: students choosing what to learn, universities designing curricula, firms planning recruitment, and public bodies allocating training resources.
Online job advertisements have gained international recognition as a way to narrow this gap. Because a posting states an employer’s requirements in its own words, it captures fine-grained signals about skills, seniority, location, and working arrangements, and it does so close to the moment demand is expressed [1,5]. A considerable literature has shown that large collections of postings can be used to measure skill requirements, trace the diffusion of emerging technologies, and reveal geographic and occupational patterns of hiring [2,3,9,10]. This same literature is careful about a boundary that is easy to overlook: data drawn from one platform describe the portion of the labour market advertised through that platform, not the labour market in its entirety, and the composition of what appears online varies across sectors, regions, and skill levels [1,6,7]. Platform-based findings are therefore most persuasive when the population under study is defined explicitly and conclusions are held within the limits of the observed data.
Research of this kind that focuses on Pakistan is still relatively sparse, and much of it has concentrated on a single occupation, such as web or software development, or on a single national job portal [14,16]. Comparatively little recent work examines the broader structure of the country’s IT vacancies across several technology domains, locations, experience levels, and employment arrangements at the same time, and fewer studies still consider how much applicant competition those vacancies attract. The present study is directed at this narrower and more defensible gap. It does not treat online postings as a census of all IT employment in Pakistan. Instead, it offers an updated, multidimensional description of the IT vacancies advertised on LinkedIn, a platform used widely by both domestic firms and internationally oriented employers.
Within this scope, the study analyses 3,734 IT job postings collected from LinkedIn in Pakistan. The analysis is organised around the dimensions that matter most for workforce planning: how vacancies are distributed across IT domains and specialisations, which occupational areas are requested most often, how postings are spread across cities and provinces, how far hiring is concentrated among a small set of employers, and how work arrangements, employment types, and industries are represented. To describe competition, the study adopts an exposure-adjusted measure of application intensity, expressed as applicants per posting-hour, which allows postings of different ages to be compared while acknowledging that publicly displayed applicant counts are an imperfect signal.
The study makes three contributions. First, it provides current, platform-specific evidence on the structure of Pakistan’s advertised IT labour market across dimensions that have not previously been examined together for this sector. Second, it sets out a transparent and reproducible procedure for turning publicly available postings into structured labour-market intelligence, with the limitations of the data stated plainly rather than left implicit. Third, it identifies structural features of the market, including regional disparity, employer concentration, and unusually high competition in emerging fields such as data science and artificial intelligence, that carry practical implications for job seekers, employers, educators, and policymakers. The remainder of the paper is organised as follows. Section II reviews the relevant literature and situates the study within it. Section III describes the data and methods. Section IV reports the results. Section V discusses their implications, Section VI states the limitations, and Section VII concludes.
II. Related Work
A. Online Job Advertisements as a Source of Labour-Market Information
The use of online vacancies to study labour demand has developed into an established field with a well-understood set of strengths and cautions. Kureková, Beblavý, and Thum-Thysen [1] provided an early and influential assessment of the approach, arguing that online postings offer rich and timely information about occupations, qualifications, and skills, while stressing that jobs advertised online do not represent all vacancies in an economy. Because recruitment practices differ across occupations, industries, and firms, they concluded that results derived from a given platform should be read as describing the labour market represented by that platform rather than the national labour market as a whole. This distinction has shaped responsible practice in the field ever since.
Subsequent studies established the analytical depth that large collections of postings can support. Deming and Kahn [2] used vacancy text for professional occupations to show that employers vary substantially in the cognitive, social, and managerial skills they demand, even within apparently similar roles, demonstrating that postings contain information unavailable from standard occupational classifications. Hershbein and Kahn [3] examined how employer skill requirements changed after the Great Recession and found lasting increases in required skills in markets that experienced sharper downturns. Modestino, Shoag, and Ballance [4] added an important caveat for interpretation by showing that advertised requirements are not fixed properties of occupations, since employers raise education and experience demands when workers are plentiful. An advertised requirement therefore reflects employer behaviour at a particular time and under particular conditions, a point that bears directly on how any single-period study should be read.
The relevance of vacancy data to technology occupations has been recognised at the policy level. The OECD [5] has used large-scale postings to track digital occupations and skills, noting that their granularity, frequency, and geographic detail make them well suited to identifying specific technologies. Methodological work has kept pace by insisting that scale is not the same as representativeness. Fabo and Kureková [6], in a review for the International Labour Organization, showed that online vacancy information is shaped by platform coverage, occupational composition, and changing patterns of platform use, and recommended defining the represented population clearly rather than generalising to the whole market. Napierala, Kvetan, and Branka [7] reached a similar conclusion when benchmarking online advertisements against European sources, finding that coverage is uneven and that high-skilled occupations and more industrialised regions tend to be overrepresented online. Together with the broader survey of data-science methods for job-market analysis by Rahhal, Kassou, and Ghogho [8], which catalogues persistent challenges such as heterogeneous job titles, duplicated advertisements, and incomplete attributes, this body of work motivates the transparent cleaning, classification, and sampling procedures adopted here.
B. Measuring Skill and Technology Demand from Postings
One of the most productive uses of vacancy data has been the measurement of changing technical demand, and the analysis of artificial-intelligence skills illustrates the point clearly. Alekseeva, Azar, Giné, Samila, and Taska [9] measured demand for AI skills in the United States between 2010 and 2019 and found rapid growth that extended well beyond conventional IT roles into engineering, science, finance, and management, together with a measurable wage premium for AI skills. Acemoglu, Autor, Hazell, and Restrepo [10] used large-scale vacancies to study the relationship between AI adoption and hiring, observing changes in the skill composition of recruitment at adopting establishments before such effects were visible in aggregate statistics. These studies show that postings can register technological transitions as they happen rather than in retrospect.
Methodological advances have widened the range of what can be extracted from unstructured vacancy text. Alibasic and colleagues [11] combined techniques including latent semantic indexing, latent Dirichlet allocation, and non-negative matrix factorisation to convert vacancy text into structured indicators of occupational and skill demand. More recent surveys of deep-learning approaches by Senger and colleagues [12] describe the growing use of transformer-based language models for skill extraction and classification, and emphasise the importance of consistent skill definitions and occupational taxonomies. Evidence continues to accumulate that postings support more than simple vacancy counts; Oleš [13], for example, related advertised skills to wages and automation exposure in Slovakia. For an analysis of Pakistan’s IT sector this literature is directly relevant, because broad labels such as “software developer” conceal meaningful differences between software engineering, data science, machine learning, cybersecurity, networking, and related specialisations. A more detailed categorisation of postings is needed to see what the market is genuinely seeking.
C. Evidence from Pakistan
Compared with the international literature, empirical work on Pakistan’s labour market using online vacancies remains limited in both quantity and scope. Bilal, Malik, Khalid, and Lali [14] conducted an early analysis of the country’s software industry using advertisements from Rozee.pk, examining demand for software roles, programming languages, and qualifications, and showing that online portals could yield useful information about employer demand in Pakistan. A broader study by Matsuda, Ahmed, and Nomura [15], carried out under the World Bank and also drawing on Rozee.pk, examined both demand and supply and found that although Pakistan has an excess supply of highly educated workers, certain industries, including information and communication technology, struggle to find workers with specialised skills and experience. Their finding that applicants whose qualifications closely match advertised requirements progress further in recruitment is particularly relevant here, since it indicates that the number of applicants alone does not reveal whether employers can obtain the combination of skills they need.
More focused and more recent work has continued in the same vein while widening the range of questions asked. Raza, Fatima, Nazir, and Amin [16] studied skill requirements for web developers in Pakistan using advertisements from Rozee.pk, Mustakbil, and Indeed, identifying demand for tools such as Git, WordPress, MVC, MySQL, and MongoDB, though the study was confined to web development. Khalil [17] took a different angle, combining job-advertisement analysis with a resume-audit experiment and interviews with human-resource professionals to examine gender and neighbourhood penalties in Karachi’s IT sector, and found that hiring outcomes differed by applicant gender and by residential socioeconomic signals. Collectively, these studies confirm the usefulness of online recruitment data for the Pakistani market, yet they also leave room for updated, descriptive evidence that spans a wider set of IT occupations, locations, and employment arrangements, and that considers the applicant interest attached to online IT vacancies.
D. Interpreting Applicant Competition
Most vacancy studies concentrate on the demand side, that is, on the number of postings and the skills they request, because applicant-side information is rarely available [6,15]. Where a platform publicly displays aggregate applicant counts, these can offer an additional signal of the interest or competition associated with a posting, but they require careful interpretation. A large number of applicants does not by itself imply a national shortage of vacancies, and a small number does not establish a skill shortage. Applicant volume is influenced by the age of the advertisement, the reputation and location of the employer, salary, remote-work availability, seniority, ease of applying, and the popularity of the occupation. Two postings open for different lengths of time cannot be compared directly using cumulative applicant counts without accounting for exposure time. For these reasons, the present study treats publicly displayed applicant information as an indicator of observed application intensity at the time of collection rather than as a direct measure of unemployment, labour-market tightness, or skill shortage, and it uses an exposure-adjusted measure, described in Section III, only as an exploratory normalisation that should not be extrapolated to predict the eventual number of applications a posting will receive.
III. Methodology
A. Data Source and Collection Approach
The study uses IT job postings that were publicly listed on LinkedIn for locations in Pakistan. LinkedIn was selected because it is among the most widely used professional recruitment platforms in the country and because it aggregates vacancies from both domestic firms and internationally oriented employers, which makes it well suited to a study of the IT sector specifically. Data were collected manually from publicly visible advertisements. Only publicly accessible, posting-level information was recorded. No personal or identifying information about individual applicants or profile holders was collected, and the study reports only aggregate, de-identified statistics. The empirical analysis is based on an analytical dataset containing 3,734 IT job advertisements associated with Pakistan and recorded from LinkedIn between 26 September and 26 November 2023.
B. Data Collection Procedure
Postings were located using LinkedIn’s job-search interface, filtered to information-technology roles situated in Pakistan. For each posting, a fixed set of fields was recorded: job title, hiring company, location at the level of city and province, work arrangement (on-site, remote, or hybrid), employment type (full-time, contract, part-time, internship, temporary, or not specified), industry, the number of applicants displayed, and the elapsed time since the posting was published. The records were compiled into a structured spreadsheet to allow consistent cleaning and analysis. After cleaning, a total of 3,734 postings formed the dataset used throughout this study. These advertisements corresponded to 1,794 distinct job titles, 1,420 companies, and 49 cities, indicating a highly varied advertising landscape in which job titles are far from standardised.
C. Data Cleaning and Categorisation
The raw dataset was cleaned to remove noise and ensure internal consistency. Duplicate postings were identified and removed on the basis of matching job title, company, and posting date. Records with missing values in a given field were flagged and excluded only from the specific sub-analysis in which that field was required, so that partial records still contributed to the analyses they could support. Job titles, company names, and location strings were normalised to standard forms in order to consolidate variant spellings and inconsistent formatting; for example, the many free-text variants of developer and engineer titles were mapped to a controlled set of subcategories. Postings were then classified into six primary IT domains and twenty-two subcategories according to job title and role description. The six domains were Software Development, Artificial Intelligence and Data Science, IT Support and IT Management, Cyber Security, Web 3.0/Blockchain/Metaverse, and Computer Networking. Each posting was additionally tagged by work arrangement, employment type, industry, city, and province so that the same records could be analysed along several dimensions.
D. Competition-Intensity Measure
To describe the level of hiring competition across roles, employers, and regions, an applicants-per-hour measure was defined as the total number of applicants for a posting divided by the number of hours that had elapsed since it was published. This normalisation was necessary because LinkedIn presents posting age dynamically and inconsistently across listings, so that raw applicant counts are not directly comparable between postings of different ages. Expressing applicant interest on a per-hour basis places postings on a common footing: a higher value indicates greater observed competition for a role and a lower value indicates less. Category-level competition figures reported below are the mean applicants-per-hour of the postings within each category.
Because per-hour rates computed from very small numbers of postings are unstable, competition figures for categories containing only a handful of postings are reported for completeness but are interpreted with caution and are not treated as directly comparable to high-volume categories. This caution applies, for example, to subcategories such as Natural Language Processing (2 postings) and Computer Vision (6 postings), and to the province of Baluchistan (11 postings) and Gilgit-Baltistan (1 posting), whose competition values are highly sensitive to individual advertisements. Consistent with the discussion in Section II-D, all competition values are treated as indicators of observed application intensity at the time of collection rather than as measures of labour-market tightness or skill shortage.
E. Analysis and Visualisation
The cleaned dataset was analysed to identify patterns in hiring volume, occupational structure, geographic distribution, employer concentration, work arrangement, employment type, industry, and competition intensity. Descriptive and comparative analyses were conducted and presented using an interactive business-intelligence dashboard, which supported exploration of the data across domains, subcategories, locations, employers, and working arrangements. All figures reported in Section IV were generated from this dataset. Throughout, two complementary views are presented for each dimension: the number of advertised postings (a demand-side view) and the mean applicants-per-hour (a competition view).
IV. Results
A. Occupational Structure of Advertised Demand
The 3,734 advertisements are highly concentrated at the domain level. As summarised in Table I and shown in Figure 1, Software Development accounts for 2,829 postings (75.76% of the dataset), followed by Artificial Intelligence and Data Science with 753 postings (20.17%). The remaining four domains together account for fewer than 4% of postings: IT Support and IT Management (87; 2.33%), Cyber Security (31; 0.83%), Web 3.0/Blockchain/Metaverse (18; 0.48%), and Computer Networking (16; 0.43%). The six domain counts sum exactly to the 3,734 postings in the dataset.
A central pattern, visible in Figure 1 and examined in detail below, is that the ordering of domains by competition is almost the reverse of their ordering by volume. Artificial Intelligence and Data Science, the second-largest domain by postings, records the highest domain-level competition (3.51 applicants per hour), followed by IT Support and IT Management (2.19). Software Development, despite representing more than three-quarters of all postings, records a comparatively moderate competition value of 1.35. In other words, the domain that offers the most opportunities is not the one where applicants compete most intensely for each advertisement.
Disaggregating the domains into twenty-two subcategories reveals the internal structure of demand (Figure 2). Within Software Development, the largest subcategories are the general Software Development role (997 postings), followed by Back-End Development (346), Mobile App Development (307), Web Development (247), Full-Stack Development (216), Front-End Development (173), Software Testing (173), Cloud Development (172), Game Development (110), and DevOps Development (80). Within Artificial Intelligence and Data Science, Data Analytics and Business Intelligence is the single largest subcategory (353 postings), ahead of Machine Learning/AI (152), Data Engineering (126), and Data Science (107). Several emerging or highly specialised subcategories are represented by very few advertisements, notably Desktop Development (8), Data Mining/Data Annotation (7), Computer Vision (6), and Natural Language Processing (2).
The competition view of the same subcategories (Figure 3) confirms and sharpens the inverse relationship. The two most contested subcategories are Computer Vision (9.18 applicants per hour) and Data Science (8.93), both of which have small posting volumes, followed by Data Analytics and Business Intelligence (3.97) and Natural Language Processing (3.84). At the other extreme, several high-volume Software Development subcategories record some of the lowest competition values, including Back-End Development (0.55), Full-Stack Development (0.84), and Cloud Development (0.85). Table II juxtaposes the highest-volume and highest-competition subcategories to make this contrast explicit.
B. Employer Concentration
Advertised demand is concentrated among a small number of large employers (Figure 4). Crossover posted by far the largest number of advertisements (506), followed by Turing (215) and Afiniti (74). Beyond these three, posting volumes fall sharply: HR Ways (39), Dubizzle Labs (35), Motive (31), Zones IT Solutions (31), Gelato (27), TCP Software (27), CureMD (26), and Teradata (26) each account for only a modest share. The presence of platform-oriented and internationally focused employers such as Crossover and Turing near the top is consistent with LinkedIn’s role as a channel for remote and globally distributed hiring.
The competition view again diverges from the volume view. The most contested employer by application intensity is Motive (32.34 applicants per hour) despite posting only 31 advertisements, followed by Zones IT Solutions (8.78). Crossover, the highest-volume employer, records a competition value of only 2.84, indicating that its large number of openings disperses applicant interest across many advertisements. This divergence illustrates why volume and competition must be interpreted together: a single high-profile advertisement from an employer with few openings can attract disproportionate attention, whereas an employer running a high-volume recruitment pipeline may face relatively low competition per posting.

Table III.
LEADING EMPLOYERS BY POSTING VOLUME AND BY COMPETITION.
| Employer | Postings | Employer | Competition (appl./h) |
|---|---|---|---|
| Crossover | 506 | Motive | 32.34 |
| Turing | 215 | Zones IT Solutions | 8.78 |
| Afiniti | 74 | GfK—An NIQ Company | 3.47 |
| HR Ways | 39 | TCP Software | 3.41 |
| Dubizzle Labs | 35 | Daraz | 3.12 |
| Motive | 31 | S&P Global | 2.97 |
| Zones IT Solutions | 31 | Crossover | 2.84 |
C. Geographic Distribution
Advertised IT employment is strongly concentrated in a small number of cities (Figure 5). Lahore leads with 1,198 postings, followed by Karachi (858) and Islamabad (720). A substantial group of 486 postings is advertised at the country level (“All Pakistan”), reflecting remote or nationally open roles. Beyond the three major cities, volumes fall steeply: Rawalpindi (187), Faisalabad (57), Peshawar (46), Multan (23), and Hyderabad (21), with all remaining cities accounting for smaller shares. This pattern mirrors the established concentration of Pakistan’s IT industry in its largest metropolitan centres.
At the provincial level (Figure 6), Punjab dominates with 1,546 postings, followed by Sindh (884) and the Islamabad Capital Territory (715). The “All Pakistan” category again accounts for 486 postings. Khyber Pakhtunkhwa (54), Baluchistan (11), and Gilgit-Baltistan (1) together represent a very small fraction of advertised demand, underscoring a pronounced regional imbalance in where advertised IT opportunities are located.
The competition view of geography is shaped strongly by small sample sizes and must be read with care. Among cities, Hyderabad records the highest competition (4.23 applicants per hour) despite only 21 postings, and the country-level “All Pakistan” category records 3.51. The three largest markets by volume record markedly lower competition per posting: Islamabad (1.62), Karachi (1.25), and Lahore (1.08). Among provinces, Baluchistan shows the highest competition value (5.71), but this figure rests on only 11 postings and should not be compared directly with the high-volume provinces; Punjab, which dominates by volume, records a competition value of just 1.09. The pattern is consistent with the general finding that competition per advertisement is highest where advertised opportunities are scarce.
Table IV.
ADVERTISED POSTINGS AND COMPETITION BY PROVINCE/REGION.
| Province / Region | Postings | Competition (appl./h) |
|---|---|---|
| Punjab | 1,546 | 1.09 |
| Sindh | 884 | 1.32 |
| Islamabad Capital Territory | 715 | 1.62 |
| All Pakistan (nationwide) | 486 | 3.51 |
| Khyber Pakhtunkhwa | 54 | 0.30 |
| Baluchistan | 11 | 5.71 |
| Gilgit-Baltistan | 1 | 0.20 |
Note: The competition value for Baluchistan rests on only 11 postings and for Gilgit-Baltistan on a single posting; these are reported for completeness but are not comparable to the high-volume provinces.
D. Work Arrangement and Employment Type
On-site work remains the most common arrangement among advertised IT roles, with 2,184 postings, followed by remote (1,179), hybrid (273), and a small “not specified” group (98), as shown in Figure 7. The competition view inverts this ordering: remote positions attract the highest application intensity (3.58 applicants per hour), followed by the “not specified” group (2.63), while hybrid (1.08) and on-site (0.88) roles attract markedly less competition per posting. The strong preference of applicants for remote work, relative to its share of advertised supply, is one of the clearest behavioural signals in the dataset and is consistent with LinkedIn’s prominence as a channel for remote and cross-border hiring.
Employment type is dominated overwhelmingly by full-time roles (3,577 postings), with all other types marginal: contract (88), part-time (35), internship (31), not specified (2), and temporary (1), as shown in Figure 8. Competition is likewise highest for full-time roles (1.83 applicants per hour), followed by contract (1.15), part-time (0.69), and internship (0.56). The scarcity of advertised internships is notable given the volume of entry-level interest implied elsewhere in the data, and is discussed further in Section V.
Table V.
WORK ARRANGEMENT AND EMPLOYMENT TYPE.
| Category | Postings | Competition | Dimension |
|---|---|---|---|
| On-site | 2,184 | 0.88 | Work arrangement |
| Remote | 1,179 | 3.58 | Work arrangement |
| Hybrid | 273 | 1.08 | Work arrangement |
| Not specified | 98 | 2.63 | Work arrangement |
| Full-time | 3,577 | 1.83 | Employment type |
| Contract | 88 | 1.15 | Employment type |
| Part-time | 35 | 0.69 | Employment type |
| Internship | 31 | 0.56 | Employment type |
E. Industry Distribution
When advertised postings are grouped by the hiring organisation’s industry (Figure 9), the largest single group is “not specified” (1,802 postings), which reflects the frequent absence of a declared industry on LinkedIn listings and is itself a data-quality observation worth noting. Among postings with a declared industry, IT Services and IT Consulting dominate (1,072), followed by Software Development (307), Financial Services (69), and Telecommunications (58). The competition view is led by a set of comparatively small industries, including Staffing and Recruiting (19.07 applicants per hour), Strategic Management Services (12.09), and Advertising Services (11.85), whose high values again coincide with small posting volumes and should be read accordingly.
F. Vacancy Volume and Application Intensity
Visual inspection of selected categories can create the impression that scarce occupations systematically attract more applicants. The full set of 22 subcategories does not support that generalisation. The Pearson correlation between subcategory posting volume and mean APH is r = -0.114, p = 0.614, while the Spearman rank correlation is rho = -0.054, p = 0.813. Both estimates are close to zero and statistically non significant. Application intensity therefore does not exhibit a consistent inverse relationship with vacancy volume across the occupational taxonomy.
Figure 10.
Relationship between subcategory vacancy volume and mean application intensity. Posting volume is shown on a logarithmic scale.
Figure 10.
Relationship between subcategory vacancy volume and mean application intensity. Posting volume is shown on a logarithmic scale.
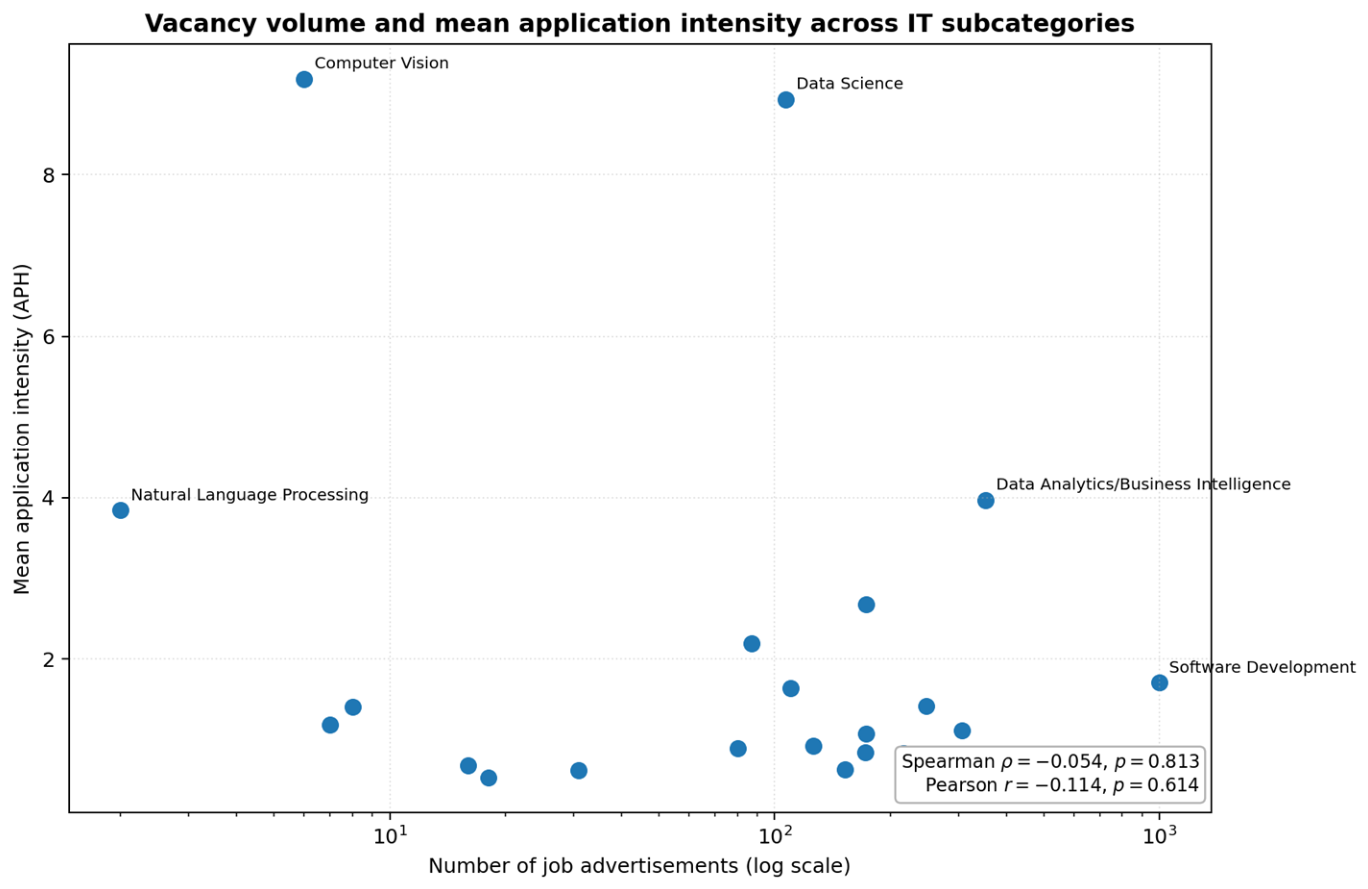
The more defensible interpretation is that volume and application intensity capture different aspects of the observed market. Some lower volume categories, such as Data Science, exhibit high APH, while other low volume categories, such as Cyber Security and Web3/Blockchain/Metaverse, do not. Conversely, some high volume categories exhibit moderate or low APH. The relationship therefore appears heterogeneous rather than systematically inverse.
V. Discussion
A. A Market Concentrated in Software, with a Contested AI Frontier
The clearest structural feature of the advertised market is its concentration: more than three-quarters of all postings fall within Software Development, and together with Artificial Intelligence and Data Science the two leading domains account for almost 96% of advertised demand. This confirms, on a current LinkedIn dataset, the long-standing observation that Pakistan’s formal IT hiring is built primarily on software services. At the same time, the prominence of Artificial Intelligence and Data Science, both in volume (753 postings) and in competition (3.51 applicants per hour), indicates an active and rapidly contested frontier. The high competition attached to specialised data roles such as Data Science (8.93) and Computer Vision (9.18), even where posting counts are small, is consistent with international evidence that demand for AI-related skills has grown faster than the supply of workers who can credibly claim them [9,10].
B. The Inverse Relationship Between Volume and Competition
A recurring pattern across almost every dimension of the analysis is that the ranking of categories by competition is close to the reverse of their ranking by volume. This holds across domains, subcategories, employers, cities, provinces, and work arrangements. Two complementary mechanisms plausibly explain it. First, where an employer or field advertises many openings, applicant interest is spread across those openings, lowering competition per advertisement; Crossover, with 506 postings and a competition value of 2.84, is the clearest example, in contrast to Motive, whose 31 postings attract 32.34 applicants per hour. Second, scarcity itself concentrates attention: a small number of advertisements in a desirable but thinly advertised field, such as data science or remote work, draws applicants from a much larger pool. For job seekers, this means that the fields with the most openings are not necessarily the hardest to enter, and the reverse is also true. For employers, it suggests that a small, well-targeted set of advertisements in a scarce field may generate more applicant interest than a large campaign in a crowded one.
C. Regional Imbalance and the Role of Remote Work
The geographic findings document a pronounced imbalance. Punjab, Sindh, and the Islamabad Capital Territory together account for the overwhelming majority of advertised postings, while Khyber Pakhtunkhwa, Baluchistan, and Gilgit-Baltistan are almost absent from the advertised market. This concentration has implications for regional development and for graduates outside the major urban centres, who may find few locally advertised opportunities. Against this backdrop, the strong applicant preference for remote work is significant: although on-site roles remain the most numerous, remote postings attract by far the highest competition (3.58 applicants per hour). Remote and nationally open (“All Pakistan”) postings may therefore offer an important, if contested, route by which applicants outside the main hubs can access opportunities that are otherwise geographically concentrated.
D. Entry-Level Access and the Scarcity of Internships
The dataset also highlights a tension around entry-level access. Full-time roles dominate advertised employment (3,577 of 3,734 postings), while internships are almost negligible (31 postings). For a country with a large annual output of computing and IT graduates, the scarcity of advertised internships and other explicit entry routes on this platform is striking, and it points to a possible structural gap between the supply of new graduates and the advertised opportunities designed to absorb them. While the present dataset cannot by itself quantify the graduate supply side, the combination of high competition in desirable fields, dominance of full-time roles, and near-absence of internships is consistent with an environment in which new entrants face significant competition for a limited set of clearly advertised entry points. This is an area where the platform-based demand-side evidence assembled here would benefit from being combined with supply-side data in future work.
E. Practical Implications
Several practical implications follow. For students and job seekers, the evidence suggests that broad software-development skills open the largest number of doors, while specialised data and AI skills, though highly contested, command evident demand and may reward candidates who can genuinely demonstrate them. For universities and training providers, the detailed subcategory demand offers a basis for aligning curricula with the roles employers actually advertise, particularly in back-end, mobile, cloud, and data-oriented specialisations. For employers, the volume-competition divergence offers guidance on how advertising strategy shapes applicant interest. For policymakers, the regional imbalance and the prominence of remote work together suggest that policies supporting remote and distributed work could help extend the reach of a geographically concentrated industry.
VI. Limitations
Several limitations should be borne in mind when interpreting these results, and they follow directly from the nature of the data. First, the study is based on a single platform. As the methodological literature emphasises [1,6,7], advertisements on LinkedIn represent the segment of the IT labour market that is advertised through LinkedIn, not the entire national labour market; roles filled through other portals, company websites, personal networks, or offline channels are not captured, and LinkedIn may over-represent internationally oriented and remote-friendly employers. The findings should therefore be read as describing the advertised, platform-specific market rather than a census of IT employment in Pakistan.
Second, the applicant-competition measure is exploratory. It normalises applicant counts by exposure time to allow comparison across advertisements of different ages, but publicly displayed applicant counts are themselves an imperfect signal influenced by many factors unrelated to genuine competition, as discussed in Section II-D, and the measure should not be extrapolated to predict the eventual number of applications a posting will receive. Third, competition values for categories with very few postings, including several data subcategories and the smaller provinces, are statistically fragile and are reported for completeness rather than for direct comparison. Fourth, the sizeable “not specified” groups for industry and, to a lesser extent, work arrangement reflect missing information in the underlying listings and limit the precision of those particular breakdowns. Finally, the analysis is descriptive and cross-sectional; it captures a snapshot of advertised demand and does not track change over time or establish causal relationships. These limitations point naturally to the future work outlined below.
VII. Conclusions and Future Work
This study has provided a current, multidimensional description of Pakistan’s advertised information-technology labour market, based on 3,734 IT job postings collected from LinkedIn across 1,794 job titles, 1,420 companies, and 49 cities. The analysis shows a market heavily concentrated in Software Development, with a substantial and highly contested Artificial Intelligence and Data Science cluster, a pronounced geographic concentration in Punjab, Sindh, and the Islamabad Capital Territory, and a hiring landscape dominated by a small number of large employers. A consistent finding across dimensions is the inverse relationship between the number of advertised opportunities and the intensity of applicant competition, together with a strong applicant preference for remote work. Beyond these substantive findings, the study demonstrates a transparent and reproducible framework for turning publicly available job postings into structured labour-market intelligence, with the limitations of single-platform vacancy data stated explicitly.
Future work can extend this analysis in several directions. Combining LinkedIn data with other job portals such as Rozee.pk and Mustakbil would improve coverage and allow cross-platform validation. Extending the collection over time would turn the present snapshot into a longitudinal series capable of tracking how demand for specific skills evolves. Integrating supply-side information, such as graduate output by field and region, would allow a direct assessment of the balance between the supply of new entrants and advertised opportunities, particularly at the entry level. Finally, applying automated skill-extraction and classification techniques to the full text of advertisements [11,12] would enable a finer-grained analysis of the specific tools and competencies employers demand, moving from occupational categories toward the underlying skills that drive them.
References
- L. M. Kureková, M. Beblavý, and A. Thum-Thysen, “Using online vacancies and web surveys to analyse the labour market: a methodological inquiry,” IZA J. Labor Econ., vol. 4, art. no. 18, pp. 1–20, 2015. [CrossRef]
- D. Deming and L. B. Kahn, “Skill requirements across firms and labor markets: Evidence from job postings for professionals,” J. Labor Econ., vol. 36, no. S1, pp. S337–S369, 2018. [CrossRef]
- B. Hershbein and L. B. Kahn, “Do recessions accelerate routine-biased technological change? Evidence from vacancy postings,” Amer. Econ. Rev., vol. 108, no. 7, pp. 1737–1772, 2018. [CrossRef]
- A. S. Modestino, D. Shoag, and J. Ballance, “Upskilling: Do employers demand greater skill when workers are plentiful?” Rev. Econ. Statist., vol. 102, no. 4, pp. 793–805, 2020. [CrossRef]
- OECD, Skills for the Digital Transition: Assessing Recent Trends Using Big Data. Paris, France: OECD Publishing, 2022. [CrossRef]
- B. Fabo and L. M. Kureková, Methodological Issues Related to the Use of Online Labour Market Data, ILO Working Paper 68. Geneva, Switzerland: International Labour Organization, 2022. [CrossRef]
- J. Napierala, V. Kvetan, and J. Branka, Assessing the Representativeness of Online Job Advertisements, Cedefop Working Paper No. 17. Luxembourg: Publications Office of the European Union, 2022. [CrossRef]
- I. Rahhal, I. Kassou, and M. Ghogho, “Data science for job market analysis: A survey on applications and techniques,” Expert Syst. Appl., vol. 251, art. no. 124101, 2024. [CrossRef]
- L. Alekseeva, J. Azar, M. Giné, S. Samila, and B. Taska, “The demand for AI skills in the labor market,” Labour Econ., vol. 71, art. no. 102002, 2021. [CrossRef]
- D. Acemoglu, D. Autor, J. Hazell, and P. Restrepo, “Artificial intelligence and jobs: Evidence from online vacancies,” J. Labor Econ., vol. 40, no. S1, pp. S293–S340, 2022. [CrossRef]
- A. Alibasic, H. Upadhyay, M. C. E. Simsekler, T. Kurfess, W. L. Woon, and M. A. Omar, “Evaluation of the trends in jobs and skill-sets using data analytics: a case study,” J. Big Data, vol. 9, art. no. 32, 2022. [CrossRef]
- E. Senger, M. Zhang, R. van der Goot, and B. Plank, “Deep learning-based computational job market analysis: A survey on skill extraction and classification from job postings,” in Proc. 1st Workshop Natural Lang. Process. Human Resources (NLP4HR), St. Julian’s, Malta, 2024, pp. 1–15. [CrossRef]
- T. Oleš, “In-demand skills: a shield against automation—evidence from online job vacancies,” J. Labour Market Res., vol. 60, art. no. 5, 2026. [CrossRef]
- M. Bilal, N. Malik, M. Khalid, and M. I. U. Lali, “Exploring industrial demand trends in Pakistan software industry using online job portal data,” Univ. Sindh J. Inf. Commun. Technol., vol. 1, no. 1, pp. 17–24, 2017.
- N. Matsuda, T. Ahmed, and S. Nomura, Labor Market Analysis Using Big Data: The Case of a Pakistani Online Job Portal, World Bank Policy Res. Working Paper No. 9063. Washington, DC, USA: World Bank, 2019. [CrossRef]
- B. Raza, N. Fatima, S. Nazir, and B. Amin, “Skills set required for web developers in Pakistan,” Pakistan J. Eng. Technol., vol. 6, no. 1, pp. 86–91, 2023. [CrossRef]
- S. Khalil, “Gender and neighborhood penalties in Karachi’s information technology sector,” J. Behav. Exp. Econ., vol. 119, art. no. 102469, 2025. [CrossRef]
Figure 1.
Overview of the dataset: headline counts, distribution of postings across the six IT domains, and domain-level applicant competition.
Figure 1.
Overview of the dataset: headline counts, distribution of postings across the six IT domains, and domain-level applicant competition.
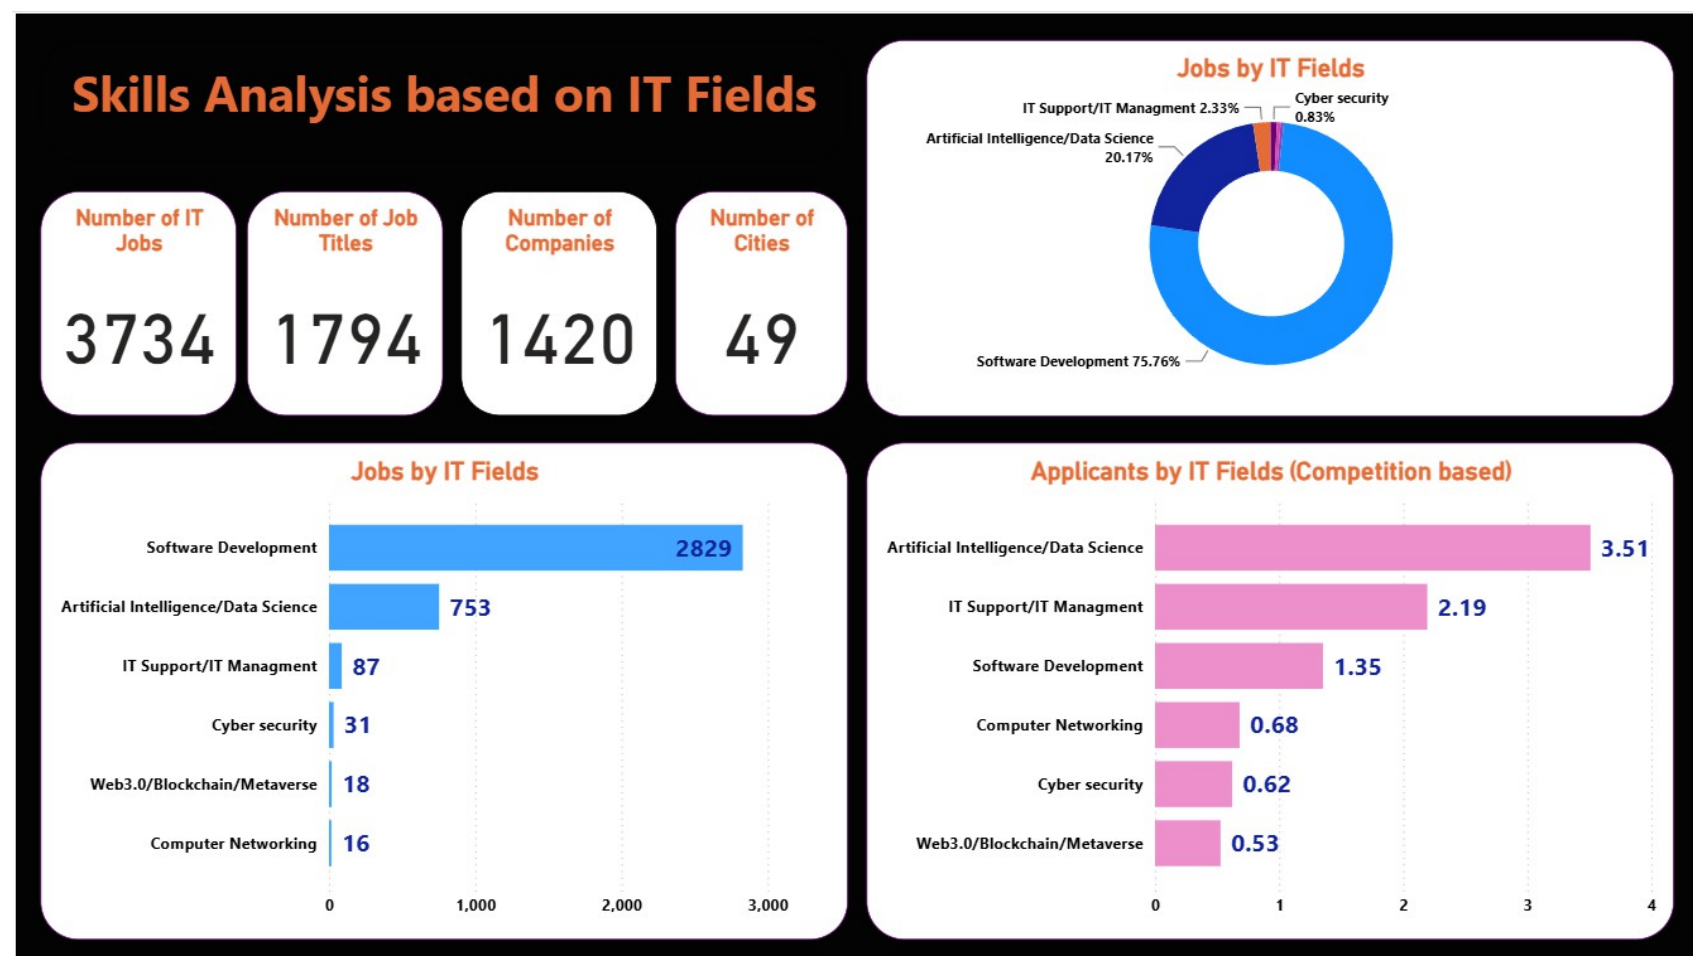
Figure 2.
Number of advertised postings across the twenty-two IT subcategories.
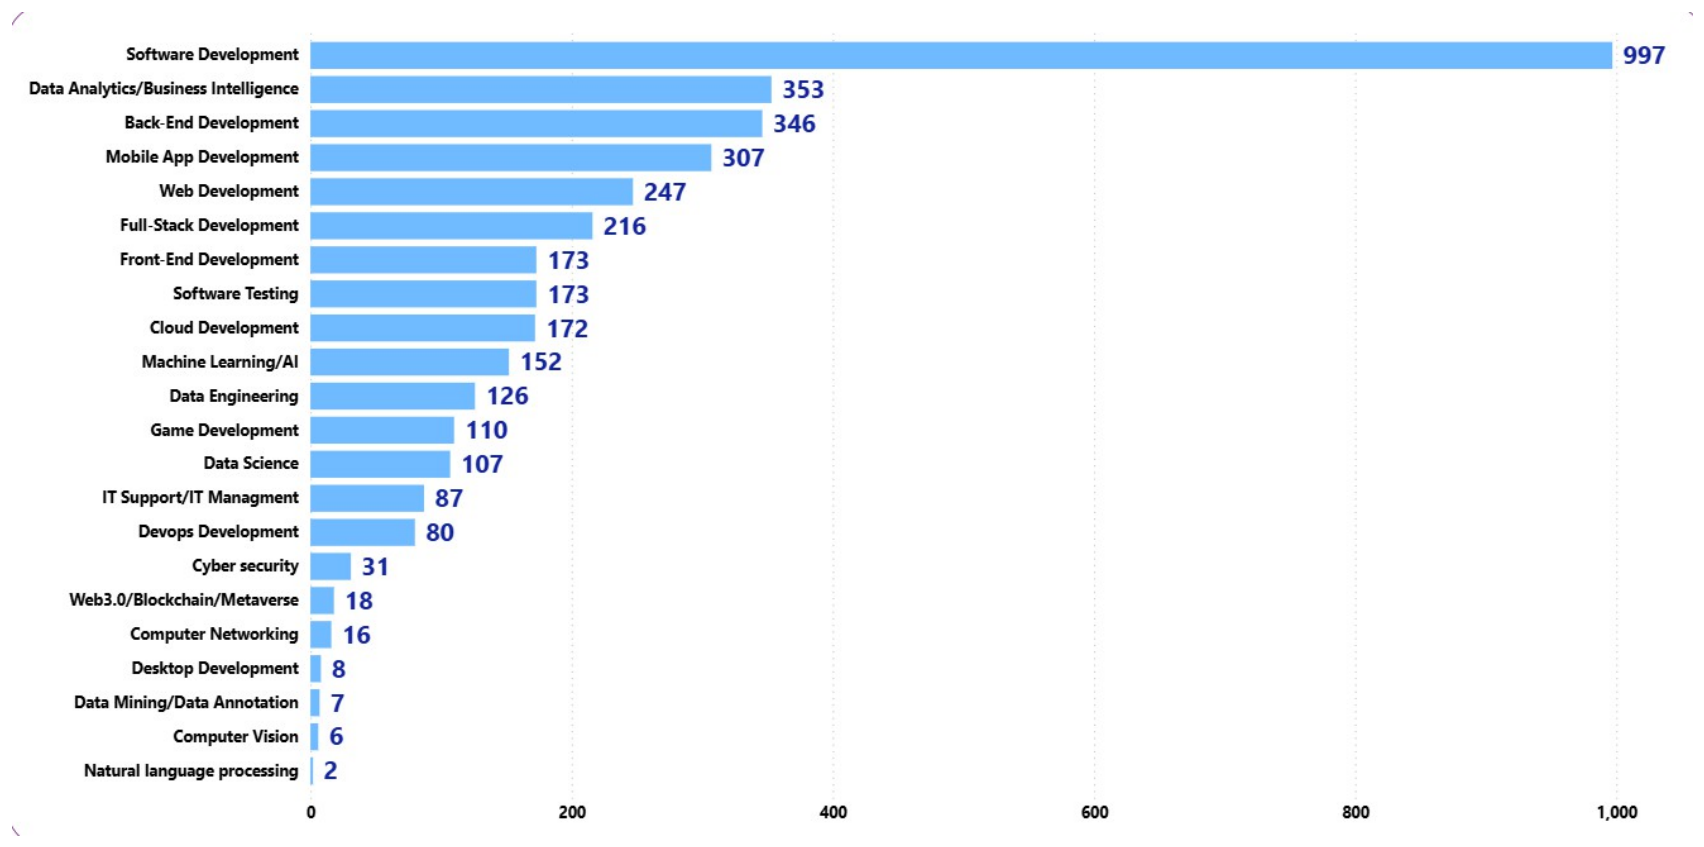
Figure 3.
Applicant competition (mean applicants-per-hour) across the twenty-two IT subcategories.
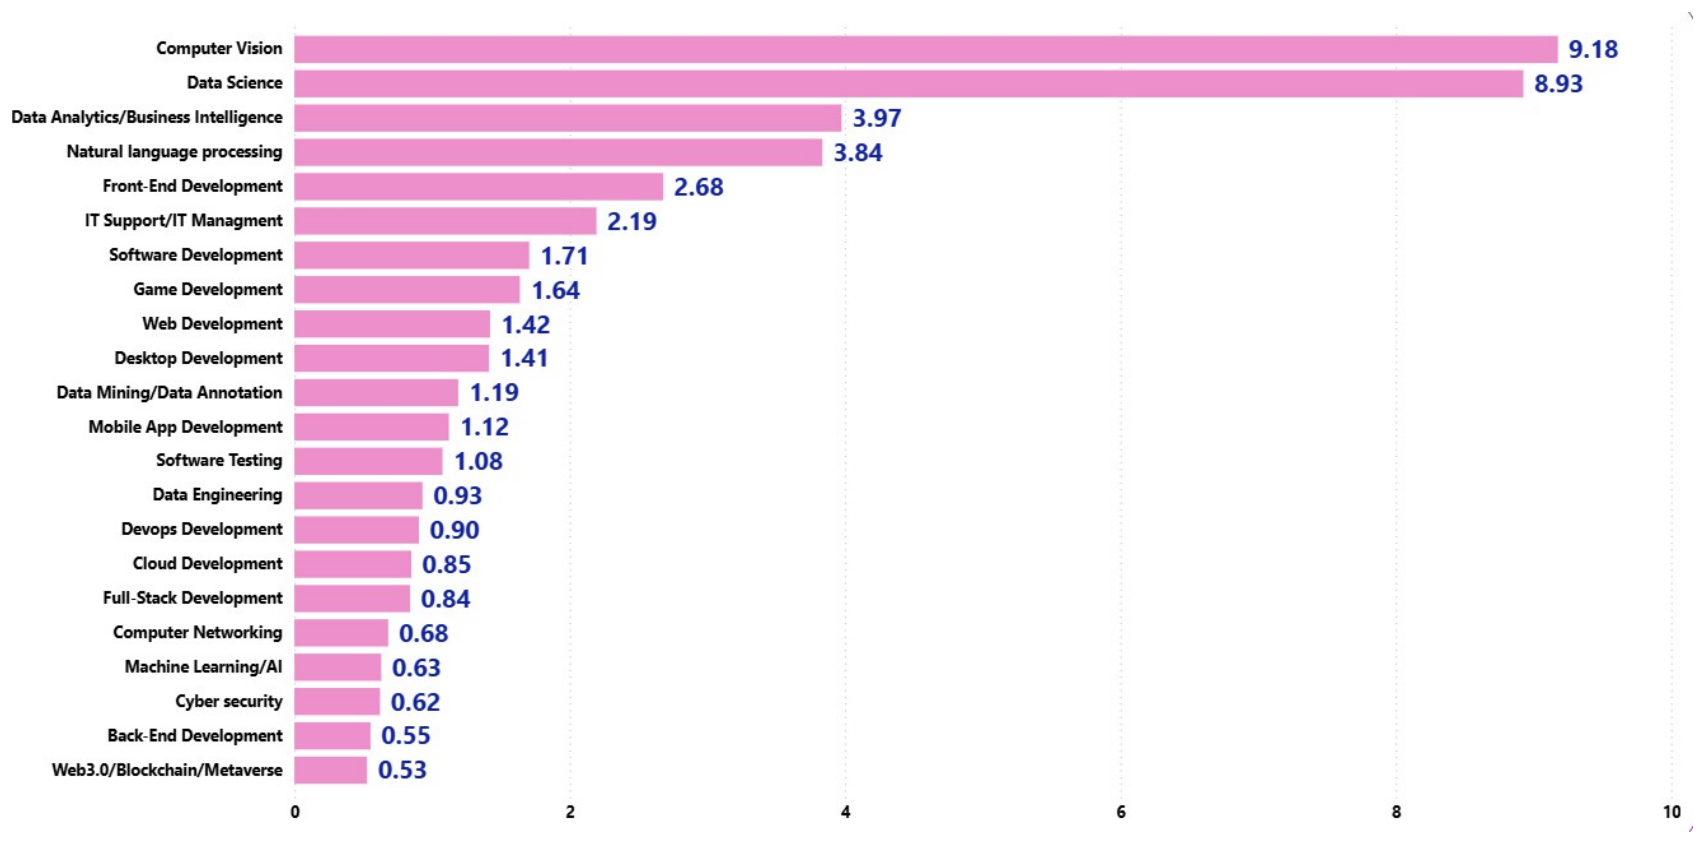
Figure 4.
Advertised postings by company (left) and applicant competition for the leading companies (right).
Figure 4.
Advertised postings by company (left) and applicant competition for the leading companies (right).
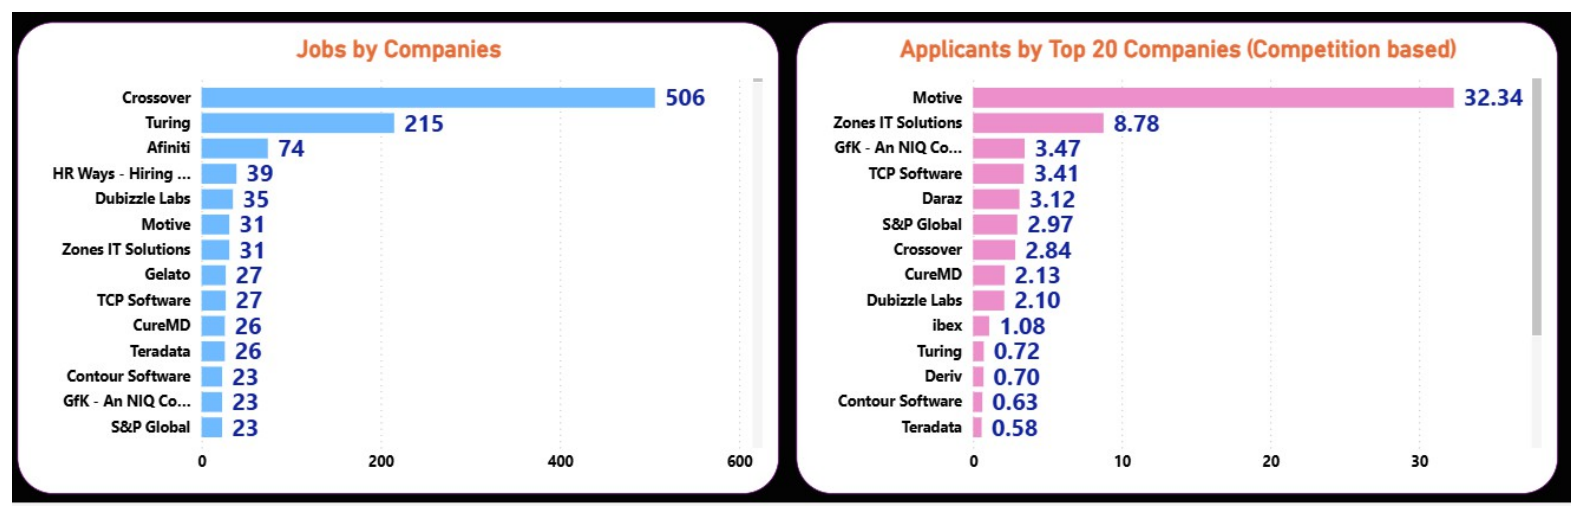
Figure 5.
Advertised postings by city (left) and applicant competition for the leading cities (right).
Figure 5.
Advertised postings by city (left) and applicant competition for the leading cities (right).
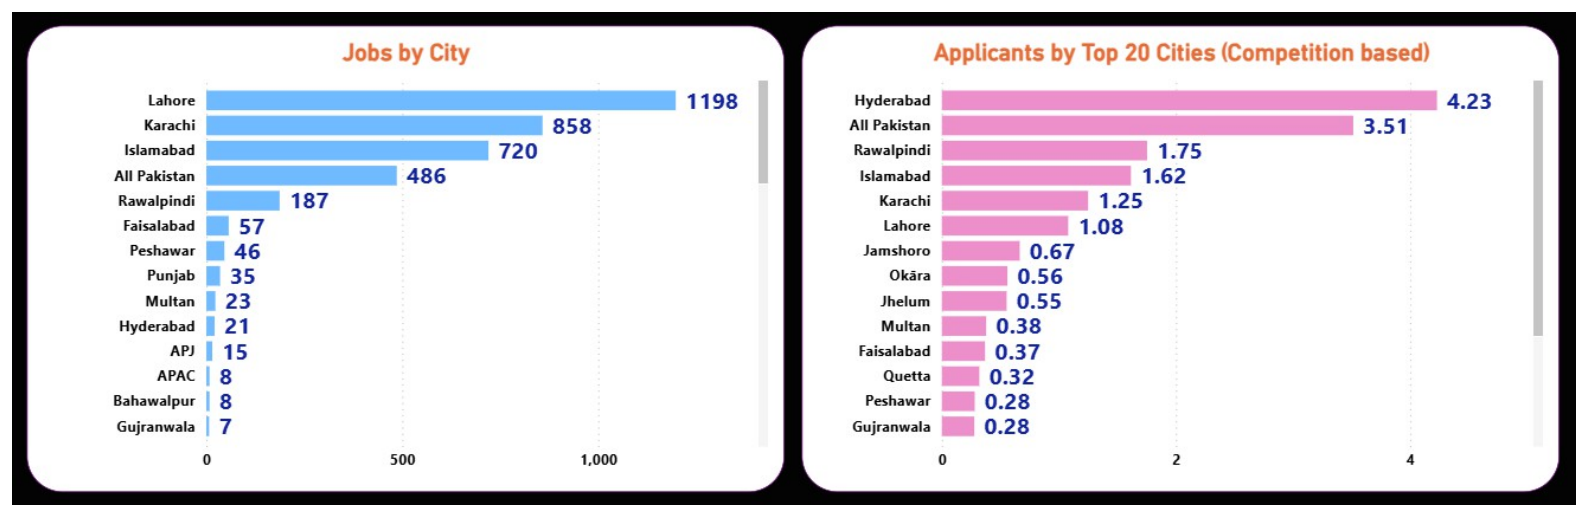
Figure 6.
Advertised postings by province/region (left) and applicant competition by province/region (right).
Figure 6.
Advertised postings by province/region (left) and applicant competition by province/region (right).
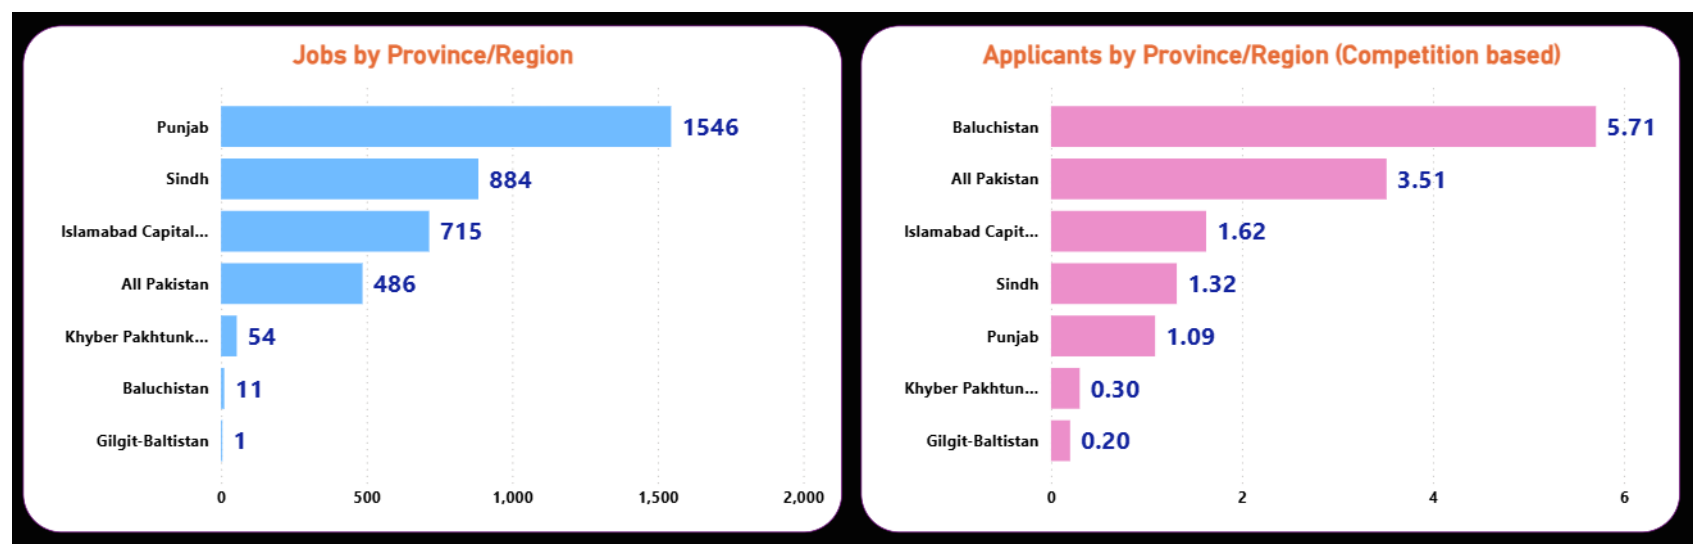
Figure 7.
Advertised postings by work arrangement (left) and applicant competition by work arrangement (right).
Figure 7.
Advertised postings by work arrangement (left) and applicant competition by work arrangement (right).
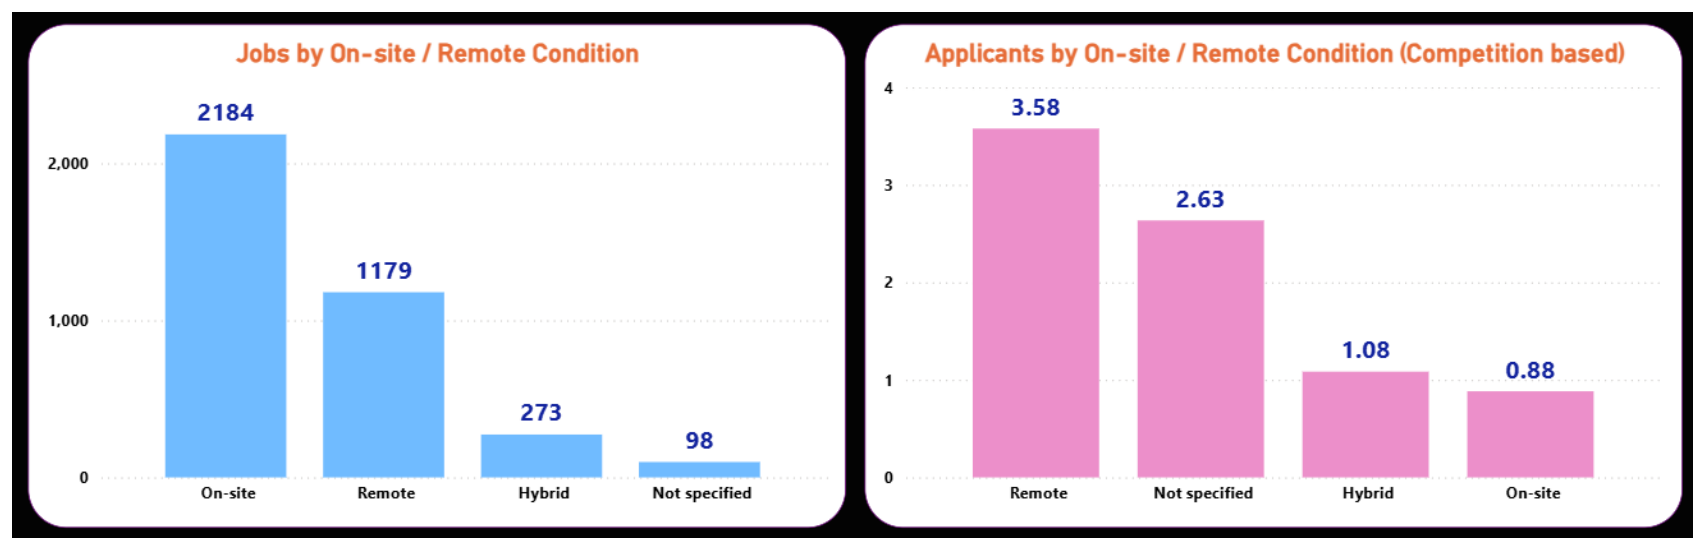
Figure 8.
Advertised postings by employment type (left) and applicant competition by employment type (right).
Figure 8.
Advertised postings by employment type (left) and applicant competition by employment type (right).
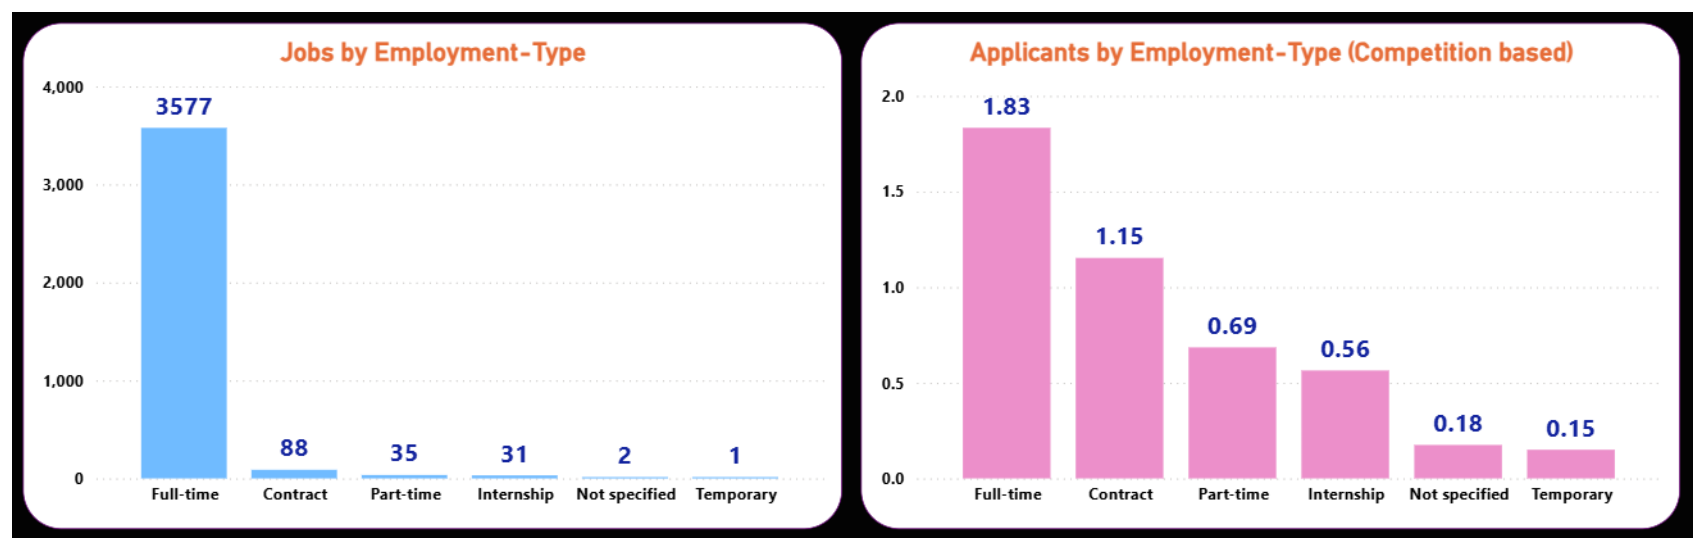
Figure 9.
Advertised postings by hiring-organisation industry (left) and applicant competition by industry (right).
Figure 9.
Advertised postings by hiring-organisation industry (left) and applicant competition by industry (right).
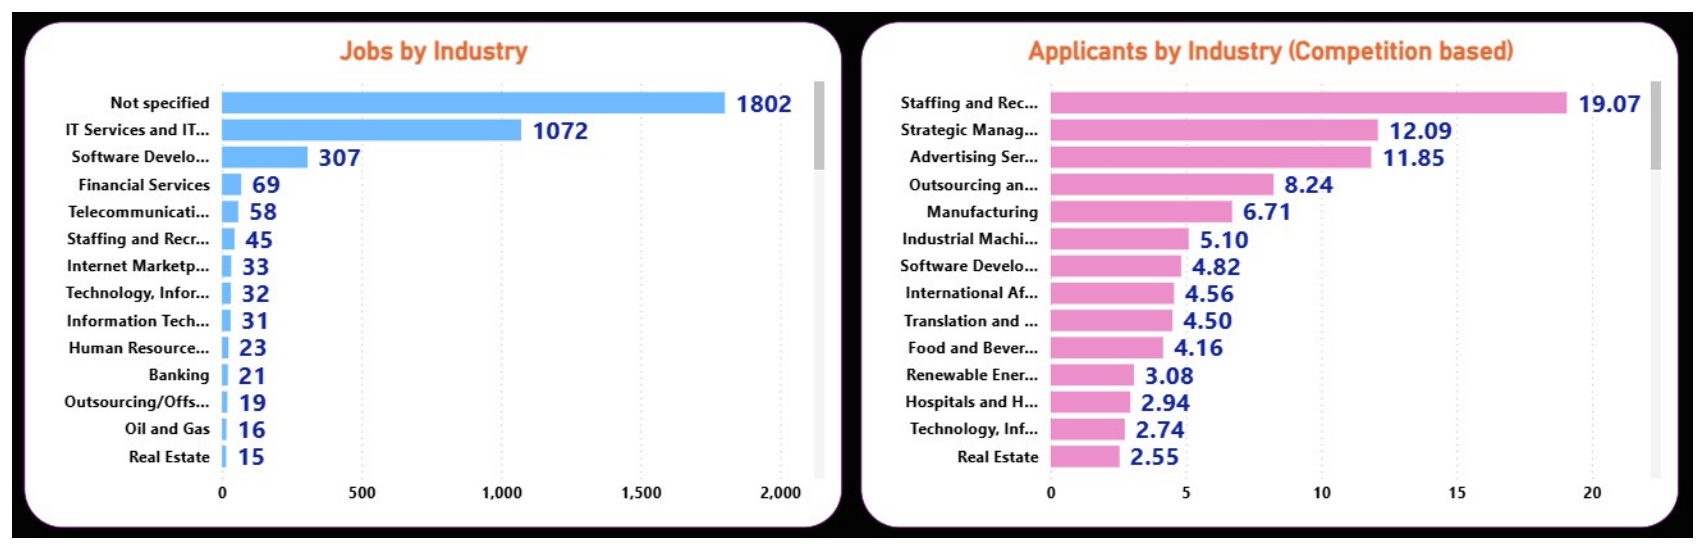
Table I.
ADVERTISED IT POSTINGS AND COMPETITION BY DOMAIN.
| IT Domain | Postings | Share (%) | Competition (appl./h) |
|---|---|---|---|
| Software Development | 2,829 | 75.76 | 1.35 |
| Artificial Intelligence / Data Science | 753 | 20.17 | 3.51 |
| IT Support / IT Management | 87 | 2.33 | 2.19 |
| Cyber Security | 31 | 0.83 | 0.62 |
| Web 3.0 / Blockchain / Metaverse | 18 | 0.48 | 0.53 |
| Computer Networking | 16 | 0.43 | 0.68 |
| Total | 3,734 | 100.00 | — |
Table II.
HIGHEST-VOLUME VS. HIGHEST-COMPETITION SUBCATEGORIES.
| Rank | By Volume (postings) | By Competition (appl./h) |
|---|---|---|
| 1 | Software Development (997) | Computer Vision (9.18) |
| 2 | Data Analytics / BI (353) | Data Science (8.93) |
| 3 | Back-End Development (346) | Data Analytics / BI (3.97) |
| 4 | Mobile App Development (307) | Natural Language Processing (3.84) |
| 5 | Web Development (247) | Front-End Development (2.68) |
Disclaimer/Publisher’s Note: The statements, opinions and data contained in all publications are solely those of the individual author(s) and contributor(s) and not of MDPI and/or the editor(s). MDPI and/or the editor(s) disclaim responsibility for any injury to people or property resulting from any ideas, methods, instructions or products referred to in the content. |
© 2026 by the authors. Licensee MDPI, Basel, Switzerland. This article is an open access article distributed under the terms and conditions of the Creative Commons Attribution (CC BY) license (http://creativecommons.org/licenses/by/4.0/).
Copyright: This open access article is published under a Creative Commons CC BY 4.0 license, which permit the free download, distribution, and reuse, provided that the author and preprint are cited in any reuse.