

Submitted:
02 September 2026
Posted:
03 September 2026
You are already at the latest version
Abstract
Bladder cancer surveillance remains challenging due to the limited sensitivity of con-ventional diagnostic methods for detecting biologically aggressive disease, particularly in low-grade urothelial carcinomas (LGUC). This study evaluated the diagnostic per-formance and biological significance of the urinary DNA methylation assay Bladder EpiCheck™ in patients undergoing histopathological evaluation for suspected urothe-lial carcinoma. A retrospective cohort of 134 patients with paired histopathology, urine cytology and Bladder EpiCheck™ results was analyzed. Bladder EpiCheck™ showed excellent performance for high-grade urothelial carcinoma (HGUC) detection, with 91.5% sensitivity, 81.6% specificity and an AUC of 0.876. Methylation scores in-creased with tumor grade and identified two molecular subgroups within LGUC. Methylation-positive LGUCs displayed HGUC-like epigenetic profiles, increased pro-liferation, more frequent MTAP loss and higher recurrence/progression risk, whereas methylation-negative LGUCs resembled benign urothelium and had more favorable outcomes. These findings indicate that urinary DNA methylation provides clinically relevant biological information beyond histological grading and may improve LGUC risk stratification and personalized surveillance.
Keywords:
bladder cancer
; low-grade urothelial carcinoma
; DNA methylation
; liquid biopsy
; epigenetics
; tumor heterogeneity
; digital pathology
; MTAP
; Ki67
1. Introduction
Bladder cancer (BCa) represents a substantial and enduring global health burden. As one of the ten most frequently diagnosed malignancies worldwide, its incidence exhibits considerable geographic variation and continues to rise in parallel with population aging [1,2]. A persistent and pronounced sex disparity is evident, with men experiencing approximately a fourfold higher incidence than women [2,3]. Beyond its epidemiological footprint, BCa is defined by marked biological heterogeneity and a strong propensity for recurrence and progression, making refined risk stratification and sustained surveillance central to contemporary disease management [2,3].
Urothelial carcinoma (UCa) accounts for 90–95% of all BCa cases and encompasses a clinical spectrum ranging from non–muscle-invasive bladder cancer (NMIBC) to muscle-invasive bladder cancer (MIBC) [3,4]. At initial diagnosis, nearly three-quarters of tumors are NMIBC [2,3]. While many of these lesions follow an indolent course, high-risk NMIBC carries a meaningful probability of progression, thereby necessitating stringent follow-up [2]. In contrast, MIBC typically demonstrates aggressive biological behavior and is associated with inferior survival outcomes, requiring accurate staging and timely multimodal management [3,6].
Cystoscopy in combination with urine cytology remains the cornerstone for diagnosis and surveillance [2,3]. Nevertheless, cystoscopy is invasive and costly, whereas urine cytology, despite excellent specificity for high-grade disease, shows limited sensitivity, particularly for low-grade tumors [2,4]. Although advanced imaging modalities, including multiparametric MRI interpreted through the VI-RADS system, have improved the accuracy and reproducibility of non-invasive local staging, histopathological confirmation continues to be mandatory [5,6].
Against this backdrop, liquid biopsy has emerged as a minimally invasive tool enabling real-time assessment of tumor-derived biomarkers [4]. DNA methylation-based assays offer strong biological rationale owing to the early, stable and widespread nature of epigenetic alterations during carcinogenesis [4,10]. Bladder EpiCheck™ is a quantitative urine-based test analyzing 15 methylation markers [7,8]. It has demonstrated high diagnostic performance for detecting high-grade NMIBC recurrence and has received FDA 510(k) clearance for use in NMIBC surveillance alongside cystoscopy [7,8,9]. Notably, the test has shown the capacity to identify high-grade recurrences missed by white-light cystoscopy and to provide anticipatory molecular signals that may enhance clinical decision-making [9,10,11].
This study is aimed to determine the diagnostic accuracy of Bladder EpiCheck™ in a real-world cohort undergoing surveillance following transurethral resection of 75 bladder tumor (TURBT). We compared its performance with urine cytology and evaluated its ability to identify biologically aggressive disease beyond conventional histopathological grading. In addition, we assessed the clinical implications of discordant test results and explored whether urinary DNA methylation profiling could improve risk stratification and facilitate more personalized surveillance approaches for patients with urothelial carcinoma [2,9,10].
2. Results
2.1. Clinical Findings
The final analysis included 134 patients with paired histopathological evaluation, urine cytology, and Bladder EpiCheck™ results. The study cohort was predominantly male, with men accounting for 94.7% (36/38) of patients with negative histopathology, 83.8% (31/37) of those with low-grade urothelial carcinoma (LGUC), and 81.3% (48/59) of those with high-grade urothelial carcinoma (HGUC) (Table 1).
Sex distribution did not differ significantly among diagnostic groups. In contrast, age varied significantly across groups, with patients diagnosed with HGUC being older than those with negative findings or LGUC lesions (Table 1).
Urine cytology findings also differed significantly according to diagnostic category. Among patients with histologically confirmed HGUC, only 17 of 59 (28.8%) were classified as positive for HGUC by cytology (Category V according to the Paris System). The remaining cases were categorized as negative for HGUC (Category II; 10/59, 17.0%), atypical urothelial cells (Category III; 12/59, 20.3%), or suspicious for HGUC (Category IV; 20/59, 33.9%). These findings highlight the limited sensitivity of urine cytology for identifying HGUC when Category V is considered the only positive result. Based on histopathological diagnosis, 38 patients (28.4%) showed no evidence of malignancy (Negative), 37 (27.6%) were diagnosed with LGUC, and 59 (44.0%) with HGUC (Table 1).
Bladder EpiCheck™ results demonstrated a progressive increase in methylation positivity with increasing pathological severity. Positive methylation results were detected in 7 of 38 patients (18.4%) in the Negative group, 19 of 37 (51.4%) in the LGUC group, and 54 of 59 (91.5%) in the HGUC group (Table 1, Figure 1B). Similarly, quantitative methylation scores increased significantly across diagnostic categories, with median scores of 29 (IQR 17-39) In the Negative group, 62 (IQR 22-74) in the LGUC group, and 90 (IQR 79-95) in the HGUC group. Pairwise comparisons demonstrated significant differences between all groups, supporting a strong association between methylation burden and tumor grade.
2.2. Methylation Findings
Methylation positivity increased significantly across histopathological categories, ranging from 18.4% (7/38) in patients with negative histopathology to 51.4% (19/37) in those with LGUC and 91.5% (54/59) in patients with HGUC (Table 1, Figure 1B; p < 0.001). Quantitative methylation scores increased stepwise with tumor grade. Median scores were 29 (IQR 17–39) in the Negative group, 62 (IQR 22–74) in the LGUC group, and 90 (IQR 79–95) in the HGUC group (Table 1). Pairwise comparisons confirmed significant differences between all diagnostic categories (all p < 0.05).
Using the predefined Bladder EpiCheck™ positivity threshold (>60), diagnostic performance varied according to the clinical endpoint evaluated. For detection of HGUC versus all other cases (LGUC and Negative), sensitivity was 91.5%, specificity was 65.3%, PPV was 67.5%, and NPV was 90.7%. For identification of any urothelial carcinoma (LGUC + HGUC) versus Negative cases, sensitivity and specificity were 76.0% and 81.6%, respectively, with a PPV of 91.3% and an NPV of 57.4%. When the analysis was restricted to HGUC versus Negative cases, sensitivity remained 91.5%, while specificity increased to 81.6%, yielding a PPV of 88.5% and an NPV of 86.1%.
ROC curve analysis showed excellent discriminatory performance of methylation scores for detecting HGUC, with an AUC of 0.876 (Figure 1C). Youden’s index identified an optimal cutoff of 74.5, exceeding the currently validated clinical threshold of 60. In contrast, discrimination between malignant (LGUC + HGUC) and non-malignant cases yielded an optimal cutoff of 60.5, closely matching the established commercial cutoff (Figure 1D).
2.3. Correlation with methylation testing and histopathology
Methylation analysis identified substantial molecular heterogeneity within histologically defined LGUCs. While LGUC is conventionally regarded as a single pathological entity, methylation scores segregated these tumors into two distinct subgroups (Figure 2A). One subgroup exhibited low methylation scores overlapping those of histologically negative cases, whereas the second displayed high methylation scores comparable to those observed in HGUC (Figure 2B). Accordingly, methylation-negative LGUCs were indistinguishable from Negative cases, while methylation-positive LGUCs showed methylation profiles that were statistically indistinguishable from HGUCs. Unsupervised Gaussian mixture modeling independently confirmed two discrete clusters, providing quantitative support for a bimodal methylation pattern within LGUC. These findings suggest that methylation testing captures biological heterogeneity not apparent from conventional histopathological grading alone.
2.4. Morphometric Analysis
Quantitative digital pathology revealed a progressive increase in nuclear size with increasing histological grade (Figure 3C, Table 2). Compared with negative biopsies, both methylation-negative and methylation-positive LGUCs exhibited significantly larger nuclear areas, while HGUCs demonstrated the highest nuclear area values overall. Notably, nuclear area did not differ significantly between the two LGUC methylation subgroups, indicating that the molecular heterogeneity identified by methylation profiling was not accompanied by detectable differences in this conventional morphometric parameter (Figure 3C, Table 2).
In contrast, cellular density remained comparable across all diagnostic categories and showed no significant association with either histological grade or methylation status (Table 2). These findings suggest that nuclear enlargement reflects increasing histological severity, whereas digital morphometric features alone do not discriminate between the molecularly distinct LGUC subgroups identified by methylation analysis.
2.5. Immunohistochemical Analysis
We evaluated HER2, GATA3, and CK5/6 expression in 17 methylation-negative LGUCs, 18 methylation-positive LGUCs, and HGUCs. HER2 showed heterogeneous staining intensities, ranging from 0+ (including umbrella cell-restricted staining) to 3+, with no significant differences in expression-pattern distribution among groups (Supplementary Table S1). GATA3 expression was largely retained across all evaluable tumors, with nearly all cases demonstrating strong (3+) staining and only isolated cases showing moderately reduced (2+) expression. CK5/6 also exhibited variable staining patterns—including absent, basal-restricted, and diffuse 1+ to 3+ expression—but did not differ significantly among diagnostic groups (Supplementary Table S1).
In contrast, MTAP loss was more frequent in methylation-positive than in meth-ylation-negative LGUCs. Loss of MTAP expression was observed in 2 of 17 methyla-tion-negative LGUCs (11.8%) and 6 of 18 methylation-positive LGUCs (33.3%). A comparable frequency of MTAP loss was identified in HGUCs (12/35, 34.3%) (Figure 3D).
Digital image analysis further demonstrated significant group-level differences in the mean nuclear area of Ki67- and p53-positive tumor cells (Supplementary Table S2). For both markers, positive nuclei were significantly larger in HGUCs than in either methylation-defined LGUC subgroup. No significant differences in the nuclear area of Ki67- or p53-positive cells were detected between methylation-negative and methyla-tion-positive LGUCs. The proportion of p53-positive tumor cells did not differ signifi-cantly among groups, despite the presence of both wild-type and overexpression staining patterns (Figure 3B). By contrast, the Ki67 labeling index increased progres-sively across the diagnostic spectrum and differed significantly among all groups. No-tably, methylation-positive LGUCs exhibited a significantly higher Ki67 labeling index than methylation-negative LGUCs, indicating greater proliferative activity within the methylation-positive subgroup (Figure 3A).
2.6. Clinical Follow-Up Evaluation
Clinical follow-up demonstrated a significantly higher risk of recurrence among patients with methylation-positive LGUC than among those with methylation-negative LGUC (Figure 3F). In the methylation-positive subgroup, 21.1% of patients experienced recurrence as LGUC and 15.8% developed recurrent HGUC. By contrast, only 5.9% of patients with methylation-negative LGUC experienced recurrence, all as LGUC, and none developed HGUC during follow-up. These findings indicate that methylation positivity identifies a clinically distinct LGUC subgroup associated with an increased risk of recurrence, including recurrence as high-grade disease.
2.7. Multivariate Integration of Methylation, Proliferation and MTAP expression
Factor Analysis of Mixed Data (FAMD) was performed in 45 cases with complete data for Methylation Score, Ki67 labeling index and MTAP expression. The first two dimensions accounted for 83.7% of the total inertia, with Dimension 1 explaining 55.8%. Methylation Score and Ki67 were the main contributors to Dimension 1 (42.6% and 35.0%, respectively), whereas MTAP was the main contributor to Dimension 2 (70.5%). Dimension 1 scores differed significantly among groups, with median values of −1.40 (IQR, −1.62 to −1.21) in methylation-negative LGUCs, 0.34 (IQR, −0.17 to 1.23) in methylation-positive LGUCs and 1.66 (IQR, 0.90 to 2.03) in HGUCs. Pairwise comparisons were significant for all three group comparisons (Figure 4).
3. Discussion
This study shows that urinary DNA methylation analysis provides clinically relevant information beyond its established diagnostic application. The diagnostic performance observed in our cohort is consistent with the biological basis of DNA methylation biomarkers [12,13,14]. Aberrant promoter methylation is an early event in urothelial carcinogenesis and may remain relatively stable throughout tumor evolution [15,16,17,18]. Bladder EpiCheck™ showed high sensitivity and negative predictive value for detecting high-grade urothelial carcinoma (HGUC), consistent with previous studies and supporting its use as a non-invasive adjunct to conventional surveillance strategies [8,9].
Beyond diagnostic performance, the study identified two biologically and clinically distinct subgroups within histologically defined low-grade urothelial carcinoma (LGUC). Methylation-positive LGUCs exhibited molecular, pathological, and clinical features more closely resembling those of HGUC than those of methylation-negative LGUC. These findings suggest that urinary DNA methylation captures biologically relevant heterogeneity that is not fully resolved by conventional histopathological assessment.
Histopathological diagnosis and grading remain central to bladder cancer risk stratification. Nevertheless, accumulating molecular evidence indicates that tumors with similar morphological features may harbor substantially different genomic and epigenomic profiles [19]. The bimodal distribution of methylation scores among LGUCs in our cohort reinforces this concept. It suggests that histologically low-grade disease may encompass biologically distinct entities rather than a single homogeneous clinicopathological category [20]. Methylation-negative LGUCs showed score distributions that largely overlapped those of histologically negative biopsies, whereas methylation-positive LGUCs displayed scores approaching those observed in HGUC. Gaussian mixture modeling independently reproduced this separation, reducing the likelihood that the observed distribution resulted from arbitrary subgrouping or statistical variation.
The pathological findings further supported the distinction between these methylation-defined LGUC subgroups. Nuclear area increased progressively across the histological spectrum, from negative biopsies to LGUC and HGUC. However, neither quantitative morphometry nor conventional histopathological evaluation distinguished methylation-positive from methylation-negative LGUC. Thus, the methylation-defined subgroups are unlikely to reflect differences detectable using conventional morphological assessment alone. Instead, they may represent epigenetically distinct tumor states that retain similar low-grade architecture and cytological features.
In contrast to the morphometric findings, Ki67 expression differed significantly between the two LGUC subgroups, with methylation-positive tumors demonstrating greater proliferative activity. Ki67 is an established marker of cellular proliferation and has been associated with recurrence and progression in urothelial carcinoma [20,21,22]. The higher Ki67 labeling index observed in methylation-positive LGUC therefore suggests that the epigenetic alterations detected by Bladder EpiCheck™ are associated with increased proliferative potential despite the preservation of low-grade histological morphology.
The discordance between morphology and proliferative activity may reflect the different biological dimensions these approaches capture. Histopathological grading primarily evaluates architectural organization and cytological atypia, whereas methylation profiling measures molecular alterations that may arise early in tumor development and evolve before overt morphological progression becomes apparent [23,24,25,26]. Although the temporal relationship between epigenetic dysregulation and histological transformation remains incompletely understood, methylation-positive LGUCs may have acquired molecular programs associated with more aggressive behavior before developing the architectural and cytological features required for classification as HGUC. Longitudinal molecular studies will be necessary to determine whether methylation positivity represents an early stage of biological progression or a stable molecular subtype of LGUC.
Differences in MTAP expression provided additional evidence of biological divergence between the LGUC subgroups. MTAP loss was more frequent in methylation-positive than in methylation-negative LGUC and occurred at a frequency comparable to that observed in HGUC. MTAP immunohistochemical loss has emerged as a potential surrogate for homozygous deletion of chromosome 9p21.3, a region that includes MTAP and the adjacent CDKN2A locus. Alterations involving this region have been associated with aggressive pathological features in urothelial carcinoma [27,28]. Although genomic testing was not performed and MTAP loss alone cannot establish the presence or extent of a 9p21.3 deletion, its association with methylation positivity and increased proliferative activity supports a biologically distinct LGUC subgroup with selected HGUC-like molecular features.
Factor Analysis of Mixed Data (FAMD) was performed as an exploratory multivariate analysis to jointly assess Methylation Score, Ki67 labeling index, and dichotomous MTAP expression status in cases with complete data for all three variables. Methylation-negative LGUCs, methylation-positive LGUCs and HGUCs showed a significant progressive separation along the first factorial dimension, with methylation-positive LGUCs occupying an intermediate position between methylation-negative LGUCs and HGUCs. These findings suggest that the methylation-defined LGUC subgroups are not distinguished by methylation status alone but instead represent different multivariate and biological profiles integrating also proliferative activity and MTAP expression.
Clinical outcomes further reinforced the relevance of the methylation-defined classification. Recurrence was more frequent among patients with methylation-positive LGUC, and recurrence as HGUC occurred exclusively in this subgroup. In contrast, recurrence was uncommon among patients with methylation-negative LGUC, and no high-grade recurrences were observed during follow-up. These findings suggest that methylation positivity may identify a subset of histologically low-grade tumors with a less favorable clinical course. However, because of the limited sample size and number of outcome events, the prognostic magnitude of this association should be interpreted cautiously.
If independently validated, urinary methylation profiling could complement established clinicopathological risk models [29]. Patients with methylation-positive LGUC might benefit from closer surveillance despite having low-grade histology, whereas methylation-negative status could potentially identify patients suitable for less intensive follow-up. Such an approach could help align surveillance intensity with underlying tumor biology rather than morphology alone. Nevertheless, treatment or surveillance strategies should not be modified based on these findings until their prognostic value and clinical utility have been confirmed prospectively.
This study has several limitations. First, it was conducted at a single center and included a relatively small number of methylation-defined LGUCs, particularly for recurrence and high-grade recurrence analyses. Second, the follow-up duration was insufficient to evaluate long-term progression, disease-specific survival, or overall survival. Third, comprehensive genomic and epigenomic characterization was unavailable, precluding direct correlation of methylation status with underlying molecular alterations, including MTAP and CDKN2A deletions. Fourth, we evaluated the methylation-defined subgroups and their pathological and clinical associations within the same cohort, increasing the risk of overfitting and limiting generalizability. The findings should therefore be regarded as hypothesis-generating pending external validation. Finally, the observational design does not establish whether incorporating methylation profiling into routine surveillance would improve patient outcomes, reduce the burden of cystoscopy, or be cost-effective.
In conclusion, urinary DNA methylation profiling revealed clinically relevant heterogeneity within histologically defined LGUC that conventional morphology did not capture. Methylation-positive LGUCs were characterized by greater proliferative activity, more frequent MTAP loss, and a higher risk of recurrence, including recurrence as high-grade disease. Collectively, these findings support a biologically distinct subgroup within histologically low-grade urothelial carcinoma and highlight the potential of urinary methylation profiling to complement conventional histopathological classification. Larger multicenter studies with standardized longitudinal follow-up and integrated genomic characterization are required to validate these findings and determine whether methylation-guided risk stratification can improve surveillance and clinical management.
4. Materials and Methods
4.1. Study Design and Patient Selection
This study was designed as a single-center observational cohort investigation including patients undergoing routine surveillance for bladder cancer following transurethral resection of bladder tumor (TURBT). We screened consecutive patients evaluated between January 2020 and January 2026 for eligibility.
Inclusion criteria comprised patients with a clinical or cystoscopy suspicion of urothelial carcinoma of the bladder who had available histopathological results from TURBT or biopsy and paired urine cytology and Bladder EpiCheck™ testing. We included patients with both malignant and non-malignant histopathological outcomes.
Patients were excluded if Bladder EpiCheck™ testing was performed more than six months after the corresponding biopsy or if clinical, cytological, or histopathological data were incomplete.
4.2. Etical Considerations
The study was conducted in accordance with the Declaration of Helsinki and applicable national and European regulations governing biomedical research. The study protocol, including its first amendment, as well as the informed consent form and patient information sheet, received approval from the Comitè Ètic d’Investigació amb Medicaments (CEIm) de l’Institut d’Investigació Sanitària Pere Virgili (reference CEIm: 099/2024), with a favorable opinion issued on 27 February 2025.
All data were handled confidentially and anonymized prior to analysis to protect participant privacy and ensure compliance with current data protection legislation. As this was an observational study conducted within routine clinical practice, participants were not exposed to any additional risks or interventions beyond standard care.
4.3. Clinical Evaluation and Follow-up
All patients received standard monitoring in line with current European Association of Urology guidelines [3,30], which included cystoscopy and urine cytology. Biopsies or repeat TURBT were performed when clinically indicated. Clinical data collected included age, gender, smoking habits, tumor stage and histological grade at initial diagnosis, as well as previous treatments and follow-up outcomes.
All biopsy specimens were formalin-fixed, paraffin-embedded, and processed using standardized histopathological protocols. Histological diagnosis and tumor grading were established according to the 2022 WHO Classification of Tumours of the Urinary and Male Genital Systems (5th edition). Cases were categorized as negative for malignancy, non-muscle-invasive bladder cancer (NMIBC), or muscle-invasive bladder cancer (MIBC). Urothelial carcinomas were further stratified into low-grade and high-grade lesions based on WHO-defined morphological criteria [31].
4.4. Bladder Epicheck™ Assay
For the Bladder EpiCheck™ test, urine samples were centrifuged twice at 1000 × g for 5 minutes at room temperature. DNA was isolated using the Bladder EpiCheck™ DNA extraction kit and treated with a methylation-sensitive restriction enzyme that cleaves DNA at its recognition sites when unmethylated.
Samples were then prepared for polymerase chain reaction (PCR) analysis using the Bladder EpiCheck™ test kit, and results were evaluated using the Bladder EpiCheck™ software. For samples that passed internal control validation, an EpiScore ranging from 0 to 100 was calculated. An EpiScore ≥60 was considered a positive result, whereas an EpiScore <60 was considered negative [32] (Figure 1A).
4.5. Urine Cytology
Urine cytology was performed on samples collected during the same surveillance visit as Bladder EpiCheck™ testing using the Papanicolaou staining procedure [33]. Cytological findings were classified as negative, atypical, suspicious, or positive for malignancy according to the Paris System for Reporting Urinary Cytology [34].
4.6. Histopathological and Immunohistochemical Analysis
Bladder tissue biopsies were obtained during transurethral resection of bladder tumor (TURBT) procedures and processed according to standardized institutional protocols. Specimens were fixed in formalin and subsequently embedded in paraffin. Paraffin blocks were sectioned at a thickness of 4 µm and prepared for routine microscopic evaluation. Histopathological assessment was performed on hematoxylin and eosin (H&E)-stained slides using validated automated hospital protocols.
Protein biomarker expression was evaluated by immunohistochemistry (IHC) using the fully automated Ventana BenchMark ULTRA platform (Roche Diagnostics, Indianapolis, IN, USA). The antibody panel included Ki-67, p53, GATA3, HER2, CK5/6, and MTAP. Immunostaining was performed using either the OptiView DAB IHC Detection Kit or the ultraView Universal DAB Detection Kit (Roche, Spain), according to the specific requirements of each antibody. Signals were visualized using diaminobenzidine (DAB) chromogen, followed by hematoxylin counterstaining. Quality control included internal and external positive controls in each staining run. Detailed staining protocols are provided in Supplementary Table S3.
4.7. Digital Pathology
A Ventana DP 200 device (Roche, Basel, Switzerland) was used to digitize slides at 40× magnification. Image analysis was performed using QuPath software (version 0.5.1). A project was created and whole-slide images were imported, with the default H-DAB filter selected for immunohistochemical image analysis. To ensure accurate color representation, the “Estimate Stain Vectors” function was applied to each image for automatic color-scale correction.
Tissue annotations were created manually to delineate tissue sections as regions of interest (ROIs) and categorize them as tissue areas. To exclude non-representative or damaged peripheral regions, the “Expand Annotations” function was applied with an expansion radius of −100 μm. Artifacts within tissue sections were manually corrected by erasing them or adjusting the annotation regions as required.
Two primary analysis tools were used according to the observed staining patterns. The “Cell Detection” tool was used for discrete cellular markers characterized by well-defined cell boundaries with clear membrane and/or cytoplasmic localization. The “Pixel Classifier” tool was applied to diffuse or continuous staining patterns characterized by overlapping marker distribution that did not conform to discrete cellular boundaries.
Individual cells in H&E-stained LGUC and HGUC sections were identified and quantified using the “Cell Detection” algorithm. The algorithm was configured using “Hematoxylin OD” detection parameters at a pixel resolution of 0.5 μm. Default settings were maintained for all parameters except the intensity threshold, which was adjusted to 0.1.
For antibodies exhibiting diffuse or continuous staining patterns, including Ki-67 and p53, the “Pixel Classifier” tool was used. The algorithm was configured using “Diaminobenzidine OD” detection parameters at a pixel resolution of 0.5 μm. Default settings were maintained for all parameters except the intensity threshold, which was adjusted to 0.1. For cellular staining patterns, positivity was quantified as the percentage of immunopositive cell area relative to the total ROI area: (immunopositive cell area / total ROI area) × 100%. For diffuse staining patterns, positivity was expressed as the percentage of DAB-stained area relative to the total ROI area: (DAB-stained area / total ROI area) × 100%. Following pixel classification, tissue objects were systematically generated to enable downstream quantitative analysis.
After cell detection or pixel classification, the resulting tissue objects were enhanced with spatial measurements using the “Analyze > Calculate Features > Add Shape Features” function to incorporate morphometric parameters into the quantitative analysis. Upon completion of the analysis, QuPath generated comprehensive quantitative datasets for each case. All image-associated data and analysis parameters were systematically saved and archived under the respective patient identifiers to ensure data integrity and facilitate subsequent statistical analysis.
4.8. Statistical Analysis
Statistical analyses were performed using R version 4.6.1 (R Foundation for Statistical Computing, Vienna, Austria). Continuous variables are presented as median and interquartile range (IQR), whereas categorical variables are reported as frequencies and percentages. Comparisons between two independent groups were performed using the Wilcoxon rank-sum test.
Comparisons involving three or more independent groups were performed using the Kruskal–Wallis test, followed by pairwise Wilcoxon rank-sum tests with Holm adjustment for multiple comparisons when appropriate. Categorical variables were compared using Pearson’s chi-square test or Fisher’s exact test, as appropriate.
The diagnostic performance of Bladder EpiCheck™ was evaluated by calculating sensitivity, specificity, positive predictive value, and negative predictive value. Receiver operating characteristic (ROC) curve analysis was performed to determine the optimal EpiScore cutoff.
Gaussian mixture modelling was used to assess the presence of distinct methylation-defined subgroups within LGUC. Factor Analysis of Mixed Data (FAMD) was performed to jointly assess EpiScore, Ki67 labeling index, and dichotomous MTAP expression status in cases with complete data for all three variables. The contributions of individual variables to each factorial dimension were assessed, and differences in factorial dimension scores between study groups were evaluated using the Kruskal–Wallis test followed by pairwise Wilcoxon rank-sum tests with Holm adjustment. All statistical tests were two-sided, and P < 0.05 was considered statistically significant.
Supplementary Materials
The following supporting information can be downloaded at the website of this paper posted on Preprints.org, Table S1. Immunohistochemical profiles of methylation-defined low-grade urothelial carcinoma subgroups and high-grade urothelial carcinoma. Table S2. Digital pathology-derived quantification of proliferative and p53-associated biomarkers according to methylation-defined tumor subgroup. Table S3. Standardized immunohistochemical protocols for biomarker evaluation using the Ventana BenchMark ULTRA system.
Author Contributions
Conceptualization, D.P. and M.A.; methodology, D.P., M.A. and A.O.; software, M.A. and A.O.; validation, D.P., M.A. and A.O.; formal analysis, D.P., M.A. and A.O.; investigation, D.P., M.A. and A.O.; resources, K.P., M.G., and J.G.; data curation, D.P., M.A. , A.H. and A.O.; writing—original draft preparation, D.P., M.A. and A.O.; writing—review and editing, D.P., M.A. and A.O.; visualization, D.P., M.A. and A.O.; supervision, D.P. and K.P.; project administration, F.R.; funding acquisition, J.C. All authors have read and agreed to the published version of the manuscript.
Funding
This research received no external funding.
Institutional Review Board Statement
The study was conducted in accordance with the Declaration of Helsinki and approved by the Institutional Review Board (or Ethics Committee), Comitè Ètic d’Investigació amb Medicaments (CEIm) de l’Institut d’Investigació Sanitària Pere Virgili (reference CEIm: 099/2024), with a favorable opinion issued on 27 February 2025.
Informed Consent Statement
Informed consent was obtained from all subjects involved in the study.
Data Availability Statement
The data supporting the findings of this study are available from the corresponding author upon reasonable request. Due to privacy and ethical restrictions, individual-level patient data are not publicly available.
Acknowledgments
The authors used Microsoft 365 Copilot solely to assist with English language editing and grammatical revision of the manuscript. All generated content was critically reviewed, revised, and verified by the authors. The authors accept full responsibility for the accuracy, integrity, and originality of the final manuscript and for all conclusions presented herein.
Conflicts of Interest
The authors declare no conflicts of interest.
Abbreviations
The following abbreviations are used in this manuscript:
| BCa | Bladder Cancer |
| UCa | Urothelial Carcinoma |
| DNA | Desoxyribunocleic Acid |
| NMIBC | Non-Muscular Invasive Bladder Cancer |
| MIBC | Muscular Invasive Bladder Cancer |
| TURBT | Trans-Urethral Resection of Bladder Tumor |
| LGUC | Low Grade Urothelial Carcinoma |
| HGUC | High Grade Urothelial Carcinoma |
| Bx | Biopsy |
| PPV | Positive Predictive Value |
| NPV | Negative Predictive Value |
| ROC | Receiver Operating Characteristic |
| AUC | Area Under the Curve |
References
- Bray, F.; Laversanne, M.; Sung, H.; Ferlay, J.; Siegel, R.L.; Soerjomataram, I.; Jemal, A. Global Cancer Statistics 2022: GLOBOCAN Estimates of Incidence and Mortality Worldwide for 36 Cancers in 185 Countries. CA Cancer J. Clin. 2024, 74, 229–263. [Google Scholar] [CrossRef] [PubMed]
- Gontero, P.; Birtle, A.; Capoun, O.; Compérat, E.; Dominguez-Escrig, J.L.; Liedberg, F.; Mariappan, P.; Masson-Lecomte, A.; Mostafid, H.A.; Pradere, B.; et al. European Association of Urology Guidelines on Non–Muscle-Invasive Bladder Cancer (TaT1 and Carcinoma In Situ)—A Summary of the 2024 Guidelines Update. Eur. Urol. 2024, 86, 531–549. [Google Scholar] [CrossRef] [PubMed]
- Alfred Witjes, J.; Max Bruins, H.; Carrión, A.; Cathomas, R.; Compérat, E.; Efstathiou, J.A.; Fietkau, R.; Gakis, G.; Lorch, A.; Martini, A.; et al. European Association of Urology Guidelines on Muscle-Invasive and Metastatic Bladder Cancer: Summary of the 2023 Guidelines. Eur. Urol. 2024, 85, 17–31. [Google Scholar] [CrossRef] [PubMed]
- Maas, M.; Todenhöfer, T.; Black, P.C. Urine Biomarkers in Bladder Cancer—Current Status and Future Perspectives. Nat. Rev. Urol. 2023, 20, 597–614. [Google Scholar] [CrossRef] [PubMed]
- Pecoraro, M.; Cipollari, S.; Messina, E.; Laschena, L.; Dehghanpour, A.; Borrelli, A.; Del Giudice, F.; Francisco Muglia, V.; Alberto Vargas, H.; Panebianco, V. Multiparametric MRI for Bladder Cancer: A Practical Approach to the Clinical Application of VI-RADS. Radiology 2025, 314. [Google Scholar] [CrossRef] [PubMed]
- Panebianco, V.; Narumi, Y.; Altun, E.; Bochner, B.H.; Efstathiou, J.A.; Hafeez, S.; Huddart, R.; Kennish, S.; Lerner, S.; Montironi, R.; et al. Multiparametric Magnetic Resonance Imaging for Bladder Cancer: Development of VI-RADS (Vesical Imaging-Reporting And Data System). Eur. Urol. 2018, 74, 294–306. [Google Scholar] [CrossRef] [PubMed]
- U.S. Food and Drug Administration. 510(k) substantial equivalence determination decision summary: Bladder EpiCheck Test, K203245. FDA: Silver Spring, MD, 2023. [Google Scholar]
- Witjes, J.A.; Morote, J.; Cornel, E.B.; Gakis, G.; van Valenberg, F.J.P.; Lozano, F.; Sternberg, I.A.; Willemsen, E.; Hegemann, M.L.; Paitan, Y.; et al. Performance of the Bladder EpiCheckTM Methylation Test for Patients Under Surveillance for Non–Muscle-Invasive Bladder Cancer: Results of a Multicenter, Prospective, Blinded Clinical Trial. Eur. Urol. Oncol. 2018, 1, 307–313. [Google Scholar] [CrossRef] [PubMed]
- Fleshner, N.; Grossman, H.B.; Berglund, R.; Hafron, J.; Inman, B.; Karsh, L.; Moses, K.; Saltzstein, D.; Shah, A.; Wright, J.; et al. North American Study and Meta-Analysis Evaluating Performance of Bladder EpiCheck®, a FDA Cleared Test, in Non-Muscle Invasive Bladder Cancer Recurrence. Bladder Cancer 2025, 10, 278–289. [Google Scholar] [CrossRef] [PubMed]
- Figueras, M.; Ingelmo-Torres, M.; Roldan, F.L.; Gomà, E.; Galve, P.; Mercader, C.; Peri, L.; Franco, A.; Asiain, I.; Alcaraz, A.; et al. Role of Bladder EpiCheck® in Bladder Cancer: From Primary Diagnosis to Surveillance. J. Transl. Med. 2026, 24. [Google Scholar] [CrossRef] [PubMed]
- Mariappan, P.; Hart-Brooke, J.; Sparks, R.; Lord-McKenzie, T. Bladder EpiCheck Triggered Photodynamic Diagnosis Biopsies Detect High-Grade Bladder Cancer Recurrences Missed by White Light Cystoscopy. Eur. Urol. Oncol. 2026, 9, 125–132. [Google Scholar] [CrossRef] [PubMed]
- Silva-Ferreira, M.; Carvalho, J.A.; Salta, S.; Henriques, T.S.; Pereira Rodrigues, P.; Monteiro-Reis, S.; Henrique, R.; Jerónimo, C. Diagnostic Test Accuracy of Urinary DNA Methylation-Based Biomarkers for the Detection of Primary and Recurrent Bladder Cancer: A Systematic Review and Meta-Analysis. Eur. Urol. Focus 2024, 10, 922–934. [Google Scholar] [CrossRef] [PubMed]
- Wolfs, J.R.E.; Hermans, T.J.N.; Koldewijn, E.L.; van de Kerkhof, D. Novel Urinary Biomarkers ADXBLADDER and Bladder EpiCheck for Diagnostics of Bladder Cancer: A Review. Urol. Oncol. Semin. Orig. Investig. 2021, 39, 161–170. [Google Scholar] [CrossRef] [PubMed]
- Caño Velasco, J.; Artero Fullana, S.; Polanco Pujol, L.; Lafuente Puentedura, A.; Subiela, J.D.; Aragón Chamizo, J.; Moralejo Gárate, M.; Hernández Fernández, C. Use of Bladder Epicheck® in the Follow-up of Non-Muscle-Invasive Bladder Cancer: A Systematic Literature Review. Actas Urol. Esp. 2024, 48, 555–564. [Google Scholar] [CrossRef]
- Kim, M.; Costello, J. DNA Methylation: An Epigenetic Mark of Cellular Memory. Exp. Mol. Med. 2017, 49. [Google Scholar] [CrossRef] [PubMed]
- Nishiyama, N.; Arai, E.; Chihara, Y.; Fujimoto, H.; Hosoda, F.; Shibata, T.; Kondo, T.; Tsukamoto, T.; Yokoi, S.; Imoto, I.; et al. Genome-Wide DNA Methylation Profiles in Urothelial Carcinomas and Urothelia at the Precancerous Stage. Cancer Sci. 2010, 101, 231–240. [Google Scholar] [CrossRef] [PubMed]
- Erichsen, L.; Seifert, H.H.; Schulz, W.A.; Hoffmann, M.J.; Niegisch, G.; Araúzo-Bravo, M.J.; Bendhack, M.L.; Poyet, C.; Hermanns, T.; Beermann, A.; et al. Basic Hallmarks of Urothelial Cancer Unleashed in Primary Uroepithelium by Interference with the Epigenetic Master Regulator ODC1. Sci. Rep. 2020, 10. [Google Scholar] [CrossRef] [PubMed]
- Kandimalla, R.; Van Tilborg, A.A.; Zwarthoff, E.C. DNA Methylation-Based Biomarkers in Bladder Cancer. Nat. Rev. Urol. 2013, 10:6 10, 327–335. [Google Scholar] [CrossRef] [PubMed]
- Xiao, Y.; Jin, W.; Qian, K.; Ju, L.; Wang, G.; Wu, K.; Cao, R.; Chang, L.; Xu, Z.; Luo, J.; et al. Integrative Single Cell Atlas Revealed Intratumoral Heterogeneity Generation from an Adaptive Epigenetic Cell State in Human Bladder Urothelial Carcinoma. Adv. Sci. (Weinh) 2024, 11. [Google Scholar] [CrossRef] [PubMed]
- Nguyen, J.K.; Toscano, M.P.; Li, J.; Williamson, S.R.; Przybycin, C.G.; Kao, C.S.; Myles, J.L.; Pivovarčíková, K.; Švajdler, M.; Brousil, M.; et al. Hybrid Grading Systems Improve Progression Risk Stratification in Non-Invasive Papillary Urothelial Carcinoma and Support a Histomorphological Continuum of Disease Progression. Histopathology 2026. [Google Scholar] [CrossRef] [PubMed]
- Quintero, A.; Alvarez-Kindelan, J.; Luque, R.J.; Gonzalez-Campora, R.; Requena, M.J.; Montironi, R.; Lopez-Beltran, A. Ki-67 MIB1 Labelling Index and the Prognosis of Primary TaT1 Urothelial Cell Carcinoma of the Bladder. J. Clin. Pathol. 2006, 59, 83. [Google Scholar] [CrossRef] [PubMed]
- Törzsök, P.; Riesz, P.; Kenessey, I.; Székely, E.; Somorácz, Á.; Nyirády, P.; Romics, I.; Schaff, Z.; Lotz, G.; Kiss, A. Claudins and Ki-67: Potential Markers to Differentiate Low- and High-Grade Transitional Cell Carcinomas of the Urinary Bladder. J. Histochem. Cytochem. 2011, 59, 1022–1030. [Google Scholar] [CrossRef] [PubMed]
- Downes, M.R.; van der Kwast, T.H.; Lopez-Beltran, A.; Cheng, L. Grading of Bladder Cancer: Updates, Controversies and Practical Solutions. Histopathology 2025, 88, 86. [Google Scholar] [CrossRef] [PubMed]
- van der Kwast, T.; Liedberg, F.; Black, P.C.; Kamat, A.; van Rhijn, B.W.G.; Algaba, F.; Berman, D.M.; Hartmann, A.; Lopez-Beltran, A.; Samaratunga, H.; et al. International Society of Urological Pathology Expert Opinion on Grading of Urothelial Carcinoma. Eur. Urol. Focus 2022, 8, 438–446. [Google Scholar] [CrossRef] [PubMed]
- Jensen, T.J.; Novak, P.; Wnek, S.M.; Gandolfi, A.J.; Futscher, B.W. Arsenicals Produce Stable Progressive Changes in DNA Methylation Patterns That Are Linked to Malignant Transformation of Immortalized Urothelial Cells. Toxicol. Appl. Pharmacol. 2009, 241, 221–229. [Google Scholar] [CrossRef] [PubMed]
- Tang, X.; Liu, J.; Zhao, Q.; Yang, X.; Yang, Y.; Du, P. The Diagnostic and Prognostic Value of Immunohistochemical Markers in Bladder Cancer: A Real-World Study of 477 Patients. J. Clin. Med. 2026, 15, 6124. [Google Scholar] [CrossRef] [PubMed]
- Gorbokon, N.; Wößner, N.; Ahlburg, V.; Plage, H.; Hofbauer, S.; Furlano, K.; Weinberger, S.; Bruch, P.G.; Schallenberg, S.; Roßner, F.; et al. Loss of MTAP Expression Is Strongly Linked to Homozygous 9p21 Deletion, Unfavorable Tumor Phenotype, and Noninflamed Microenvironment in Urothelial Bladder Cancer. J. Pathol. Clin. Res. 2025, 11, e70012. [Google Scholar] [CrossRef] [PubMed]
- Vlajnic, T.; Chijioke, O.; Roma, L.; Savic Prince, S.; Zellweger, T.; Rentsch, C.A.; Bubendorf, L. Loss of MTAP Expression by Immunohistochemistry Is a Surrogate Marker for Homozygous 9p21.3 Deletion in Urothelial Carcinoma. Mod. Pathol. 2024, 37. [Google Scholar] [CrossRef] [PubMed]
- Holzbeierlein, J.M.; Bixler, B.R.; Buckley, D.I.; Chang, S.S.; Holmes, R.; James, A.C.; Kirkby, E.; McKiernan, J.M.; Schuckman, A.K. Diagnosis and Treatment of Non-Muscle Invasive Bladder Cancer: AUA/SUO Guideline: 2024 Amendment. J. Urol. 2024, 211, 533–538. [Google Scholar] [CrossRef] [PubMed]
- Babjuk, M.; Burger, M.; Capoun, O.; Cohen, D.; Compérat, E.M.; Dominguez Escrig, J.L.; Gontero, P.; Liedberg, F.; Masson-Lecomte, A.; Mostafid, A.H.; et al. European Association of Urology Guidelines on Non–Muscle-Invasive Bladder Cancer (Ta, T1, and Carcinoma in Situ). Eur. Urol. 2022, 81, 75–94. [Google Scholar] [CrossRef] [PubMed]
- Moch, H. (Ed.) WHO Classification of Tumours Editorial Board Urinary and Male Genital Tumours; International Agency for Research on Cancer, 2022; Vol. 8, ISBN 978-92-832-4512-4. [Google Scholar]
- Witjes, J.A.; Morote, J.; Cornel, E.B.; Gakis, G.; van Valenberg, F.J.P.; Lozano, F.; Sternberg, I.A.; Willemsen, E.; Hegemann, M.L.; Paitan, Y.; et al. Performance of the Bladder EpiCheckTM Methylation Test for Patients Under Surveillance for Non-Muscle-Invasive Bladder Cancer: Results of a Multicenter, Prospective, Blinded Clinical Trial. Eur. Urol. Oncol. 2018, 1, 307–313. [Google Scholar] [CrossRef] [PubMed]
- Chandra, A.; Cross, P.; Denton, K.; Giles, T.; Hemming, D.; Payne, C.; Wilson, A.; Wilson, P. The BSCC Code of Practice—Exfoliative Cytopathology (Excluding Gynaecological Cytopathology). Cytopathology 2009, 20, 211–223. [Google Scholar] [CrossRef] [PubMed]
- Barkan, G.A.; Wojcik, E.M.; Nayar, R.; Savic-Prince, S.; Quek, M.L.; Kurtycz, D.F.I.; Rosenthal, D.L. The Paris System for Reporting Urinary Cytology: The Quest to Develop a Standardized Terminology. Adv. Anat. Pathol. 2016, 23, 193–201. [Google Scholar] [CrossRef] [PubMed]
Figure 1.
Principle of the Bladder EpiCheck™ assay and diagnostic performance of urinary DNA methylation profiling. (A) Schematic representation of the Bladder EpiCheck™ assay. Methylated DNA is protected from digestion by a methylation-sensitive restriction enzyme and selectively amplified by real-time PCR, whereas unmethylated DNA is enzymatically digested and not amplified. (B) Distribution of methylation-positive and methylation-negative results across negative histopathology, LGUC, and HGUC. (C) ROC analysis demonstrating the diagnostic performance of EpiScore for HGUC detection. (D) ROC analysis demonstrating the diagnostic performance of EpiScore for the detection of urothelial carcinoma (LGUC + HGUC) versus negative histopathology.
Figure 1.
Principle of the Bladder EpiCheck™ assay and diagnostic performance of urinary DNA methylation profiling. (A) Schematic representation of the Bladder EpiCheck™ assay. Methylated DNA is protected from digestion by a methylation-sensitive restriction enzyme and selectively amplified by real-time PCR, whereas unmethylated DNA is enzymatically digested and not amplified. (B) Distribution of methylation-positive and methylation-negative results across negative histopathology, LGUC, and HGUC. (C) ROC analysis demonstrating the diagnostic performance of EpiScore for HGUC detection. (D) ROC analysis demonstrating the diagnostic performance of EpiScore for the detection of urothelial carcinoma (LGUC + HGUC) versus negative histopathology.
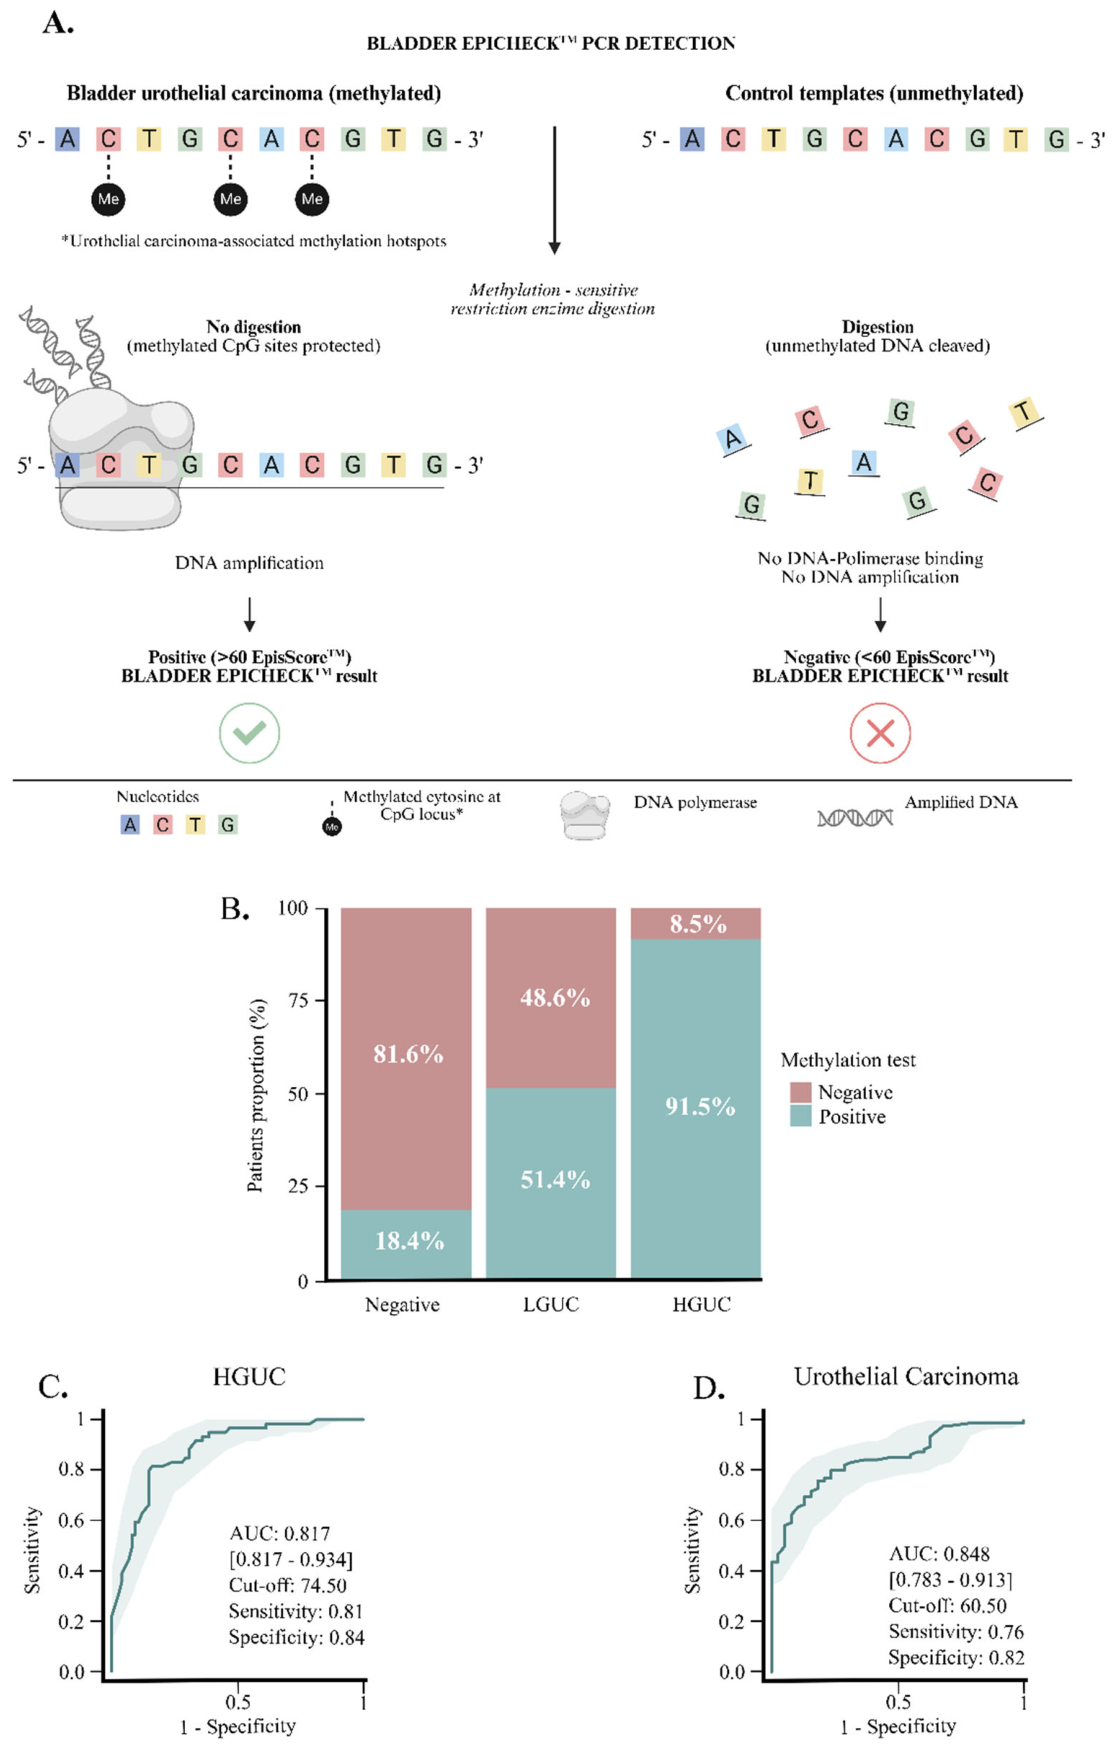
Figure 2.
Bladder EpiCheck™ EpiScores identify two epigenetically distinct subgroups within low-grade urothelial carcinoma. (A) Distribution of EpiScores across negative histopathology, low-grade urothelial carcinoma (LGUC), and high-grade urothelial carcinoma (HGUC). (B) Stratification of LGUC according to Bladder EpiCheck™ status reveals methylation-negative (EpiScore < 60) and methylation-positive (EpiScore ≥ 60) subgroups with distinct methylation profiles. The horizontal dashed line indicates the predefined positivity threshold (EpiScore = 60). Statistical significance is indicated in the corresponding panels.
Figure 2.
Bladder EpiCheck™ EpiScores identify two epigenetically distinct subgroups within low-grade urothelial carcinoma. (A) Distribution of EpiScores across negative histopathology, low-grade urothelial carcinoma (LGUC), and high-grade urothelial carcinoma (HGUC). (B) Stratification of LGUC according to Bladder EpiCheck™ status reveals methylation-negative (EpiScore < 60) and methylation-positive (EpiScore ≥ 60) subgroups with distinct methylation profiles. The horizontal dashed line indicates the predefined positivity threshold (EpiScore = 60). Statistical significance is indicated in the corresponding panels.
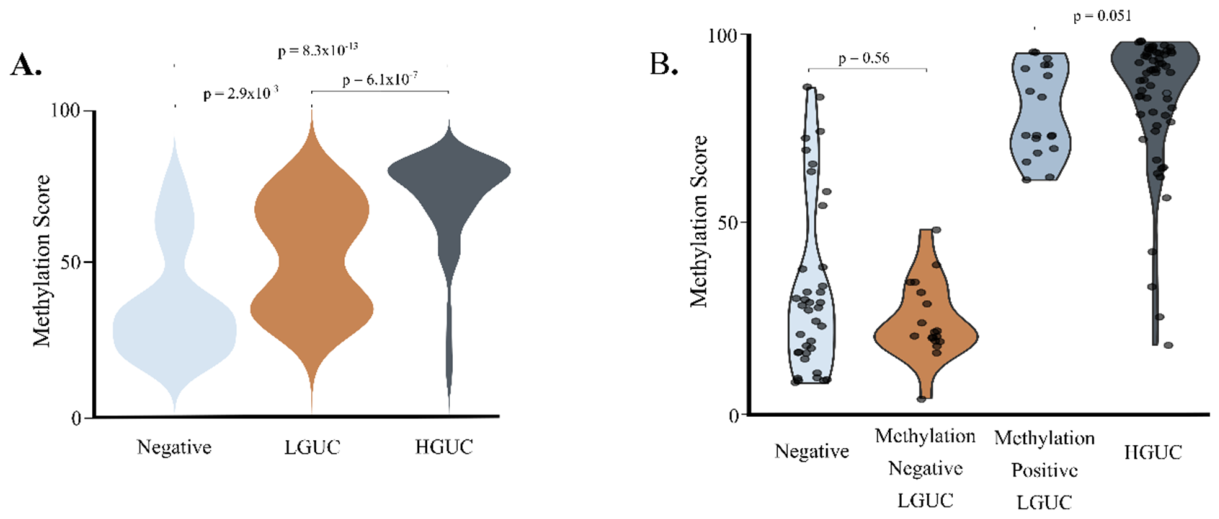
Figure 3.
Methylation-defined LGUC subgroups exhibit distinct biological and clinical characteristics. (A) Representative H&E, Ki-67, and MTAP staining in methylation-negative LGUC, methylation-positive LGUC, and HGUC. (B) Representative p53 immunohistochemical patterns. (C) Quantitative assessment of nuclear area across diagnostic and methylation-defined groups. (D) Ki-67 labeling index determined by digital image analysis. (E) MTAP expression quantified by immunohistochemistry. (E) Percentage of MTAP-positive tumor cells determined by immunohistochemistry. (F) Clinical outcomes stratified by methylation status, showing recurrence as LGUC, progression to HGUC, or absence of recurrence during follow-up. Statistical significance is indicated in the corresponding panels.
Figure 3.
Methylation-defined LGUC subgroups exhibit distinct biological and clinical characteristics. (A) Representative H&E, Ki-67, and MTAP staining in methylation-negative LGUC, methylation-positive LGUC, and HGUC. (B) Representative p53 immunohistochemical patterns. (C) Quantitative assessment of nuclear area across diagnostic and methylation-defined groups. (D) Ki-67 labeling index determined by digital image analysis. (E) MTAP expression quantified by immunohistochemistry. (E) Percentage of MTAP-positive tumor cells determined by immunohistochemistry. (F) Clinical outcomes stratified by methylation status, showing recurrence as LGUC, progression to HGUC, or absence of recurrence during follow-up. Statistical significance is indicated in the corresponding panels.
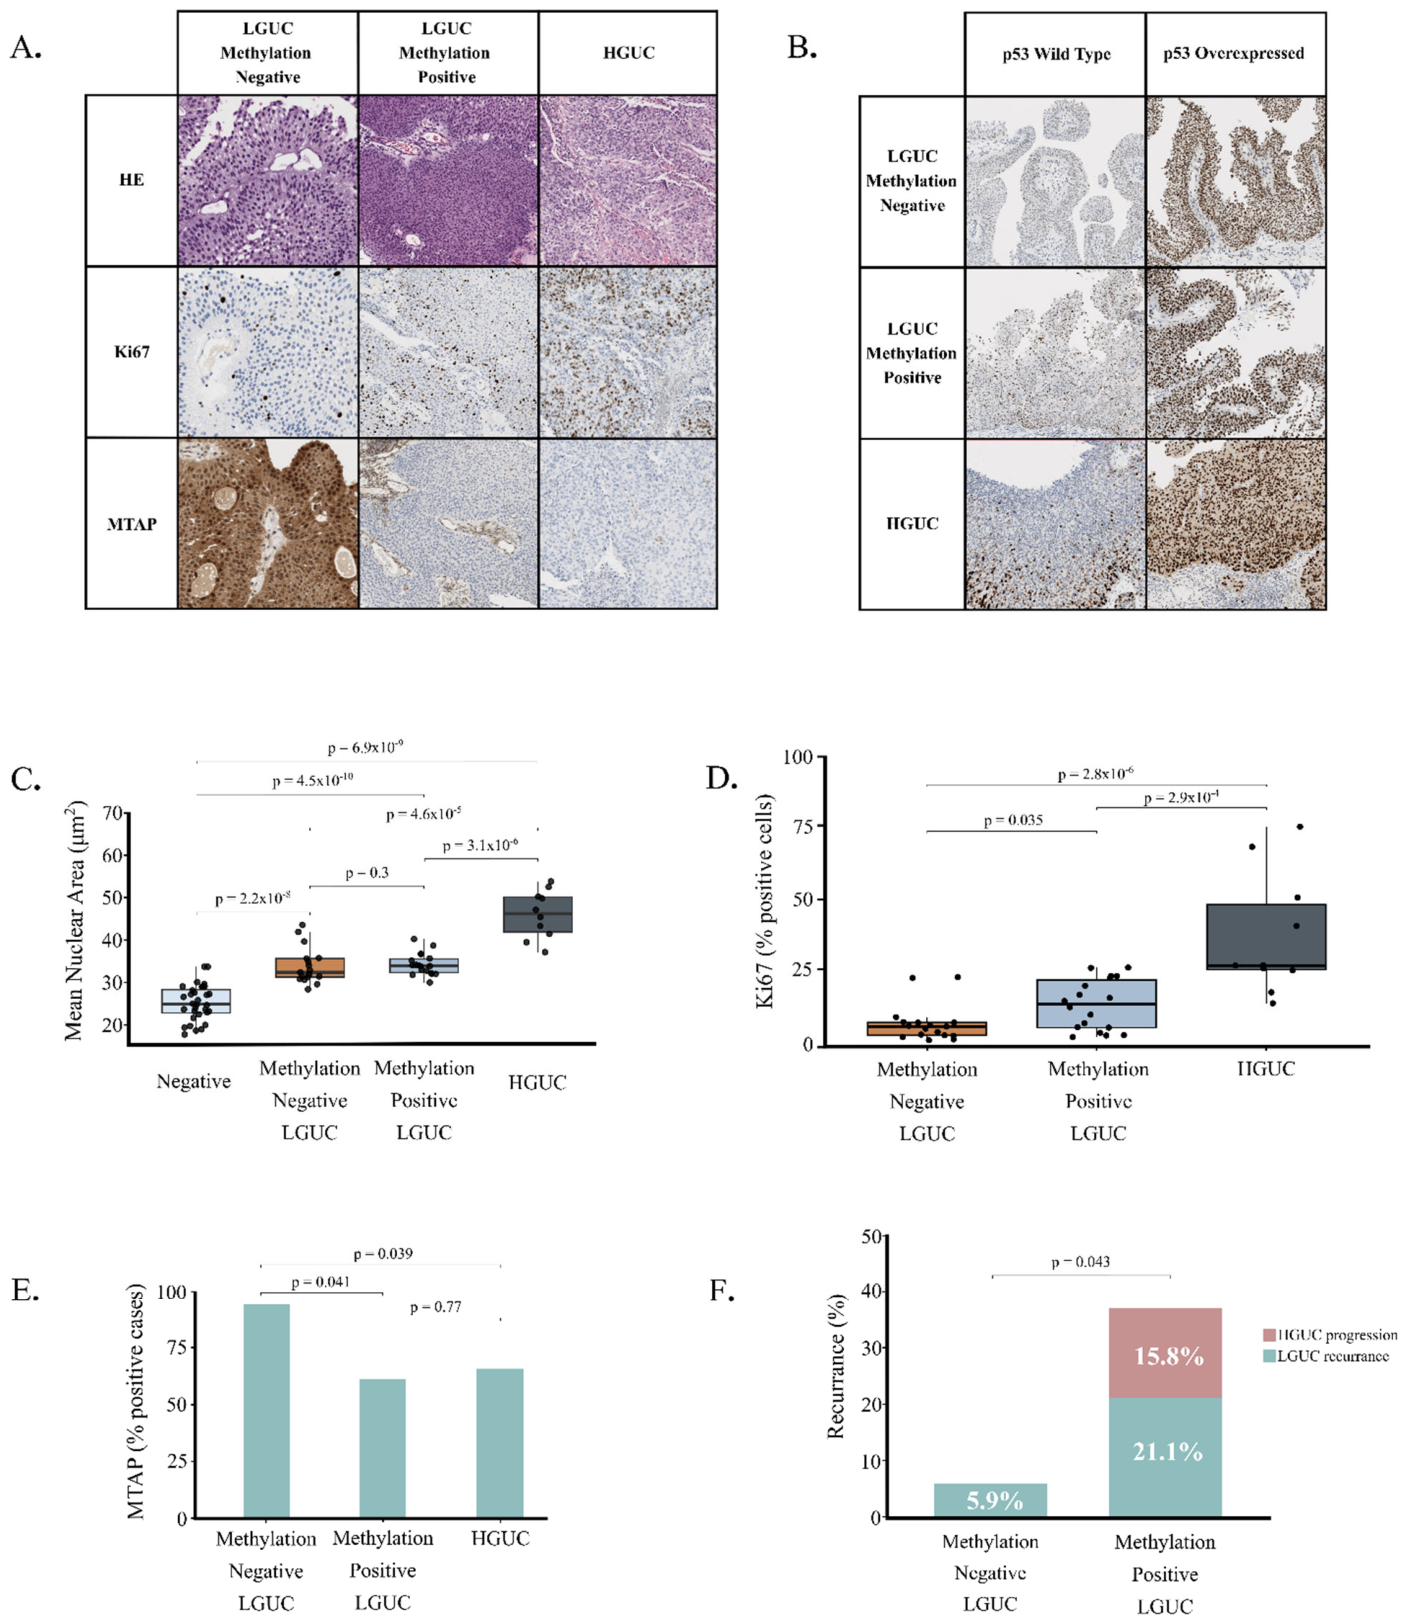
Figure 4.
Integrated factor analysis reveals distinct molecular-histopathological clustering according to methylation status, Ki-67 proliferation index, MTAP expression and tumor grade in urothelial carcinoma. (A) Factorial map generated by Factor Analysis of Mixed Data (FAMD) integrating urinary methylation status, Ki-67 proliferation index, MTAP expression and clinicopathological variables. Individual cases Individual cases are projected onto the first two dimensions and colored according to histological classification: methylation-negative low-grade urothelial carcinoma (LGUC), methylation-positive LGUC, and high-grade urothelial carcinoma (HGUC). Dashed ellipses indicate the 68% confidence regions for each group. Dimension 1 (55.8% of explained variance) primarily separates methylation-negative LGUC from HGUC, whereas methylation-positive LGUC occupies an intermediate position, suggesting a transitional molecular phenotype. Dimension 2 accounts for an additional 27.9% of the variance. (B) Distribution of Dimension 1 scores across histological groups. Boxplots display the median, interquartile range, and individual observations. Dimension 1 scores differed significantly among groups, with methylation-positive LGUC showing significantly higher values than methylation-negative LGUC and lower values than HGUC (Holm-adjusted Wilcoxon rank-sum test), supporting a progressive shift in the integrated molecular profile associated with MTAP methylation and increasing tumor grade.
Figure 4.
Integrated factor analysis reveals distinct molecular-histopathological clustering according to methylation status, Ki-67 proliferation index, MTAP expression and tumor grade in urothelial carcinoma. (A) Factorial map generated by Factor Analysis of Mixed Data (FAMD) integrating urinary methylation status, Ki-67 proliferation index, MTAP expression and clinicopathological variables. Individual cases Individual cases are projected onto the first two dimensions and colored according to histological classification: methylation-negative low-grade urothelial carcinoma (LGUC), methylation-positive LGUC, and high-grade urothelial carcinoma (HGUC). Dashed ellipses indicate the 68% confidence regions for each group. Dimension 1 (55.8% of explained variance) primarily separates methylation-negative LGUC from HGUC, whereas methylation-positive LGUC occupies an intermediate position, suggesting a transitional molecular phenotype. Dimension 2 accounts for an additional 27.9% of the variance. (B) Distribution of Dimension 1 scores across histological groups. Boxplots display the median, interquartile range, and individual observations. Dimension 1 scores differed significantly among groups, with methylation-positive LGUC showing significantly higher values than methylation-negative LGUC and lower values than HGUC (Holm-adjusted Wilcoxon rank-sum test), supporting a progressive shift in the integrated molecular profile associated with MTAP methylation and increasing tumor grade.
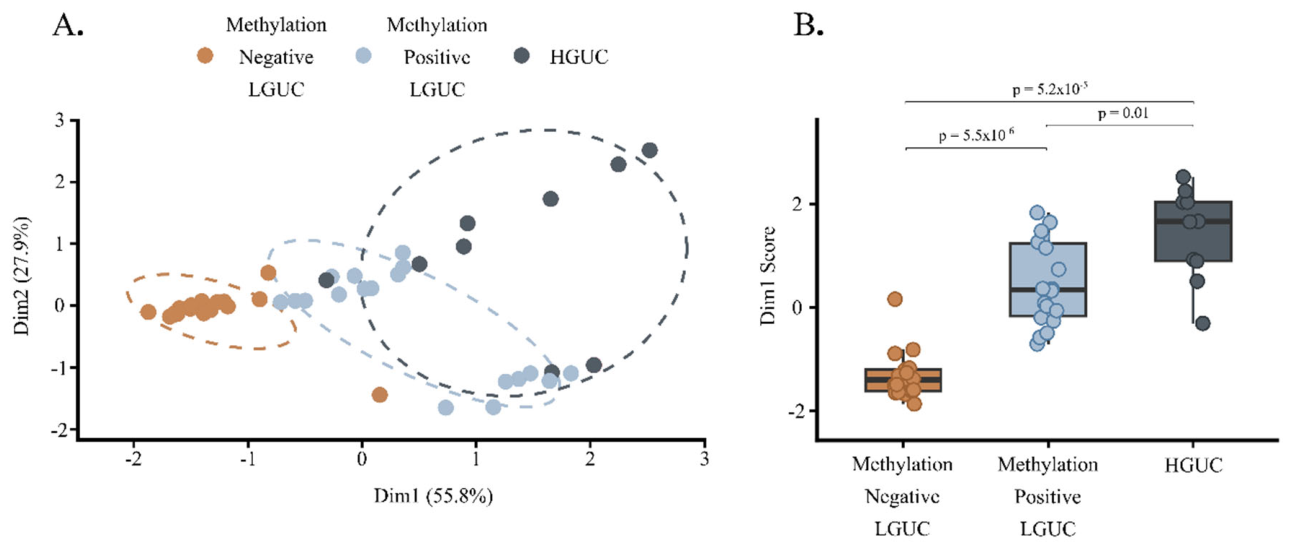

Table 1.
Clinicopathological, cytological, and methylation characteristics of the study cohort according to histopathological diagnosis.
Table 1.
Clinicopathological, cytological, and methylation characteristics of the study cohort according to histopathological diagnosis.
|
Negative n = 38 |
LGUC n = 37 |
HGUC n = 59 |
|
| Man, n (%) | 36 (94.7) | 31 (83.8) | 48 (81.3) |
| Age, years b,c | 67 [60–75] | 71 [61–77] | 75 [68–79] |
| Cytology (Paris System), n (%)a,b,c | |||
| Unsatisfactory (Paris I) | 10 (26.3) | 0 | 0 |
| Negative for HGUC (Paris II) | 14 (36.8) | 22 (59.5) | 10 (17.0) |
| Atypical urothelial cells (Paris III) | 8 (21.0) | 12 (32.4) | 12 (20.3) |
| Suspicious for HGUC (Paris IV) | 6 (15.9) | 3 (8.1) | 20 (33.9) |
| Positive HGUC (Paris V) | 0 | 0 | 17 (28.8) |
| Invasion, n (%) b,c | |||
| Without | 38 (100.0) | 37 (100.0) | 20 (34.0) |
| Connective tissue | 0 | 0 | 26 (44.0) |
| Muscle | 0 | 0 | 13 (22.0) |
| Methylation test, n (%) a,b,c | |||
| Negative | 31 (81.6) | 18 (48.6) | 5 (8.5) |
| Positive | 7 (18.4) | 19 (51.4) | 54 (91.5) |
| Methylation score a,b,c | 29 [17–39] | 62 [22–74] | 90 [79–95] |
* Significant differences (p-value <0.05) in comparisons are indicated by a Negative Bx vs. LGUC, b Negative Bx vs. HGUC and c LGUC vs. HGUC.
Table 2.
Quantitative digital pathology features across histopathological categories and methylation-defined low-grade urothelial carcinoma subgroups.
Table 2.
Quantitative digital pathology features across histopathological categories and methylation-defined low-grade urothelial carcinoma subgroups.
| Cell Density (cells/mm2) | Mean Nuclear Area (µm2) | |
|---|---|---|
| Negative Bx | 7326.8 [5010.9–8658.6] | 24.9 [22.8–28.3] |
| LGUC | 5218.1 [4753.4–5858.0] | 33.8 [31.9–35.6] |
| Methylation Negative LGUC | 5161.2 [4841.3–5522.7] | 32.4 [31.2–35.6] |
| Methylation Positive LGUC | 5410.1 [4693.3–6169.9] | 34.0 [32.3–35.5] |
| HGUC | 4847.2 [4251.8–5202.3] | 46.3 [41.9–50.2] |
Disclaimer/Publisher’s Note: The statements, opinions and data contained in all publications are solely those of the individual author(s) and contributor(s) and not of MDPI and/or the editor(s). MDPI and/or the editor(s) disclaim responsibility for any injury to people or property resulting from any ideas, methods, instructions or products referred to in the content. |
© 2026 by the authors. Licensee MDPI, Basel, Switzerland. This article is an open access article distributed under the terms and conditions of the Creative Commons Attribution (CC BY) license.
Copyright: This open access article is published under a Creative Commons CC BY 4.0 license, which permit the free download, distribution, and reuse, provided that the author and preprint are cited in any reuse.