

Submitted:
02 September 2026
Posted:
03 September 2026
You are already at the latest version
Abstract
Rapid interruption of ebolavirus transmission depends on surveillance that converts alerts into investigation, classification, sampling and care while sustaining contact follow-up, active case finding, laboratory processing and border screening. By 25 August 2026, the Democratic Republic of the Congo (DRC) had reported 5,713 confirmed cases and 2,744 confirmed deaths across 58 health zones in six provinces. A retrospective descriptive ecological analysis was conducted using the national situation-report series from the 2026 Bundibugyo virus disease outbreak in the DRC, with chronology and operational context triangulated against official WHO and Africa CDC reports. Of 103 expected report positions through 25 August 2026, 96 (93.2%) were available, yielding 2,375 source-derived records. Strict source-linkability rules were applied without imputation. Median cumulative alert-investigation coverage was 88.5% (IQR 79.9–94.2; n=97), sampling coverage 66.7% (IQR 54.5–74.6; n=5), validation yield 26.0% (IQR 20.2–74.2; n=35), contact follow-up 78.2% (IQR 67.3–82.9; n=90), and point-of-entry/point-of-control screening approximately 98.0% (IQR 96.0–98.8; n=32). Reported completion within 44 source-defined compatible laboratory specimen cohorts ranged from 89% to 100%; these observations should not be interpreted as independent measures of overall laboratory throughput. Most process indicators were cumulative status measures reported at successive dates and should not be interpreted as independent daily performance. Under the primary national-first date-level hierarchy, 71 qualifying reporting observations were identified. Contact follow-up was the lowest measured process in 55 observations (77.5%), followed by alert investigation in 12 (16.9%), sampling in three (4.2%) and point-of-entry/point-of-control screening in one (1.4%); laboratory processing was not uniquely lowest in any observation, and no ties occurred. Contact follow-up remained dominant in the province-first sensitivity analysis (67/94; 71.3%). Active case finding was documented early and later incorporated into routine health-zone surveillance, but implementation gaps occurred in some high-risk areas and population-level coverage could not be quantified. Official reports documented logistical constraints, insecurity, community resistance and limited trust that disrupted field access, alert investigation, specimen collection and transport, and contact follow-up. Public reporting did not consistently link validated or sampled alerts to same-cohort Ebola treatment centre transfer. Contact follow-up emerged as the dominant recurrent measurable bottleneck. Strengthening contact follow-up, active case-finding capacity, field logistics, community trust and safe access, together with cohort-linked reporting from alert through sampling, isolation and referral, should strengthen early detection, accelerate diagnosis and care, and help limit continued community transmission.
Keywords:
Bundibugyo virus disease
; Ebola
; outbreak surveillance
; active case finding
; contact tracing
; alert investigation
; point-of-entry screening
; Democratic Republic of the Congo
Introduction
Bundibugyo virus disease (BVD) is an Ebola disease caused by Bundibugyo virus (BDBV), an ebolavirus first identified during the 2007 outbreak in western Uganda [1]. Clinical features overlap substantially with other severe febrile illnesses and with Ebola disease caused by other ebolaviruses, making early recognition dependent on sensitive surveillance, rapid investigation and laboratory confirmation rather than on a pathognomonic clinical presentation [1,2]. In the first recognized BVD outbreak, approximately 40% of laboratory-confirmed patients died, illustrating both the severity of disease and the need for rapid case detection and supportive care [2].
In 2026, a high-mortality cluster in Mongbwalu Health Zone, Ituri Province, preceded confirmation of BVD. WHO reported receiving a signal of a high-mortality illness on 5 May, and the Institut National de Recherche Biomédicale (INRB) subsequently confirmed BDBV in samples from Ituri; the Democratic Republic of the Congo (DRC) Ministry of Health declared the country's 17th Ebola disease outbreak on 15 May [3,4]. WHO determined on 17 May that the event constituted a Public Health Emergency of International Concern (PHEIC) under the International Health Regulations (IHR), and Africa CDC declared a Public Health Emergency of Continental Security on 18 May [5,6]. These escalations reflected rapid geographic expansion, cross-border exportation, population mobility, insecurity and uncertainty about the scale of transmission [5,6,7,8].
An earlier operational epidemiology analysis reconstructed the detection interval and early geographic expansion through a primary DRC data lock of 27 May 2026, showing that outbreak visibility was shaped by diagnostic delay, laboratory pressure, contact-tracing gaps, healthcare-linked exposure and operational constraints [7]. That analysis focused on the early phase. The subsequent expansion raised a different operational question: whether the surveillance pathway continued to convert alerts into investigated, classified and sampled events while sustaining contact follow-up, active case finding, laboratory processing and border screening as the outbreak scaled. By the study’s analytic data lock of 25 August 2026, the DRC had reported 5,713 confirmed cases, 2,744 confirmed deaths and 58 affected health zones across six provinces [9]. A WHO update published on 28 August, after the analytic data lock, reported 5,794 confirmed cases, 2,786 deaths and 60 affected health zones as of 26 August [10]. This study examined the longitudinal operational surveillance cascade during the 2026 BVD outbreak in DRC using public routine situation-report data. The objectives were to quantify reporting completeness; reconstruct early active case finding readiness and subsequent implementation; estimate strictly linkable alert-investigation, validation-yield and sampling measures; assess parallel contact-follow-up, point-of-entry/point-of-control (PoE/PoC) and laboratory-processing indicators; and identify the recurrent lowest measured operational process over time. To the author’s knowledge, no previous analysis of the 2026 BVD outbreak has longitudinally reconstructed the operational surveillance pathway from reported alerts through investigation, validation and sampling while simultaneously examining contact follow-up, active case finding, PoE/PoC screening, laboratory processing and the linkability of surveillance records to Ebola treatment centre (ETC) referral.
Materials and Methods
Ethics Statement
This study used only publicly available, aggregate outbreak situation-report series and official public-health documents. No individual-level records, direct identifiers or potentially identifying personal data were accessed, and there was no interaction or intervention involving human participants. Institutional ethics approval and individual informed consent were therefore not required.
Study Design and Setting
A retrospective descriptive ecological study of routine public-health reporting from the 2026 BVD outbreak in DRC was conducted. The study was designed as an operational surveillance analysis rather than an individual-level effectiveness study. Metric-specific process summaries were analysed at the province-indicator-date level, with a national value used for a metric-date only when no province-level observation for that metric and date was available. The primary bottleneck analysis used the separate national-first date-level hierarchy described below. Health-zone observations were retained for contextual and exploratory use but were excluded from headline process and bottleneck estimates to avoid mixing analytical scales.
Data Sources and Study Period
The primary data sources were official Centre des Opérations d'Urgences de Santé Publique/Institut National de Santé Publique (COUSP/INSP) daily situation reports (SitReps) for the 17th Ebola disease outbreak in DRC [9]. The planned source frame comprised SitRep positions 001 through 103, ending with reporting date 25 August 2026 and publication date 26 August 2026. WHO African Region weekly external situation reports and Africa CDC reports were used to triangulate chronology and broader epidemiological and operational context; values from those sources did not replace DRC-source values [11,12,13]. Official WHO and Africa CDC statements were used to verify declaration and governance milestones [5,6]. Each SitRep position was inventoried separately so that duplicates, source-own numbering anomalies and unavailable reports could be distinguished. Seven expected SitRep positions were unavailable: 003, 029, 043, 045, 063, 075 and 076. No values were reconstructed or imputed for these positions.
Across positions 001–103, 96 reports (93.2%) were available and yielded 2,375 source-derived records (Figure 1). Source-date discrepancies were resolved using the date consistently supported by substantive report content. SitRep 004 displayed 19 May 2026 on the cover, whereas its epidemiological, alert and laboratory sections consistently reported data as of 18 May; 18 May was therefore used as the resolved reporting date. Unless explicitly identified by the source as a daily measure, surveillance-process percentages were treated as cumulative status measures at the corresponding report date. The reporting date indexed the observation but did not imply that the numerator and denominator represented events occurring exclusively on that day.
Data Extraction, Harmonization and Quality Assurance
A controlled extraction schema separated source identity, reporting and publication dates, indicator date, geography, source wording, numeric and text values, units, time basis and analytical linkability. The final database contained 2,375 source-derived records and 67 controlled indicators grouped into six operational domains: epidemiological context (cases, deaths, recoveries and affected geographies); alert surveillance (reported, investigated, validated and sampled alerts); case management (isolation/hospitalization, admissions, exits, recoveries, deaths and related capacity indicators); contact tracing (contacts listed, under follow-up, seen, completed or missed); laboratory (specimens collected/received, analysed, positive, negative, pending and related processing constraints); and PoE/PoC surveillance (travellers passing monitored points, screening coverage, alerts and referrals). For reporting-completeness assessment, each available SitRep constituted one reporting observation; a domain was considered reported when at least one assigned indicator or explicit domain-specific operational datum was extractable and absent when no information for any assigned indicator was reported. Explicit zero values were retained as reported observations rather than classified as missing. The complete controlled-indicator dictionary is provided in S1 Data.
Active case-finding and early-readiness information was extracted separately from structured and narrative reporting because consistent denominators were unavailable. These data included facility- and community-based searches, retrospective case/death searches, surveillance-team deployment, contact pre-listing, isolation and triage readiness, supplies, training, transport constraints and documented access or community-trust barriers. They were used to reconstruct implementation chronology and operational context rather than to estimate active case-finding coverage.
Source-reported inconsistencies were preserved rather than silently harmonized, and all values used in the final analysis were cross-checked against source reports. Not all extracted indicators entered the bottleneck analysis: eligible performance measures were alert-investigation coverage, sampling coverage, contact-follow-up coverage, PoE/PoC screening coverage and strict laboratory-processing coverage. Validation yield, laboratory positivity and PoE/PoC alert yield were excluded from performance ranking, while case-management indicators were treated as parallel operational context because same-cohort linkage to preceding alert stages was generally unavailable.
Two source-semantics rules were especially important. First, where PoE/PoC tables reported traveller counts and screening percentages without an absolute screened numerator, the source-reported percentage was retained without constructing a synthetic numerator. Second, laboratory processing was considered linkable only when the source explicitly defined a compatible specimen cohort and reporting window; arithmetic equality between collected or received and analysed counts was not sufficient on its own. Derived laboratory-processing coverage therefore represented completion within source-defined compatible specimen cohorts rather than overall laboratory throughput.
Operational Definition of Active Case Finding
For this study, active case finding (active case search) was defined, consistent with WHO Ebola surveillance guidance, as the proactive search for persons or deaths meeting the outbreak suspected-case definition in health facilities or communities, rather than reliance on passive notification alone [14]. Activities were classified according to the operational setting explicitly described in source reports. Facility-based active case finding comprised proactive searches in health facilities, including register or record review and identification of suspected cases or deaths. Targeted or hotspot-based active case finding comprised focused searches in affected or high-risk communities, health areas, transmission hotspots, contact networks or locations reporting unexplained illness or deaths. Household-based active case finding required explicit documentation of systematic household-to-household search across a defined population; generic community-based surveillance or unspecified “active case finding” was not interpreted as evidence of population-wide coverage. Active case finding was distinguished from routine alert management. Once an alert entered the surveillance system, investigation, validation, sampling, isolation and referral were considered components of the alert-management cascade, irrespective of the alert source. Because SitReps did not consistently report denominators such as households visited, facilities searched, registers reviewed or persons screened, active case-finding coverage could not be quantified. Implementation was therefore reconstructed chronologically from explicit descriptions of facility, community and hotspot searches, death searches, retrospective record review and deployment of surveillance personnel.
Early Active Case-Finding Readiness
Early active case-finding readiness was reconstructed from dated source narratives and structured indicators. Prespecified milestones included the earliest documented symptom-onset anchor, the first community mortality signal, formal notification, the first documented organized active-search or field-investigation activity, the national outbreak declaration and the international emergency declaration. Readiness constraints were retained only when explicitly documented in the source reports. These included incomplete contact pre-listing, absence or inadequacy of compliant isolation and triage arrangements, shortages of infection prevention and control (IPC) or specimen-collection supplies, gaps in staff training, and logistical or operational constraints affecting field investigation and movement. These indicators were used to characterize the operational conditions under which active case finding and related surveillance activities were initiated and scaled up.
Strict Linked Surveillance Cascade
The strict quantitative cascade was defined as reported alerts to investigated alerts to validated alerts to sampled suspected cases. Alert investigation coverage was calculated as investigated alerts divided by total reported alerts when numerator and denominator referred to the same geography and reporting window. Validation yield was calculated as validated alerts divided by investigated alerts under the same compatibility rule. Because validation depends on the alert definition and represents the proportion of investigated alerts meeting a suspected-case classification, it was treated as a classification yield rather than a performance target. Sampling coverage was calculated as sampled suspected cases divided by validated alerts only when the source supported a common cohort or compatible reporting window.
Although case-management indicators, including admissions, exits and patient stocks, were extracted, public SitReps did not consistently identify whether people admitted or transferred to an ETC were the same individuals represented in the validated or sampled alert denominator. ETC admissions and patient-stock measures were therefore treated as parallel case-management context. An end-to-end alert-to-ETC transfer proportion was not calculated because doing so would have required linking non-equivalent aggregate cohorts.
Parallel Operational Indicators
Contact follow-up coverage was calculated as contacts seen divided by contacts under follow-up when both values were compatible. PoE/PoC screening coverage was calculated from explicit screened and passed counts when available; when only a percentage was reported, that value was used directly. Laboratory processing coverage was calculated as analysed specimens divided by the explicitly compatible collected or received cohort. These measures were analysed separately from validation yield because they represent process coverage rather than classification yield. Unless explicitly reported as daily measures, process percentages were treated as cumulative status measures at the corresponding reporting date.
Bottleneck Classification
For bottleneck classification, a reporting observation was defined as the set of eligible process measures for one analytic geography and indicator date. To avoid representing the same date simultaneously at national and provincial scales, a national-first date-level hierarchy was applied. When at least two eligible process measures were available nationally on a date, one national reporting observation was retained and province-level observations on that date were not additionally counted. When a qualifying national observation was unavailable, each province with at least two eligible process measures could contribute one province-level reporting observation. Health-zone observations were excluded. The eligible process measures were alert investigation, sampling coverage, contact follow-up, PoE/PoC screening and strict laboratory processing. Unless explicitly identified by the source as daily, these process values represented cumulative status at that observation. Validation yield, laboratory positivity and PoE/PoC alert yield were excluded from performance ranking. The lowest measured cumulative percentage was classified as the weakest measured process; equal lowest values were retained as ties. This was a comparative ranking and not a judgement against an external performance threshold. As a sensitivity analysis, the metric-specific province-first rule used for process summaries was applied to the bottleneck classification, with national values used only for metric-dates lacking a province-level value.
Statistical Analysis
Source availability and domain completeness were summarized using counts and percentages. Process indicators were described using the number of eligible reporting observations, median, interquartile range (IQR) and range, as appropriate. Quartiles and IQRs used the Weibull/sample quantile definition implemented in the reproducibility code. Bottleneck classifications were summarized as counts and percentages of qualifying geography-date reporting observations. Study size was determined by the complete planned SitRep series through the prespecified data lock; no sample-size calculation was applicable. Because the analysis was descriptive, no inferential hypothesis tests, significance thresholds or model assumptions were prespecified. Analyses were implemented in Python 3.12 using a version-controlled analytic specification, missing source values were not imputed, and the full reproducibility package is provided as S2 Code. Reporting followed the Strengthening the Reporting of Observational Studies in Epidemiology (STROBE) statement, S1 Checklist [15].
Use of Artificial Intelligence Tools and Technologies
Anthropic Claude (Claude Sonnet 5; Anthropic) and OpenAI ChatGPT (GPT-5.6 Sol; OpenAI) were used for language editing, formatting, and code support. AI tools did not generate, alter or impute any source-derived data. All scientific interpretations, analytical decisions and responsibility for the final content remained with the author.
Results
Data Availability and Reporting Completeness
The final analytic dataset comprised 96 available reports in the national situation-report series, yielding 2,375 source-derived records. Among the available reports, reporting completeness was highest for epidemiological context (96/96, 100%) and alert surveillance (90/96, 93.8%), but was lower for laboratory indicators (71/96, 74.0%) and PoE/PoC indicators (44/96, 45.8%) (Table 1).
The domain profile showed that absence of an entire SitRep was not the principal source of missing operational information. Instead, reporting was structurally uneven across domains: epidemiological context and alerts were nearly continuous, while PoE/PoC and laboratory measures were less consistently available (Figure 2).
Implementation and Scale-Up of Active Case Finding
The earliest documented symptom onset was 24 April 2026, followed by a community mortality signal involving unexplained clustered deaths in Mongbwalu on 5 May and formal notification on 8 May [7,9]. Structured field investigation was documented from 12 May, and active case-finding activities were recorded before the national outbreak declaration. SitRep 001, reporting activities through 14 May, described active searches for community and intrahospital deaths, strengthened active surveillance in the CECA 20, Mongbwalu and Abelkozo health areas, and active search for suspected haemorrhagic-fever cases at Mongbwalu Hospital, alongside incomplete preliminary contact listing [9]. The DRC declared the outbreak on 15 May, and WHO determined that the event constituted a PHEIC on 17 May [3,5].
Active case finding was subsequently incorporated into the organized surveillance response. SitRep 004 documented briefing of surveillance teams on alert management, investigation, active case finding, contact listing and contact follow-up, together with deployment of surveillance teams to Bunia, Rwampara and Nyankunde health zones; SitRep 005 subsequently reported active case finding in Bunia, Bambu, Rwampara and Nyankunde [9]. WHO identified active case finding as a priority response measure on 15 May [16] and, in temporary recommendations issued on 22 May, called for dedicated health-zone surveillance teams, active case finding, enhanced community surveillance for clusters of unexplained illness or deaths, and investigation of alerts within 24 hours [17].
By 30 May, DRC reporting described active case finding as part of routine field surveillance alongside alert notification and investigation, contact listing and follow-up, and retrospective review of cases and deaths [9]. Africa CDC reported that these activities were ongoing but constrained by human-resource shortages and insecurity that delayed surveillance and case detection. Its 30 May report further noted incomplete deployment of multidisciplinary rapid-response teams to Mongbwalu, Aru and other high-risk health zones and recommended accelerated deployment of community health workers to address gaps in contact tracing and active case finding [12]. These deployment gaps and the need to strengthen contact tracing and active case finding were reiterated on 2 June [13].
As transmission expanded, proactive case detection operated alongside the formal health-zone alert-management system. By 26 July, more than 55,000 alerts had been recorded nationally since the outbreak declaration. WHO reported widespread community transmission, many new confirmed cases outside known contact lists and almost half of daily new confirmed cases being detected as deaths, attributing late detection to the geographic scale of transmission, insufficient surveillance personnel, limited community trust, insecurity and other response constraints [18]. These observations indicate persistent limitations in early case detection but are not a direct quantitative measure of active case-finding coverage. Active case finding remained an explicit response priority through the end of the study period. WHO's updated temporary recommendations of 24 August continued to call for dedicated surveillance and response teams, active case finding and enhanced community surveillance, investigation of alerts within 24 hours, and strengthened decentralized laboratory capacity [19]. Across the study period, however, series reports did not consistently specify active-search modality or report denominators needed to determine the geographic reach or completeness of household- or population-based active case finding.
Strict Linked Surveillance Cascade
The cascade measures were predominantly cumulative source-reported indicators observed at successive reporting dates rather than daily incident-flow measures. Accordingly, medians summarize the distribution of cumulative coverage values across eligible province- or national-level reporting observations and should not be interpreted as median daily performance. Under the prespecified strict linkability rules, alert investigation was the most consistently measurable component of the surveillance cascade. Across 97 eligible province- or national-level observations, the median proportion of reported alerts investigated was 88.5% (IQR 79.9–94.2; range 51.4–100%). Validation yield was estimable for 35 strictly linked observations, with a median of 26.0% (IQR 20.2–74.2; range 0–95.5%). Strictly linked sampling coverage was measurable in only five observations and had a median of 66.7% (IQR 54.5–74.6; range 45.2–80.6%) (Table 2).
The limited number of strictly linkable sampling observations reflected the requirement for source-compatible numerator–denominator linkage and the frequent absence of clearly matched validated-alert and sampled-case denominators, rather than limited sampling activity. Consequently, sampling coverage should be interpreted as coverage within compatible reported cohorts, not as a complete measure of national sampling performance. Although case-management data were reported in 86 of 96 available SitReps, a validated or sampled alert could not consistently be linked to a same-cohort ETC transfer or admission. Consequently, no end-to-end alert-to-ETC transfer proportion was estimated.
Contact Follow-Up, PoE/PoC Screening and Laboratory Processing
Cumulative contact follow-up coverage was measurable in 90 eligible reporting observations and had a median of 78.2% (IQR 67.3–82.9%). Cumulative PoE/PoC screening coverage was available for 32 eligible reporting observations after correction of percentage-only source tables. Where both screened and traveller counts were explicitly reported, screening coverage was calculated directly; where only a percentage was reported, the source-reported percentage was retained without imputing an absolute screened numerator. Median cumulative PoE/PoC screening coverage was approximately 98.0% (IQR 96.0–98.8%) (Table 3).
Laboratory processing was measurable for 44 source-defined compatible specimen cohorts, with reported completion ranging from 89% to 100%. Most observations reflected source statements that the same cohort was collected or received and analysed and therefore represent cohort completion rather than independent measurement of overall laboratory throughput.
A localized exception occurred in North Kivu on 22 June, when 65 of 73 collected specimens had been analysed (89.0%) and eight remained under analysis [9]. Arithmetic equality between collected or received and analysed counts was not considered sufficient for linkage unless the source explicitly defined a common specimen cohort.
Operational Bottleneck Classification
Seventy-one qualifying geography-date reporting observations across 71 indicator dates were included in the primary weakest-process classification: 69 were national observations and two were Ituri province-level observations used when no qualifying national observation was available. Contact follow-up was the lowest measured cumulative process in 55/71 observations (77.5%), followed by alert investigation (12/71, 16.9%), sampling coverage (3/71, 4.2%) and PoE/PoC screening (1/71, 1.4%); no ties occurred (Table 4). Laboratory processing was not uniquely lowest in any observation. Validation yield was excluded because it represented classification yield rather than process performance. In sensitivity analysis using the metric-specific province-first rule, contact follow-up remained the dominant lowest measured process in 67/94 observations (71.3%), followed by alert investigation in 15/94, PoE/PoC screening in 7/94 and sampling in 3/94; two observations were ties.
The repeated ranking of contact follow-up as the lowest measured process was consistent with its lower overall median coverage and identified it as the dominant recurrent measured bottleneck under both the primary and sensitivity geographic-selection rules (Figure 3).
The weakest-process classification was comparative and did not by itself denote failure against an external performance standard. Under the primary hierarchy, PoE/PoC screening was the lowest available process in one observation, with coverage of 94.4%. Under the metric-specific sensitivity analysis it was lowest in seven observations, with coverage ranging from 94.0% to 98.0%. Source narratives provided direct operational context for selected quantitative bottlenecks. On 22 June, the SitRep reported that alerts in South Kivu were not investigated because field teams lacked fuel for movement; the same reporting date documented the North Kivu laboratory backlog of eight specimens [9].
Discussion
This longitudinal operational analysis found generally strong but incomplete cumulative alert-investigation coverage across the 2026 BVD surveillance response, with greater unevenness across the broader surveillance pathway. Contact follow-up was the dominant recurrent measured bottleneck, while sampling coverage was much less frequently estimable, PoE/PoC screening was generally high when reported, and laboratory cohort completion was generally high within source-defined compatible specimen cohorts. Active case finding was documented from the early response and later incorporated into routine surveillance, but official reports identified implementation gaps in high-risk areas and did not provide sufficient detail to quantify household- or population-level coverage. Transport, insecurity and laboratory constraints periodically disrupted surveillance functions. Finally, routine situation-report series did not preserve sufficiently consistent cohort linkage to estimate a defensible end-to-end alert-to-ETC transfer proportion.
Alert Investigation and the Meaning of Validation Yield
The median alert-investigation coverage of 88.5% indicates that most reported alerts were investigated, although the observed minimum of 51.4% shows periods of substantial incompleteness. In an Ebola response, the operational objective is complete and timely investigation of alerts; WHO recommended that alerts be investigated within 24 hours of detection [17]. In the 2018–2020 eastern DRC outbreak, Keita and colleagues similarly reported rapid investigation of most alerts, while only 15.8% were subsequently validated as suspected cases [20]. Although these measures are not directly interchangeable with the aggregate SitRep indicators used here, they illustrate why investigation coverage and validation yield should be interpreted separately. A low validation yield may reflect a sensitive alert system rather than poor performance, whereas high validation yield may indicate more selective or later alert generation. The median validation yield of 26.0% was therefore excluded from the weakest-process ranking.
Contact Follow-Up as the Dominant Recurrent Bottleneck
Contact follow-up was the clearest persistent weakness in the measurable response architecture. WHO identifies contact tracing as a core outbreak-control intervention whose effectiveness depends on complete identification, timely initiation and active follow-up adapted to local context and workforce capacity [21]. Ebola experience shows that these functions become difficult to sustain as case numbers, mobility and insecurity increase. Large-scale contact-tracing records from Liberia demonstrated substantial operational attrition and geographic heterogeneity [22], while analysis from North Kivu found a higher risk of incomplete follow-up in urban and conflict-affected health zones [23]. The control relevance of this finding is reinforced by the 2022 Sudan virus disease outbreak in Uganda. Confirmed cases who were known contacts before symptom onset reached isolation and laboratory confirmation sooner and had substantially lower onward transmission than cases not previously known as contacts [24]. The finding that contact follow-up was the lowest measured process in 55 of 71 primary reporting observations (77.5%), with the same ranking retained in sensitivity analysis (67/94, 71.3%), therefore identifies a recurrent vulnerability in the pathway by which exposed persons are recognized, isolated and tested before prolonged community transmission. Although these cumulative status measures are not directly equivalent to a daily performance target, their recurrent low ranking is operationally important in the context of the ≥95% daily contact-follow-up target called for by Africa CDC and WHO during the outbreak [25].
Active Case Finding and Early Surveillance Readiness
Active case finding was documented from the early response, but implementation was neither uniform nor sufficiently reported to establish its geographic reach or completeness. DRC SitReps described facility-based and targeted searches, retrospective searches for cases and deaths, and later incorporation of active case finding into routine surveillance [9]. WHO recommended dedicated health-zone surveillance teams, active case finding, enhanced community surveillance and investigation of alerts within 24 hours [17,21]. Africa CDC nevertheless documented incomplete multidisciplinary rapid-response-team deployment in Mongbwalu, Aru and other high-risk health zones and recommended accelerated community-health-worker deployment to strengthen contact tracing and active case finding [12,13]. The evidence therefore supports early implementation, but not systematic household-to-household coverage across affected health zones. Experience from previous ebolavirus outbreaks similarly shows that effective case detection depends on functioning community and facility surveillance, trained personnel and referral pathways rather than the nominal presence of active case finding alone [26,27,28]. This distinction remained important as the 2026 outbreak expanded. By 26 July, WHO reported widespread community transmission, many confirmed cases outside known contact lists and almost half of daily new confirmed cases being detected as deaths, alongside insufficient surveillance personnel, insecurity and limited community trust [18]. Although these findings do not quantify active case-finding coverage, they indicate persistent gaps in early case detection. WHO continued to recommend active case finding and enhanced community surveillance on 24 August [19].
Laboratory Processing and the Importance of Cohort-Defined Reporting
Reported laboratory cohort completion ranged from 89% to 100% across 44 source-defined compatible observations. Most reflected source statements that the same cohort was collected or received and analysed, so these observations characterize completion within reporting cohorts rather than independent overall laboratory throughput. Laboratory access was not uniformly unconstrained: during the early response, 126 of 774 collected specimens remained pending by 27 May, alongside reduced same-day processing and documented specimen-transport difficulties [7]. Localized backlogs persisted subsequently, including in North Kivu on 22 June, when 65 of 73 specimens had been analysed and eight remained pending. Experience from the 2018–2020 eastern DRC outbreak likewise demonstrated the value of decentralized field laboratories in reducing diagnostic delays in insecure settings [29]. These findings support decentralized testing capacity and explicit cohort-based reporting of specimens collected, received, analysed and pending.
PoE/PoC Screening: High Coverage Does Not Imply High Detection Yield
PoE/PoC screening coverage was high when reported (median 98.0%, IQR 96.0–98.8%) but had the lowest reporting completeness across SitRep domains. Screening coverage reflects implementation rather than diagnostic sensitivity or interruption of cross-border transmission; during the West African Ebola epidemic, airport screening in Sierra Leone processed 166,242 travellers without detecting a laboratory-confirmed case through the screening pathway [30]. PoE/PoC screening was therefore treated as a coverage indicator, not a detection-yield measure. Although it ranked as the lowest measured process in some observations, coverage remained high (94.0–98.0%), illustrating that relative bottleneck classification does not necessarily indicate operational failure. Importantly, reported coverage applied only to monitored points: WHO identified informal crossings and weak PoE alert management as persistent gaps, and regional authorities called for strengthened surveillance at both official and unofficial points of entry [31,32].
Logistics, Insecurity and Trust as Surveillance Determinants
The documented barriers operated through three related pathways: access constraints affecting the ability of teams to reach communities; acceptance and trust constraints affecting investigation, contact follow-up and specimen collection; and security constraints disrupting facilities, personnel movement and continuity of surveillance activities. WHO reported that security incidents against health facilities and community resistance had emerged as major operational challenges in Ituri, including incidents in Mongbwalu and Rwampara that disrupted outbreak-response activities and increased the risk of undetected transmission [33]. By 8 June, WHO had documented 699 incidents of community resistance, including persistent rumours and denial that were undermining response activities [34]. Africa CDC separately reported that 22 specimens were not collected because of community resistance; it also documented threats to burn newly established Ebola-response infrastructure and the physical assault of Red Cross personnel conducting safe and dignified burials [13]. These events illustrate that contact follow-up, active case finding and specimen collection depended not only on workforce and logistics but also on the ability of response teams to enter communities safely and maintain local acceptance. The problem persisted as the outbreak expanded. By 14 August, WHO had recorded 12 attacks on health care since the PHEIC declaration, with additional reports under verification; insecurity and attacks on health facilities were reported to restrict access for response teams, disrupt surveillance and response activities, discourage care seeking and increase the risk of undetected transmission [35]. Community trust and protection of frontline personnel should therefore be considered integral components of surveillance-system functioning rather than ancillary response activities.
Strengths and Limitations
This study used a prespecified source inventory and a locked database covering 96 of 103 planned report positions. Explicit linkability rules prevented incompatible numerators and denominators from being combined, structural missingness was preserved without imputation, and validation yield was distinguished from process performance. Process summaries used metric-specific province-indicator-date observations with national fallback, while the primary bottleneck analysis applied a national-first date-level hierarchy to avoid double-counting national and provincial observations. Quantitative findings were interpreted alongside documented operational constraints, and the final analyses were reproduced from the locked public S1 Data and S2 Code package.
Several limitations remain. SitReps were produced for outbreak management rather than research, and indicator definitions, geographic scope and reporting formats changed over time. Completeness varied across domains; domain-level completeness indicated the presence of at least one assigned datum and did not imply complete reporting of every indicator within a domain. Strict sampling linkage was available for only five observations, and active case-finding coverage could not be quantified because modality-specific denominators were inconsistently reported. The bottleneck denominator varied by geographic-selection rule, although contact follow-up remained the dominant lowest measured process in both the primary and sensitivity analyses (77.5% and 71.3%, respectively). The weakest-process classification was comparative rather than a standardized performance score and did not represent independent daily incident flows. Laboratory processing represented completion within source-defined compatible cohorts and should not be generalized to overall laboratory throughput. Some source-reported percentages were rounded, and occasional internal inconsistencies in aggregate reporting could not be reconciled from the published source material and were therefore retained as reported. The ecological design precludes causal inference, and inconsistent cohort linkage across validation, sampling, isolation and referral prevented estimation of a defensible end-to-end alert-to-ETC transfer proportion. Findings are most directly applicable to outbreak surveillance systems relying on similar aggregate situation-report architectures; transferability may differ where individual-level linkage or more standardized reporting is available.
Conclusions
During the 2026 BVD outbreak in the DRC, cumulative alert-investigation and PoE/PoC screening coverage were generally high when measurable, and reported laboratory cohort completion was high within source-defined compatible specimen cohorts. Contact follow-up emerged as the principal recurrent measured surveillance bottleneck, ranking lowest in 55 of 71 qualifying reporting observations (77.5%) under the national-first primary hierarchy, with the same finding retained in sensitivity analysis (67/94, 71.3%). Active case finding was implemented early through facility-based and targeted searches and later incorporated into routine health-zone and community surveillance, although its geographic reach and completeness could not be quantified from available reporting. Sampling remained sparsely linkable, while documented logistical constraints, insecurity, community resistance and restricted field access were reported to disrupt alert investigation, specimen collection and transport, contact follow-up and other surveillance activities. Public aggregate reporting also lacked sufficiently consistent cohort linkage to reconstruct a valid end-to-end alert-to-ETC pathway. These findings indicate that strong performance at individual surveillance steps does not guarantee effective case detection across the full pathway. Strengthening contact follow-up, active case-finding capacity, field logistics, community trust and safe access, together with cohort-linked reporting from alert through sampling, isolation and referral, should strengthen early detection, accelerate diagnosis and care, and help limit continued community transmission.
Supplementary Materials
The following supporting information can be downloaded at the website of this paper posted on Preprints.org. S1 Checklist. Completed STROBE checklist for this observational study. S1 Data. Locked extracted analysis workbook containing the source-derived data and derived indicators used in the study. S2 Code. Python 3.12 reproducibility package reproducing the reported results.
Author Contributions
T.E.A.: Conceptualization, methodology, data curation, validation, formal analysis, visualization, project administration, writing – original draft, and writing – review and editing. The author approved the final version and accepts responsibility for the work.
Funding
The author received no specific funding for this work.
Data Availability Statement
The primary data sources were publicly available DRC national situation reports issued by the Ministry of Public Health, Hygiene and Social Welfare, the Institut National de Santé Publique and the Centre des Opérations d'Urgences de Santé Publique [9]. WHO and Africa CDC sources used for chronology and operational triangulation are cited individually in the main text. The locked extracted analysis workbook and derived indicators (S1 Data), together with the Python 3.12 reproducibility package used to reproduce the reported results (S2 Code), are Available online the author upon reasonable request. No individual-level, identifiable or restricted data were used.
Acknowledgments
The author acknowledges the Democratic Republic of the Congo Ministry of Public Health, Hygiene and Social Welfare, the Institut National de Santé Publique, the Centre des Opérations d'Urgences de Santé Publique, the Institut National de Recherche Biomédicale, WHO, Africa CDC, and the national and field response teams whose public reporting made this operational analysis possible. The author also acknowledges the affected communities, community health workers, local leaders and frontline responders whose engagement and participation were central to surveillance and outbreak-response activities. The findings and interpretations in this article are those of the author.
Conflicts of Interest
The author declares no competing interests.
References
- Towner, J.S.; Sealy, T.K.; Khristova, M.L.; Albariño, C.G.; Conlan, S.; Reeder, S.A.; et al. Newly Discovered Ebola Virus Associated with Hemorrhagic Fever Outbreak in Uganda. PLoS Pathog. 2008, 4(11), e1000212. [Google Scholar] [CrossRef] [PubMed]
- MacNeil, A.; Farnon, E.C.; Wamala, J.; Okware, S.; Cannon, D.L.; Reed, Z.; et al. Proportion of Deaths and Clinical Features in Bundibugyo Ebola Virus Infection, Uganda. Emerg. Infect. Dis. 2010, 16(12), 1969–72. [Google Scholar] [CrossRef] [PubMed]
- Ministère de la Santé Publique; Het, P.S. Déclaration de la 17e épidémie de la maladie à virus Ebola dans les zones de santé de Rwampara, Mongbwalu et Bunia dans la province de l’Ituri, République Démocratique du Congo; Kinshasa, May 2026. [Google Scholar]
- World Health Organization. Ebola disease caused by Bundibugyo virus, Democratic Republic of the Congo & Uganda, 16 May 2026 [Internet]. 2026. Available online: https://www.who.int/emergencies/disease-outbreak-news/item/2026-DON602 (accessed on 30 May 2026).
- World Health Organization. Epidemic of Ebola Disease caused by Bundibugyo virus in the Democratic Republic of the Congo and Uganda determined a public health emergency of international concern [Internet]. 2026. Available online: https://www.who.int/news/item/17-05-2026-epidemic-of-ebola-disease-in-the-democratic-republic-of-the-congo-and-uganda-determined-a-public-health-emergency-of-international-concern (accessed on 30 May 2026).
- Africa Centres for Disease Control and Prevention (Africa CDC)/Press release. Africa CDC Declares the Ongoing Bundibugyo Ebola Outbreak a Public Health Emergency of Continental Security – Africa CDC [Internet]. 2026. Available online: https://africacdc.org/news-item/africa-cdc-declares-the-ongoing-bundibugyo-ebola-outbreak-a-public-health-emergency-of-continental-security/ (accessed on 30 May 2026).
- Elvis Akem, T.; Calvin Oben, E. Operational epidemiology of the early phase of the 2026 Bundibugyo virus disease outbreak in the Democratic Republic of the Congo and Uganda. Fernandez M del P, editor. In PLOS Global Public Health; 2026; Volume 6, 8. [Google Scholar] [CrossRef] [PubMed]
- Merci Amuda, D.; Araali, B.; Agenonga Chober, A.; Bedford, J.; Boone, D.; Duclos, D.; et al. Note contextuelle sur l’épidémie d’Ebola Bundibugyo en Ituri (2026). HAL Open Sci. 2026, (1), 255. [Google Scholar] [CrossRef]
- Centre des Operations d Urgences de Sante Publique. Rapport de Situation de la 17ème Epidémie de la Maladie à Virus Ebola/RDC [Internet]. 2026. Available online: https://insp.cd/ebola-17eme-epidemie/ (accessed on 8 August 2026).
- World Health Organization. Ebola disease caused by Bundibugyo virus - Democratic Republic of the Congo, 28 August 2026 [Internet]. 2026. Available online: https://www.who.int/emergencies/disease-outbreak-news/item/2026-DON616 (accessed on 30 August 2026).
- World Health Organization Regional Office for Africa. Ebola Bundibugyo virus disease outbreak, Democratic Republic of the Congo | Uganda: Weekly External Situation Report 15, data as of 23 August 2026 [Internet]. 2026. Available online: https://afro.who.int/countries/democratic-republic-of-congo/publication/ebola-bundibugyo-virus-disease-outbreak-7 (accessed on 2 August 2026).
- Africa Centres for Disease Control and Prevention. Bundibugyo Virus Disease Outbreak, DRC-Uganda: Situational Report, Issue 13 [Internet]. May 2026. Available online: https://khub.africacdc.org/storage/uploads/publications/Sq8JWP6RuuqMRJ3NO2LT70eAUfoUTeqfro97VC9S.pdf (accessed on 30 August 2026).
- Africa Centres for Disease Control and Prevention. Bundibugyo Virus Disease Outbreak, DRC-Uganda: Situational Report, Issue 16. 2 June 2026 [Internet]. June 2026. Available online: https://khub.africacdc.org/storage/uploads/publications/3uZzRf5kg3MdaJJMp8PAobRq87OMUi8ZbP3GqsVG.pdf (accessed on 30 August 2026).
- World Health Organization. Ebola and Marburg virus disease epidemics: preparedness, alert, control and evaluation [Internet]. 2014. Available online: https://iris.who.int/bitstream/handle/10665/130160/WHO_HSE_PED_CED_2014.05_eng.pdf (accessed on 31 August 2026).
- Von Elm, E.; Altman, D.G.; Egger, M.; Pocock, S.J.; Gøtzsche, P.C.; Vandenbroucke, J.P. The Strengthening the Reporting of Observational Studies in Epidemiology (STROBE) Statement: Guidelines for Reporting Observational Studies. PLoS Med. 2007, 4(10), e296. [Google Scholar] [CrossRef] [PubMed]
- World Health Organization. WHO Director-General’s opening remarks at the media briefing – 15 May 2026 [Internet]. 2026. Available online: https://www.who.int/news-room/speeches/item/who-director-general-s-opening-remarks-at-the-media-briefing---15-may-2026 (accessed on 30 August 2026).
- World Health Organization. First meeting of the IHR Emergency Committee regarding the epidemic of Ebola Bundibugyo virus disease in the Democratic Republic of the Congo and Uganda 2026 – Temporary recommendations [Internet]. 2026. Available online: https://www.who.int/news/item/22-05-2026-first-meeting-of-the-ihr-emergency-committee-regarding-the-epidemic-of-ebola-bundibugyo-virus-disease-in-the-democratic-republic-of-the-congo-and-uganda-2026-temporary-recommendations (accessed on 30 May 2026).
- World Health Organization. Ebola disease caused by Bundibugyo virus in the Democratic Republic of the Congo: a preliminary analysis of alerts. Weekly Epidemiological Record. 2026, 101(30). Epidemiological Week 30, 20–26 July 2026. Data as of 26 July 2026. PLoS ONE [Internet]. Public Library of Science. July 2026. Available online: https://www.who.int/publications/journals/weekly-epidemiological-record/wer101-30 (accessed on 30 Aug 2026).
- World Health Organization. Second meeting of the IHR Emergency Committee on the epidemic of Ebola Bundibugyo virus disease in the Democratic Republic of the Congo – Temporary recommendations [Internet]. 2026. Available online: https://www.who.int/news/item/24-08-2026-second-meeting-of-the-ihr-emergency-committee-on-the-epidemic-of-ebola-bundibugyo-virus-disease-in-the-democratic-republic-of-the-congo-temporary-recommendations (accessed on 30 August 2026).
- Keita, M.; Lucaccioni, H.; Ilumbulumbu, M.K.; Polonsky, J.; Nsio-Mbeta, J.; Panda, G.T.; et al. Evaluation of Early Warning, Alert and Response System for Ebola Virus Disease, Democratic Republic of the Congo, 2018-2020. Emerg. Infect. Dis. 2021, 27(12), 2988–98. [Google Scholar] [CrossRef] [PubMed]
- World Health Organization. WHO guideline on contact tracing [Internet]; World Health Organization: Geneva, January 2025; Available online: https://www.who.int/publications/i/item/9789240102965 (accessed on 30 August 2026).
- Swanson, K.C.; Altare, C.; Wesseh, C.S.; Nyenswah, T.; Ahmed, T.; Eyal, N.; et al. Contact tracing performance during the Ebola epidemic in Liberia, 2014-2015. PLoS Negl. Trop. Dis. 2018, 12(9), e0006762. [Google Scholar] [CrossRef] [PubMed]
- Ngalamulume, W.; Kayembe, H.C.; Mutombo, G.; Mossoko, M.; Mutombo, A.; Bompangue, D. Evaluation of contact tracing performance during an Ebola virus disease outbreak in a complex security environment: the case of North Kivu province, Democratic Republic of the Congo, 2018–2020. Confl. Health 2025, 19(1), 12. [Google Scholar] [CrossRef] [PubMed]
- Wanyana, M.W.; Akunzirwe, R.; King, P.; Atuhaire, I.; Zavuga, R.; Lubwama, B.; et al. Performance and impact of contact tracing in the Sudan virus outbreak in Uganda, September 2022-January 2023. Int. J. Infect. Dis. 2024, 141. [Google Scholar] [CrossRef] [PubMed]
- Africa CDC; World Health Organization. Africa CDC and WHO call for urgent, community-led action to contain Ebola in the DRC [Internet]. 2026. Available online: https://www.who.int/news/item/06-08-2026-africa-cdc-and-who-call-for-urgent--community-led-action-to-contain-ebola-in-the-drc (accessed on 31 August 2026).
- Kunkel, A.; Keita, M.; Diallo, B.; Le Polain De Waroux, O.; Subissi, L.; Wague, B.; et al. Assessment of a health facility based active case finding system for Ebola virus disease in Mbandaka, Democratic Republic of the Congo, June-July 2018. BMC Infect. Dis. 2019, 19(1). [Google Scholar] [CrossRef] [PubMed]
- Zalwango, J.F.; Naiga, H.N.; Nsubuga, E.J.; Akunzirwe, R.; Buhuguru, R.; Zalwango, M.G.; et al. Understanding the delay in identifying Sudan Virus Disease: gaps in integrated disease surveillance and response and community-based surveillance to detect viral hemorrhagic fever outbreaks in Uganda, September 2022. BMC Infect. Dis. 2024, 24(1). [Google Scholar] [CrossRef] [PubMed]
- Claude, K.M.; Underschultz, J.; Hawkes, M.T. Social resistance drives persistent transmission of Ebola virus disease in Eastern Democratic Republic of Congo: A mixed-methods study. PLoS ONE 2019, 14(9), e0223104. [Google Scholar] [CrossRef] [PubMed]
- Mukadi-Bamuleka, D.; Mambu-Mbika, F.; De Weggheleire, A.; Edidi-Atani, F.; Bulabula-Penge, J.; Kua Mfumu, M.M.; et al. Efficiency of Field Laboratories for Ebola Virus Disease Outbreak during Chronic Insecurity, Eastern Democratic Republic of the Congo, 2018-2020. Emerg. Infect. Dis. 2023, 29(1), E1–9. [Google Scholar] [CrossRef] [PubMed]
- Wickramage, K. Airport Entry and Exit Screening during the Ebola Virus Disease Outbreak in Sierra Leone, 2014 to 2016. BioMed Res. Int. 2019, 2019(1), 3832790. [Google Scholar] [CrossRef] [PubMed]
- World Health Organization. High-level ministerial meeting on cross-border coordination on the Ebola disease outbreak caused by Bundibugyo virus | WHO | Regional Office for Africa [Internet]. 2026. Available online: https://www.afro.who.int/news/high-level-ministerial-meeting-cross-border-coordination-ebola-disease-outbreak-caused (accessed on 17 Jun 2026).
- World Health Organization. Ebola disease caused by Bundibugyo virus – Democratic Republic of the Congo, 21 May 2026 [Internet]. 2026. Available online: https://www.who.int/emergencies/disease-outbreak-news/item/2026-DON603 (accessed on 30 May 2026).
- World Health Organization. Ebola disease caused by Bundibugyo virus, Democratic Republic of the Congo & Uganda, 29 May 2026 [Internet]. 2026. Available online: https://www.who.int/emergencies/disease-outbreak-news/item/2026-DON605 (accessed on 31 Aug 2026).
- World Health Organization. Update on Bundibugyo virus Disease Democratic Republic of the Congo, 7 June 2026 [Internet]. June 2026. Available online: https://cdn.who.int/media/docs/default-source/crs-crr/bvd-meeting_-bdvd_update-8-june-2026.pdf (accessed on 31 Aug 2026).
- World Health Organization. Ebola disease caused by Bundibugyo virus - Democratic Republic of the Congo, 14 August 2026 [Internet]. 2026. Available online: https://www.who.int/southeastasia/outbreaks-and-emergencies/disease-outbreak-news/item/2026-DON615 (accessed on 31 Aug 2026).
Figure 1.
Flow of situation report availability and final analytic source assembly.
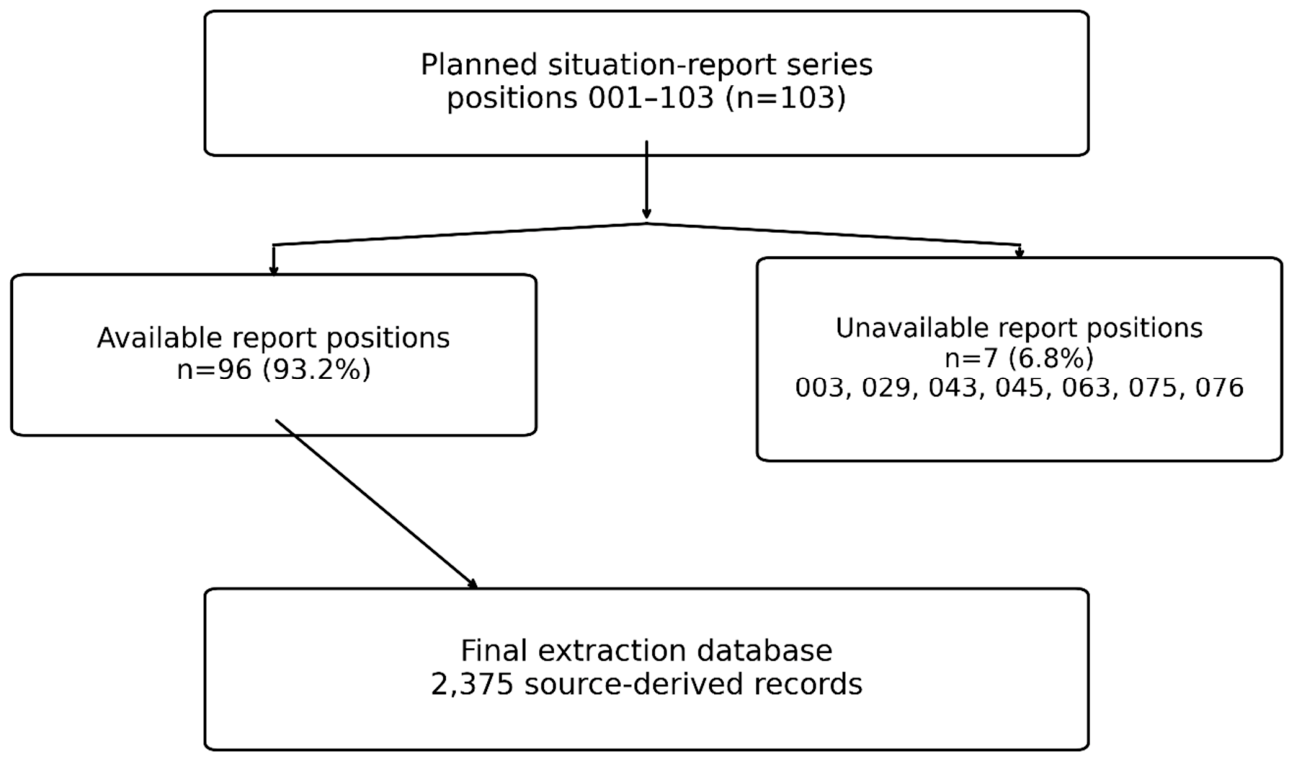
Figure 2.
Reporting completeness across the principal analytical domains among the 96 available situation reports. Values above bars show the number of SitReps reporting the domain and the corresponding percentage. PoE/PoC = point of entry/point of control.
Figure 2.
Reporting completeness across the principal analytical domains among the 96 available situation reports. Values above bars show the number of SitReps reporting the domain and the corresponding percentage. PoE/PoC = point of entry/point of control.
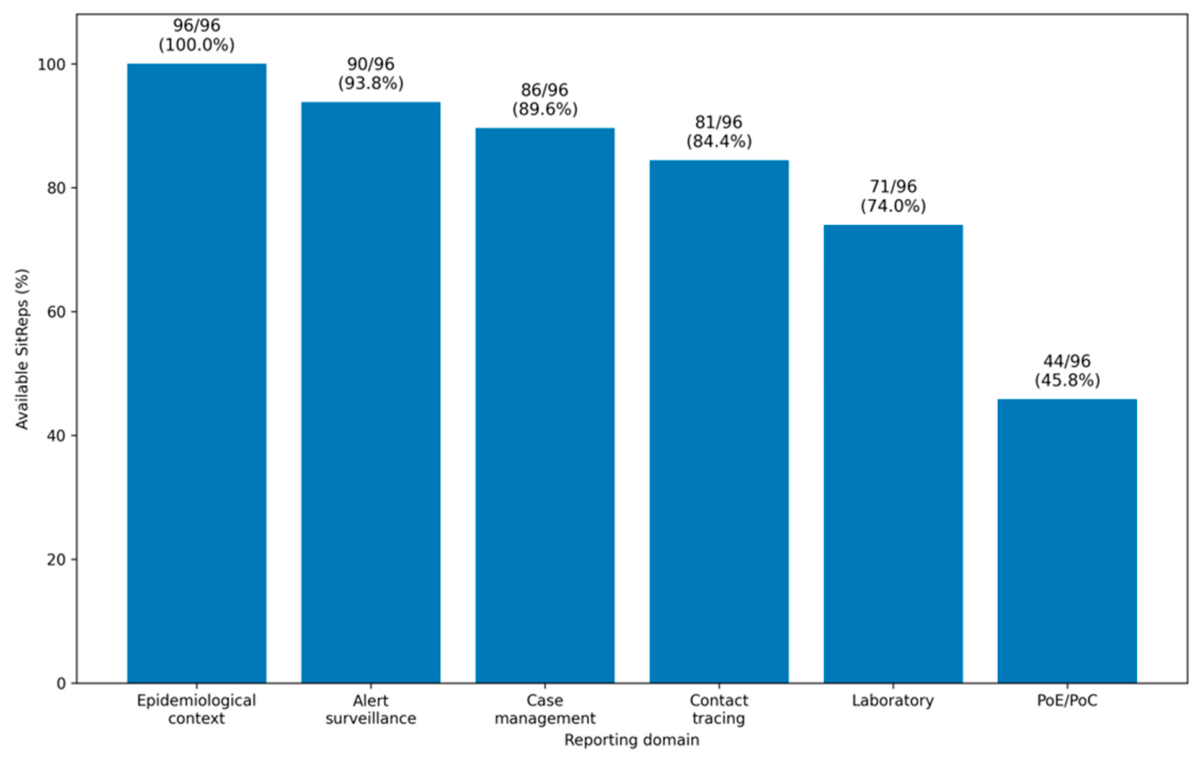
Figure 3.
Distribution of the weakest measured operational process across 71 qualifying geography-date reporting observations under the national-first hierarchy. Contact follow-up was the lowest measured process in 55 observations (77.5%). Validation yield is not shown because it was analysed as a yield rather than a process-performance indicator.
Figure 3.
Distribution of the weakest measured operational process across 71 qualifying geography-date reporting observations under the national-first hierarchy. Contact follow-up was the lowest measured process in 55 observations (77.5%). Validation yield is not shown because it was analysed as a yield rather than a process-performance indicator.
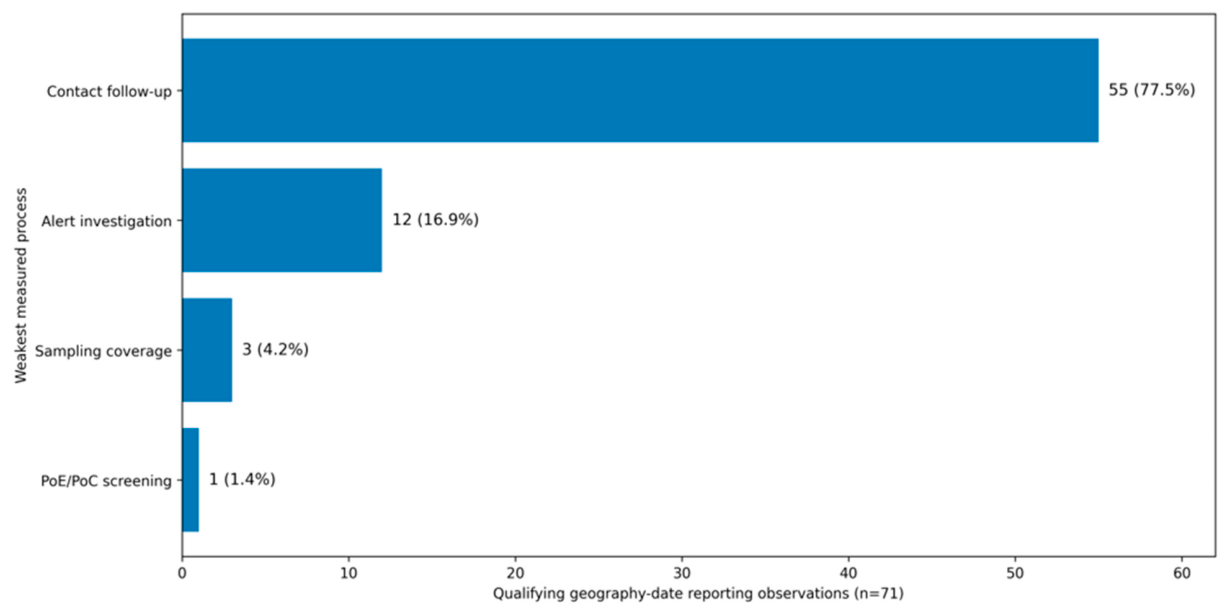

Table 1.
Availability of SitReps and reporting completeness by analytical domain.
| Data domain/accounting item | Available, n | Denominator, n | Completeness, % |
|---|---|---|---|
| Available SitRep positions | 96 | 103 | 93.2 |
| Epidemiological context | 96 | 96 | 100.0 |
| Alert surveillance | 90 | 96 | 93.8 |
| Case management | 86 | 96 | 89.6 |
| Contact tracing | 81 | 96 | 84.4 |
| Laboratory | 71 | 96 | 74.0 |
| PoE/PoC | 44 | 96 | 45.8 |
Note: The denominator for domain-specific completeness is the 96 available reports in the national situation-report series. The planned source frame was defined by report-series position. Missingness was treated as structural/source missingness and was not imputed. PoE/PoC = point of entry/point of control.
Table 2.
Strict linked surveillance-cascade measures.
| Cascade measure | Eligible observations, n | Median, % | IQR, % | Range, % | Analytical interpretation |
|---|---|---|---|---|---|
| Alert investigation | 97 | 88.5 | 79.9–94.2 | 51.4–100 | Process-performance measure |
| Validation yield | 35 | 26.0 | 20.2–74.2 | 0–95.5 | Yield/classification measure; excluded from bottleneck ranking |
| Sampling coverage | 5 | 66.7 | 54.5–74.6 | 45.2–80.6 | Process-performance measure; sparse strict linkage |
Note: Strict linkage required source-compatible numerator and denominator definitions within the same geography and reporting window. Medians and IQRs summarize cumulative source-reported measures across eligible reporting observations and should not be interpreted as median daily performance. Validation yield was treated as a classification yield rather than a performance measure. .
Table 3.
Parallel operational process indicators.
| Operational indicator | Eligible observations, n | Median, % | IQR / range, % | Primary data rule | Key result |
|---|---|---|---|---|---|
| Contact follow-up | 90 | 78.2 | IQR 67.3-82.9 | Contacts seen / contacts under follow-up when source-linkable | Persistent periods of incomplete follow-up |
| PoE/PoC screening | 32 | 98.0 | IQR 96.0-98.8 | Exact counts if stated; otherwise source-reported % with no imputed numerator | High coverage when reported |
| Laboratory processing | 44 | 100 | Range 89–100 | Explicit compatible collected/received-to-analysed specimen cohort only | North Kivu, 22 Jun: 65/73 analysed; 8 pending |
Note: Contact follow-up and PoE/PoC medians summarize cumulative status at eligible reporting observations rather than daily incident activity. PoE/PoC percentage-only observations were retained as percentages rather than converted to synthetic screened counts. Laboratory processing was evaluated only for explicitly compatible source-defined specimen cohorts; arithmetic equality alone was excluded and laboratory values were not interpreted as daily throughput.
Table 4.
Weakest measured operational process under the national-first date-level hierarchy.
| Classification | Reporting observations, n | Percent of qualifying observations | Interpretation |
| Contact follow-up | 55 | 77.5% | Dominant recurrent measured weakness |
| Alert investigation | 12 | 16.9% | Second most frequent lowest process |
| PoE/PoC screening | 1 | 1.4% | Relative lowest process; 94.4% coverage in the primary observation |
| Sampling coverage | 3 | 4.2% | Sparse but occasionally lowest |
| Ties / co-weakest | 0 | 0.0% | No ties under primary hierarchy |
| Total qualifying observations | 71 | 100.0% | 69 national + 2 province-level observations |
Note: A qualifying indicator date contributed one national reporting observation when at least two eligible national process measures were available; otherwise, qualifying province-level observation(s) were used. National and province observations were not both counted on the same date. Unless explicitly reported as daily, process values represented cumulative status snapshots. The lowest value was comparative and did not necessarily indicate failure against an external target. The metric-specific province-first classification was retained as a sensitivity analysis.
Disclaimer/Publisher’s Note: The statements, opinions and data contained in all publications are solely those of the individual author(s) and contributor(s) and not of MDPI and/or the editor(s). MDPI and/or the editor(s) disclaim responsibility for any injury to people or property resulting from any ideas, methods, instructions or products referred to in the content. |
© 2026 by the author. Licensee MDPI, Basel, Switzerland. This article is an open access article distributed under the terms and conditions of the Creative Commons Attribution (CC BY) license.
Copyright: This open access article is published under a Creative Commons CC BY 4.0 license, which permit the free download, distribution, and reuse, provided that the author and preprint are cited in any reuse.