

Submitted:
03 September 2026
Posted:
03 September 2026
You are already at the latest version
Abstract
Secondary lymphedema is a persistent complication resulting from damage to the lymphatic system, including lymphatic vessel and lymph-node injury after cancer treatment. The authors previously proposed a lymphatic vessel concept, followed by fabrication of a first-generation (V1) prototype in 2024. The present study advances this work through simulation-driven redesign leading to a second-generation (V2) prototype and morphological characterization. Computational fluid dynamics (CFD) was used to reassess the initial flow boundary condition and evaluate valve openings. Assigning 4 L/day to a single micrometric vessel produced unrealistically high local velocities and pressure losses, prompting reassessment. Subsequent simulations adopted an inlet ve-locity of 0.0013 m/s and evaluated 60 and 120 µm valve openings, while 3 and 6 µm configurations were retained as narrow reference geometries. Larger openings produced substantially lower maximum velocities and pressure drops. The resulting V2 prototype has a nominal length of 3.32 mm, outer diameter of 150 µm, inner diameter of 140 µm, and approximately 5 µm wall thickness. Scanning electron microscopy (SEM) characterized the fabricated V2 structure at 23×–1500× magnification, confirming the tubular architecture and local measurements of lumen diameter and wall thickness. These findings support engineering development and identify parameters requiring experimental validation before biological or clinical assessment.
Keywords:
artificial lymphatic vessel
; lymphedema
; computational fluid dynamics
; valve
; micrometric device
; scanning electron microscopy
; bioengineering
; medical device
1. Introduction
Secondary lymphedema is a chronic and progressive condition that can develop when the lymphatic system is damaged or its drainage capacity is compromised. In patients treated for breast cancer, lymph-node removal, radiotherapy, and damage to lymphatic vessels may contribute to disruption of lymph transport [1,2]. Current management strategies include physiotherapy, compression, manual lymphatic drainage, and selected surgical procedures; however, established lymphedema frequently requires long-term management rather than definitive restoration of normal lymphatic drainage [2,3,4].
The lymphatic system differs substantially from the cardiovascular system in both its driving mechanisms and flow regime. Lymph transport occurs through a distributed network of initial lymphatics, collecting vessels, lymphangions, and valves, and is influenced by tissue pressure, skeletal-muscle contraction, respiratory movements, and intrinsic lymphatic contractility [5,6]. These characteristics make direct experimental reproduction of physiological lymph transport challenging and motivate the use of computational models during device development [5,6,9,10,11].
The artificial lymphatic vessel concept was previously proposed by the authors [7]. In the present development, a first-generation (V1) artificial lymphatic vessel was fabricated in 2024 using two-photon polymerization (TPP)/MicroFAB-3D laser writing with OrmoBio®, an organically modified biocompatible ceramic resin. Its nominal dimensions were 2000 µm (2.00 mm) in length, 20 µm inner diameter, and 10 µm wall thickness, with inlet/outlet micro-valves designed for an operational pressure range of 25–32 mmHg. The present study does not treat those dimensions as the final device geometry. Instead, it uses CFD analysis as a design-feedback mechanism that led to the second-generation (V2) configuration characterized in this manuscript.
The initial numerical configuration assumed a total volumetric flow rate of 4 L/day through a single artificial vessel. When this condition was applied to a micrometric constriction, the resulting local velocities and pressure losses were clearly inconsistent with the intended physiological operating regime. This result was not treated simply as a numerical failure; instead, it prompted a reassessment of the physical interpretation of the boundary condition. Because lymph is transported through an extensive network of vessels rather than through a single conduit, only a fraction of the total lymphatic flow should be assigned to an individual artificial vessel [6].
The revised numerical analysis therefore examined the vessel at an inlet velocity of 0.0013 m/s and compared different valve-opening geometries. This velocity is within the order of magnitude reported for lymphatic flow in patients with breast cancer-related lymphedema [8,12]. The underlying design hypothesis is that a compliant valve should expand from a narrow resting configuration to a larger opening as local pressure conditions change, thereby reducing hydraulic resistance [5,6,13].
A second objective of the present study is to complement the numerical analysis with direct morphological characterization of fabricated structures. Scanning electron microscopy provides information that CFD alone cannot provide: it allows the fabricated lumen, wall thickness, dimensional fidelity, and surface morphology to be examined at the micrometric scale. The combination of CFD and SEM therefore establishes a more complete development pathway from computational design to physical prototype [14].
This study aimed to evaluate the hydraulic behavior of the proposed artificial lymphatic vessel under different valve-opening configurations and to characterize the morphology of fabricated structures using SEM. The specific aims were to: (i) reassess the initial flow boundary condition; (ii) evaluate the effect of valve opening on velocity and pressure drop; and (iii) characterize the fabricated vessel geometry and surface morphology at the micrometric scale.
2. Materials and Methods
2.1. Artificial Lymphatic Vessel Configuration
The artificial lymphatic vessel consists of interconnected tubular segments incorporating convergent transition regions intended to reproduce the functional concept of a secondary lymphatic valve. The development proceeded iteratively from the first-generation (V1) prototype to the second-generation (V2) configuration [10].
V1 was fabricated in 2024 using two-photon polymerization (TPP)/MicroFAB-3D laser writing with OrmoBio®, an organically modified biocompatible ceramic resin. Its nominal dimensions were 2000 µm (2.00 mm) in length, 20 µm inner diameter, and 10 µm wall thickness, with inlet/outlet micro-valves designed for an operational pressure range of 25–32 mmHg. Following the initial computational evaluation, the geometry was redesigned. The resulting V2 prototype has a nominal total length of 3.32 mm, an outer diameter of 150 µm, an inner diameter of 140 µm, and an approximately 5 µm wall thickness.
For the CFD design study, the valve was represented using prescribed geometric openings. Narrow configurations of 3 and 6 µm were considered as reference conditions, while expanded configurations of 60 and 120 µm were introduced to explore the hydraulic effect of a larger effective flow area. The 60 µm configuration represented an intermediate opening, whereas 120 µm represented the maximum opening considered in the computational study. These configurations were used as prescribed geometries and did not represent simulated mechanical deformation of the valve.
2.2. CFD Numerical Model
The CFD analysis was performed externally using ANSYS 2021 R1. The computational domain was discretized using a three-dimensional finite-volume formulation. Upstream and downstream extensions equivalent to approximately seven characteristic diameters were included to reduce the influence of the inlet and outlet boundary conditions and to provide sufficient flow-development length. The mesh consisted of tetrahedral elements with local refinement in the valve region.
Table 1 summarizes the geometric configurations, fluid properties, and boundary conditions used in the external CFD analysis, and Table 2 reports the corresponding mesh statistics for each valve-opening configuration. All mesh generation, refinement, and convergence assessment were performed by the external CFD laboratory using ANSYS 2021 R1; local refinement was applied in the vicinity of the micrometric valve openings in every configuration. Convergence was evaluated using solver residual criteria together with mass-flow continuity between the inlet and outlet, as reported in Table 1; no independent experimental measurements of velocity or pressure drop were available for direct CFD validation.
For the 6 µm configuration, this condition produced a reported maximum local velocity of 1679.8 m/s and a pressure drop of 232.66 Pa.
Because these results were clearly inconsistent with the intended operating regime of a micrometric lymphatic device, the boundary condition was reassessed. The external CFD analysis subsequently adopted an inlet velocity of 0.0013 m/s, based on lymph-flow velocities identified in the literature and used as the reference condition for the expanded-valve simulations.
The external CFD report employed the Realizable k–ε turbulence model with enhanced wall treatment. The report describes the modeled operating regime as viscous, with inertial forces considered non-significant. Because the final inlet velocity and micrometric dimensions correspond to a very low Reynolds-number regime, the present study does not interpret the Realizable k–ε formulation as establishing a validated turbulent-flow description. Instead, the CFD results are treated as comparative design-exploration results used to evaluate the relative hydraulic effect of different valve-opening geometries. A dedicated laminar formulation and experimental validation remain necessary for quantitative prediction of physiological flow.
2.3. CFD Convergence and Numerical Verification
As summarized in Table 1, numerical convergence was evaluated using solver residual criteria together with mass-flow continuity between the inlet and outlet.
Accordingly, convergence is considered a numerical verification reported by the external laboratory rather than an experimental validation of the physical flow model. No independent experimental measurements of velocity or pressure drop were available for direct CFD validation.
2.4. Prototype Fabrication
The V2 prototype was fabricated using two-photon polymerization (TPP)/MicroFAB-3D laser writing with OrmoBio®, an organically modified biocompatible ceramic resin [15]. The V1 prototype was fabricated in 2024 using the same general manufacturing approach. The V2 geometry was subsequently examined by SEM to assess dimensional fidelity and surface morphology. Where a fabrication parameter is not explicitly documented in the available experimental record, it is not inferred in this manuscript.
2.5. Scanning Electron Microscopy Characterization
The geometry of the manufactured V2 prototype was characterized to compare the fabricated structure with the nominal V2 design dimensions used in the computational study, using scanning electron microscopy (SEM). The analysis was conducted at the Instituto Transdisciplinar de Investigación y Servicios (ITRANS), Universidad de Guadalajara, an EMA-accredited testing laboratory (accreditation INV-2002-019/25).
Prior to imaging, the sample was mounted on an aluminum stub using double-sided carbon tape. Silver paint was applied along the sample edges to enhance conductive continuity with the stub. The specimen was then sputter-coated with gold for 30 s to prevent surface charging during electron beam exposure.
Micrographs were acquired using a JEOL JSM-6610LV scanning electron microscope (JEOL Ltd., Tokyo, Japan) equipped with an Oxford Instruments X-MAX 51-XMX1002 energy-dispersive X-ray spectroscopy (EDS) detector. The instrument operated in secondary electron imaging (SEI) mode under high-vacuum conditions. Imaging parameters included an accelerating voltage of 5 kV, a spot size setting of 30, and a working distance ranging from 19 to 25 mm depending on magnification. Environmental conditions during analysis were 23 °C and 37.1% relative humidity. Micrographs were collected at magnifications ranging from ×23 to ×1500 to characterize both the whole vessel and micrometric-orifice scales. Dimensional measurements (overall length, internal dimensions, and wall thickness) were performed directly on the SEM instrument by the laboratory technician, using the equipment’s built-in measurement tools.
3. Results
3.1. Reassessment of the Initial Flow Boundary Condition
The initial simulation assigned a total flow rate of 4 L/day to a single artificial vessel. For the reported inlet geometry, this resulted in an inlet velocity of approximately 1.218 m/s. Although the external CFD model achieved numerical convergence, the 6 µm configuration produced a maximum local velocity of 1679.8 m/s and a pressure drop of 232.66 Pa.
These values were incompatible with the intended operating conditions of the artificial lymphatic vessel and indicated that assigning the total lymphatic flow to a single micrometric conduit was not an appropriate physical interpretation of the boundary condition. The external CFD analysis therefore reassessed the imposed flow condition rather than treating the initial result as representative of the device operating regime.
The subsequent simulations used an inlet velocity of 0.0013 m/s. This change represented a shift from assigning a total daily flow to a single vessel toward evaluating the hydraulic response of an individual micrometric device under a substantially lower local flow velocity. The external report likewise concluded that the 4 L/day condition was too high for the analyzed vessel segment and recommended the use of lower velocities based on reported lymphatic flow ranges [12].
3.2. Effect of Valve Opening on Simulated Flow
At an inlet velocity of 0.0013 m/s, the prescribed expanded-valve configurations showed a clear difference in the simulated hydraulic response. For the 120 µm opening, the reported maximum velocity was 8.20 × 10⁻³ m/s and the pressure drop was 2.99 × 10⁻³ Pa. For the 60 µm opening, the corresponding values were 3.12 × 10⁻² m/s and 1.43 × 10⁻² Pa, respectively (Figure 1).
Thus, within the assumptions and numerical formulation of the external CFD model, increasing the prescribed valve opening from 60 to 120 µm was associated with lower maximum local velocity and lower pressure drop. The calculated pressure drop for the 120 µm configuration was approximately 79% lower than that obtained for the 60 µm configuration, while the maximum velocity was approximately 74% lower.
These results provide comparative evidence that increasing the effective opening reduces the hydraulic restriction associated with the constricted valve geometry. However, because the simulations prescribe the valve-opening geometries rather than modeling their mechanical deformation, the results do not demonstrate that the physical valve will actually reach either opening under a specific physiological pressure (Figure 2).
The CFD results should therefore be interpreted primarily as design-exploration evidence supporting the geometric rationale for increasing the effective valve opening, rather than as quantitatively validated predictions of physiological lymph flow.
3.3. SEM Characterization of the Fabricated Vessel
SEM imaging confirmed the presence of a continuous tubular structure at the micrometric scale. At 23× magnification, the specimen exhibited a continuous cylindrical architecture with repeated circumferential features along the wall. The annotated low-magnification image provides a local dimensional measurement of approximately 3.323 mm for the imaged longitudinal extent.
At higher magnifications, the lumen and wall could be resolved directly. A 500× cross-sectional image showed an internal lumen diameter of approximately 141.3 µm and a local wall thickness of approximately 5.2 µm, closely corresponding to the nominal 140 µm lumen and approximately 5 µm wall thickness. A separate 350× view of a wider local opening showed an internal dimension of approximately 170.9 µm and a local wall thickness of approximately 12.1 µm. Because these measurements correspond to different image locations and geometries, the 170.9 µm value should not be interpreted as the nominal lumen diameter. The measurements are therefore reported as local morphological observations rather than estimates of global manufacturing uniformity.
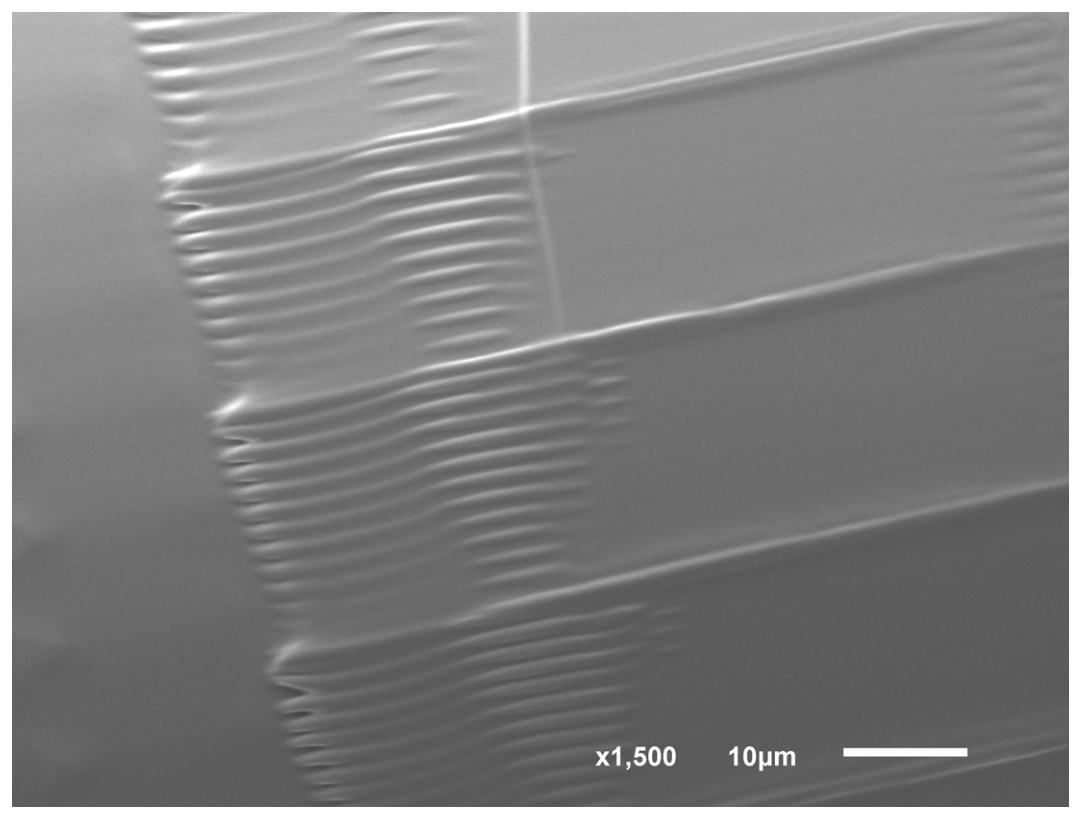
Intermediate-magnification images also revealed repeated circumferential surface features and localized transitions along the tubular wall. Representative surface features are shown in Figure 5. Micrographs were acquired at magnifications up to 1500×. At the highest magnification examined (1500×), the periodic banding associated with the layer-by-layer laser-writing process could be resolved directly at a segment-transition region (Figure 6), providing additional detail on manufacturing surface texture beyond what is visible at 150×.
Figure 3 presents a low-magnification overview (23×) of the fabricated V2 vessel, enabling measurement of its overall longitudinal extent. Figure 4 provides higher-magnification views of the segment junction and convergent transition region. The detailed views in Figure 4 permit local measurement of lumen diameter and wall thickness directly on the SEM micrographs.
Figure 5.
Surface morphology and manufacturing features of the fabricated V2 artificial lymphatic vessel. (a,b) Representative 150× images showing circumferential and longitudinal surface features.
Figure 5.
Surface morphology and manufacturing features of the fabricated V2 artificial lymphatic vessel. (a,b) Representative 150× images showing circumferential and longitudinal surface features.
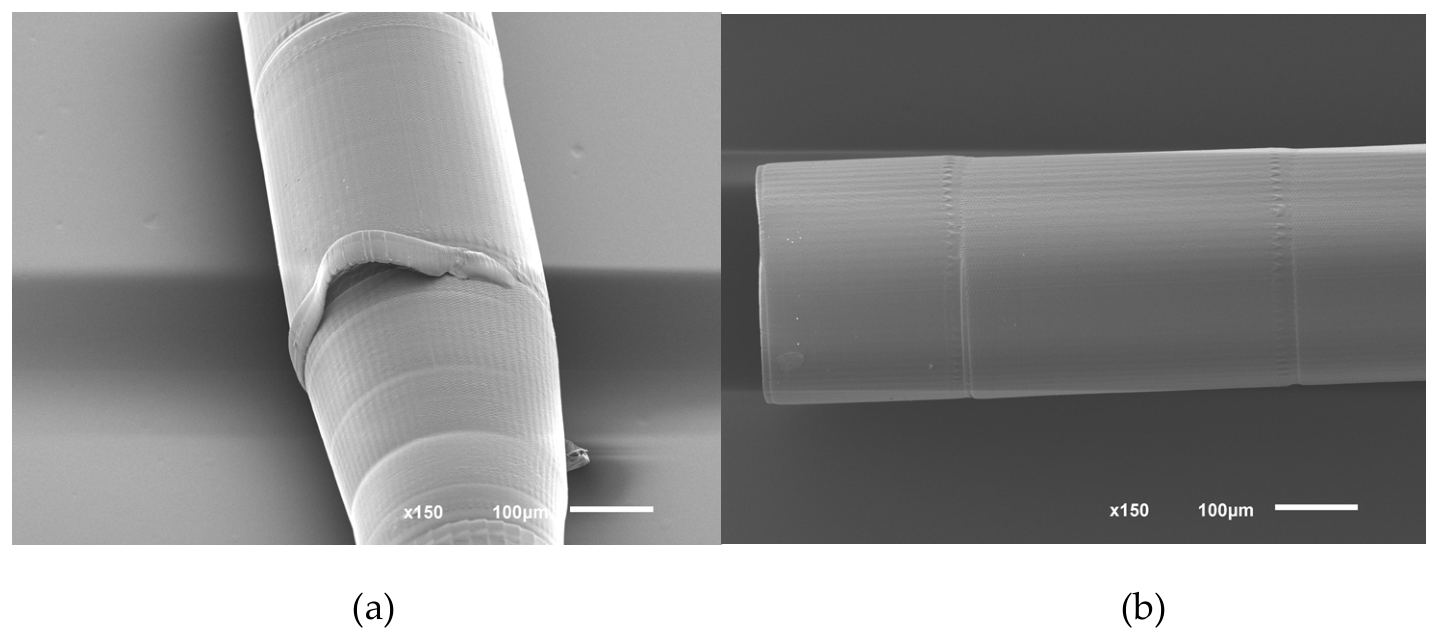
Figure 6.
High-magnification (1500×) view of the fabricated V2 vessel wall at a segment-transition region, resolving the periodic banding pattern associated with the layer-by-layer laser-writing (TPP) fabrication process. This magnification provides direct evidence of manufacturing surface texture that is not resolved in the lower-magnification views of Figure 5.
Figure 6.
High-magnification (1500×) view of the fabricated V2 vessel wall at a segment-transition region, resolving the periodic banding pattern associated with the layer-by-layer laser-writing (TPP) fabrication process. This magnification provides direct evidence of manufacturing surface texture that is not resolved in the lower-magnification views of Figure 5.
3.4. Comparison Between Numerical and Fabricated Geometry
The SEM measurements provide a fabrication-based reference for the V2 geometry used in the numerical study. The nominal V2 dimensions are 3.32 mm total length, 150 µm outer diameter, 140 µm inner diameter, and approximately 5 µm wall thickness. The measured longitudinal extent of 3.323 mm differs from the nominal length by approximately 0.003 mm (3 µm), corresponding to approximately 0.09%. A local lumen measurement of 141.3 µm closely matches the nominal 140 µm lumen, whereas the 170.9 µm measurement was obtained at a separate wider local opening and should not be treated as a measurement of the nominal lumen. Local wall-thickness measurements ranged from approximately 4.8 to 12.1 µm. These observations confirm fabrication at the intended micrometric scale while indicating local dimensional variation that should be considered in subsequent CFD and manufacturing-tolerance analyses.

Table 3.
Comparison between SEM-measured dimensions of the fabricated V2 prototype and nominal V2 design dimensions.
Table 3.
Comparison between SEM-measured dimensions of the fabricated V2 prototype and nominal V2 design dimensions.
| Feature | SEM-Measured Value | V2 Nominal Design Value | Observation |
|---|---|---|---|
| Overall vessel length | 3.323 mm | 3.32 mm | Difference ≈ 0.003 mm (3 µm; ≈0.09%) |
| Wall thickness | ≈4.8–12.1 µm | ≈5 µm | Local variation; measurements from different locations |
| Internal lumen diameter | ≈141.3 µm | 140 µm | Local measurement closely matches nominal lumen |
| Wider local internal opening | ≈170.9 µm | Not a nominal lumen dimension | Measured at a separate wider local opening; not directly comparable to the nominal lumen |
The SEM measurements should be interpreted as local observations of the fabricated V2 structure. The approximately 3.323 mm measured longitudinal extent closely corresponds to the nominal 3.32 mm V2 length. The local wall-thickness measurements (approximately 4.8–12.1 µm) include values close to the approximately 5 µm nominal wall thickness but also indicate local variation. The 170.9 µm internal measurement was obtained at a separate wider local opening and should not be used to characterize the nominal lumen diameter.
4. Discussion
The present study advances the artificial lymphatic vessel through an iterative V1-to-V2 development sequence combining computational design evaluation with morphological characterization. The role of CFD in this sequence was not limited to predicting velocity and pressure fields. More importantly, the analysis exposed a mismatch between the initial flow assumption and the physical scale of a single micrometric vessel. Assigning 4 L/day to one artificial vessel produced extremely high local velocities and pressure losses, prompting reassessment of the boundary condition.
This finding is important for interpreting the subsequent design process. The initial 4 L/day value should not be regarded as the flow rate expected to pass through one artificial vessel. Rather, the simulation highlighted the need to distinguish total lymphatic transport from the local flow associated with an individual device within a distributed lymphatic network. The external CFD analysis subsequently adopted an inlet velocity of 0.0013 m/s and examined alternative valve-opening geometries.
The second principal finding concerns the effect of valve opening. Under the same prescribed inlet velocity, the 120 µm configuration produced lower simulated maximum velocity and pressure drop than the 60 µm configuration. The reported values were 8.20 × 10⁻³ m/s and 2.99 × 10⁻³ Pa for the 120 µm opening, compared with 3.12 × 10⁻² m/s and 1.43 × 10⁻² Pa for the 60 µm opening.
This trend supports the underlying design hypothesis that increasing the effective flow area can reduce hydraulic restriction at the valve. It also provides a rationale for the transition from the narrow micrometric openings considered in the earlier configuration toward a design capable of substantially greater effective opening. Importantly, however, the simulations evaluated prescribed geometries. They did not model the pressure-induced deformation of the valve. Consequently, the CFD results support the geometric design rationale but do not establish the pressure required to produce a 60 or 120 µm opening.
4.1. Interpretation of the CFD Model
An important methodological consideration is the flow regime represented by the simulations. The external CFD report employed the Realizable k–ε model with enhanced wall treatment and described the operating regime as viscous, with inertial contributions considered non-significant.
At the adopted inlet velocity of 0.0013 m/s and using the nominal 140 µm lumen diameter as the characteristic length, the characteristic Reynolds number is approximately 0.19. This indicates a strongly viscous, low-Reynolds-number flow regime. The Realizable k–ε formulation used in the external analysis was therefore not independently established in the present study as an appropriate turbulence model for this regime.
The realizable k–ε model with enhanced wall treatment is a general-purpose approach commonly provided by default in commercial computational fluid dynamics (CFD) packages. Its selection by the external laboratory likely reflects standard practice for internal-flow problems, rather than a regime-specific choice for micrometric, low-Reynolds-number geometries. At Re ≈ 0.19, inertial effects are negligible, and the flow is expected to be accurately described by a laminar (Stokes-flow) formulation. Under these conditions, a turbulence-closure model is not physically required and may introduce numerical dissipation absent in the actual flow. As an initial consistency check independent of the external CFD model, the pressure drop expected for fully developed laminar flow through a straight cylindrical segment of comparable diameter can be estimated analytically using the Hagen–Poiseuille relation, although this comparison was not performed in the present study. This check is identified as a priority for future validation work and does not substitute for a dedicated laminar re-simulation of the full valve geometry, which remains necessary before the reported pressure-drop values can be considered quantitatively reliable.
For this reason, the numerical values reported here should not be interpreted as a fully validated quantitative prediction of physiological lymphatic flow. Instead, the simulations are used comparatively: they reveal the relative change in the modeled hydraulic response when the effective valve opening is increased from 60 to 120 µm. This distinction is essential because it preserves the information obtained from the external CFD analysis while avoiding an unsupported claim of model validation.
The external report itself followed an iterative approach after identifying the unrealistic results obtained with the initial 4 L/day condition. It subsequently examined lower velocities and expanded valve geometries, including 60 and 120 µm openings. Thus, the CFD contribution to the present work is best understood as a design-feedback mechanism within the V1-to-V2 development process [12].
4.2. Relationship Between CFD and SEM Characterization
The SEM analysis provides a complementary perspective to the computational study. CFD evaluates the hydraulic consequences of a prescribed geometry, whereas SEM provides direct evidence of the geometry actually produced during fabrication [14].
These observations demonstrate fabrication at the intended micrometric scale while also revealing local dimensional variation. The nominal V2 inner diameter of 140 µm is comparable in scale to lymphatic vessel diameters reported in healthy subjects, although this comparison does not imply anatomical equivalence [16].
This distinction is important for future CFD development. The computational model represents an idealized geometry, whereas the SEM observations demonstrate that the fabricated structure contains local dimensional deviations. Since hydraulic resistance is sensitive to micrometric constrictions, future analyses should incorporate experimentally measured geometries rather than relying exclusively on nominal CAD dimensions [14].
The present study therefore establishes a development pathway in which CFD identifies potentially important geometric relationships, fabrication produces the physical prototype, and SEM evaluates the resulting morphology. The agreement between nominal and measured overall length provides evidence of dimensional fidelity at the gross scale, while the local variations highlight parameters requiring further investigation.
5. Limitations and Future Work
Several limitations should be considered when interpreting the present findings.
First, the CFD analysis was performed externally, and the present study did not have access to the computational model for independent re-analysis. The reported simulations employed the Realizable k–ε model with enhanced wall treatment, although the modeled operating conditions correspond to a very low Reynolds-number, strongly viscous regime. Consequently, the numerical results are interpreted as comparative design-exploration results rather than as a fully validated quantitative prediction of physiological lymphatic flow. A future CFD study should explicitly formulate the problem using an appropriate low-Reynolds-number/laminar approach and should report the corresponding Reynolds numbers and model-selection rationale.
Second, the lymph was modeled as a Newtonian fluid with constant viscosity. This assumption was used consistently in the external CFD analysis. Future work should assess whether non-Newtonian behavior could influence the hydraulic response under the specific operating conditions of the device.
Third, the simulations used a constant inlet velocity of 0.0013 m/s and did not reproduce the cyclic or pulsatile nature of physiological lymph transport. Future studies should investigate time-dependent pressure and flow conditions to determine how the valve responds under dynamic loading [9,12].
Fourth, the 60 and 120 µm valve configurations were prescribed geometrically. The CFD analysis therefore does not establish the pressure–deformation relationship of the physical valve. Mechanical testing and/or fluid–structure interaction (FSI) simulations will be required to determine whether the fabricated valve can achieve the modeled opening states under relevant pressure conditions.
Fifth, the initial 4 L/day condition produced unrealistic local velocities and pressure losses when assigned to a single micrometric vessel. This result motivated the reassessment of the boundary condition but also demonstrates that total lymphatic flow cannot be directly equated with flow through an individual artificial vessel. Future work should establish a physiologically justified relationship between system-level lymph transport and the local flow rate imposed on an individual device [11,12].
Finally, the SEM measurements represent local observations rather than statistically established manufacturing tolerances. The observed lumen and wall-thickness variation should therefore not be generalized to the entire population of fabricated devices. Future work should characterize multiple specimens and multiple locations and incorporate measured geometries into subsequent CFD simulations. Experimental flow-loop testing should then be used to compare measured pressure–flow behavior with numerical predictions before any biological or clinical evaluation.
6. Conclusions
This study advances the development of an artificial lymphatic vessel through an iterative V1-to-V2 process that combines CFD-based design evaluation with SEM characterization. V1, fabricated in 2024, established the initial micrometric concept. CFD analysis subsequently identified the hydraulic consequences of assigning 4 L/day to a single micrometric vessel and motivated reassessment of the boundary condition. At an inlet velocity of 0.0013 m/s, larger valve openings produced lower maximum local velocities and pressure drops, supporting the design rationale for a compliant valve with an increased effective flow area. The resulting V2 prototype has a nominal length of 3.32 mm, outer diameter of 150 µm, inner diameter of 140 µm, and approximately 5 µm wall thickness. SEM characterization confirmed the tubular architecture and provided local measurements of lumen diameter and wall thickness, including an overall measured extent of approximately 3.323 mm.
These findings constitute an engineering proof-of-concept step rather than evidence of biological or clinical efficacy. The SEM measurements are local observations and indicate dimensional variability that should be incorporated into future CFD analyses. Further work is required to verify the CFD flow model and Reynolds-number regime, quantify pressure–deformation behavior experimentally, characterize manufacturing variability across multiple specimens, validate flow behavior in a physical loop, and assess mechanical durability and biocompatibility before any animal or clinical evaluation.
7. Patents
National Patent: MX/a/2023/015031, PCT: C347.0001US1.
Author Contributions
Conceptualization, G.D.-A., A.R.-S. and R.Q.F.-A.; methodology, G.D.-A. and A.R.-S.; investigation, G.D.-A.; formal analysis, G.D.-A. and A.R.-S.; writing—original draft preparation, G.D.-A. and A.R.-S.; writing—review and editing, G.D.-A., A.R.-S. and R.Q.F.-A.; supervision, R.Q.F.-A. All authors have read and agreed to the published version of the manuscript.
Funding
This research was funded by Universidad Panamericana, “Research Promotion Fund 2025”, No. UP-CI2025-AGS-03-ING.
Institutional Review Board Statement
Not applicable.
Informed Consent Statement
Not applicable.
Data Availability Statement
The CFD simulations reported in this study were performed by an external laboratory using ANSYS 2021 R1; the native computational model (mesh, solver settings, and case files) is proprietary to that laboratory and was not available to the authors for independent re-analysis. To support reproducibility to the extent possible, all CFD input parameters used to generate the reported results—geometry dimensions, fluid properties, boundary conditions, turbulence model, mesh statistics, and convergence criteria—are fully reported in Section 2.2 and Section 2.3 and Table 1 and Table 2 of this manuscript. The SEM raw micrographs and dimensional measurements underlying Section 3.3 and Table 3 are available from the corresponding author upon reasonable request. The authors acknowledge that independent verification of the CFD results would require either access to the original solver files or an independent re-simulation using the parameters reported here; the latter is identified as a priority for future work (see Section 5).
Use of Artificial Intelligence
During the preparation of this manuscript, the authors used ChatGPT (OpenAI) for language editing, manuscript organization, and improvement of clarity and readability. The authors reviewed and edited all AI-assisted content and take full responsibility for the final content of the manuscript.
Conflicts of Interest
The authors declare no conflicts of interest.
References
- McLaughlin, S.A.; Brunelle, C.L.; Taghian, A. Breast Cancer-Related Lymphedema: Risk Factors, Screening, Management, and the Impact of Locoregional Treatment. J. Clin. Oncol. 2020, 38, 2341–2350. [Google Scholar] [CrossRef] [PubMed]
- Pereira, N.; Pons, G.; Masià, J. Linfedema asociado al cáncer de mama: Factores de riesgo, diagnóstico y tratamiento quirúrgico. Rev. Cir. 2019, 71, 79–87. [Google Scholar] [CrossRef]
- Johansson, K.; Hayes, S. A historical account of the role of exercise in the prevention and treatment of cancer-related lymphedema. Lymphology 2020, 53, 55–62. [Google Scholar] [CrossRef]
- Ochalek, K.; Partsch, H.; Gradalski, T.; Szygula, Z. Do Compression Sleeves Reduce the Incidence of Arm Lymphedema and Improve Quality of Life? Two-Year Results from a Prospective Randomized Trial in Breast Cancer Survivors. Lymphat. Res. Biol. 2019, 17, 70–77. [Google Scholar] [CrossRef] [PubMed]
- Gashev, A.A. Lymphatic Vessels: Pressure- and Flow-dependent Regulatory Reactions. Ann. N. Y. Acad. Sci. 2008, 1131, 100–109. [Google Scholar] [CrossRef] [PubMed]
- Moore, J.E., Jr.; Bertram, C.D. Lymphatic System Flows. Annu. Rev. Fluid Mech. 2018, 50, 459–482. [Google Scholar] [CrossRef] [PubMed]
- Durán-Aguilar, G.; Rossa-Sierra, A.; Fuentes-Aguilar, R.Q. Design of an Auxiliary Artificial Lymphatic Vessel in Treatment of Secondary Lymphedema Due to Breast Cancer. Healthcare 2022, 10, 68. [Google Scholar] [CrossRef] [PubMed]
- Park, J.K.-H.; Seo, J.; Yang, E.J.; Kang, Y.; Heo, C.Y.; Myung, Y. Association of lymphatic flow velocity with surgical outcomes in patients undergoing lymphovenous anastomosis for breast cancer-related lymphedema. Breast Cancer 2022, 29, 835–843. [Google Scholar] [CrossRef] [PubMed]
- Scallan, J.P.; Zawieja, S.D.; Castorena-Gonzalez, J.A.; Davis, M.J. Lymphatic Pumping: Mechanics, Mechanisms and Malfunction. J. Physiol. 2016, 594, 5749–5768. [Google Scholar] [CrossRef] [PubMed]
- Davis, M.J.; Rahbar, E.; Gashev, A.A.; Zawieja, D.C.; Moore, J.E., Jr. Determinants of Valve Gating in Collecting Lymphatic Vessels from Rat Mesentery. Am. J. Physiol. Heart Circ. Physiol. 2011, 301, H48–H60. [Google Scholar] [CrossRef] [PubMed]
- Nipper, M.E.; Dixon, J.B. Engineering the Lymphatic System. Cardiovasc. Eng. Technol. 2011, 2, 296–308. [Google Scholar] [CrossRef] [PubMed]
- Thorup, L.; Hjortdal, A.; Boedtkjer, D.B.; Thomsen, M.B.; Hjortdal, V. The Transport Function of the Human Lymphatic System—A Systematic Review. Physiol. Rep. 2023, 11, e15697. [Google Scholar] [CrossRef] [PubMed]
- Angeli, V.; Lim, H.Y. Biomechanical Control of Lymphatic Vessel Physiology and Functions. Cell. Mol. Immunol. 2023, 20, 1051–1062. [Google Scholar] [CrossRef] [PubMed]
- Chang, C.-W.; Seibel, A.J.; Song, J.W. Application of Microscale Culture Technologies for Studying Lymphatic Vessel Biology. Microcirculation 2019, 26, e12547. [Google Scholar] [CrossRef] [PubMed]
- Doraiswamy, A.; Jin, C.; Narayan, R.J.; Mageswaran, P.; Mente, P.; Modi, R.; Auyeung, R.; Chrisey, D.B.; Ovsianikov, A.; Chichkov, B. Two Photon Induced Polymerization of Organic–Inorganic Hybrid Biomaterials for Microstructured Medical Devices. Acta Biomater. 2006, 2, 267–275. [Google Scholar] [CrossRef] [PubMed]
- Hara, H.; Mihara, M. Evaluation of Lymphatic Vessel Diameters in Healthy People Using Lymphatic Ultrasound Examination. J. Vasc. Surg. Venous Lymphat. Disord. 2022, 10, 758–764. [Google Scholar] [CrossRef] [PubMed]
Figure 1.
Simulated velocity field for the 120 µm valve-opening configuration at an inlet velocity of 0.0013 m/s, showing longitudinal and cross-sectional views of the flow through the artificial lymphatic vessel.
Figure 1.
Simulated velocity field for the 120 µm valve-opening configuration at an inlet velocity of 0.0013 m/s, showing longitudinal and cross-sectional views of the flow through the artificial lymphatic vessel.
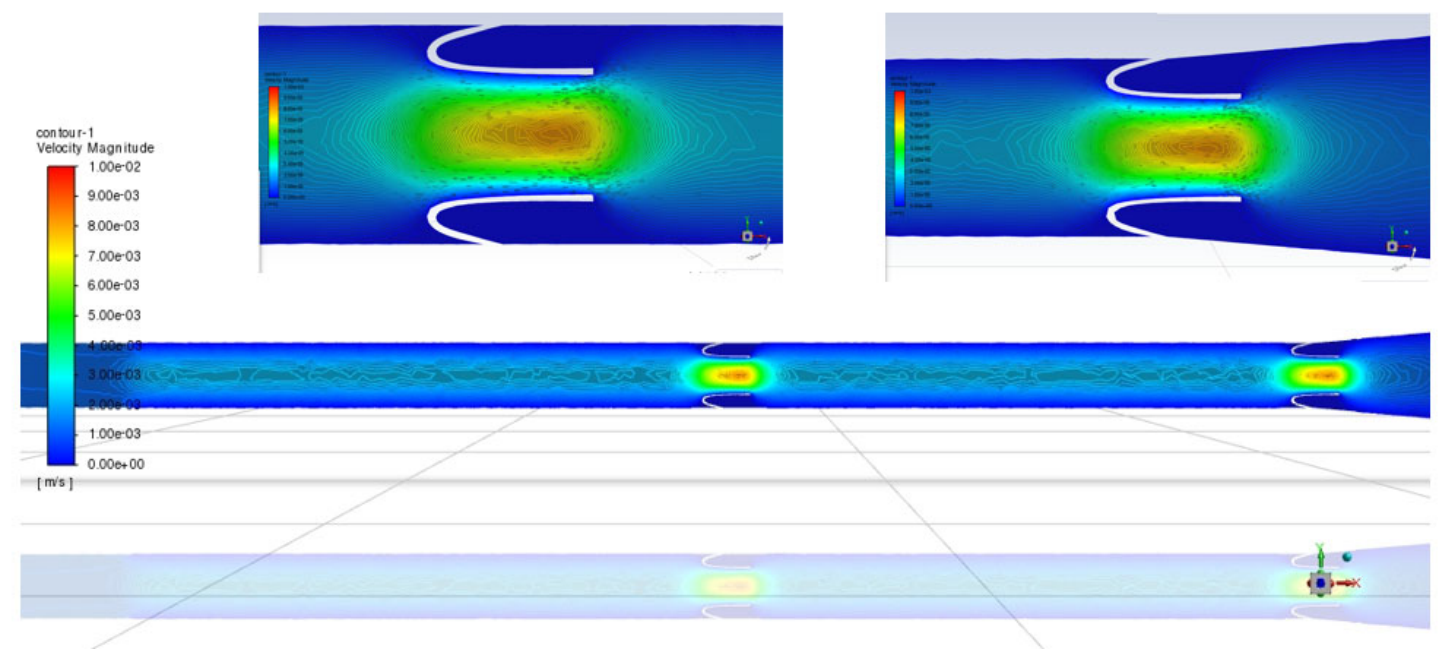
Figure 2.
Three-dimensional visualization of the simulated velocity field for the 120 µm valve-opening configuration at an inlet velocity of 0.0013 m/s, illustrating the local velocity distribution through the valve region.
Figure 2.
Three-dimensional visualization of the simulated velocity field for the 120 µm valve-opening configuration at an inlet velocity of 0.0013 m/s, illustrating the local velocity distribution through the valve region.
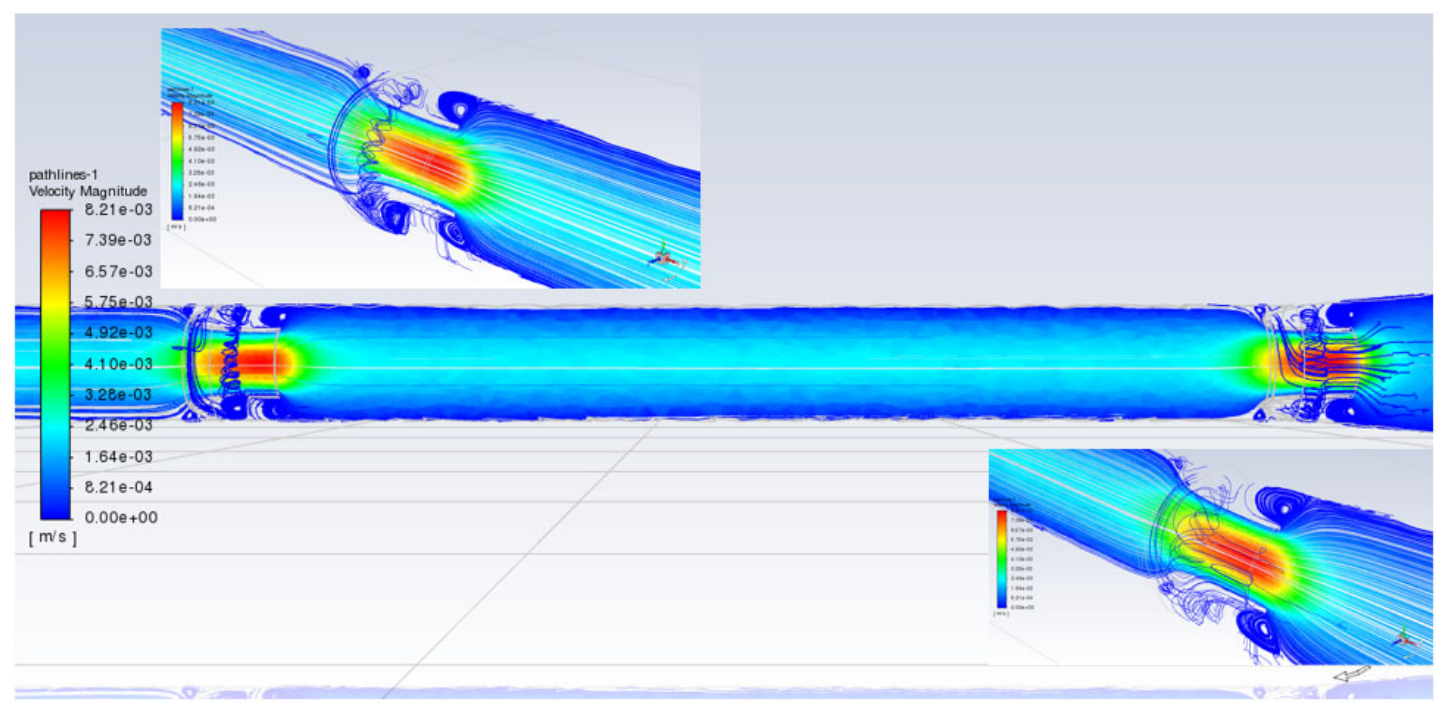
Figure 3.
Overall morphology of the fabricated V2 artificial lymphatic vessel. (a,b) SEM images at 23× magnification showing the longitudinal dimensional measurement and complementary view of the overall tubular architecture.
Figure 3.
Overall morphology of the fabricated V2 artificial lymphatic vessel. (a,b) SEM images at 23× magnification showing the longitudinal dimensional measurement and complementary view of the overall tubular architecture.
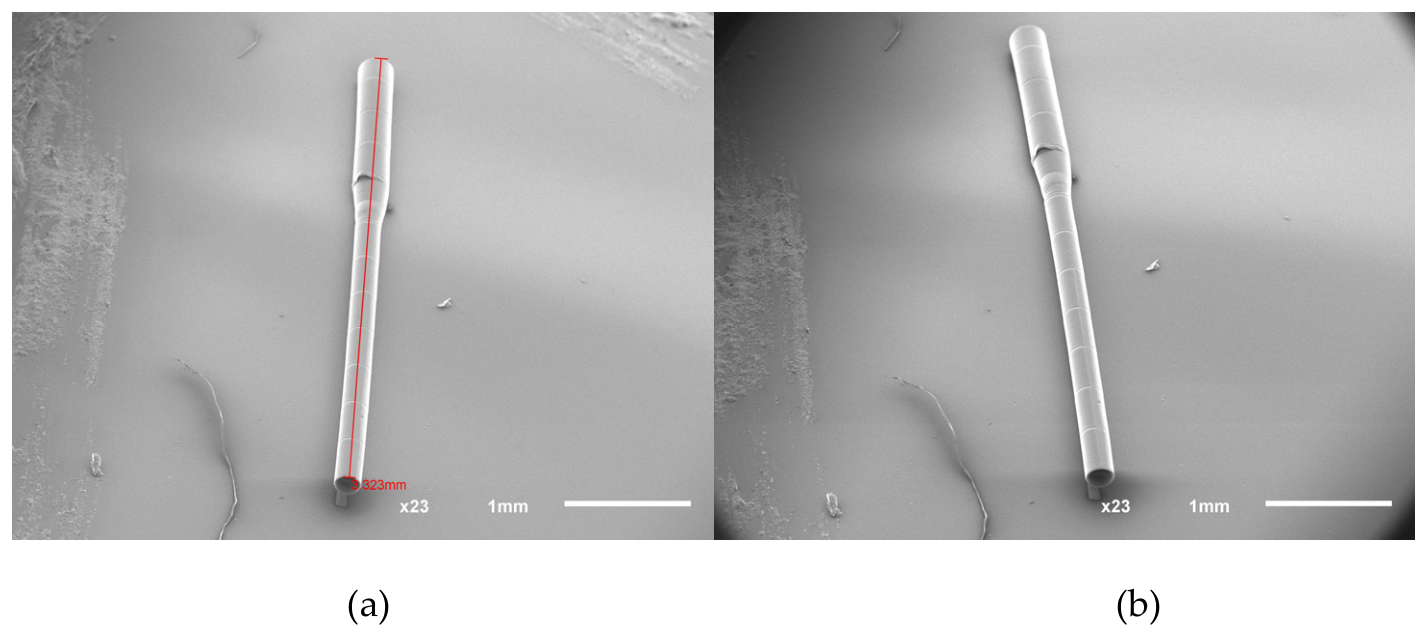
Figure 4.
Internal geometry and wall thickness of the fabricated V2 artificial lymphatic vessel. (a–d) Representative SEM views at 130×, 350×, 500×, and 370× magnification, respectively, showing the lumen, local wall thickness, cross-sectional geometry, and tubular transition region.
Figure 4.
Internal geometry and wall thickness of the fabricated V2 artificial lymphatic vessel. (a–d) Representative SEM views at 130×, 350×, 500×, and 370× magnification, respectively, showing the lumen, local wall thickness, cross-sectional geometry, and tubular transition region.
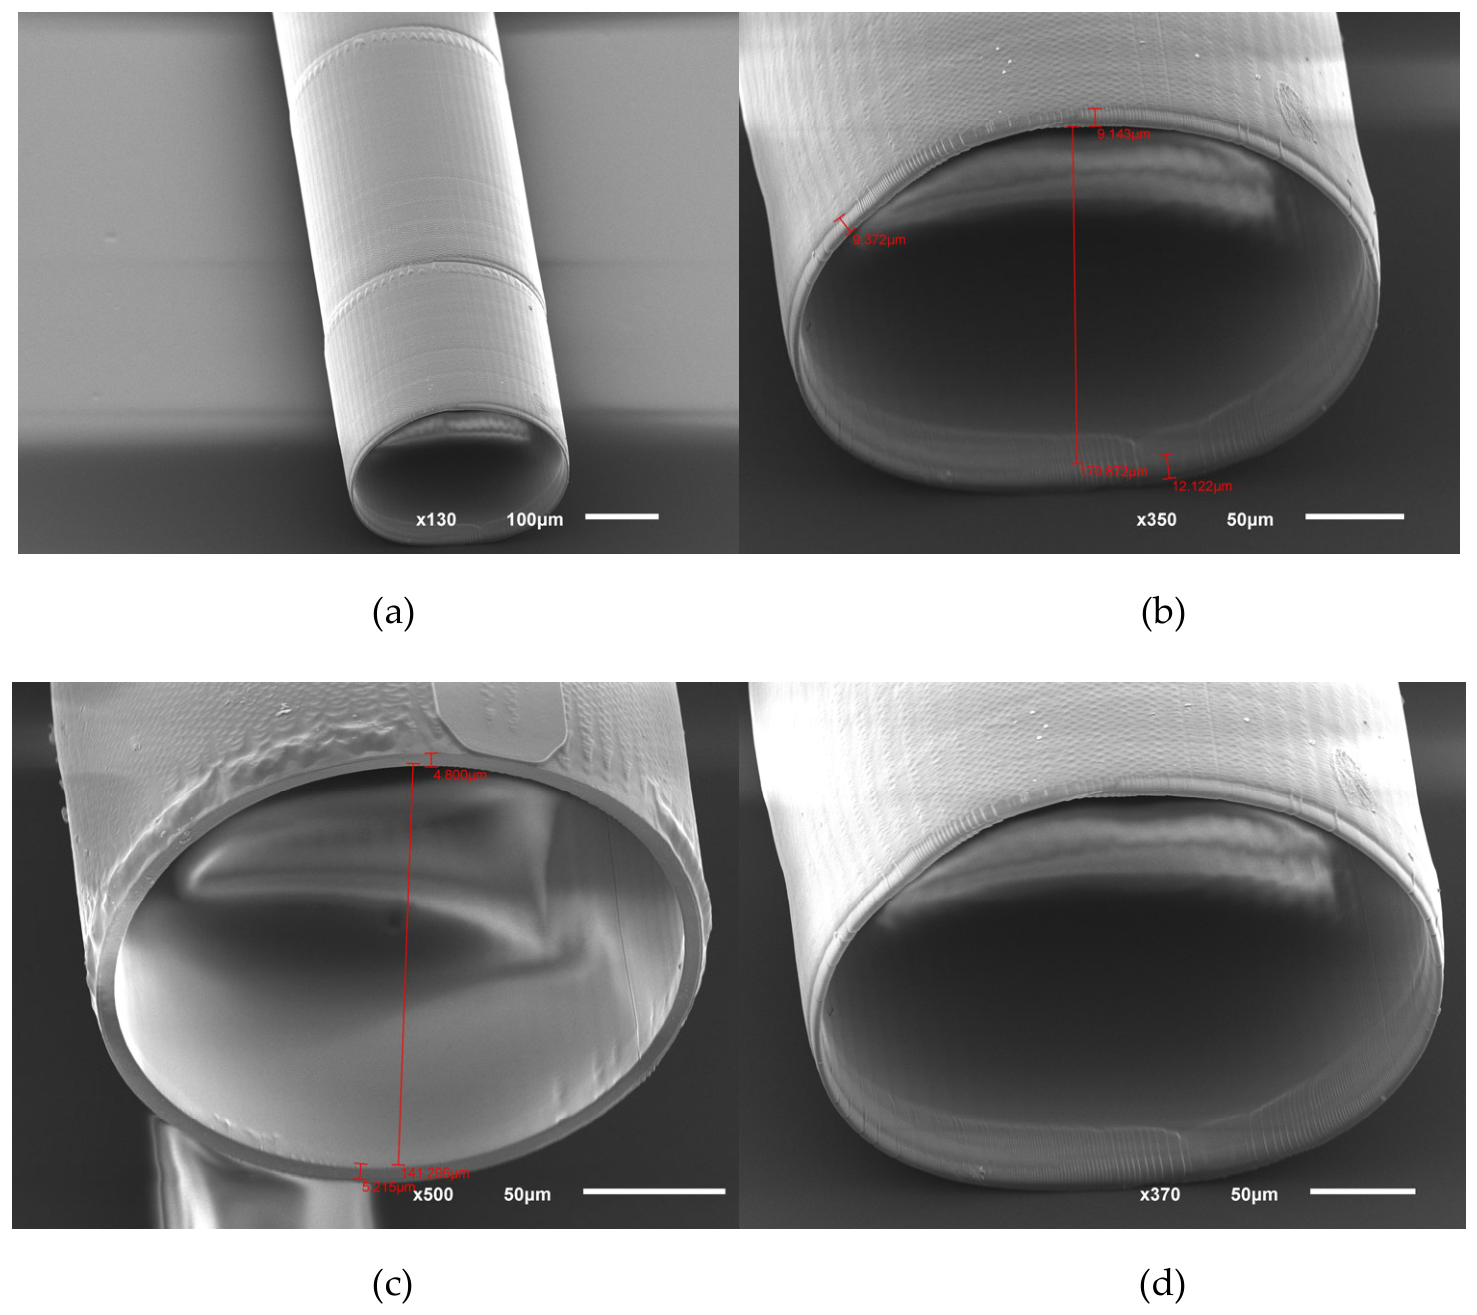
Table 1.
Computational domain, geometry, and fluid properties.
| Category | Parameter | Value |
| Solver | Software | ANSYS 2021 R1 |
| Solver | Formulation | 3D finite-volume |
| Solver | Turbulence model | Realizable k–ε with enhanced wall treatment |
| Solver | Modeled flow regime | Viscous; inertial forces treated as non-significant |
| Geometry (V2) | Total length | 3.32 mm |
| Geometry (V2) | Outer diameter | 150 µm |
| Geometry (V2) | Inner diameter | 140 µm |
| Geometry (V2) | Wall thickness | ≈5 µm |
| Geometry (V1, prior generation) | Total length | 2000 µm (2.00 mm) |
| Geometry (V1, prior generation) | Inner diameter | 20 µm |
| Geometry (V1, prior generation) | Wall thickness | 10 µm |
| Geometry (V1, prior generation) | Design operational pressure range | 25–32 mmHg |
| Valve-opening configurations evaluated | Narrow (reference) | 3 µm, 6 µm |
| Valve-opening configurations evaluated | Expanded | 60 µm, 120 µm |
| Domain | Upstream/downstream extension | ≈7 characteristic diameters |
| Fluid properties | Model | Newtonian |
| Fluid properties | Density | 1.257 × 10³ kg/m3 |
| Fluid properties | Dynamic viscosity | 1.2 cP (0.0012 Pa·s) |
| Boundary condition (initial) | Total flow rate assigned | 4 L/day (single vessel) |
| Boundary condition (initial) | Resulting inlet velocity | ≈1.218 m/s |
| Boundary condition (revised) | Inlet velocity | 0.0013 m/s |
| Convergence criteria | Residual criteria | Solver default residuals (external report) |
| Convergence criteria | Mass-flow continuity (inlet–outlet) | <1 × 10⁻⁹ (unit not specified in external report) |
Table 2.
Mesh statistics by configuration.
| Configuration | Nodes | Elements | Min. Element Size | Avg. Element Size |
|---|---|---|---|---|
| 3/6 µm (narrow, reference) | 46,091 | 231,727 | 1 × 10⁻⁷ m | 1 × 10⁻⁴ m |
| 60 µm | 87,220 | 462,376 | Not separately reported | Not separately reported |
| 120 µm | 138,081 | 735,066 | Not separately reported | Not separately reported |
Disclaimer/Publisher’s Note: The statements, opinions and data contained in all publications are solely those of the individual author(s) and contributor(s) and not of MDPI and/or the editor(s). MDPI and/or the editor(s) disclaim responsibility for any injury to people or property resulting from any ideas, methods, instructions or products referred to in the content. |
© 2026 by the authors. Licensee MDPI, Basel, Switzerland. This article is an open access article distributed under the terms and conditions of the Creative Commons Attribution (CC BY) license (http://creativecommons.org/licenses/by/4.0/).
Copyright: This open access article is published under a Creative Commons CC BY 4.0 license, which permit the free download, distribution, and reuse, provided that the author and preprint are cited in any reuse.