

Submitted:
01 September 2026
Posted:
03 September 2026
You are already at the latest version
Abstract
Motivation: Multiomics data integration is essential for understanding complex biological systems, yet existing network-based approaches operate at a single level—either patient similarity networks or molecular interaction networks—without bridging the two. We address the gap between patient-level integration and molecular-level network analysis by proposing a hierarchical framework that unifies both. Results: We introduce HiNoN (Hierarchical Network-of-Networks), a two-level framework in which a fused patient-similarity network is linked to subgroup-specific microbial association and host-gene co-expression networks. Across 200 simulation runs, subgroup recovery was strongest for large cohorts (mean ARI 0.95 at n=500) and two-group settings (mean ARI 0.88), but declined with increasing noise and subgroup number. We then performed leakage-free repeated nested cross-validation on 50 paired coronary artery disease samples. Under the prespecified 16-component representation, early concatenation outperformed HiNoN-path2-SGC in ROC–AUC (0.923 versus 0.911), PR–AUC (0.958 versus 0.949), and calibration. Sensitivity analysis showed a different pattern under aggressive compression: with eight components, HiNoN-path2-SGC improved ROC--AUC by 0.073 and also improved balanced accuracy, Brier score, and calibration error. Unsupervised clusters had negligible agreement with disease labels (ARI =-0.006; NMI =0.016) and are therefore treated as exploratory. These results characterize HiNoN as a topology-aware regularizer under representation scarcity, rather than a uniformly superior classifier.
Keywords:
multiomics integration
; patient similarity network
; network of networks
; graph neural network
; host–microbiome interactions
; disease subtyping
1. Introduction
The integration of multiomics data—transcriptomics, proteomics, metabolomics, microbiomics—has become a central challenge in computational biology [1,2]. Network-based approaches have emerged as powerful tools for this integration, as they capture relational structure between molecular features and provide interpretable representations of biological systems [3].
However, existing network-based integration methods operate at one of two levels, without bridging them. Patient-level methods—such as Similarity Network Fusion (SNF) [4], MoGCN [5], DeepMoIC [6], PartIES [7], and DSCC [8]—construct patient similarity networks and fuse them across omics layers. These methods excel at patient stratification but do not model the molecular interaction networks within patient subgroups. Molecular-level methods—such as BRANEnet [9], MultiXVERSE [10], MOGAMUN [11], and multilayer transcriptome models [12]—build multiplex or multilayer networks of molecular features but do not incorporate patient-level hierarchy.
Meanwhile, host-microbiome integration studies [1,13,14] have demonstrated the biological importance of linking gut microbial communities to host gene expression. Priya et al. [13] identified shared and disease-specific host gene–microbiome associations across human diseases using multi-omic integration. MintTea [14] discovered disease-associated multi-omic modules across microbiome and metabolome data. Such integration is relevant to metabolic phenotypes in which systemic markers, including adipokines, are associated with obesity-related liver disease [15]. MicrobioLink [16] inferred functional effects of microbiome-host interactions via network diffusion. Transkingdom network analysis [17] revealed that ileal microbiota show stronger associations with host metabolism than colonic microbiota. Multilayer microbial co-occurrence networks [18,19] have been used to study scale-dependent structure in microbial communities. However, these approaches use correlation or regression frameworks, not a network-of-networks structure that unifies patient-level and molecular-level networks.
Taken together, these developments leave an important methodological gap. Existing approaches do not jointly link patient- and subgroup-level networks, construct parallel microbial and transcriptomic networks within subgroups, and integrate these structures through both interpretable and graph-learning paths. We therefore propose HiNoN (Hierarchical Network-of-Networks), a framework that constructs a Level-1 patient similarity network from fused multiomics data, defines patient subgroups via a hybrid clinical + data-driven approach, builds per-subgroup Level-2 molecular networks (microbiome co-occurrence via sparse inverse covariance estimation, transcriptomics co-expression via WGCNA-style topological overlap), and integrates both levels through two complementary paths: interpretable network-similarity fusion and hierarchical graph learning. We evaluate the framework in simulations and in a leakage-free analysis of paired host–microbiome data from a small coronary artery disease cohort. Because the cohort is limited to 50 patients, the real-data analysis is intended to define plausible operating conditions and failure modes rather than to establish clinical utility.
2. Related Work
Multilayer networks model relationships across multiple types of connections simultaneously. BRANEnet [9] embeds multilayer networks for omics data integration, enabling transcription factor prediction and integrated network inference. MultiXVERSE [10] uses universal multilayer network embedding to reveal links between GABA and cancer. MOGAMUN [11] employs a multi-objective genetic algorithm to find active modules in multiplex biological networks. PLEX.I [20] quantifies how a node’s neighborhood changes across multiplex networks, revealing clinically relevant dysregulations. Azevedo et al. [12] built a multilayer human transcriptome model across 49 tissues, identifying gene co-expression communities. Lee et al. [21] surveyed heterogeneous multi-layered network models, benchmarking matrix factorization, random walk, knowledge graphs, and deep learning approaches. A recent systematic review by Jiang et al. [3] covers network-based multi-omics integrative analysis methods in drug discovery.
Although these methods offer rich molecular representations, they do not generally incorporate a patient-level hierarchy or construct separate molecular networks within patient subgroups. A complementary line of research represents patients as nodes connected by multiomics similarity, enabling data-driven disease subtyping. SNF [4] is the foundational method, cross-diffusing similarity matrices from different omics to produce a fused network. MoGCN [5] uses graph convolutional networks for multi-omics cancer subtype analysis. DeepMoIC [6] employs deep GCNs for cancer subtype classification. PartIES [7] uses diffusion-enhanced partition-level integration for disease subtyping. DSCC [8] integrates multi-omics into consensus networks and applies spectral clustering across 43 cancer datasets (n > 11,000). StellarPath [22] is a hierarchical-vertical patient classifier using pathway analysis and patient similarity. HGCT-SC [23] builds hierarchical patient similarity networks translated into proteomic representations via graph contrastive learning.
These approaches fuse omics at the patient level but do not construct per-subgroup molecular networks as distinct layers. PartIES [7] is conceptually close to a hierarchy, although it uses diffusion-enhanced similarities rather than an explicit network-of-networks construction.
The distinction is especially relevant for host–microbiome studies, where integrating host and microbial data is biologically important but methodologically challenging. Chetty and Blekhman [1] reviewed multi-omic approaches for host-microbiome data integration, highlighting the need for standardized methods. Priya et al. [13] identified shared and disease-specific host gene–microbiome associations across gastrointestinal disorders using multi-omic integration. MintTea [14] identifies disease-associated multi-omic modules across microbiome and metabolome data. MicrobioLink [16] infers functional effects of microbiome-host interactions via network diffusion. Chen et al. [17] used transkingdom network analysis to show ileal microbiota dominate host metabolism associations. Multilayer microbial co-occurrence networks [18,19] study scale-dependent microbial structure across farms. Villette et al. [24] built gut microbiome gene co-expression networks revealing loss of diversity in Parkinson’s disease. Ma et al. [25] integrated single-cell transcriptomics with microbiome profiles to identify RNA-targetable host-microbiota networks in colorectal adenoma.
These studies largely rely on correlation, regression, or diffusion. HiNoN connects the complementary ideas developed across these fields: patient similarity provides the upper level, subgroup-specific molecular networks provide the lower level, and host and microbial data are retained as complementary molecular views. This hierarchy supports patient stratification and cross-omics analysis within a common representation while making the incremental value of network structure testable against simpler baselines.
3. Methods
3.1. Framework and Patient-Level Representation
HiNoN follows the top-to-bottom workflow shown in Figure 1. It first represents the study participants in a patient-similarity network. Patient groups derived from this network then define the samples used to estimate two molecular structures for each group: a microbiome co-occurrence network and a transcriptomic co-expression network. The patient and molecular representations are subsequently connected by either network-similarity fusion (Path 1) or hierarchical graph learning (Path 2). Both paths produce representations that can support patient stratification, outcome prediction, and cross-omics module analysis. Thus, the two molecular network types are parallel views of every subgroup; they do not represent different sets of patients.
Let denote the patients and the patient subgroups. The paired input data are a microbiome abundance matrix and a transcriptomic expression matrix , where t and g are the numbers of retained taxa and genes, respectively.
At the first level of Figure 1, each patient is a node and weighted edges encode similarity between patients. Transcriptomic similarity is calculated from the most variable genes, whereas microbiome similarity is calculated after centered log-ratio (CLR) transformation. In each view, only the nearest neighbours of each patient are retained. Similarity Network Fusion (SNF) [4] then iteratively exchanges information between the two views and returns a single fused patient-similarity matrix, denoted by W.
Subgroups are obtained from the fused patient network by spectral clustering. In the label-free mode used for the definitive CAD analysis, disease status is withheld from this step and is used only for later evaluation. The framework also permits a clinically anchored mode in which known categories define initial strata before data-driven subclustering. This second mode is appropriate only when the entire grouping procedure is repeated within each training fold. Groups below a prespecified minimum size are not subdivided because their molecular networks cannot be estimated reliably.
3.2. Subgroup-Specific Molecular Networks
The second level of Figure 1 contains a pair of molecular networks for each patient subgroup. The microbiome co-occurrence network uses taxa as nodes. Within a subgroup, abundances are CLR-transformed and Graphical Lasso is used to estimate a sparse precision matrix, following the conditional-dependence principle of SPIEC-EASI [26]. Non-zero partial correlations derived from this matrix define the weighted edges. Regularization is selected by cross-validation in the real-data analysis and fixed in the simulations to reduce computational cost.
The corresponding transcriptomic co-expression network uses genes as nodes. Within the same subgroup, Pearson correlations are transformed into weighted adjacencies using the WGCNA soft-thresholding rule [27]. The topological overlap measure then combines direct gene–gene association with shared-neighbour information, and hierarchical clustering of the resulting dissimilarities identifies co-expression modules. Consequently, every subgroup is represented by both a microbial network and a transcriptomic network .
3.3. Integration and Prediction
Path 1 in Figure 1 returns an interpretable, network-enhanced patient representation. Each subgroup-specific molecular network is summarized with the permutation-invariant NetLSD descriptor [28], which records the heat-kernel trace of its graph Laplacian across several scales. Distances between these descriptors are converted to similarities separately for the microbiome and transcriptomic networks and then averaged. This subgroup-level similarity reweights the original patient network: pairs of patients retain their original similarity but receive greater support when their subgroups also have similar molecular topology. A mixing parameter controls the contribution of this molecular-network evidence.
Path 2 uses graph propagation to learn patient representations. Patient nodes begin with PCA-reduced multiomics features and are connected by the nearest-neighbour edges of the patient-similarity network. Each subgroup is represented by a second-level node whose features summarize its microbiome and transcriptomic networks; membership edges connect a patient to its subgroup in both directions. The full formulation uses two GraphSAGE message-passing layers [29] to project the two node types into a common latent space and return an embedding for each patient. The encoder may be trained without outcome labels by reconstructing patient similarity, or with labels available only in the training partition by minimizing classification loss.
The evaluation distinguishes label-free and clinically anchored uses of the framework. In the label-free setting, outcomes are withheld while subgroups and representations are learned and are introduced only for post hoc assessment. In the clinically anchored setting, outcomes may define the initial strata or supervise the graph model; all such steps must then be repeated within each training partition. The definitive CAD experiment adopted label-free subgrouping and an inductive, simplified graph-convolution implementation, denoted HiNoN-path2-SGC. Results from an earlier exploratory GraphSAGE/HeteroConv prototype were excluded from generalization claims because a complete reusable implementation was not available.
As depicted at the bottom of Figure 1, the resulting representations support three downstream analyses:
- 1.
- Patient subtyping: Spectral clustering on the enhanced PSN (Path 1) or K-means on GNN embeddings (Path 2). Evaluated against clinical labels via ARI, NMI, and silhouette score.
- 2.
- Classification: Supervised classifiers on graph-derived or spectral representations. In the definitive CAD experiment, classification and every preceding transformation were evaluated by repeated nested cross-validation as described below.
- 3.
- Cross-omics module discovery: Gene modules from transcriptomics networks are correlated with microbial taxa across patients via Spearman correlation. Modules with |ρ| ≥ 0.3 are retained and associated with phenotype (disease status or inflammation) via Spearman correlation of module eigengenes/eigentaxa with labels. Cross-ontology association-rule mining provides a related strategy for extracting weighted relationships between heterogeneous annotation systems [30].
3.4. Experimental Design and Leakage-Free Evaluation
We generate synthetic data with known ground-truth structure:
- Patients: n = 50–500, assigned to k = 2–8 subgroups (balanced or imbalanced).
- Microbiome: t = 50 taxa from block-structured sparse inverse covariance models per subgroup (known co-occurrence networks).
- Transcriptomics: g = 100 genes from block-structured covariance models per subgroup (known co-expression networks).
- Cross-omics links: gene modules correlated with taxa modules via shared latent factors.
Parameter sweeps (10 replicates each):
- 1.
- Noise level: σ = 0.1, 0.5, 1.0, 2.0
- 2.
- Subgroup imbalance: ratio = 1.0, 2.0, 3.0, 5.0
- 3.
- Missing data: 0%, 10%, 20%, 30%
- 4.
- Number of subgroups: k = 2, 3, 5, 8
- 5.
- Sample size: n = 50, 100, 200, 500
Evaluation: ARI and NMI for subgroup recovery; precision, recall, and F1 for network edge recovery (compared to ground-truth adjacency).
To complement the simulations and estimate generalization without information leakage, the definitive CAD experiment used repeated nested stratified cross-validation. The outer loop comprised five stratified folds repeated ten times with different seeds; the inner loop selected the classifier regularization parameter. Within every outer-training partition, the complete pipeline was refitted, including feature filtering, transformation, patient-similarity construction, label-free subgroup definition, molecular-network inference, graph propagation, and classifier selection. Molecular networks were inferred from standardized original selected variables rather than globally uncorrelated PCA scores. Final representations were standardized using the outer-training partition only, and held-out samples were transformed exclusively with quantities estimated from the corresponding training data.
Sigmoid calibration was also nested within the resampling procedure. In each outer split, the calibrator was fitted to out-of-fold predictions generated exclusively within the outer-training partition. Raw and calibrated held-out probabilities were retained. The classification threshold was fixed at 0.5 and was not optimized on the 50 study participants. Performance was summarized by ROC–AUC, PR–AUC, balanced accuracy, F1 score, Brier score, and expected calibration error (ECE).
We used ablation experiments to determine which structures contributed to performance. These comparisons retained only the patient-similarity network, only the subgroup-network descriptors, or one of the two integration paths. Additional variants retained only microbiome data or only transcriptomic data, replaced subgroup-specific networks with a single global molecular network, compared label-free with clinically anchored grouping, and removed patient–subgroup membership edges. This design separates the contribution of each data type from that of the hierarchical organization itself.
The one-factor-at-a-time sensitivity analysis varied PCA dimensionality (8, 16, and 24 components), patient-neighborhood size (5, 10, and 15), and the number of label-free subgroups (2, 3, and 4). The prespecified primary configuration used 16 components, 10 neighbors, and 2 subgroups. Identical baseline configurations were executed once and reused. The sensitivity grid was not used to select a favorable primary configuration after inspection of the held-out results.
4. Results
4.1. Performance in Simulated Data
The simulation study (200 runs across 5 parameter sweeps) demonstrates HiNoN’s ability to recover known structure under varying conditions (Figure 2).
Effect of noise (Figure 2A): At low noise (σ=0.1), HiNoN achieves ARI=0.583±0.197 and NMI=0.637. Performance degrades gracefully with increasing noise: at σ=0.5, ARI=0.375; at σ=1.0, ARI=0.159. Network recovery follows a similar pattern: microbiome F1 drops from 0.415 (σ=0.1) to 0.271 (σ=2.0), while transcriptomics F1 drops from 0.284 to 0.065. The method is robust to moderate noise levels.
Effect of sample size (Figure 2B): Sample size has the strongest effect on performance. At n=50, ARI=0.264; at n=100, ARI=0.188; at n=200, ARI=0.375; at n=500, ARI=0.950±0.035. This demonstrates that the hierarchical network-of-networks approach benefits substantially from larger cohorts, as per-subgroup network construction becomes more reliable with more samples per subgroup.
The number of subgroups showed a related pattern (Figure 2C). With k=2, ARI=0.884±0.209. Performance decreases with more subgroups: k=3, ARI=0.375; k=5, ARI=0.172; k=8, ARI=0.170. This decline is compatible with fewer observations being available to estimate each subgroup network.
Missingness produced a more gradual decline (Figure 2D). At 0% missing, ARI=0.375; at 10%, ARI=0.248; at 20%, ARI=0.247; at 30%, ARI=0.164. Network recovery is more robust: microbiome F1 only drops from 0.367 to 0.291, and transcriptomics F1 from 0.262 to 0.188.
4.2. Coronary Artery Disease Analysis
GSE242046/GSE242047 from GEO comprised 50 paired profiles (30 CAD cases and 20 controls) with host blood transcriptomics (28,081 genes; 500 retained within each training partition) and gut microbiome 16S profiles (258 genus-table features; 100 retained within each training partition). Accession-specific matching yielded 50 concordant profiles and recorded two unmatched microbiome samples rather than silently discarding them.
Before evaluating predictive performance, diagnostic analysis identified two causes of degeneracy in the initial implementation. First, repeated SNF diffusion approached a low-variance stationary representation; retaining diagonal self-information and standardizing the final training representation increased the held-out probability standard deviation from approximately to . Second, global networks had been inferred on PCA scores, which are globally uncorrelated by construction. This produced empty networks and constant descriptors. Inferring networks from standardized original selected variables and projecting each patient onto the training-inferred topology produced nonconstant global-network features.
Under the prespecified 16-component, 10-neighbor, two-subgroup configuration, early concatenation achieved a mean outer-fold ROC–AUC of 0.923 and PR–AUC of 0.958, compared with 0.911 and 0.949 for HiNoN-path2-SGC (Table 1). Concatenation also achieved better balanced accuracy (0.848 versus 0.840), F1 (0.881 versus 0.861), Brier score (0.113 versus 0.125), and ECE (0.190 versus 0.205). Thus, the corrected analysis does not support general predictive superiority over early concatenation.
PCA dimensionality was the dominant sensitivity factor (Figure 3). With eight components, HiNoN-path2-SGC improved ROC–AUC by 0.073 relative to concatenation (0.879 versus 0.807), alongside improvements in PR–AUC (0.930 versus 0.881), balanced accuracy (0.784 versus 0.708), Brier score (0.152 versus 0.185), and ECE (0.233 versus 0.266). This advantage disappeared with richer representations: at 24 components, concatenation achieved ROC–AUC 0.938 compared with 0.921 for HiNoN-path2-SGC. Increasing the neighborhood from 5 to 15 reduced the HiNoN ROC–AUC from 0.916 to 0.905 and worsened calibration, consistent with oversmoothing. Performance varied little across two to four subgroups.
Disease labels were not used during cluster fitting. The resulting two-cluster solution showed negligible post hoc agreement with CAD status (ARI ; NMI ) and weak geometric separation (silhouette ). Accordingly, these clusters are structural summaries and are not interpreted as validated clinical CAD subtypes.
As a separate data-integrity check, we audited an initially proposed Crohn’s disease analysis that combined GSE171244 transcriptomes with GSE162844 microbiome profiles. Accession-level auditing showed that these datasets originate from independent cohorts and do not provide patient-matched host and microbial measurements. Consequently, correlations obtained by combining their rows would not represent within-patient cross-omics associations. We therefore removed the previous module–taxon results, network-difference claims, and associated figure from the evidential analysis. A Crohn’s application will require the matching microbiome matrix for GSE171244 or another genuinely paired cohort, with patient-grouped resampling when multiple biopsies are available. This exclusion prevents biological interpretation of an invalid cross-cohort alignment.
Table 1 establishes early concatenation as the strongest primary benchmark under the prespecified setting. Fold-level standard deviations describe resampling variability but are not interpreted as 50 independent observations. The sensitivity analysis is therefore used to characterize conditional behavior rather than to select a post hoc winner.
5. Discussion
The corrected evaluation changes the interpretation of HiNoN. Under the prespecified primary configuration, graph propagation did not improve on early concatenation and produced slightly poorer calibration. Its value emerged specifically under aggressive dimensional compression, where the topology-aware representation recovered part of the predictive structure lost by concatenation. HiNoN should therefore be viewed as a conditional structural regularizer rather than a universally superior classifier. The gradual decline with larger neighborhoods further suggests oversmoothing, whereas the limited effect of subgroup count is consistent with the weak post hoc cluster validity.
The framework’s main contribution is therefore architectural rather than a claim of universal predictive gain. It connects patient-level similarity with molecular relationships that are estimated separately within subgroups, preserves complementary host and microbial views, and allows the graph-derived representation to be compared directly with early concatenation. This dual resolution may be useful when biological structure is informative but the patient representation is severely compressed. At the same time, the present results show why a simple baseline must remain central: once the PCA representation retained more information, concatenation matched or exceeded the graph model.
Several limitations narrow the interpretation. The CAD cohort contains only 50 patients, and repeated cross-validation cannot replace an independent external cohort because its folds are correlated. Although feature selection, network construction, classifier fitting, and calibration were repeated strictly within the training data, the sensitivity grid must not be used retrospectively to promote the eight-component setting as the preferred model. Its apparent advantage is a hypothesis for prospective testing. Similarly, the weak ARI, NMI, and silhouette values provide no evidence that the label-free clusters are clinical CAD subtypes. They should remain exploratory until their stability, biological associations, and reproducibility can be assessed in larger cohorts.
Sample size is also a structural constraint rather than only an evaluation concern. The simulations indicate that recovery improves markedly as the number of patients increases, which is expected because each subgroup must contain enough observations for stable microbial and transcriptomic network estimation. The current WGCNA-style topological overlap calculation is quadratic in the number of genes, while sparse inverse-covariance estimation can become expensive for large taxonomic profiles. Feature prefiltering or approximate network estimators will therefore be needed for genome-scale applications. Moreover, the framework currently assumes cross-sectional observations; longitudinal data would require time-resolved networks and temporal message passing, following the broader principles developed for temporal biological and medical networks [31].
The exclusion of the proposed Crohn’s disease analysis illustrates a more fundamental requirement: hierarchical host–microbiome inference depends on genuinely paired measurements. Independent transcriptomic and microbiome cohorts cannot be aligned row by row to estimate within-patient associations. The next decisive experiment is thus an external evaluation in a sufficiently large paired cohort, with the primary configuration fixed in advance. Such data would also permit formal tests of subgroup stability and cross-domain modules. Subsequent extensions could add other omics layers, scalable network estimators, and attention-based or temporal graph models, but added complexity should be justified by reproducible gains over transparent baselines.
6. Conclusions
We presented HiNoN, a hierarchical network-of-networks framework that links patient similarity with subgroup-specific microbial association and host-gene co-expression networks. Leakage-free nested evaluation did not show general superiority over early concatenation: concatenation was stronger under the prespecified configuration and with richer PCA representations. HiNoN-path2-SGC was beneficial under aggressive dimensional compression, suggesting a role as a topology-aware regularizer when representation capacity is limited. Label-free CAD clusters remained exploratory, and an initially proposed Crohn’s cross-omics analysis was excluded after accession auditing showed that the modalities were not patient matched. These results define both the conditions under which HiNoN may be useful and the validation needed before broader claims are warranted.
Data Availability Statement
Versioned executable code, configurations, download utilities, diagnostic outputs, and summary result tables are provided in https://zenodo.org/records/22231248.
References
- Chetty, R.; Blekhman, R. Multi-omic approaches for host-microbiome data integration. Gut Microbes 2024, 16, 2297860. [Google Scholar] [CrossRef] [PubMed]
- Sanches, P.; et al. Integrating Molecular Perspectives: Strategies for Comprehensive Multi-Omics Integrative Data Analysis. Biology 2024, 13, 848. [Google Scholar] [CrossRef] [PubMed]
- Jiang, W.; Ye, W.; Tan, X.; et al. Network-based multi-omics integrative analysis methods in drug discovery: a systematic review. BioData Min. 2025, 18, 27. [Google Scholar] [CrossRef] [PubMed]
- Wang, B.; Mezlini, A.M.; Demir, F.; et al. Similarity network fusion for aggregating data types on a genomic scale. Nat. Methods 2014, 11, 333–337. [Google Scholar] [CrossRef] [PubMed]
- Li, X.; Ma, J.; Leng, L.; et al. MoGCN: A Multi-Omics Integration Method Based on Graph Convolutional Network for Cancer Subtype Analysis. Front. Genet. 2022, 13, 806842. [Google Scholar] [CrossRef] [PubMed]
- Wu, J.; Chen, Z.; Xiao, S.; et al. DeepMoIC: multi-omics data integration via deep graph convolutional networks for cancer subtype classification. BMC Genom. 2024, 25, 1112. [Google Scholar] [CrossRef] [PubMed]
- Miao, Y.; Xu, H.; Wang, S. PartIES: a disease subtyping framework with Partition-level Integration using diffusion-Enhanced Similarities. Brief. Bioinform. 2024, 25, bbae609. [Google Scholar] [CrossRef] [PubMed]
- Tran, D.; Pham, V.D.; Nguyen, H.N.; et al. DSCC: disease subtyping using spectral clustering and community detection from consensus networks. Brief. Bioinform. 2025, 26, bbaf600. [Google Scholar] [CrossRef] [PubMed]
- Jagtap, S.; Pirayre, A.; Bidard, F.; et al. BRANEnet: embedding multilayer networks for omics data integration. BMC Bioinform. 2022, 23, 495. [Google Scholar] [CrossRef] [PubMed]
- Pio-Lopez, L.; Levin, M. Universal multilayer network embedding reveals a causal link between GABA neurotransmitter and cancer. BMC Bioinform. 2025, 26, 6158. [Google Scholar] [CrossRef] [PubMed]
- Novoa-del Toro, E.; Mezura-Montes, E.; Vignes, M.; et al. A multi-objective genetic algorithm to find active modules in multiplex biological networks. PLoS Comput. Biol. 2020. [Google Scholar] [CrossRef]
- Azevedo, T.; Dimitri, G.M.; Liò, P.; Gamazon, E.R. Multilayer modelling of the human transcriptome and biological mechanisms of complex diseases. npj Syst. Biol. Appl. 2021, 7, 186. [Google Scholar] [CrossRef] [PubMed]
- Priya, S.; Burns, M.B.; Ward, T.L.; et al. Identification of shared and disease-specific host gene–microbiome associations across human diseases using multi-omic integration. Nat. Microbiol. 2022, 7, 1579–1590. [Google Scholar] [CrossRef] [PubMed]
- Muller, E.; Shiryan, I.; Borenstein, E. Multi-omic integration of microbiome data for identifying disease-associated modules. Nat. Commun. 2024, 15, 46888. [Google Scholar] [CrossRef] [PubMed]
- Abenavoli, L.; Luigiano, C.; Guzzi, P.H.; Milic, N.; Morace, C.; Stelitano, L.; Consolo, P.; Miraglia, S.; Fagoonee, S.; Virgilio, C.; et al. Serum adipokine levels in overweight patients and their relationship with non-alcoholic fatty liver disease. Panminerva Medica 2014, 56, 189–193. [Google Scholar] [PubMed]
- Andrighetti, T.; Bohár, B.; Lemke, N.; Sudhakar, P.; Korcsmáros, T. MicrobioLink: An integrated computational pipeline to infer functional effects of microbiome-host interactions. bioRxiv 2019, 837062. [Google Scholar] [CrossRef]
- Chen, P.; Li, X.; Yang, S.; Liu, H.; Li, Z. Transkingdom network analysis reveals the dominant role of ileal microbiota in host metabolism. mSystems 2025, 10, e01199–25. [Google Scholar] [CrossRef] [PubMed]
- Galai, G.; Arbel, D.; Klass, K.; Grinshpan, I.; Mizrahi, I.; Pilosof, S. Scale-dependent signatures of microbial co-occurrence revealed via multilayer network analysis, 2023. EcoEvoRxiv. [CrossRef]
- Galai, G.; Arbel, D.; Klass, K.; Grinshpan, I.; Mizrahi, I.; Pilosof, S. Regional processes shape the structure of rumen microbial co-occurrence networks. Ecography 2024, 2024, e07430. [Google Scholar] [CrossRef]
- Yousefi, B.; Firoozbakht, F.; Melograna, F.; Schwikowski, B.; Van Steen, K. PLEX.I: a tool to discover features in multiplex networks that reflect clinical variation. Front. Genet. 2023, 14, 1274637. [Google Scholar] [CrossRef] [PubMed]
- Lee, B.; Zhang, S.; Poleksic, A.; Xie, L. Heterogeneous Multi-Layered Network Model for Omics Data Integration and Analysis. Front. Genet. 2020, 11, 1381. [Google Scholar] [CrossRef] [PubMed]
- Giudice, L.; Mohamed, A.; Malm, T. StellarPath: Hierarchical-vertical multi-omics classifier synergizes stable markers and interpretable similarity networks for patient profiling. PLoS Comput. Biol. 2024, 20, e1012022. [Google Scholar] [CrossRef] [PubMed]
- Yang, Y.; Peng, B.; Wu, S. HGCT-SC: Hierarchical Graph Contrastive Translation for Subtype Clustering. In Proceedings of the ICFTIC, 2025. [Google Scholar] [CrossRef]
- Villette, R.; Novikova, P.V.; Laczny, C.C.; Mollenhauer, B.; May, P.; Wilmes, P. Human gut microbiome gene co-expression network reveals a loss in taxonomic and functional diversity in Parkinson’s disease. npj Biofilms Microbiomes 2025, 11, 780. [Google Scholar] [CrossRef] [PubMed]
- Ma, B.; Hu, H.; Lin, Y.; Wang, Z.; Song, Q. Technology-enabled integration of single-cell transcriptomics and microbiome data identifies RNA-targetable host-microbiota networks in colorectal adenoma. SLAS Technol. 2025, 30, 100365. [Google Scholar] [CrossRef] [PubMed]
- Kurtz, Z.D.; Müller, C.L.; Miraldi, E.R.; Littman, D.R.; Blaser, M.J.; Bonneau, R.A. Sparse and compositionally robust inference of microbial ecological networks. PLoS Comput. Biol. 2015, 11, e1004226. [Google Scholar] [CrossRef] [PubMed]
- Langfelder, P.; Horvath, S. WGCNA: an R package for weighted correlation network analysis. BMC Bioinform. 2008, 9, 559. [Google Scholar] [CrossRef] [PubMed]
- Aksoy, S.G.; Belkin, D.; Kolda, T.G.; Pinar, A. NetLSD: comparing the local and global structure of graphs. arXiv 2018, arXiv:1805.07180. [Google Scholar]
- Hamilton, W.; Ying, Z.; Leskovec, J. Inductive representation learning on large graphs. In Proceedings of the Advances in Neural Information Processing Systems, 2017; pp. 1024–1034. [Google Scholar]
- Agapito, G.; Milano, M.; Guzzi, P.H.; Cannataro, M. Extracting cross-ontology weighted association rules from gene ontology annotations. IEEE/ACM Trans. Comput. Biol. Bioinform. 2015, 13, 197–208. [Google Scholar] [CrossRef] [PubMed]
- Hosseinzadeh, M.M.; Cannataro, M.; Guzzi, P.H.; Dondi, R. Temporal networks in biology and medicine: a survey on models, algorithms, and tools. Netw. Model. Anal. Health Inform. Bioinform. 2022, 12, 10. [Google Scholar] [CrossRef] [PubMed]
Figure 1.
Overview of HiNoN. The same patients define a patient-similarity network and, after subgrouping, paired microbiome co-occurrence and transcriptomic co-expression networks. Path 1 integrates network similarities, whereas Path 2 learns patient representations through graph propagation. Patient colours are schematic and do not imply that disease labels are used in the label-free workflow.
Figure 1.
Overview of HiNoN. The same patients define a patient-similarity network and, after subgrouping, paired microbiome co-occurrence and transcriptomic co-expression networks. Path 1 integrates network similarities, whereas Path 2 learns patient representations through graph propagation. Patient colours are schematic and do not imply that disease labels are used in the label-free workflow.
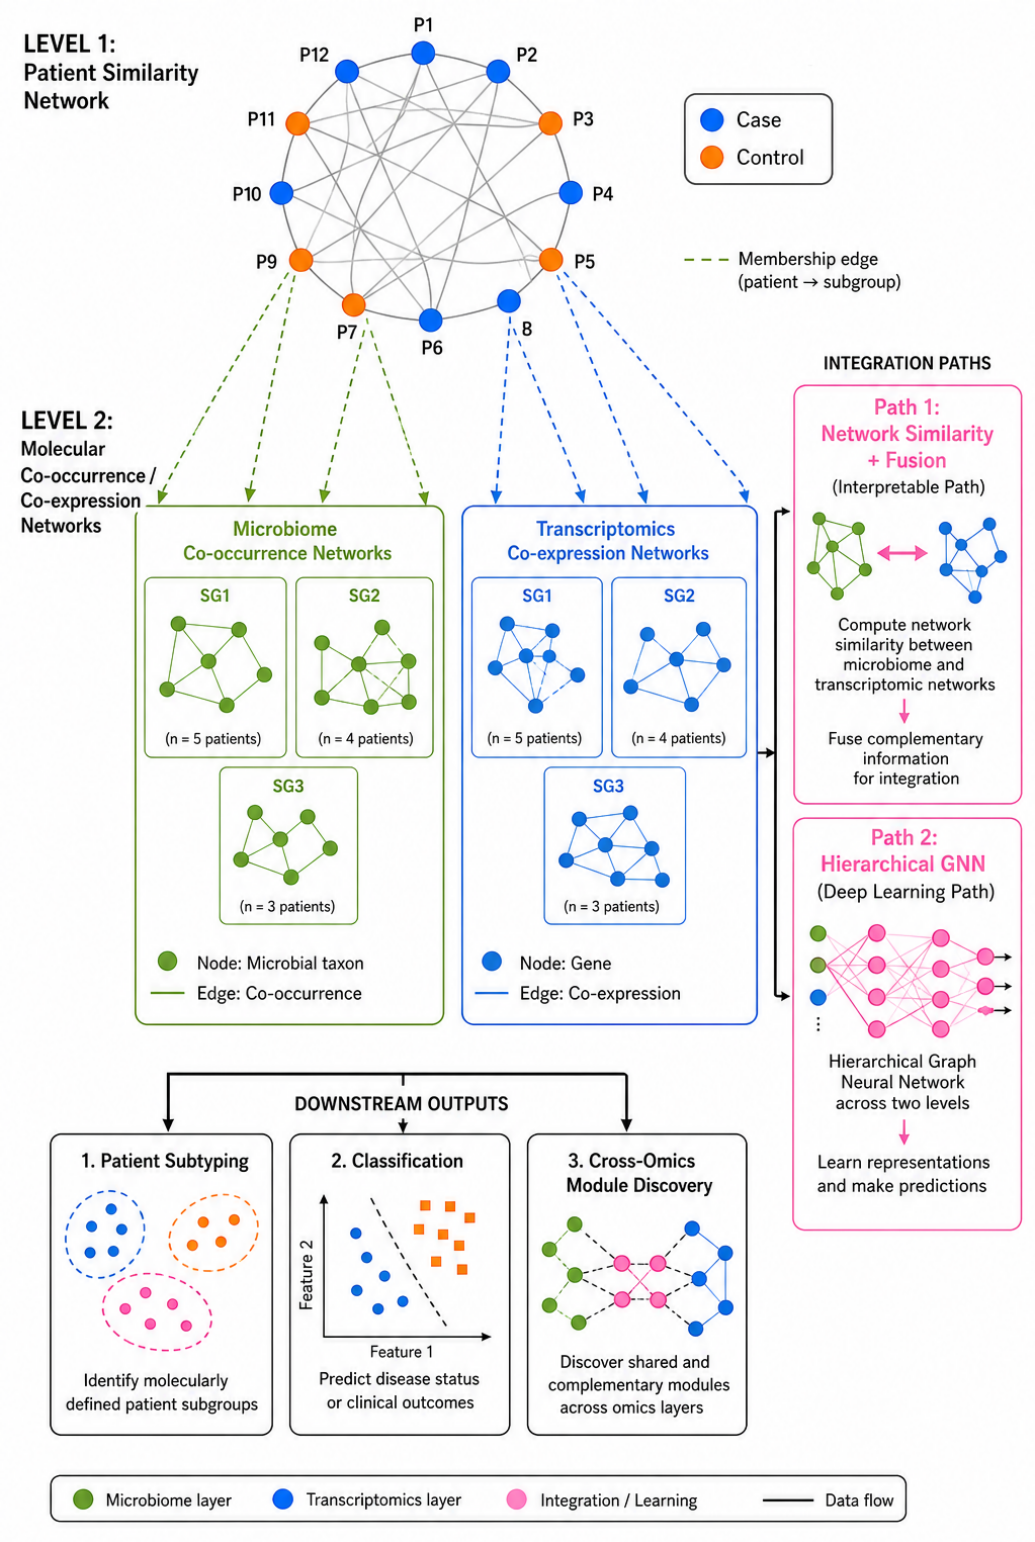
Figure 2.
Simulation results across noise levels, sample sizes, subgroup numbers, and missing-data fractions. Error bars denote standard deviations over ten replicates.
Figure 2.
Simulation results across noise levels, sample sizes, subgroup numbers, and missing-data fractions. Error bars denote standard deviations over ten replicates.
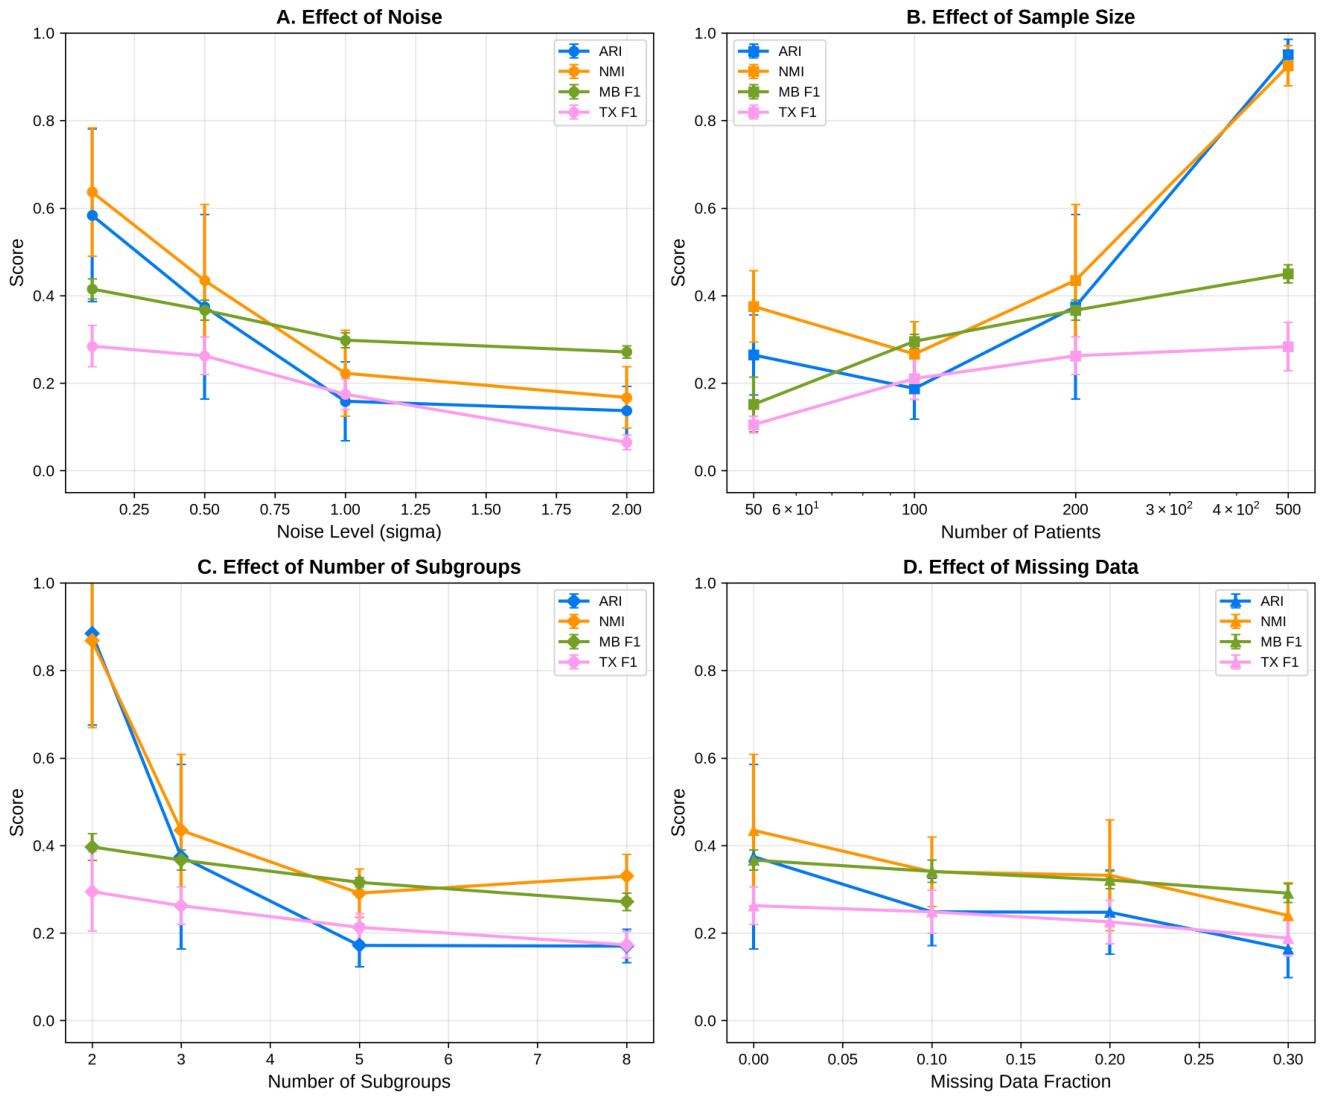
Figure 3.
Leakage-free CAD sensitivity analysis. Mean outer-fold ROC–AUC and standard deviation across 50 folds are shown for early concatenation and HiNoN-path2-SGC while varying (A) PCA dimensionality, (B) patient-network neighborhood size, and (C) the number of label-free subgroups. The prespecified primary configuration used 16 components, 10 neighbors, and 2 subgroups.
Figure 3.
Leakage-free CAD sensitivity analysis. Mean outer-fold ROC–AUC and standard deviation across 50 folds are shown for early concatenation and HiNoN-path2-SGC while varying (A) PCA dimensionality, (B) patient-network neighborhood size, and (C) the number of label-free subgroups. The prespecified primary configuration used 16 components, 10 neighbors, and 2 subgroups.
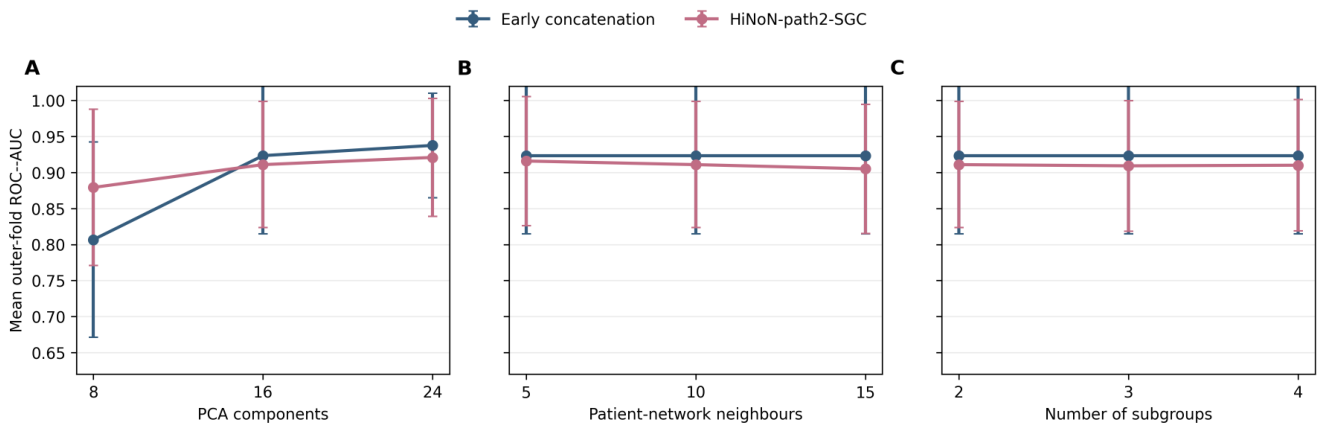

Table 1.
Leakage-free repeated nested cross-validation on the CAD dataset under the prespecified primary configuration. Values are means across 50 outer folds; parenthetical values are fold-level standard deviations. Lower Brier score and ECE indicate better calibration.
Table 1.
Leakage-free repeated nested cross-validation on the CAD dataset under the prespecified primary configuration. Values are means across 50 outer folds; parenthetical values are fold-level standard deviations. Lower Brier score and ECE indicate better calibration.
| Method | ROC–AUC | PR–AUC | Balanced accuracy | F1 | Brier | ECE |
|---|---|---|---|---|---|---|
| Early concatenation | 0.923 (0.109) | 0.958 (0.062) | 0.848 (0.113) | 0.881 (0.095) | 0.113 (0.065) | 0.190 (0.071) |
| HiNoN-path2-SGC | 0.911 (0.087) | 0.949 (0.054) | 0.840 (0.111) | 0.861 (0.121) | 0.125 (0.064) | 0.205 (0.053) |
Disclaimer/Publisher’s Note: The statements, opinions and data contained in all publications are solely those of the individual author(s) and contributor(s) and not of MDPI and/or the editor(s). MDPI and/or the editor(s) disclaim responsibility for any injury to people or property resulting from any ideas, methods, instructions or products referred to in the content. |
© 2026 by the authors. Licensee MDPI, Basel, Switzerland. This article is an open access article distributed under the terms and conditions of the Creative Commons Attribution (CC BY) license (http://creativecommons.org/licenses/by/4.0/).
Copyright: This open access article is published under a Creative Commons CC BY 4.0 license, which permit the free download, distribution, and reuse, provided that the author and preprint are cited in any reuse.