

Submitted:
01 September 2026
Posted:
03 September 2026
You are already at the latest version
Abstract
Background: Mesenchymal stromal cell-derived conditioned medium (MSC-CM) represents a promising cell-free approach for regenerative medicine; however, variability in production conditions remains a major challenge for standardization. This study investigated how serum-free conditioning duration influences the proteomic composition and regenerative activity of human dental pulp stem cell-conditioned medium (DPSC-CM). Methods: DPSC-CM was collected after 24, 48, and 72 h of serum-free conditioning and characterized by label-free LC-MS/MS proteomics using donor-blocked differential abundance analysis. DPSC viability and apoptosis were assessed by Annexin V/PI flow cytometry. The angiogenic activity of CM 48 h and CM 72 h was evaluated using the ex ovo chick chorioallantoic membrane (CAM) assay, while all CM groups were assessed for their effects on human exfoliated deciduous teeth (SHED) metabolic activity and osteogenic differentiation. Osteogenesis was evaluated by alkaline phosphatase (ALP) and Alizarin Red S (ARS) staining. PI3K/Akt signaling was investigated for CM 48 h by Western blotting. Results: Serum-free conditioning for up to 72 h did not significantly affect DPSC viability or apoptosis. Proteomic analysis identified 1562 proteins. Differential abundance analysis identified 914 differentially abundant proteins (DAPs) between CM 48 h and CM 24 h and 745 between CM 72 h and CM 24 h, whereas no DAPs were detected between CM 72 h and CM 48 h. Enriched biological processes included extracellular matrix organization, cell-substrate adhesion, cytoskeletal organization, protein folding, and angiogenesis-related pathways. In the CAM assay, CM 48 h in-creased total vessel area, whereas CM 72 h increased total vessel length. CM 48 h en-hanced SHED metabolic activity at day 3. Although ALP staining did not differ significantly among groups, CM 48 h produced greater matrix mineralization than CM 24 h. PI3K inhibition reduced Akt phosphorylation, whereas CM 48 h had no significant effect on the p-Akt/Akt ratio. Conclusion: Serum-free conditioning duration influences DPSC-CM composition and biological activity, with the major proteomic transition occurring between 24 and 48 h. Among the conditioning periods evaluated, 48 h demonstrated the most consistent combination of proteomic and functional effects, supporting further investigation as a candidate conditioning duration for DPSC-CM production.
Keywords:
dental pulp stem cells
; conditioned medium
; secretome
; serum-free conditioning
; proteomics
; angiogenesis
; osteogenesis
1. Introduction
Mesenchymal stromal cells (MSCs) have considerable potential for tissue regeneration; however, accumulating evidence indicates that many of their therapeutic effects are mediated through paracrine mechanisms rather than long-term engraftment or direct differentiation. Accordingly, MSC-derived secretome products, including conditioned medium (MSC-CM) and extracellular vesicles (EVs), have emerged as promising cell-free alternatives that retain many of the regenerative properties attributed to MSCs. Such approaches may overcome some of the limitations associated with viable cell transplantation, including limited cell persistence, storage and transport requirements, and production complexity, thereby facilitating the development of standardized regenerative therapies [1,2,3].
Among MSC sources, dental pulp stem cells (DPSCs) are of particular interest because of their accessibility, high proliferative capacity, neural crest origin, and regenerative properties [1]. DPSC-derived conditioned medium (DPSC-CM) contains a diverse repertoire of growth factors, cytokines, extracellular matrix proteins, proteases, and other bioactive molecules capable of regulating cell proliferation, migration, matrix remodeling, and tissue repair [2,5,9]. Consistent with this molecular complexity, DPSC-CM has demonstrated angiogenic, immunomodulatory, osteogenic, antioxidative, and tissue-regenerative activities in experimental models [4,5,6,7,8]. Recent studies have further demonstrated the potential of dental stem cell-derived secretome for bone regeneration [7,10]. Collectively, these findings support the therapeutic potential of DPSC-CM while emphasizing the importance of reproducible production conditions that preserve its biological activity.
The composition and biological activity of MSC secretome are highly dependent on the conditions under which they are produced. Donor characteristics, cell passage, culture environment, oxygen tension, inflammatory priming, serum deprivation, cell density and confluency, conditioning medium and duration, downstream processing, and storage can influence the resulting secretome [2,11,12,13]. Variability in these parameters may contribute to differences in secretome composition and potency across studies and production batches, thereby complicating product characterization, reproducibility, and clinical translation. Consequently, defining and controlling critical production parameters has become an important consideration in the development of MSC secretome-based therapeutics [2,12,13].
Conditioning duration represents one such critical production parameter because it determines both the period available for accumulation of secreted factors and the duration of cellular exposure to the conditioning environment. Evidence from other MSC sources indicates that secretome composition and biological activity vary across conditioning periods of 24–96 h, although the observed effects may depend on factors such as cell confluence and inflammatory stimulation [14,15]. Similar variability exists in DPSC studies, where conditioned media have been collected over different durations and have demonstrated biological activities relevant to tissue regeneration, including effects on cell viability and mineralization [16]. However, prolonged serum-free conditioning may also influence cellular metabolism, stress responses, and the release of intracellular components associated with cell damage [11]. Consequently, conditioning duration may affect not only the accumulation of secreted factors but also their molecular composition and biological activity. Nevertheless, systematic investigations integrating DPSC viability, global secretome profiling, and functional assessment across defined conditioning periods remain limited [17,18].
Therefore, the present study aimed to investigate the influence of conditioning duration on the composition and biological activity of DPSC-CM. Using integrated proteomic and functional analyses, we examined how conditioning duration affects secretome profiles and regenerative functions relevant to tissue repair. We hypothesized that conditioning duration would significantly influence both secretome composition and biological activity.
2. Materials and Methods
2.1. Isolation and Culture of DPSCs and SHED
Human dental pulp stem cells (DPSCs) were isolated from impacted third molars obtained from healthy adult donors aged 18–24 years following written informed consent, whereas stem cells from human exfoliated deciduous teeth (SHED) were isolated from exfoliated deciduous teeth obtained from children following written informed consent from their parents or legal guardians. All procedures were approved by the Regional Committee for Medical and Health Research Ethics, Norway (REK project: 2009/610/REK vest), and cell isolation was performed as previously described [19]. DPSCs and SHED were maintained in Dulbecco's Modified Eagle's Medium (DMEM) supplemented with 10% fetal bovine serum (FBS; Sigma-Aldrich) and 1% penicillin-streptomycin (Invitrogen) at 37 °C in a humidified atmosphere containing 5% CO₂. Both cell populations were characterized for their MSC-like phenotype by flow cytometric assessment of mesenchymal and hematopoietic surface markers and by evaluation of osteogenic and adipogenic differentiation potential.
2.2. Assessment of DPSC Viability and Apoptosis during Serum-Free Conditioning
Cell viability and apoptosis were evaluated at baseline and after 24, 48, and 72 h of serum-free conditioning using the FITC Annexin V Apoptosis Detection Kit II (BD Biosciences, Franklin Lakes, NJ, USA). Samples were analyzed on a BD Accuri™ C6 flow cytometer and classified as viable (Annexin V⁻/PI⁻), early apoptotic (Annexin V⁺/PI⁻), late apoptotic (Annexin V⁺/PI⁺), or necrotic (Annexin V⁻/PI⁺). Analyses were performed using cells from five independent donors (n = 5). Detailed procedures are provided in Appendix A.1.
2.3. Preparation of DPSC-Conditioned Medium
Passage 3 DPSCs from three independent donors (n = 3) were seeded at a density of 5 × 10³ cells/cm² and cultured to 85-90% confluence. Cells were washed three times with phosphate-buffered saline (PBS) before incubation in serum-free DMEM for 24, 48, or 72 h. Conditioned medium (CM) was collected separately at each time point and processed as previously described [19]. Briefly, 15 mL of CM from each donor and conditioning time was concentrated to ≤300 μL using Amicon Ultra-15 centrifugal filter units fitted with 3-kDa molecular-weight cut-off membranes (Merck Millipore, USA). As a medium control, DMEM was incubated for 48 h in the absence of cells and processed using the same protocol (control-DMEM). Total protein concentration was measured using the bicinchoninic acid (BCA) assay. For label-free quantitative proteomic analysis, 20 μg of total protein from each concentrated CM sample was used [20,21]. Unless otherwise specified, CM applied in functional assays was standardized to a final concentration of 15 μg/mL total protein.
2.4. LC-MS/MS Proteomic and Bioinformatic Analysis
Raw mass spectrometry data were processed using Proteome Discoverer (version 2.5.0.400; Thermo Fisher Scientific), followed by downstream analysis in Perseus (version 2.0.3.1; Max Planck Institute of Biochemistry) and R (version 4.4.1). Contaminants, proteins identified by fewer than two unique peptides, and proteins with less than 10% sequence coverage were excluded. For each conditioning time, proteins detected in all three biological donors (100% valid values) were retained, after which datasets were merged. Protein entries lacking an annotated gene symbol were removed from subsequent analyses. Protein overlap between conditioning times was visualized using Venn diagrams, while global proteomic variation was explored by principal component analysis (PCA) and hierarchical clustering based on normalized protein abundances. Differential protein abundance analysis was conducted using the limma package in R. Donor identity was included as a blocking factor, and within-donor correlation was estimated using the duplicateCorrelation function. Pairwise comparisons were performed between CM 48 h and CM 24 h, CM 72 h and CM 24 h, and CM 72 h and CM 48 h using empirical Bayes moderation with mean-variance trend adjustment (eBayes, trend = TRUE). Multiple testing correction was applied using the Benjamini-Hochberg false discovery rate (FDR) method. Proteins with FDR ≤ 0.05 and |log₂FC| ≥ 0.50 were considered differentially abundant proteins (DAPs). Hierarchical clustering heatmaps were generated for DAPs identified in the CM 48 h vs. CM 24 h and CM 72 h vs. CM 24 h comparisons.
Gene Ontology Biological Process (GOBP) over-representation analysis was performed using the clusterProfiler package in R, with the annotated human genome as the reference background. Gene symbols were converted to Entrez Gene identifiers using org.Hs.eg.db, and terms with Benjamini-Hochberg-adjusted p < 0.05 were considered significantly enriched. Enrichment analyses were conducted for CM 48 h vs. CM 24 h and CM 72 h vs. CM 24 h comparisons, as no DAPs were identified between CM 72 h and CM 48 h. Significantly enriched GOBP terms related to vascular development and angiogenesis were subsequently selected for focused analysis and visualization.
2.5. Chorioallantoic Membrane (CAM) Assay and Vessel Quantification
The angiogenic potential of DPSC-CM was assessed using an ex ovo chick chorioallantoic membrane (CAM) assay as previously described [10]. Embryos were transferred to an ex ovo culture system on embryonic day (ED) 3. On ED7, silicone rings were placed on the CAM surface and treated with control-DMEM, CM 48 h, or CM 72 h (15 μg total protein per ring). Each experimental group included five to six independent embryos. After 48 h of treatment, the CAM regions within the rings were harvested and imaged. Vascular parameters were quantified using the IKOSA CAM Assay Application (KML Vision GmbH, Graz, Austria). Additional methodological details are provided in Appendix A.2.
2.6. Assessment of SHED Metabolic Activity
SHED, previously isolated and characterized as described elsewhere [22], were seeded in 96-well plates at a density of 3 × 10³ cells per well and treated with CM 24 h, CM 48 h, or CM 72 h (15 μg/mL total protein). Control cells received the corresponding control growth medium. Cellular metabolic activity was assessed on days 1, 3, and 7 using PrestoBlue™ Cell Viability Reagent (Thermo Fisher Scientific). Fluorescence intensity was used as an indirect measure of cellular metabolic activity. Detailed procedures are described in Appendix A.3.
2.7. In Vitro Osteogenic Effects of DPSC-CM
SHED were seeded at 3 × 10³ cells/cm² and cultured under osteogenic conditions in the presence of CM 24 h, CM 48 h, or CM 72 h (15 μg/mL total protein). The osteogenic induction medium consisted of 100 nM dexamethasone, 45 μM ascorbic acid, and 20 mM β-glycerophosphate. Early osteogenic differentiation was evaluated by alkaline phosphatase (ALP) staining on day 7, whereas matrix mineralization was assessed by Alizarin Red S (ARS) staining on day 14. Following imaging, both staining assays were quantified by extraction of the bound stain and measurement of absorbance at 540 nm. Further experimental details are provided in Appendix A.4.
2.8. Assessment of PI3K/Akt Signaling by Western Blot Analysis
To investigate the involvement of PI3K/Akt signaling during osteogenic differentiation, SHED were cultured for 4 days under four experimental conditions: osteogenic medium (OM), OM supplemented with CM 48 h (15 μg/mL total protein), OM supplemented with the PI3K inhibitor LY294002 (20 μM), and OM supplemented with both CM 48 h and LY294002. To account for biological variability, Western blot analyses were performed using samples from all donors, and densitometric quantification was based on data from all biological replicates. Protein expression levels of phosphorylated Akt (p-Akt) and total Akt were assessed by Western blotting. Band intensities were quantified using Image Lab software (Bio-Rad, USA), and Akt activation was evaluated based on both p-Akt expression and the p-Akt/Akt ratio. Additional procedural details are provided in Appendix A.5.
2.9. Statistical Analysis
Data are presented as mean ± standard deviation (SD), unless otherwise stated. Statistical analyses of the experimental data were performed using GraphPad Prism version 10.1.2 (GraphPad Software, San Diego, CA, USA), followed by Tukey’s multiple-comparisons test where applicable. A p value < 0.05 was considered statistically significant.
3. Results
3.1. Characterization of DPSCs
DPSCs exhibited the characteristic spindle-shaped, fibroblast-like morphology and expressed the MSC-associated markers CD73, CD90, and CD105, while showing minimal expression of CD34, CD45, and HLA-DR. Osteogenic and adipogenic differentiation was confirmed by Alizarin Red S and Oil Red O staining, respectively. Detailed characterization results are presented in Supplementary Figure S1.
3.2. DPSC Viability during Serum-Free Conditioning
DPSC viability and apoptosis were evaluated by Annexin V-FITC/PI flow cytometry at baseline and after 24, 48, and 72 h of serum-free conditioning (Figure 1Ai-ii). At baseline, the majority of cells were viable (81.6 ± 8.1%), while early apoptotic, late apoptotic, and necrotic cells accounted for 5.9 ± 2.3%, 5.8 ± 1.3%, and 0.54 ± 0.40%, respectively. Following serum-free conditioning, cell viability remained relatively stable, with viable cells comprising 75.7 ± 10.1%, 76.4 ± 13.3%, and 70.9 ± 17.4% of the population at 24, 48, and 72 h, respectively. Early apoptotic cells ranged from 17.0 to 22.5%, whereas late apoptotic cells remained between 5.1 and 6.5% across the conditioning periods. Necrotic cells consistently represented less than 1% of the total cell population. No significant differences were observed among conditioning durations in the proportions of viable, early apoptotic, late apoptotic, or necrotic cells (all p > 0.05).
3.3. Profiling of DPSC-CM by Mass Spectrometry
The proteomic profiles of CM 24 h, CM 48 h, and CM 72 h were compared using label-free LC–MS/MS (Supplementary Data File, Sheet 1). After filtering each dataset to retain only proteins consistently detected in all three biological donors, the protein profiles were compared across conditioning durations. Most retained proteins were shared among all three conditions, with 1562 proteins commonly detected in CM 24 h, CM 48 h, and CM 72 h (Figure 1Bi; Supplementary Data File, Sheet 2). Only a limited number of proteins were unique to individual conditioning times, including 10 proteins in CM 24 h, 9 proteins in CM 48 h, and 22 proteins in CM 72 h. Pairwise overlaps included 8 proteins shared between CM 24 h and CM 48 h, 16 between CM 24 h and CM 72 h, and 175 between CM 48 h and CM 72 h but not detected in CM 24 h. Hierarchical clustering of normalized protein abundances showed separation according to conditioning duration, with CM 24 h displaying a protein-abundance pattern distinct from CM 48 h and CM 72 h, whereas the latter two groups exhibited more similar global profiles (Figure 1Bii). PCA supported this pattern (Figure 1Ci), with PC1 accounting for 81.3% of the total variance and separating CM 24 h from CM 48 h and CM 72 h, while PC2 accounted for an additional 6.4% of the variance.
3.4. Time-Dependent Changes in the DPSC-CM Proteome
Differential protein abundance was analyzed using a donor-blocked linear model, with an estimated consensus within-donor correlation of 0.585. Volcano plot analysis demonstrated extensive differences in protein abundance between CM 24 h and the two later conditioning times (Figure 1Cii). At FDR ≤ 0.05 and |log₂FC| ≥ 0.50, 914 DAPs were identified between CM 48 h and CM 24 h, of which 912 showed higher abundance and 2 showed lower abundance in CM 48 h (Figure 1Cii, left; Supplementary Data File, Sheet 3). Similarly, 745 DAPs were identified between CM 72 h and CM 24 h, with 743 showing higher abundance and 2 showing lower abundance in CM 72 h (Figure 1Cii, middle; Supplementary Data File, Sheet 4). In contrast, no proteins met the predefined differential-abundance criteria in the CM 72 h vs. CM 48 h comparison (Figure 1Cii, right; Supplementary Data File, Sheet 5). Hierarchical clustering of the DAPs further demonstrated distinct abundance patterns between CM 24 h and the later conditioning times (Figure 1D). In both comparisons, the majority of DAPs showed relatively higher abundance in CM 48 h or CM 72 h than in CM 24 h, whereas smaller protein clusters showed relatively higher abundance in CM 24 h (black arrows; Figure 1Di-ii).
3.5. Gene Ontology Enrichment Analysis of Differentially Abundant Proteins
To investigate biological processes associated with temporal differences in DPSC-CM composition, GOBP over-representation analysis was performed on the DAPs identified in the CM 48 h vs. CM 24 h and CM 72 h vs. CM 24 h comparisons. No enrichment analysis was performed for the CM 72 h vs. CM 48 h comparison because no proteins met the predefined differential abundance criteria. DAPs identified in the CM 48 h vs. CM 24 h comparison were significantly enriched for biological processes related to protein folding, extracellular matrix organization, cell-substrate adhesion, extracellular structure organization, external encapsulating structure organization, chaperone-mediated protein folding, collagen fibril organization, protein-RNA complex organization, negative regulation of proteolysis, and wound healing (Figure 1Ei). Similarly, DAPs identified in the CM 72 h vs. CM 24 h comparison were significantly enriched for biological processes related to extracellular matrix organization, extracellular structure organization, external encapsulating structure organization, cell-substrate adhesion, collagen fibril organization, cell-matrix adhesion, regulation of cell-substrate adhesion, negative regulation of proteolysis, regulation of peptidase activity, and ossification (Figure 1Eii).
3.6. DPSC-CM Enhances Vascular Parameters in the Ex Ovo CAM Assay
Given the central role of angiogenesis in tissue regeneration, we examined significantly enriched vascular- and angiogenesis-related GOBP terms identified from the DAPs in the CM 48 h vs. CM 24 h and CM 72 h vs. CM 24 h comparisons (Figure 2Ai-ii). Enriched processes included VEGF signaling and response, endothelial cell migration and proliferation, vasculature development, vascular permeability, and hypoxia-related responses (Figure 2Ai-ii). To explore these findings further, vascular- and angiogenesis-related DAPs were selected based on Gene Ontology annotations. These proteins comprised pro-angiogenic ligands, vascular signaling receptors, extracellular matrix and basement membrane components, matrix-remodeling enzymes, protease inhibitors, adhesion molecules, and regulators of vascular homeostasis (Supplementary Table S1). To functionally evaluate the angiogenesis-related proteomic findings, the angiogenic activity of CM 48 h and CM 72 h was subsequently assessed using the CAM assay. Representative CAM images and vessel-segmentation maps are presented in Figure 2B. Quantitative analysis showed that CM 48 h significantly increased total vessel area compared with the control group (*p < 0.05), whereas CM 72 h significantly increased total vessel length (*p < 0.05; Figure 2Ci-ii). No significant differences were detected in mean vessel thickness or branching points between groups (Figure 2Ciii-iv).
3.7. DPSC-CM Enhances the Metabolic Activity of SHED
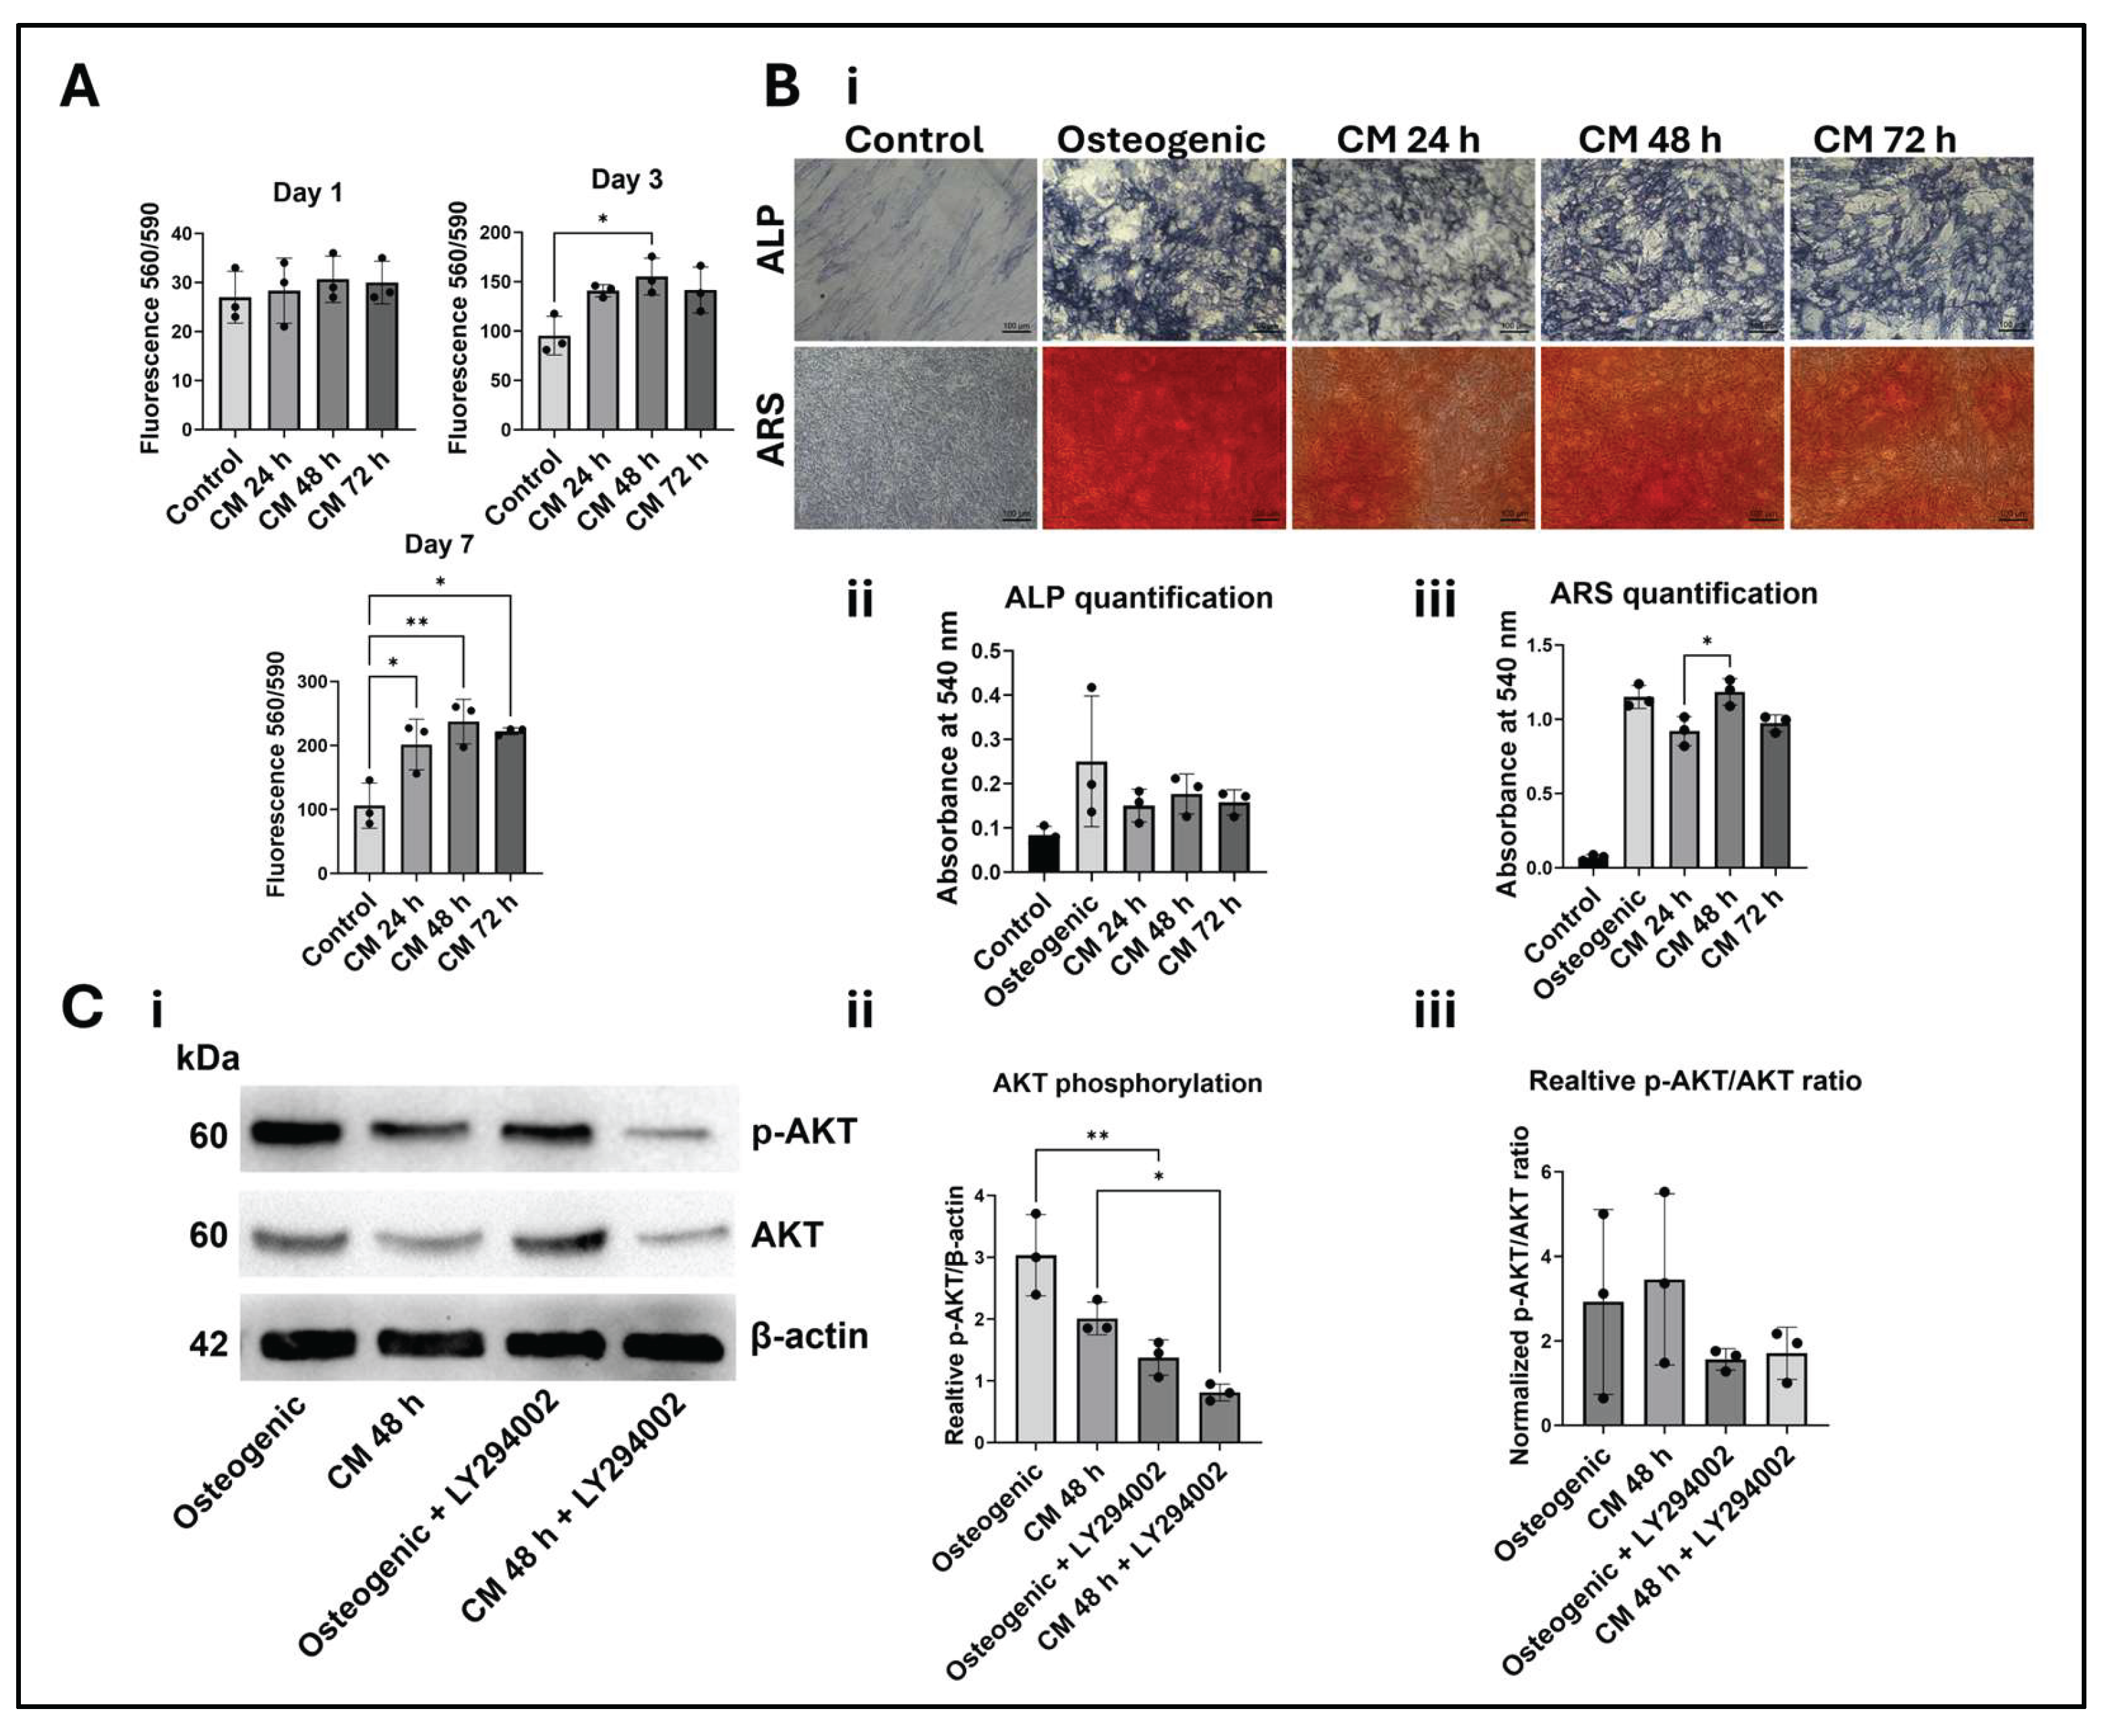
The biological activity of DPSC-CM was evaluated by measuring SHED metabolic activity using the PrestoBlue assay on days 1, 3, and 7 (Figure 3A). On day 1, no significant differences in metabolic activity were observed among the experimental groups. By day 3, treatment with CM 48 h significantly increased metabolic activity compared with the control group (*p < 0.05), whereas CM 24 h and CM 72 h did not differ significantly from the control group. On day 7, all DPSC-CM-treated groups exhibited significantly higher metabolic activity than the control group. The increase was significant for CM 24 h (*p < 0.05) and CM 48 h and CM 72 h (**p < 0.01). Although CM 48 h showed the highest mean metabolic activity among the DPSC-CM groups on days 3 and 7, no significant differences were detected among the three DPSC-CM groups.
3.8. DPSC-CM Influences the Osteogenic Differentiation of SHED
The osteogenic activity of DPSC-CM collected after 24, 48, and 72 h was evaluated by ALP and ARS staining of SHED. Representative images demonstrated ALP and ARS staining in the osteogenic and DPSC-CM-treated groups, whereas minimal staining was observed in the non-osteogenic control group (Figure 3Bi). Quantification of ALP staining showed numerically lower mean ALP values in all DPSC-CM-treated groups compared with the osteogenic control group; however, these differences were not statistically significant (Figure 3Bii). Quantification of ARS staining showed that CM 48 h resulted in significantly greater mineralization than CM 24 h (*p < 0.05; Figure 3Biii). CM 24 h and CM 72 h showed numerically lower mean ARS values than the osteogenic control group, whereas CM 48 h showed the highest mean ARS value among the DPSC-CM groups. Apart from the difference between CM 48 h and CM 24 h, no statistically significant differences were detected.
3.9. PI3K Inhibition Attenuates Akt Phosphorylation during Osteogenic Culture
Based on the overall functional performance of CM 48 h in the preceding experiments, CM 48 h was selected for further investigation of PI3K/Akt signaling at day 4. Representative immunoblots of phosphorylated Akt (p-Akt), total Akt, and β-actin are shown in Figure 3Ci, while donor-specific immunoblots are provided in Supplementary Figure S2. Densitometric analysis of p-Akt normalized to β-actin showed significantly lower p-Akt levels in the OM + LY294002 group than in the OM group (**p < 0.01) and in the CM 48 h + LY294002 group than in the CM 48 h group (*p < 0.05; Figure 3Cii). In contrast, the p-Akt/Akt ratio did not differ significantly among the experimental groups (Figure 3Ciii). Although CM 48 h showed a numerically higher mean p-Akt/Akt ratio than OM, and lower mean ratios were observed in the LY294002-treated groups, these differences were not statistically significant.
4. Discussion
The present study demonstrates that serum-free conditioning duration influences both the composition and biological activity of DPSC-CM. While DPSC viability was not significantly affected across the conditioning periods examined, the secretome underwent substantial temporal remodeling, with the most pronounced proteomic changes occurring between 24 and 48 h. These molecular changes were accompanied by differences in metabolic and osteogenic responses, while CM 48 h and CM 72 h demonstrated effects on selected angiogenic parameters, supporting conditioning duration as an important determinant of DPSC-CM biological activity.
Importantly, DPSC viability remained largely unchanged across the serum-free conditioning periods, indicating that extending conditioning to 72 h did not substantially compromise cell survival. Nevertheless, preservation of viability does not exclude cellular responses to serum deprivation, which may influence secretome composition and biological activity [11]. The donor-dependent variation observed, particularly in early apoptosis, suggests that individual cellular responses to serum withdrawal should not be overlooked. Similar studies have reported that MSCs generally retain high viability under serum-free conditions, although outcomes depend on conditioning duration and culture parameters [11,16].
Proteomic analyses demonstrated pronounced temporal remodeling of DPSC-CM. PCA and hierarchical clustering consistently indicated a major proteomic transition between 24 and 48 h. This pattern was further supported by the protein-overlap analysis, in which 175 proteins were detected in both CM 48 h and CM 72 h but not in CM 24 h. Together with the comparable direction of protein abundance changes at 48 and 72 h and the absence of significant DAPs between these later time points, these findings suggest that the major detectable proteomic transition occurred by 48 h, with comparatively limited changes thereafter. GOBP enrichment of the DAPs indicated that these temporal differences involved biologically coherent processes related to extracellular matrix organization, cell interactions, and tissue regeneration, consistent with previous proteomic characterization of DPSC secretome [12]. More recently, comparative proteomic analysis of dental-origin stem cells identified distinct cell type-specific secretome profiles, with DPSC-derived proteins associated with proliferation, growth-factor signaling, and stemness [23]. The temporal pattern observed in the present study is also consistent with evidence from other MSC systems showing that secretome production varies over the conditioning period [14,15], although direct comparison should be made cautiously because conditioning duration was evaluated together with other culture variables in one of these studies [15]. Similar temporal variation has been reported in dental pulp-derived secretome [16], while 48 h has previously been used effectively to produce DPSC-CM with neuroregenerative activity [24]. Collectively, these studies support conditioning duration as an important process variable and provide relevant context for the temporal proteomic changes observed in the present study.
An important consideration is that all functional assays were performed using DPSC-CM normalized to the same total protein concentration (15 µg/mL). Consequently, differences in biological activity are unlikely to be explained by protein quantity alone and more likely reflect qualitative differences in secretome composition or the abundance of bioactive constituents. This distinction is important because DPSC-CM does not appear to follow a simple linear concentration-response relationship, with different proliferative and osteogenic outcomes reported at different secretome concentrations [17]. Therefore, total protein content alone may not be a reliable indicator of potency, and optimization should consider both conditioning parameters and administered concentration alongside functional outcomes [13,17].
The CAM results further support the angiogenic potential of DPSC-CM, although the effects were evident in selected vascular parameters rather than uniformly across all vascular features. This functional response is consistent with the enrichment of angiogenesis- and vascular-related biological processes identified from the DAPs and with the presence of proteins associated with VEGF signaling, vascular development, extracellular matrix remodeling, cell adhesion, and vascular homeostasis. In our previous work, DPSC-CM contained numerous angiogenic factors and enhanced endothelial-cell adhesion, proliferation, migration, and network formation in vitro [9]. Comparable pro-angiogenic properties of DPSCs have also been reported [25], while more recent studies indicate that DPSC-derived soluble factors promote angiogenesis through endothelial activation and modulation of the inflammatory microenvironment [5]. The pro-vascular response observed in the present study is also consistent with our previous CAM study using whole 48-h DPSC-CM incorporated into GelMA hydrogels [8]. Together, these findings support a pro-vascular role for DPSC-derived factors across experimental systems. However, because the CAM analysis was limited to CM 48 h and CM 72 h, further studies including all conditioning periods are required to determine whether conditioning duration differentially influences specific aspects of the angiogenic response.
DPSC-CM also enhanced SHED metabolic activity and supported osteogenic differentiation, with CM 48 h producing the most consistent overall response, particularly regarding matrix mineralization. However, osteogenesis was not consistently superior to that achieved with conventional osteogenic induction, suggesting that conditioning duration modulates the osteogenic potential of DPSC-CM rather than uniformly enhancing all osteogenic endpoints. Earlier studies have reported proliferative and osteogenic effects of conditioned media derived from dental stem cells [26], while more recent studies using whole 48-h DPSC-CM have demonstrated osteogenic and bone-regenerative effects [7,8,10]. These findings provide relevant support for the biological activity of 48-h DPSC-CM, although direct comparison with the present study requires caution because the previous studies used whole CM, whereas DPSC-CM in the present study was concentrated and standardized to 15 µg/mL total protein. Differences in secretome processing and concentration may partly account for the comparatively modest osteogenic response observed in the current study, particularly given the concentration-dependent and non-linear effects reported for DPSC-CM [17]. Overall, both conditioning duration and secretome concentration appear important when optimizing DPSC-CM for osteogenic applications.
Given the favorable biological performance of CM 48 h, we investigated whether PI3K/Akt signaling contributed to its effects. The PI3K/Akt pathway is a well-established regulator of osteogenic and odontogenic differentiation, and inhibition of this pathway has been shown to reduce Akt phosphorylation and impair odontogenic differentiation in dental pulp stem cells [27]. In the present study, LY294002 effectively reduced p-Akt levels, confirming successful pathway inhibition. In contrast, CM 48 h did not significantly affect Akt phosphorylation or the p-Akt/Akt ratio at day 4. These results do not support sustained PI3K/Akt activation as a major mechanism underlying CM 48 h activity at the examined time point. Nevertheless, transient activation cannot be excluded, particularly because phosphorylation-dependent signaling often occurs rapidly and may not be captured at later stages. Moreover, the biological effects of DPSC-CM are likely mediated through multiple interacting pathways. Future time-course studies incorporating targeted pathway inhibition will be required to more clearly define the contribution of PI3K/Akt signaling to DPSC-CM function.
A major strength of this study is the integration of donor-matched proteomic profiling with DPSC viability assessment and complementary functional analyses. Nevertheless, the proteomic analysis included only three biological donors, functional experiments were performed at a single DPSC-CM concentration, the CAM analysis did not include all conditioning periods, and the concentrated secretome was not fractionated into soluble and extracellular-vesicle-associated components. Moreover, functional validation was limited to in vitro and ex ovo models. Larger donor cohorts, dose-response analyses, targeted validation of selected DAPs, and animal studies will therefore be important for further validation and translation [1,2,13].
5. Conclusions
This study demonstrates that serum-free conditioning duration influences the proteomic composition and biological activity of DPSC-CM, with the major proteomic transition occurring between 24 and 48 h and comparatively limited changes thereafter. Among the conditions examined, CM 48 h was associated with the most consistent combination of proteomic and functional findings, supporting its further evaluation as a conditioning period for DPSC-CM production.
Supplementary Materials
The supporting information can be downloaded at the website of this paper posted on Preprints.org. Supplementary Data File: Unnormalized and normalized-filtered datasets (Sheets 1 and 2, respectively); differential protein abundance analyses for CM 48 h vs. CM 24 h (Sheet 3), CM 72 h vs. CM 24 h (Sheet 4), and CM 72 h vs. CM 48 h (Sheet 5); Figure S1. In vitro characterization of DPSCs; Figure S2: Original Western blot membrane images used for PI3K/Akt signaling analysis; Table S1: Selected angiogenesis- and vascular-related differentially abundant proteins.
Author Contributions
Conceptualization, N.A.-S., I.F.; methodology, N.A.-S., R.S., S.Y., E.B., S.S., K.M. and I.F.; formal analysis, N.A.-S.; investigation, N.A.-S., R.S., S.Y., E.B. and S.S.; resources, K.M. and I.F.; data curation, N.A.-S.; writing-original draft preparation, N.A.-S.; writing-review and editing, N.A.-S., R.S., S.Y., E.B., S.S., K.M. and I.F.; visualization, N.A.-S.; supervision, K.M. and I.F.; project administration, N.A.-S. and I.F.; funding acquisition, K.M. and I.F. All authors have read and agreed to the published version of the manuscript.
Funding
This research was supported by the Research Council of Norway, grant no. 302043 (Småforsk grant), awarded to I.F., and the Trond Mohn Foundation, Norway, grant no. 2021TMT08, awarded to K.M. Trond Mohn Foundation (TMS2021STG03) and Norwegian Research Council (314473) awarded to S.S. Open access funding was provided by the University of Bergen. “The funding body played no role in the design of the study and collection, analysis, and interpretation of data and in writing the manuscript”.
Institutional Review Board Statement
The study was conducted in accordance with the Declaration of Helsinki. Written informed consent was obtained from all donors, and the collection and use of human dental tissues/cells for research were approved by the Regional Committee for Medical and Health Research Ethics (REK), Norway (project no. 2009/610/REK vest).
Informed Consent Statement
Informed consent was obtained from all subjects involved in the study.
Data Availability Statement
The proteomic datasets generated and analyzed during this study are provided in the Supplementary Materials. Additional data supporting the findings of this study are available from the corresponding author upon reasonable request.
Acknowledgments
"Mass spectrometry-based proteomic analyses were performed by the Proteomics Unit at the University of Bergen (PROBE). This facility is a member of the National Network of Advanced Proteomics Infrastructure (NAPI), which is funded by the Research Council of Norway (INFRASTRUKTUR-program project number: 295910)." During the preparation of this manuscript, the authors used AI to assist with language refinement and organization of scientific text. The authors reviewed and edited all outputs and took full responsibility for the content of this publication.
Conflicts of Interest
The authors declare that they have no competing interests.
Abbreviations
The following abbreviations are used in this manuscript:
| Abbreviation | Definition |
| ALP | Alkaline phosphatase |
| ARS | Alizarin Red S |
| CAM | Chorioallantoic membrane |
| CM | Conditioned medium |
| DAPs | Differentially abundant proteins |
| DPSC-CM | Dental pulp stem cell-conditioned medium |
| DPSCs | Dental pulp stem cells |
| ECM | Extracellular matrix |
| EVs | Extracellular vesicles |
| FDR | False discovery rate |
| GOBP | Gene Ontology Biological Process |
| LC-MS/MS | Liquid chromatography-tandem mass spectrometry |
| log₂FC | Log₂ fold change |
| MSCs | Mesenchymal stromal cells |
| OM | Osteogenic medium |
| PCA | Principal component analysis |
| PI3K/Akt | Phosphoinositide 3-kinase/Akt |
| SHED | Stem cells from human exfoliated deciduous teeth |
Appendix A. Additional Methodological Details
The following sections provide additional methodological details for selected experimental procedures described in the Materials and Methods.
Appendix A.1. DPSC Viability and Apoptosis during Serum-Free Conditioning
At baseline and following 24, 48, or 72 h of serum-free conditioning, DPSCs were washed with cold PBS, detached using trypsin, and resuspended in binding buffer. Cells were then stained with FITC-Annexin V and propidium iodide (PI) for 15 min at room temperature in the dark. Following incubation, binding buffer was added, and samples were immediately analyzed using a BD Accuri™ C6 flow cytometer (BD Biosciences, Franklin Lakes, NJ, USA).
Appendix A.2. CAM Assay and Vessel Quantification
Fertilized chicken eggs (Gallus gallus domesticus) were incubated at 37 °C under 60–70% relative humidity. On embryonic day (ED) 3, embryos were transferred under sterile conditions to an ex ovo culture system. Sterile silicone rings were placed on the CAM surface on ED7, and the designated treatments were applied within the rings. After 48 h of incubation, CAM regions exposed to treatment were harvested on ED9, fixed overnight in 4% paraformaldehyde, and imaged using a Leica M205 C stereomicroscope equipped with an MC170 HD digital camera (Leica Microsystems, Wetzlar, Germany). Images were analyzed using the deep learning-based IKOSA CAM Assay Application (KML Vision GmbH, Graz, Austria) to quantify total vessel area, total vessel length, mean vessel thickness, and the number of branching points.
Appendix A.3. SHED Metabolic Activity
At each evaluation time point, the culture medium was replaced with PrestoBlue™ working solution (10% v/v in culture medium), and cells were incubated for 60 min at 37 °C. Fluorescence was measured using a Varioskan™ LUX Multimode Microplate Reader (Thermo Fisher Scientific, Vantaa, Finland) with excitation and emission wavelengths of 560 and 590 nm, respectively.
Appendix A.4. In Vitro Osteogenic Effects of DPSC-CM
To assess ALP expression as an early marker of osteogenic differentiation, cells were fixed with 4% paraformaldehyde on day 7 and stained using the BCIP/NBT Liquid Substrate System (Sigma-Aldrich, USA) according to the manufacturer's instructions. Cultures were imaged, and the deposited staining product was subsequently extracted with 100 mM cetylpyridinium chloride (CPC) for 48 h under continuous agitation. Quantification was performed by measuring absorbance at 540 nm. Matrix mineralization was evaluated on day 14 using Alizarin Red S (ARS) staining. Following fixation with 4% paraformaldehyde, cultures were stained and imaged. Bound ARS dye was extracted with 100 mM CPC for 2 h, and mineral deposition was quantified by absorbance measurement at 540 nm using a microplate reader.
Appendix A.5. PI3K/Akt Signaling and Western Blot Analysis
Cells were lysed in RIPA buffer supplemented with protease and phosphatase inhibitors for 15 min. Equal amounts of protein (10 μg) were mixed with 4× LDS sample buffer containing dithiothreitol, denatured at 95 °C for 5 min, and separated on 4–12% polyacrylamide gels. Proteins were then transferred to PVDF membranes using the Trans-Blot Turbo Transfer System (Bio-Rad, USA). Membranes were blocked in 3% bovine serum albumin prepared in TBST for 1 h and incubated overnight at 4 °C with primary antibodies against phosphorylated Akt (p-Akt) and total Akt (1:250; Santa Cruz Biotechnology, USA). After washing, membranes were incubated with HRP-conjugated secondary antibodies (1:7500; Bio-Rad, USA). Protein bands were detected using Clarity™ or Clarity Max™ enhanced chemiluminescence substrates and visualized with a ChemiDoc Imaging System (Bio-Rad, USA). All donor samples were analyzed independently.
References
- Vizoso, F.J.; Eiro, N.; Cid, S.; Schneider, J.; Perez-Fernandez, R. Mesenchymal stem cell secretome: Toward cell-free therapeutic strategies in regenerative medicine. Int. J. Mol. Sci. 2017, 18, 1852. [Google Scholar] [CrossRef] [PubMed]
- Ferreira, J.R.; Teixeira, G.Q.; Santos, S.G.; Barbosa, M.A.; Almeida-Porada, G.; Gonçalves, R.M. Mesenchymal stromal cell secretome: Influencing therapeutic potential by cellular pre-conditioning. Front. Immunol. 2018, 9, 2837. [Google Scholar] [CrossRef] [PubMed]
- De Jong, O.G.; Van Balkom, B.W.M.; Schiffelers, R.M.; Bouten, C.V.C.; Verhaar, M.C. Extracellular vesicles: Potential roles in regenerative medicine. Front. Immunol. 2014, 5, 608. [Google Scholar] [CrossRef] [PubMed]
- Matsumura-Kawashima, M.; Ogata, K.; Moriyama, M.; Murakami, Y.; Kawado, T.; Nakamura, S. Secreted factors from dental pulp stem cells improve Sjögren’s syndrome via regulatory T cell-mediated immunosuppression. Stem Cell Res. Ther. 2021, 12, 182. [Google Scholar] [CrossRef] [PubMed]
- Barone, L.; Cucchiara, M.; Palano, M.T.; Bassani, B.; Gallazzi, M.; Rossi, F.; Raspanti, M.; Zecca, P.A.; De Antoni, G.; Pagiatakis, C.; Papait, R.; Bernardini, G.; Bruno, A.; Gornati, R. Dental pulp mesenchymal stem cell (DPSCs)-derived soluble factors, produced under hypoxic conditions, support angiogenesis via endothelial cell activation and generation of M2-like macrophages. J. Biomed. Sci. 2024, 31, 99. [Google Scholar] [CrossRef] [PubMed]
- Fujii, Y.; Hatori, A.; Chikazu, D.; Ogasawara, T. Application of dental pulp stem cells for bone and neural tissue regeneration in oral and maxillofacial region. Stem Cells Int. 2023, 2023, 2026572. [Google Scholar] [CrossRef] [PubMed]
- Chouaib, B.; Desoutter, A.; Cuisinier, F.; Collart-Dutilleul, P.-Y. Dental pulp stem cell conditioned medium enhance osteoblastic differentiation and bone regeneration. Stem Cell Rev. Rep. 2025, 21, 477–490. [Google Scholar] [CrossRef] [PubMed]
- Yamada, S.; Al-Sharabi, N.; Torelli, F.; Volponi, A.A.; Sandven, L.; Ueda, M.; Fristad, I.; Mustafa, K. Harnessing the antioxidative potential of dental pulp stem cell-conditioned medium in photopolymerized GelMA hydrogels. Biomater. Res. 2024, 28, 0084. [Google Scholar] [CrossRef] [PubMed]
- Gharaei, M.A.; Xue, Y.; Mustafa, K.; Lie, S.A.; Fristad, I. Human dental pulp stromal cell conditioned medium alters endothelial cell behavior. Stem Cell Res. Ther. 2018, 9, 69. [Google Scholar] [CrossRef] [PubMed]
- Kamal, D.; Rady, D.; El Moshy, S.; Radwan, I.A.; Ahmed, N.E.-M.B.; Wadan, A.-H.S.; Mehanny, S.S.; Salah Eldin, L. Cell-free bone regeneration using dental MSCs secretomes from pulp and gingiva in rabbit tibial defects. Sci. Rep. 2025, 15, 31722. [Google Scholar] [CrossRef] [PubMed]
- Haraszti, R.A.; Miller, R.; Dubuke, M.L.; Rockwell, H.E.; Coles, A.H.; Sapp, E.; Didiot, M.-C.; Echeverria, D.; Stoppato, M.; Sere, Y.Y.; et al. Serum deprivation of mesenchymal stem cells improves exosome activity and alters lipid and protein composition. iScience 2019, 16, 230–241. [Google Scholar] [CrossRef] [PubMed]
- Bousnaki, M.; Bakopoulou, A.; Pich, A.; Papachristou, E.; Kritis, A.; Koidis, P. Mapping the secretome of dental pulp stem cells under variable microenvironmental conditions. Stem Cell Rev. Rep. 2022, 18, 1372–1407. [Google Scholar] [CrossRef] [PubMed]
- Chouaib, B.; Haack-Sørensen, M.; Chaubron, F.; Cuisinier, F.; Collart-Dutilleul, P.-Y. Towards the standardization of mesenchymal stem cell secretome-derived product manufacturing for tissue regeneration. Int. J. Mol. Sci. 2023, 24, 12594. [Google Scholar] [CrossRef] [PubMed]
- Acuto, S.; Lo Iacono, M.; Baiamonte, E.; Lo Re, R.; Maggio, A.; Cavalieri, V. An optimized procedure for preparation of conditioned medium from Wharton’s jelly mesenchymal stromal cells isolated from umbilical cord. Front. Mol. Biosci. 2023, 10, 1273814. [Google Scholar] [CrossRef] [PubMed]
- Rossello-Gelabert, M.; Igartua, M.; Santos-Vizcaino, E.; Hernandez, R.M. Fine-tuning licensing strategies to boost MSC-based immunomodulatory secretome. Stem Cell Res. Ther. 2025, 16, 183. [Google Scholar] [CrossRef] [PubMed]
- Paschalidis, T.; Bakopoulou, A.; Papa, P.; Leyhausen, G.; Geurtsen, W.; Koidis, P. Dental pulp stem cells’ secretome enhances pulp repair processes and compensates TEGDMA-induced cytotoxicity. Dent. Mater. 2014, 30, e405–e418. [Google Scholar] [CrossRef] [PubMed]
- Kadkhodazadeh, M.; Amid, R.; Kheiri, A.; Shamszadeh, S.; Shams, F. Osteogenic differentiation induced by dental pulp stem cells secretome: A dose-dependent comparative study. Clin. Exp. Dent. Res. 2026, 12, e70395. [Google Scholar] [CrossRef] [PubMed]
- Hosmani, J.; Assiri, K.; Almubarak, H.M.; Mannakandath, M.L.; Al-Hakami, A.; Patil, S.; Babji, D.; Sarode, S.; Devaraj, A.; Chandramoorthy, H.C. Proteomic profiling of various human dental stem cells—A systematic review. World J. Stem Cells 2020, 12, 1214–1236. [Google Scholar] [CrossRef] [PubMed]
- Al-Sharabi, N.; Xue, Y.; Fujio, M.; Ueda, M.; Gjerde, C.; Mustafa, K.; Fristad, I. Bone marrow stromal cell paracrine factors direct osteo/odontogenic differentiation of dental pulp cells. Tissue Eng. Part A 2014, 20, 3063–3072. [Google Scholar] [CrossRef] [PubMed]
- Saleem, R.; Mohamed-Ahmed, S.; Elnour, R.; Berggreen, E.; Mustafa, K.; Al-Sharabi, N. Conditioned medium from bone marrow mesenchymal stem cells restored oxidative stress-related impaired osteogenic differentiation. Int. J. Mol. Sci. 2021, 22, 13458. [Google Scholar] [CrossRef] [PubMed]
- Aasebø, E.; Birkeland, E.; Selheim, F.; Berven, F.; Brenner, A.K.; Bruserud, Ø. The extracellular bone marrow microenvironment—A proteomic comparison of constitutive protein release by in vitro cultured osteoblasts and mesenchymal stem cells. Cancers 2021, 13, 62. [Google Scholar] [CrossRef] [PubMed]
- Kråkenes, T.; Wergeland, S.; Al-Sharabi, N.; Mohamed-Ahmed, S.; Fromreide, S.; Costea, D.-E.; Mustafa, K.; Bø, L.; Kvistad, C.E. The neuroprotective potential of mesenchymal stem cells from bone marrow and human exfoliated deciduous teeth in a murine model of demyelination. PLoS ONE 2023, 18, e0293908. [Google Scholar] [CrossRef] [PubMed]
- Tez, B.Ç.; Durukan, S.M.; Yıldır, S.K.; Çokkeçeci, M.; Boyvat, D.; Altınsoy, N.; Fındık, F.; Güner, Ş.A.; Acar, M.B.; Galderisi, U.; Özcan, S. Comparative proteomic analysis of dental-origin stem cells: Insights into regenerative potential. Stem Cell Rev. Rep. 2025, 21, 2287–2297. [Google Scholar] [CrossRef] [PubMed]
- Chouaib, B.; Collart-Dutilleul, P.-Y.; Blanc-Sylvestre, N.; Younes, R.; Gergely, C.; Raoul, C.; Scamps, F.; Cuisinier, F.; Romieu, O. Identification of secreted factors in dental pulp cell-conditioned medium optimized for neuronal growth. Neurochem. Int. 2021, 144, 104961. [Google Scholar] [CrossRef] [PubMed]
- Bronckaers, A.; Hilkens, P.; Fanton, Y.; Struys, T.; Gervois, P.; Politis, C.; Martens, W.; Lambrichts, I. Angiogenic properties of human dental pulp stem cells. PLoS ONE 2013, 8, e71104. [Google Scholar] [CrossRef] [PubMed]
- Zhou, T.; Rong, M.; Wang, Z.; Chu, H.; Chen, C.; Zhang, J.; Tian, Z. Conditioned medium derived from 3D tooth germs: A novel cocktail for stem cell priming and early in vivo pulp regeneration. Cell Prolif. 2021, 54, e13129. [Google Scholar] [CrossRef] [PubMed]
- Zhang, F.; Zhang, S.; Hu, Y.; Wang, N.; Wu, L.; Ding, M. Role of PI3K/AKT signaling pathway in proliferation, migration and odontogenic differentiation of human dental pulp stem cells. J. Hard Tissue Biol. 2020, 29, 99–104. [Google Scholar] [CrossRef]
Figure 1.
DPSC viability during serum-free conditioning and proteomic characterization of DPSC-CM. (A) (i) Representative Annexin V-FITC/PI flow cytometry plots and (ii) quantification of viable, early apoptotic, late apoptotic, and necrotic DPSCs at baseline and after 24, 48, and 72 h of serum-free conditioning (n = 5 biological donors). (B) (i) Venn diagram showing shared and unique proteins detected in CM 24 h, CM 48 h, and CM 72 h, and (ii) hierarchical clustering heatmap of normalized protein abundances across the three conditioning durations (n = 3 biological donors); colors represent row-wise Z-scores, with red and blue indicating relatively higher and lower abundance, respectively. (C) (i) Principal component analysis of normalized protein abundances and (ii) volcano plots showing differential protein abundance for CM 48 h vs. CM 24 h, CM 72 h vs. CM 24 h, and CM 72 h vs. CM 48 h. Blue and red indicate significantly higher abundance in the first- and second-named groups, respectively, and gray indicates proteins not meeting the predefined criteria. Dashed lines indicate FDR = 0.05 and |log₂FC| = 0.50. (D) Hierarchical clustering heatmaps of DAPs identified in CM 48 h vs. CM 24 h and CM 72 h vs. CM 24 h; colors represent row-wise Z-scores, and black arrows indicate clusters with relatively higher abundance in CM 24 h. (E) GOBP over-representation analysis of DAPs from (i) CM 48 h vs. CM 24 h and (ii) CM 72 h vs. CM 24 h. Dot position represents gene ratio, dot size represents the number of DAPs associated with each term, and dot color represents the Benjamini–Hochberg-adjusted p-value. Only significantly enriched terms (adjusted p < 0.05) are shown. DAPs were defined as FDR ≤ 0.05 and |log₂FC| ≥ 0.50.
Figure 1.
DPSC viability during serum-free conditioning and proteomic characterization of DPSC-CM. (A) (i) Representative Annexin V-FITC/PI flow cytometry plots and (ii) quantification of viable, early apoptotic, late apoptotic, and necrotic DPSCs at baseline and after 24, 48, and 72 h of serum-free conditioning (n = 5 biological donors). (B) (i) Venn diagram showing shared and unique proteins detected in CM 24 h, CM 48 h, and CM 72 h, and (ii) hierarchical clustering heatmap of normalized protein abundances across the three conditioning durations (n = 3 biological donors); colors represent row-wise Z-scores, with red and blue indicating relatively higher and lower abundance, respectively. (C) (i) Principal component analysis of normalized protein abundances and (ii) volcano plots showing differential protein abundance for CM 48 h vs. CM 24 h, CM 72 h vs. CM 24 h, and CM 72 h vs. CM 48 h. Blue and red indicate significantly higher abundance in the first- and second-named groups, respectively, and gray indicates proteins not meeting the predefined criteria. Dashed lines indicate FDR = 0.05 and |log₂FC| = 0.50. (D) Hierarchical clustering heatmaps of DAPs identified in CM 48 h vs. CM 24 h and CM 72 h vs. CM 24 h; colors represent row-wise Z-scores, and black arrows indicate clusters with relatively higher abundance in CM 24 h. (E) GOBP over-representation analysis of DAPs from (i) CM 48 h vs. CM 24 h and (ii) CM 72 h vs. CM 24 h. Dot position represents gene ratio, dot size represents the number of DAPs associated with each term, and dot color represents the Benjamini–Hochberg-adjusted p-value. Only significantly enriched terms (adjusted p < 0.05) are shown. DAPs were defined as FDR ≤ 0.05 and |log₂FC| ≥ 0.50.
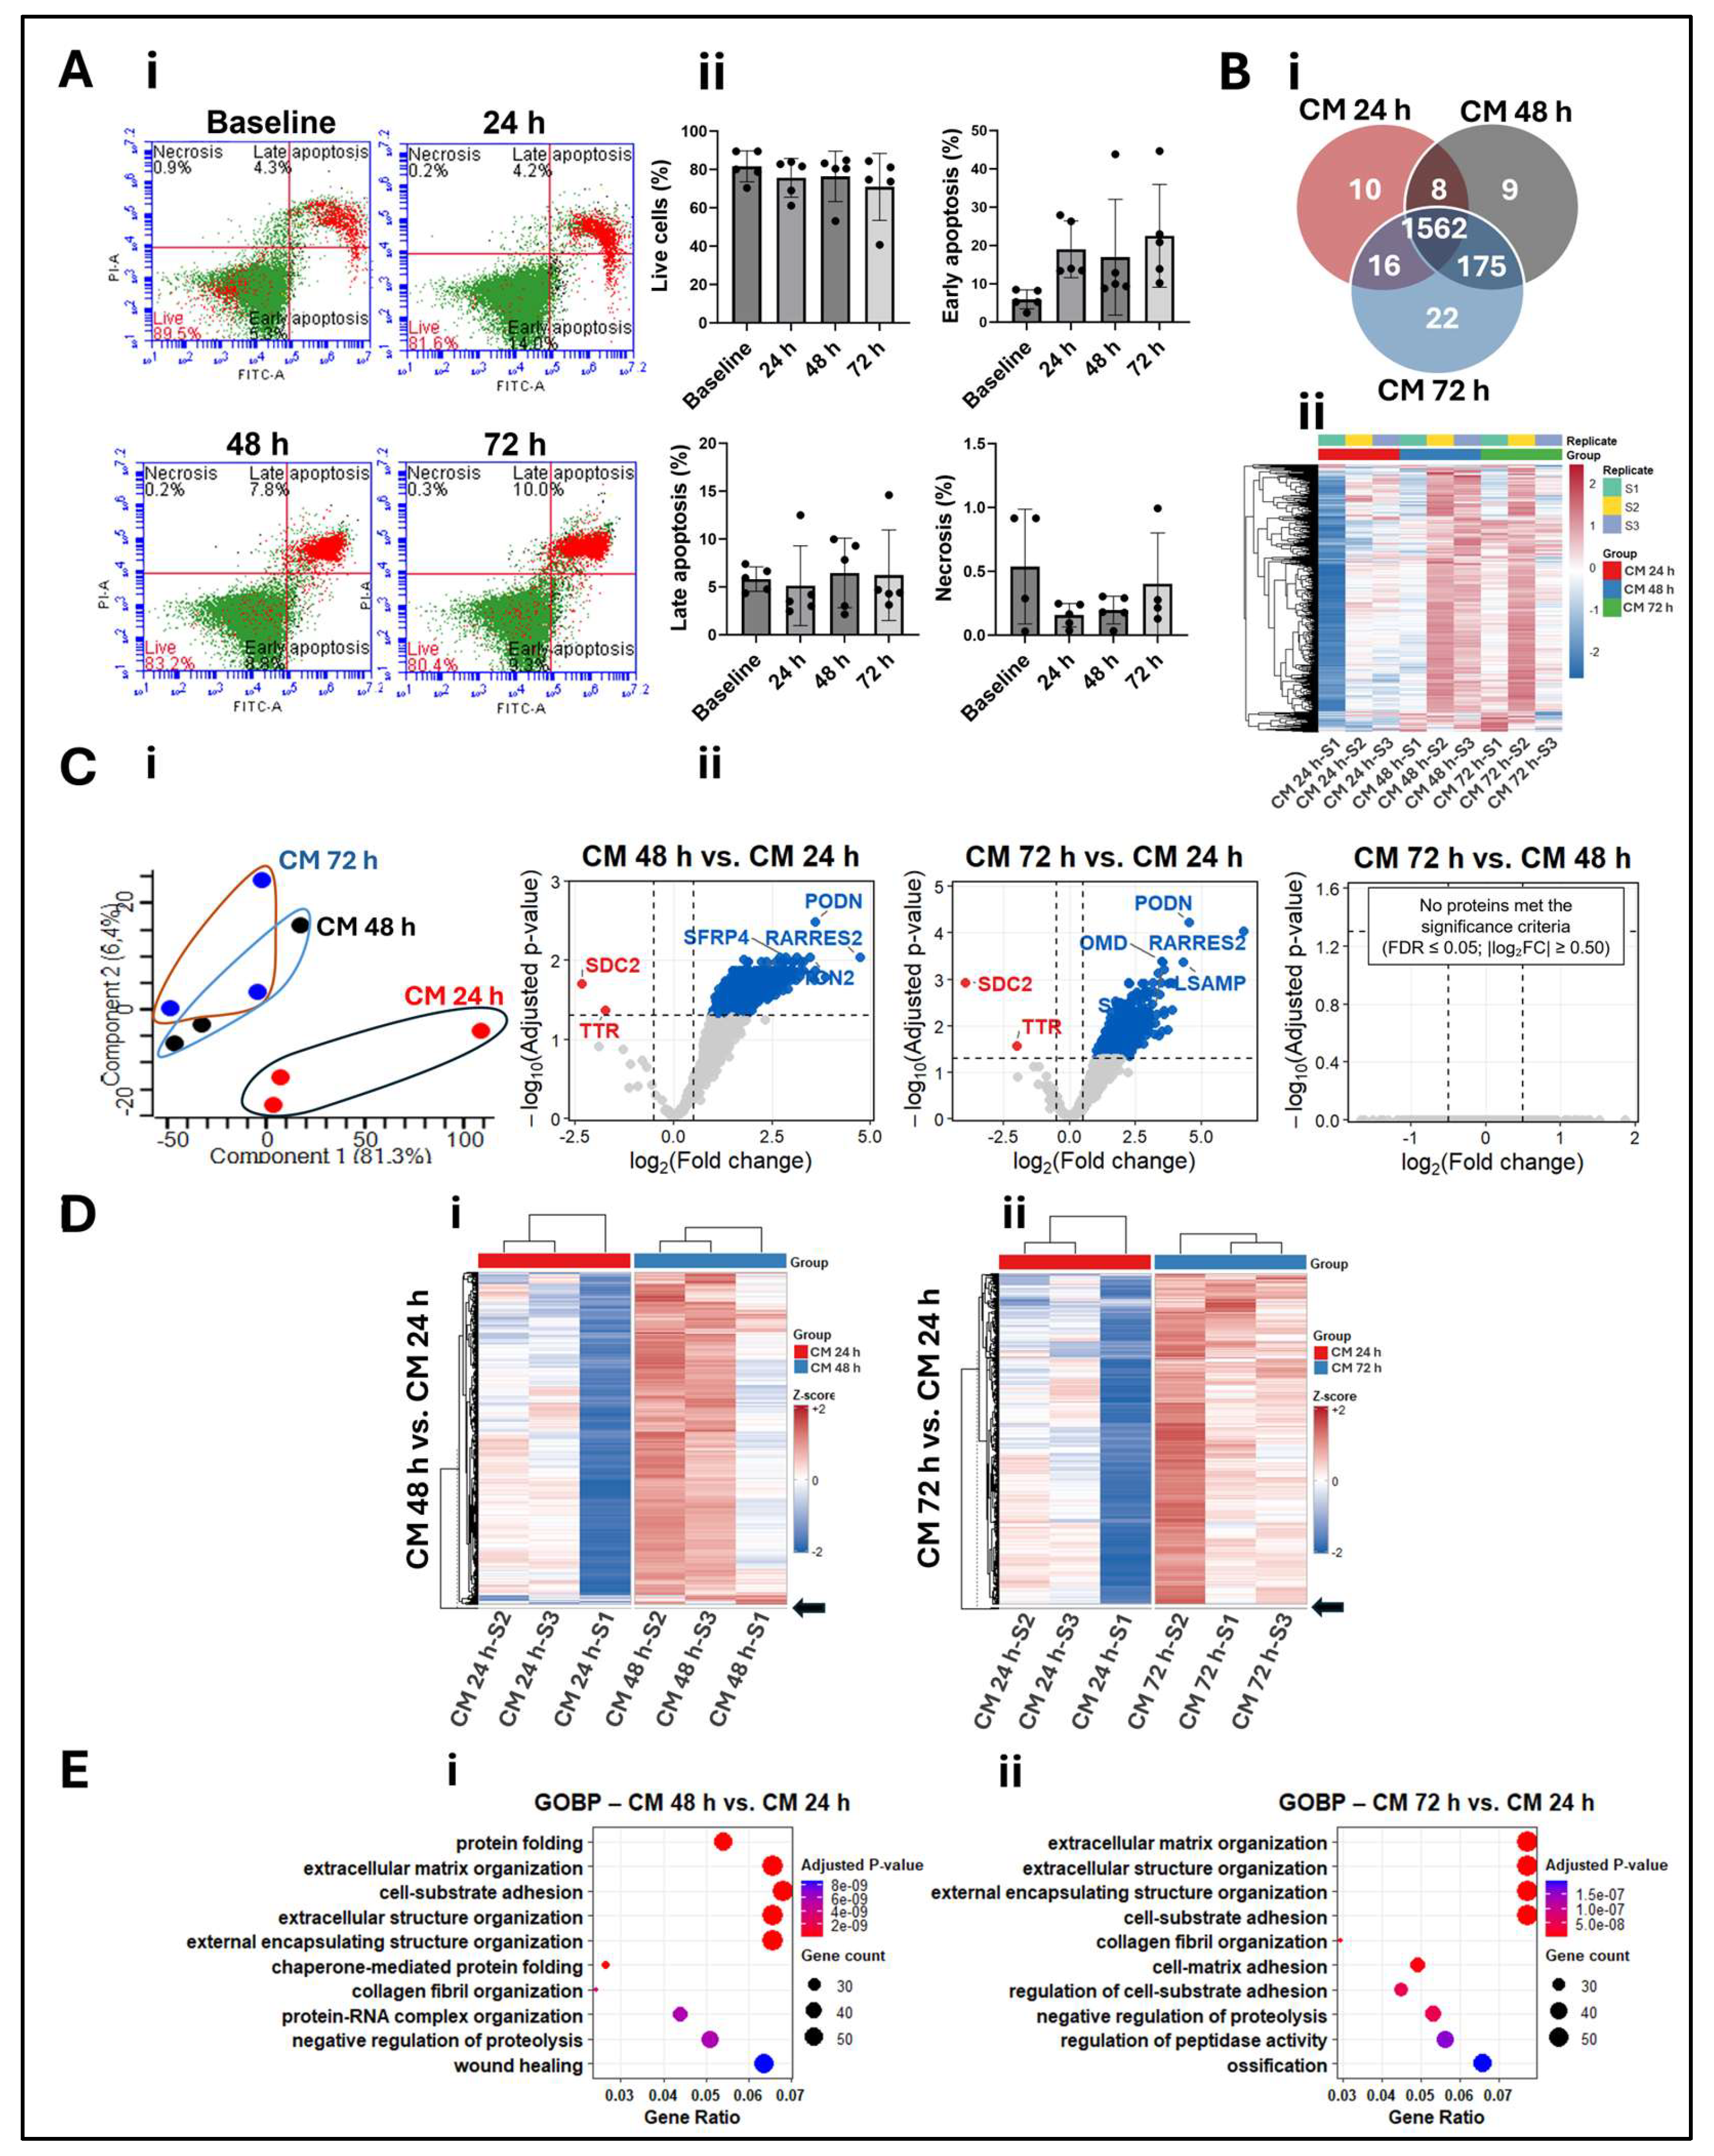
Figure 2.
Vascular- and angiogenesis-related functional analysis and angiogenic activity of DPSC-CM. (A) GOBP enrichment analysis showing significantly enriched vascular- and angiogenesis-related biological processes in (i) CM 48 h vs. CM 24 h and (ii) CM 72 h vs. CM 24 h. Dot position represents gene ratio, dot size represents the number of DAPs associated with each term, and dot color represents the Benjamini–Hochberg-adjusted p-value. Only significantly enriched terms (adjusted p < 0.05) are shown. (B) Representative images of the chick chorioallantoic membrane (CAM) assay following treatment with control-DMEM (Control group), DPSC-CM collected after 48 h (CM 48 h), or DPSC-CM collected after 72 h (CM 72 h). Original CAM images (left) and corresponding software-generated vessel segmentation images used for quantitative vascular analysis (right) are shown. (C) Quantitative analysis of (i) total vessel area, (ii) total vessel length, (iii) mean vessel thickness, and (iv) number of branching points. Data are presented as mean ± SD (n = 5–6). Each data point represents an independent embryo. *p < 0.05 (Tukey’s multiple comparisons test).
Figure 2.
Vascular- and angiogenesis-related functional analysis and angiogenic activity of DPSC-CM. (A) GOBP enrichment analysis showing significantly enriched vascular- and angiogenesis-related biological processes in (i) CM 48 h vs. CM 24 h and (ii) CM 72 h vs. CM 24 h. Dot position represents gene ratio, dot size represents the number of DAPs associated with each term, and dot color represents the Benjamini–Hochberg-adjusted p-value. Only significantly enriched terms (adjusted p < 0.05) are shown. (B) Representative images of the chick chorioallantoic membrane (CAM) assay following treatment with control-DMEM (Control group), DPSC-CM collected after 48 h (CM 48 h), or DPSC-CM collected after 72 h (CM 72 h). Original CAM images (left) and corresponding software-generated vessel segmentation images used for quantitative vascular analysis (right) are shown. (C) Quantitative analysis of (i) total vessel area, (ii) total vessel length, (iii) mean vessel thickness, and (iv) number of branching points. Data are presented as mean ± SD (n = 5–6). Each data point represents an independent embryo. *p < 0.05 (Tukey’s multiple comparisons test).
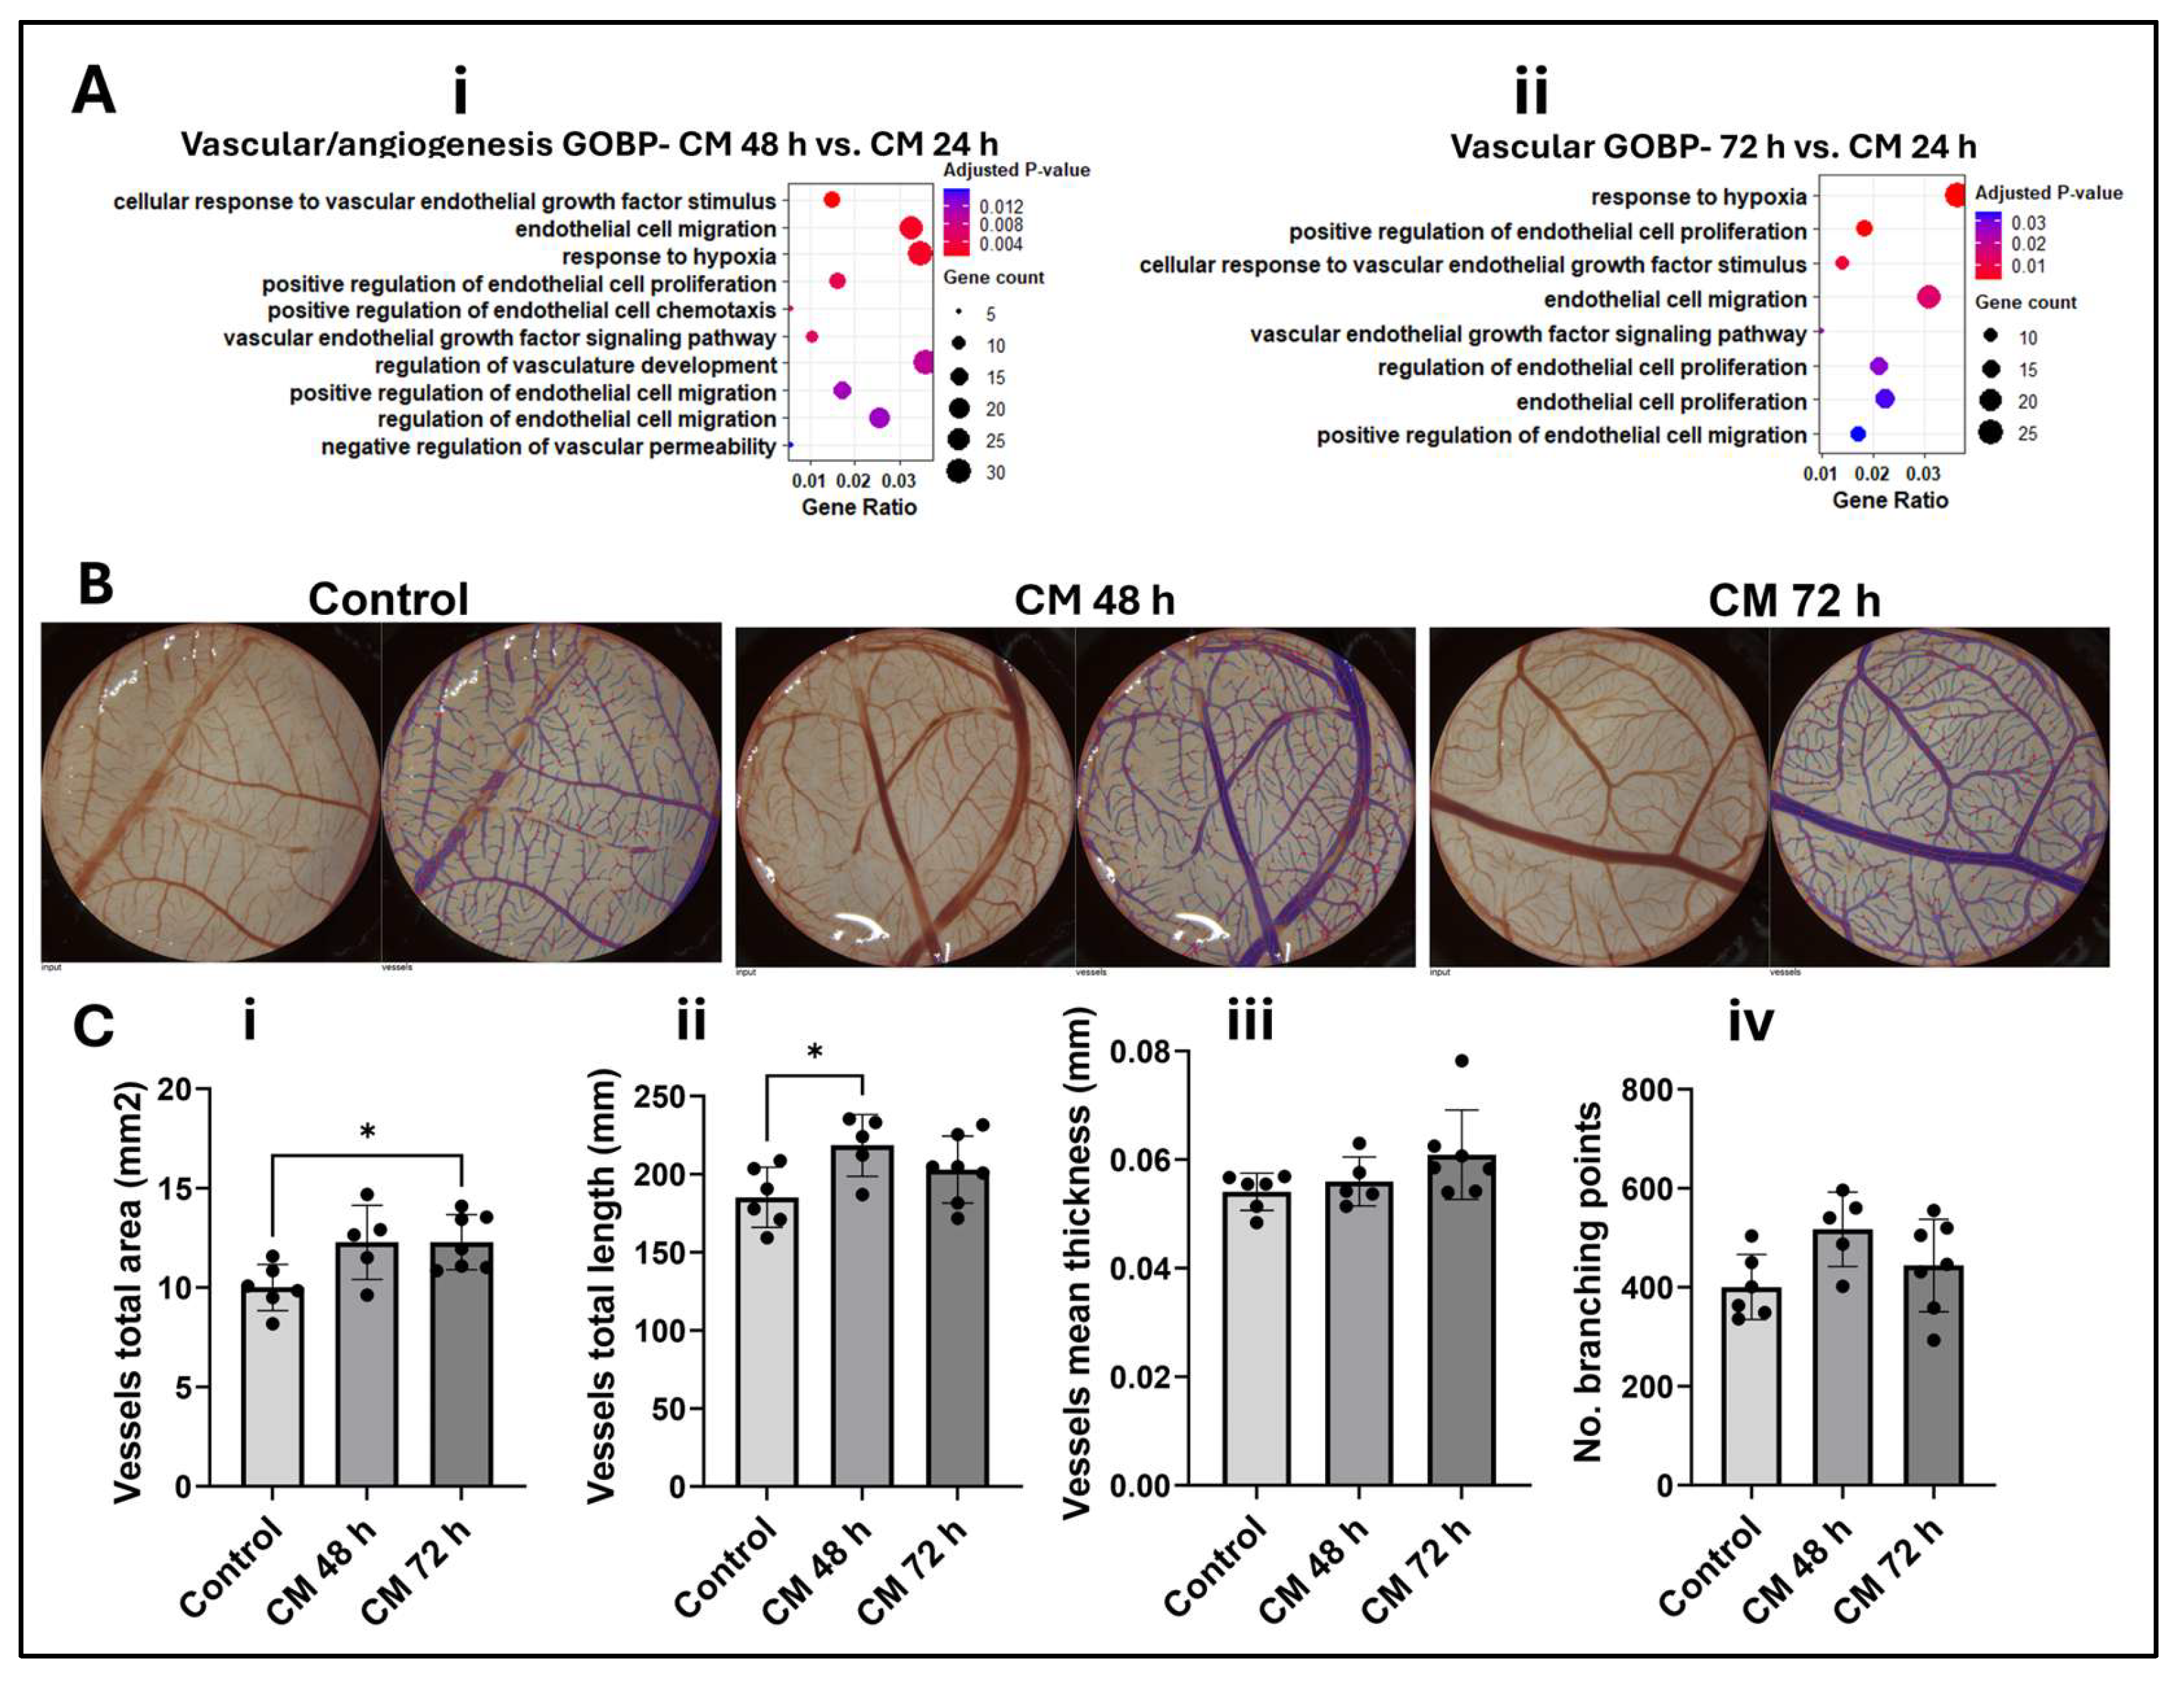
Figure 3.
Functional characterization of DPSC-CM collected after different serum-free conditioning durations. (A) SHED metabolic activity following treatment with CM 24 h, CM 48 h, or CM 72 h under normal culture conditions on days 1, 3, and 7. (B) Osteogenic differentiation of SHED. (i) Representative alkaline phosphatase (ALP; top) staining at day 7 and Alizarin Red S (ARS; bottom) staining at day 14 following osteogenic induction in the presence of CM 24 h, CM 48 h, or CM 72 h. Control and osteogenic media served as negative and positive controls, respectively. Scale bars = 100 µm. (ii) Quantification of ALP staining and (iii) quantification of ARS staining (n = 3 biological donors). (C) PI3K/Akt signaling in SHED cultured in osteogenic medium, osteogenic medium supplemented with CM 48 h (15 µg/mL), osteogenic medium supplemented with LY294002 (20 µM), or osteogenic medium supplemented with CM 48 h (15 µg/mL) and LY294002 (20 µM). (i) Representative immunoblots of p-Akt, total Akt, and β-actin. Donor-specific immunoblots are shown in Supplementary Figure S2. (ii) Quantification of p-Akt normalized to β-actin. (iii) Quantification of the p-Akt/Akt ratio. Each data point represents an individual donor. Data are presented as mean ± SD. *p < 0.05; **p < 0.01 (Tukey’s multiple comparisons test).
Figure 3.
Functional characterization of DPSC-CM collected after different serum-free conditioning durations. (A) SHED metabolic activity following treatment with CM 24 h, CM 48 h, or CM 72 h under normal culture conditions on days 1, 3, and 7. (B) Osteogenic differentiation of SHED. (i) Representative alkaline phosphatase (ALP; top) staining at day 7 and Alizarin Red S (ARS; bottom) staining at day 14 following osteogenic induction in the presence of CM 24 h, CM 48 h, or CM 72 h. Control and osteogenic media served as negative and positive controls, respectively. Scale bars = 100 µm. (ii) Quantification of ALP staining and (iii) quantification of ARS staining (n = 3 biological donors). (C) PI3K/Akt signaling in SHED cultured in osteogenic medium, osteogenic medium supplemented with CM 48 h (15 µg/mL), osteogenic medium supplemented with LY294002 (20 µM), or osteogenic medium supplemented with CM 48 h (15 µg/mL) and LY294002 (20 µM). (i) Representative immunoblots of p-Akt, total Akt, and β-actin. Donor-specific immunoblots are shown in Supplementary Figure S2. (ii) Quantification of p-Akt normalized to β-actin. (iii) Quantification of the p-Akt/Akt ratio. Each data point represents an individual donor. Data are presented as mean ± SD. *p < 0.05; **p < 0.01 (Tukey’s multiple comparisons test).
Disclaimer/Publisher’s Note: The statements, opinions and data contained in all publications are solely those of the individual author(s) and contributor(s) and not of MDPI and/or the editor(s). MDPI and/or the editor(s) disclaim responsibility for any injury to people or property resulting from any ideas, methods, instructions or products referred to in the content. |
© 2026 by the authors. Licensee MDPI, Basel, Switzerland. This article is an open access article distributed under the terms and conditions of the Creative Commons Attribution (CC BY) license (http://creativecommons.org/licenses/by/4.0/).
Copyright: This open access article is published under a Creative Commons CC BY 4.0 license, which permit the free download, distribution, and reuse, provided that the author and preprint are cited in any reuse.