

Submitted:
01 September 2026
Posted:
02 September 2026
You are already at the latest version
Abstract
Background/Objectives: Cancer remains one of the leading causes of mortality worldwide and represents a major public health challenge in Serbia. Continuous monitoring of mortality trends is essential for evaluating progress in cancer control and identifying population groups requiring targeted interventions. This study aimed to analyze temporal trends in mortality from all malignant neoplasms in the Republic of Serbia during the period 2000–2021 using Joinpoint regression analysis. Methods: A population-based descriptive epidemiological study was conducted using mortality data for all malignant neoplasms (ICD-10: C00–C97) obtained from the Institute of Public Health of Serbia “Dr Milan Jovanović Batut”. Mortality trends were analyzed according to sex and age groups. Crude mortality rates, age-specific mortality rates, and age-standardized mortality rates (ASR) based on the Segi world standard population were calculated. Temporal changes were assessed using Joinpoint regression analysis, including annual percentage change (APC) and average annual percentage change (AAPC). Results: Between 2000 and 2021, a total of 448,391 deaths from malignant neoplasms were recorded in Serbia, including 254,988 deaths among men (56.9%) and 193,403 among women (43.1%). The mean age-standardized mortality rate was 135.2 per 100,000 population, with substantially higher rates among men than women (196.9 vs. 105.3 per 100,000). The highest number of deaths occurred among individuals aged 70–74 years, whereas the highest age-specific mortality rates were observed among those aged 80–84 years. Joinpoint regression demonstrated an overall significant decline in age-standardized mortality (AAPC −0.31%; p<0.001). Among men, mortality increased from 2000 to 2008 (APC +1.17%) followed by a significant decline until 2021 (AAPC −0.48%; p<0.001). Among women, mortality increased between 2000 and 2008 and subsequently declined; however, the overall trend remained stable (AAPC +0.03%; p=0.698). Conclusions: Although age-standardized cancer mortality in Serbia showed a gradual decline between 2000 and 2021, malignant neoplasms remain a substantial public health burden, particularly among older adults and men. Persistent sex differences and slower improvement among women indicate the need for targeted prevention strategies, strengthened screening programs, earlier diagnosis, and equitable access to cancer care.
Keywords:
cancer mortality
; mortality trends
; Joinpoint regression
; age-standardized mortality rate
; Serbia
1. Introduction
Cancer represents one of the most important global public health challenges and remains among the leading causes of morbidity, premature mortality, and years of life lost worldwide [1,2]. Despite substantial advances in prevention, early detection, and treatment, malignant tumors continue to impose a significant burden on healthcare systems due to population ageing, demographic changes, and persistent exposure to established risk factors [3,4].
According to the International Agency for Research on Cancer (IARC) and the World Health Organization (WHO), approximately 20 million new cancer cases and 9.7 million cancer-related deaths were estimated worldwide in 2022 [5]. The global cancer burden is expected to increase further in the coming decades, primarily due to population growth, ageing, and the continuing impact of behavioral and environmental risk factors [5,6]. Lung, colorectal, liver, stomach, and breast cancers remain among the leading causes of cancer mortality globally, although mortality patterns differ considerably according to cancer site, geographic region, socioeconomic development, and healthcare accessibility [5].
Cancer mortality trends demonstrate substantial temporal and regional variability. High-income countries generally show declining age-standardized mortality rates for several major cancer sites, reflecting improvements in tobacco control, screening programs, diagnostic strategies, and therapeutic approaches [7]. In contrast, many middle- and low-income countries continue to experience increasing cancer mortality due to delayed diagnosis, limited access to treatment, and insufficient implementation of preventive interventions [8]. Therefore, continuous monitoring of cancer mortality trends is essential for evaluating the effectiveness of public health strategies and identifying areas requiring additional intervention.
In the Republic of Serbia, malignant tumors represent one of the leading causes of death and a major public health concern. Serbia is characterized by relatively high cancer mortality rates compared with many European countries, which is associated with a high prevalence of risk factors, particularly tobacco use, insufficient participation in organized screening programs, and a considerable proportion of patients diagnosed at advanced stages of disease [9,10,11,12]. According to national cancer statistics and international estimates, tens of thousands of new cancer cases and more than twenty thousand cancer-related deaths are recorded annually in Serbia, emphasizing the need for continuous epidemiological surveillance and evidence-based cancer control strategies [9,10].
The analysis of temporal trends in cancer mortality provides important information regarding changes in disease burden and enables evaluation of the impact of prevention programs, healthcare improvements, and changes in population risk profiles. Traditional linear trend analyses may fail to detect periods of significant change, particularly when mortality patterns are influenced by multiple epidemiological and healthcare-related factors [13]. Joinpoint regression analysis is a statistical method that identifies significant changes in temporal trends by detecting points at which the direction or magnitude of change significantly differs. This approach allows calculation of the annual percentage change (APC) and average annual percentage change (AAPC), providing a detailed assessment of cancer mortality dynamics over time [14].
Joinpoint regression models have been widely applied in cancer epidemiology to evaluate long-term trends in incidence and mortality, identify periods of improvement or deterioration, and support the development of targeted prevention and control strategies [13,14]. Understanding changes in cancer mortality patterns in Serbia over time is particularly important for assessing progress in cancer control and identifying persistent challenges within the healthcare system.
The present study aimed to investigate temporal trends in mortality from all malignant neoplasms in the Republic of Serbia during the period 2000–2021 using Joinpoint regression analysis. In addition, the study assessed crude, age-specific, and age-standardized mortality rates, examined the distribution of cancer deaths according to sex and age.
2. Materials and Methods
This study was designed as a population-based descriptive epidemiological study.
The study included the entire population of the Republic of Serbia (all age groups), excluding the Autonomous Province of Kosovo and Metohija, during the period 2000–2021. Retrospective data on deaths from all malignant tumor sites were analyzed. All registered cancer-related deaths were coded according to the International Statistical Classification of Diseases and Related Health Problems, 10th Revision (ICD-10), Volume 1 (codes C00–C97) [15].
Data on deaths from malignant tumors according to sex and age during the period 2000–2021 were obtained upon request from the Institute of Public Health of Serbia “Dr Milan Jovanović Batut” [16]. Data on the population size and demographic structure of the Republic of Serbia by sex and age were obtained from the population censuses conducted in 2002, 2011, and 2022, as well as from intercensal population estimates published by the Statistical Office of the Republic of Serbia, based on registered natural population changes and migration patterns [17].
All deaths occurring in the territory of the Republic of Serbia are registered based on death certificates. The underlying cause of death is certified by an authorized physician within a healthcare institution or by a coroner. The registration procedure includes several levels of control and verification: the local registrar reviews and forwards death records to the relevant public health institute, where a trained physician performs additional verification and, if necessary, correction of the submitted documentation.
The independent variables analyzed were sex, age, and calendar year of observation. The dependent variables were mortality rates.
Descriptive statistical methods were used for data presentation, including tabular and graphical representation. Mortality analysis included age-specific mortality rates, age-standardized mortality rates, and the proportional distribution of deaths according to all malignant tumor sites. All mortality rates were standardized using the direct standardization method based on the Segi world standard population (ASR-World) and was expressed per 100,000 populations [18]. Age-specific mortality rates were calculated separately for males and females across five-year age groups.
To evaluate mortality trends, linear trend analysis and Joinpoint regression analysis were applied (Joinpoint Regression Program, Version 5.2.0.0, April 2024; Statistical Research and Applications Branch, National Cancer Institute). The Joinpoint regression model was performed according to the method described by Kim et al. [19]. This approach enables identification of years characterized by statistically significant changes in mortality trends, referred to as “joinpoints”, where the slope of the linear trend changes significantly over time.
Joinpoint regression analysis was used to estimate the annual percentage change (APC) and identify points of significant change in mortality trends. Additionally, the average annual percentage change (AAPC) was calculated for the entire observation period. Calendar year was considered the independent variable, while the dependent variable was the corresponding age-specific or age-standardized mortality rate.
Results with a probability value of less than 5% were considered statistically significant (p<0.05). All additional statistical analyses were performed using the commercial statistical software package SPSS (IBM Corp. Released 2012. IBM SPSS Statistics for Windows, Version 21.0. Armonk, NY: IBM Corp.).
3. Results
During the observed period from 2000 to 2021, a total of 448,391 deaths from all malignant neoplasms (C00–C97) were recorded in the Republic of Serbia, including 254,988 deaths among men (56.9%) and 193,403 deaths among women (43.1%). The average annual number of deaths was 20,381.3 overall, 11,590.4 among men, and 8,791.1 among women. The annual number of deaths increased from 17,873 in 2000 to 19,979 in 2021, representing a relative increase of 10.5% during the study period.
The mean crude mortality rate (CMR) from all malignant neoplasms was 282.2 deaths per 100,000 population during the study period, with substantially higher rates among men (329.2/100,000) compared with women (232.1/100,000). The mean age-standardized mortality rate (ASMR) was 135.2 deaths per 100,000 population, with marked sex differences: 196.9/100,000 among men and 105.3/100,000 among women. Overall, age-standardized mortality rates were approximately 1.9 times higher among men than women (Table 1).
During the study period, the highest number of deaths from malignant neoplasms was observed among individuals aged 70–74 years, with 75,156 deaths (16.8%). This age group also accounted for the largest number of deaths among both men (44,140 deaths; 17.3%) and women (31,016 deaths; 16.0%). The second highest number of deaths was recorded in the 65–69 years age group, with 72,744 deaths (16.2%), including 44,144 deaths among men (17.3%) and 28,600 deaths among women (14.8%). Among women, after the 70–74 years age group, the highest number of deaths was observed in the 75–79 years age group, with 30,075 deaths (15.6%) (Figure 1).
The highest age-specific mortality rate for all malignant neoplasms was observed in the 80–84 years age group (1,254.6 deaths per 100,000 population), followed by individuals aged 85 years and older (1,154.8/100,000) and those aged 75–79 years (1,141.1/100,000). When analyzed separately by sex, the highest age-specific mortality rates were also observed in the 80–84 years age group among both men and women, reaching 1,692.6/100,000 among men and 995.5/100,000 among women. Among men, the second highest mortality rate was recorded in the 75–79 years age group (1,561.5/100,000), whereas among women it was observed in the 85 years and older age group (922.5/100,000) (Table 2).
During the period 2000–2021, linear regression analysis of age-standardized mortality rates for all malignant neoplasms showed a decreasing trend in the overall population (y = −0.2839x + 138.45); however, this change did not reach statistical significance (p = 0.074). When analyzed separately by sex, a declining trend in age-standardized mortality rates was observed among both men and women. Among men, mortality rates decreased according to the linear trend model (y = −0.5469x + 176.16), with a statistically significant reduction over the study period (p = 0.033). Among women, a slight declining trend was observed (y = −0.04x + 107.87), although this change was not statistically significant (p = 0.654).
Among men, a statistically significant decreasing trend in mortality was observed from the 25–29 years age group to the 55–59 years age group. Conversely, a significant increasing trend was identified among older age groups, from 65–69 years to 85 years and older.
Among women, statistically significant annual declines in mortality were observed in the following age groups: 30–34 years (y = −0.324x + 22.432; p = 0.003), 40–44 years (y = −1.1772x + 83.532; p = 0.001), 45–49 years (y = −1.8826x + 149.02; p = 0.007).
Conversely, statistically significant increases in mortality among women were observed in: 65–69 years (y = 5.3947x + 478.67; p = 0.021), 70–74 years (y = 5.1163x + 622.37; p = 0.020), 85 years and older (y = 9.358x + 814.92; p = 0.014).
At the population level, a statistically significant annual increase in mortality was observed among individuals aged 65–69 years and older, reaching the highest age categories (85+ years). In contrast, statistically significant declines were observed in younger age groups, from 20–24 years to 50–54 years (Table 3).
Joinpoint regression analysis identified two significant points in mortality trends during the study period. At the population level, age-standardized mortality rates from malignant neoplasms increased significantly from 2000 to 2008, with an annual percentage change (APC) of 1.01% (95% CI: 0.76–1.33; p < 0.001). After 2008, mortality rates showed a significant decline during 2008–2019, with an APC of −0.67% (95% CI: −0.82 to −0.49; p = 0.008). A further significant decline was observed between 2019 and 2021, with an APC of −3.45% (95% CI: −4.41 to −2.06; p < 0.001).
Among men, Joinpoint regression identified two significant changes in mortality trends. Mortality rates increased significantly between 2000 and 2008, with an APC of 1.17% (95% CI: 0.88–1.52; p < 0.001). From 2008 to 2019, mortality rates declined significantly, with an APC of −0.86% (95% CI: −1.03 to −0.66; p < 0.001). The decline accelerated during 2019–2021, with an APC of −4.88% (95% CI: −6.03 to −3.24; p < 0.001) .
Among women, Joinpoint regression identified one significant inflection point. Mortality rates increased significantly between 2000 and 2008, with an APC of 0.86% (95% CI: 0.35–1.87; p = 0.001). After 2008, a significant decreasing trend was observed until 2021, with an APC of −0.48% (95% CI: −0.86 to −0.24; p < 0.001).
For the entire study period (2000–2021), Joinpoint regression demonstrated a significant overall decline in age-standardized mortality rates from malignant neoplasms. At the population level, mortality rates decreased with an AAPC of −0.31% per year (95% CI: −0.40 to −0.21; p < 0.001) (Table 4).
Among men, a significant reduction in mortality rates was observed, with an AAPC of −0.48% per year (95% CI: −0.59 to −0.37; p < 0.001). Among women, the overall trend was essentially stable, with an AAPC of +0.03% per year (95% CI: −0.13 to 0.22; p = 0.698), indicating no statistically significant change in mortality rates during the analyzed period (Table 5).
4. Discussion
Between 2000 and 2021, malignant neoplasms represented one of the leading causes of mortality in Serbia, with 448,389 registered deaths. The average annual number of cancer deaths exceeding 20,000 indicates a persistent and substantial public health burden. The observed increase in the absolute number of deaths during the study period is consistent with global trends, primarily reflecting population ageing and the increasing proportion of older individuals at risk for cancer-related mortality [20,21].
Although the number of deaths increased, age-standardized mortality rates demonstrated stabilization and a modest decline in the later years of observation. This discrepancy indicates that the rising absolute burden is largely attributable to demographic ageing rather than a continuous increase in individual cancer mortality risk. Similar patterns have been reported across Europe, where improvements in prevention, early detection, and treatment have contributed to declining age-standardized mortality despite increasing numbers of cancer deaths due to population ageing [20,22].
A substantial sex disparity was observed, with men accounting for 56.9% of all cancer deaths and having almost twice the age-standardized mortality rate compared with women. This pattern corresponds with international evidence showing higher cancer mortality among men, largely attributed to greater exposure to tobacco, alcohol, occupational carcinogens, and differences in preventive healthcare utilization [20,23,24].
Cancer mortality was strongly age-dependent, with the highest absolute number of deaths occurring among individuals aged 65–74 years, particularly 70–74 years. However, the highest age-specific mortality rates were observed among individuals aged 80–84 years, followed by those aged ≥85 years. This reflects the cumulative effect of genetic damage, prolonged carcinogenic exposure, and reduced physiological and immune capacity associated with ageing [25].
The decline in mortality rates among individuals aged ≥85 years should be interpreted cautiously and may reflect selective survival, competing causes of death, reduced diagnostic intensity, and possible misclassification of causes of death. Similar patterns have been reported in international cancer mortality analyses [20,22,25].
Sex-specific analysis demonstrated consistently higher mortality rates among men in older age groups, with the greatest difference observed between 75 and 84 years. In women, mortality was shifted toward older ages, reflecting longer life expectancy and delayed mortality from several common cancers, including breast and colorectal cancer [26,27].
Joinpoint regression revealed a complex temporal pattern of cancer mortality in Serbia. At the population level, age-standardized mortality showed a small but statistically significant decline during 2000–2021 (AAPC −0.31%; p<0.001), suggesting gradual improvement but slower progress compared with many high-income European countries [22,28].
Sex-specific trends demonstrated important differences. Among men, mortality increased significantly during 2000–2008 (APC +1.17%), followed by a significant decline between 2008 and 2019 (APC −0.86%). This reversal may reflect delayed effects of tobacco control measures, improvements in diagnosis, and advances in treatment of major cancers affecting men, particularly lung, colorectal, and prostate cancer [28,29].
The accelerated decline observed after 2019 should be interpreted with caution. Although it may partly represent continued improvement in cancer control, the COVID-19 pandemic likely influenced healthcare access, diagnostic pathways, and mortality registration, potentially contributing to an artificial reduction in recorded cancer mortality [30].
Among women, Joinpoint analysis identified a significant increase in mortality during 2000–2008 (APC +0.86%), followed by a modest decline from 2008 onwards (APC −0.48%). The slower improvement compared with men may reflect the more complex epidemiological profile of female cancers, including breast, cervical, and lung cancer, where mortality trends depend strongly on screening coverage, reproductive factors, and long-term changes in smoking patterns [20,27,31].
The absence of a statistically significant long-term decline among women (AAPC −0.03%; p=0.698) indicates that improvements in some cancer types have been counterbalanced by persistent or increasing mortality from others, particularly lung cancer. These findings highlight the need for gender-specific cancer control strategies, including improved screening coverage and targeted prevention interventions [32,33].
The findings emphasize that cancer mortality remains a major public health challenge in Serbia, particularly among older adults and men. Future strategies should prioritize primary prevention, tobacco and alcohol control, strengthening organized screening programs, and improving access to timely diagnosis and treatment [24,32,34].
The main strength of this study is the long observation period (2000–2021), comprehensive analysis by age and sex, and application of Joinpoint regression to identify changes in mortality trends. Limitations include the use of aggregated mortality data without analysis by cancer site, potential temporal changes in cause-of-death certification, inability to directly attribute observed trends to specific interventions, and possible distortion of 2020–2021 trends due to the COVID-19 pandemic.
5. Conclusions
Cancer mortality remained a major public health challenge in Serbia during 2000–2021, characterized by pronounced sex and age inequalities. Although age-standardized mortality rates showed a gradual decline, the improvement was modest, with substantially higher mortality among men and persistent challenges among women. The observed trends highlight the need for strengthened cancer prevention, particularly tobacco and alcohol control, improved participation in organized screening programs, earlier diagnosis, and equitable access to effective treatment. In the context of population ageing, targeted strategies focusing on older adults and high-risk groups are essential to achieve further reductions in cancer mortality. Continued surveillance using population-based mortality data and advanced trend analyses is crucial for evaluating progress and guiding future cancer control policies in Serbia.
Author Contributions
Conceptualization, O.D., G.Dj., M.S., V.R. and J.R.S.; Methodology, D.G., S.R., I.S.V., M.V. and O.M.; Formal analysis, O.D., D.G., S.I., K.J., S.M. and A.I.; Investigation, G.Dj., S.R., I.S.V., S.I., K.J., S.M., A.B.K., A.M., V.S. and O.M.; Data curation, O.D., D.G., A.B.K., A.M. and V.S.; Writing—original draft preparation, O.D., D.G., S.R., I.S.V., S.I., K.J., A.B.K., A.M., V.S. and M.V.; Writing—review and editing, G.Dj., M.S., S.M., O.M., A.I., V.R. and J.R.S.; Supervision, G.Dj., M.S. and V.R.; Project administration, J.R.S. and M.S. All authors have read and agreed to the published version of the manuscript.
Funding
This research received no external funding.
Institutional Review Board Statement
This study was conducted as an observational epidemiological analysis based on aggregated, publicly available data obtained from the national cancer registry maintained by the Institute of Public Health of Serbia “Dr Milan Jovanović Batut”—Malignant tumours in Republic of Serbia, available from https://www.batut.org.rs/index.php?content=2096, accessed on 8 April 2026. Therefore, this study was exempted from the approval by the ethics committee.
Informed Consent Statement
This study is an observational epidemiological analysis based on publicly available datasets. It does not involve identifiable patient information and thus does not require obtaining the patients’ informed consent forms.
Data Availability Statement
All data is contained within this article.
Conflicts of Interest
The authors declare no conflicts of interest.
References
- Bray, F.; Laversanne, M.; Weiderpass, E.; Soerjomataram, I. The ever-increasing importance of cancer as a leading cause of premature death worldwide. Cancer 2021, 127, 3029–3030. [Google Scholar] [CrossRef]
- GBD 2019 Cancer Collaboration. Cancer incidence, mortality, years of life lost, years lived with disability, and disability-adjusted life years for 29 cancer groups from 2010 to 2019: A systematic analysis for the Global Burden of Disease Study 2019. JAMA Oncol. 2022, 8, 420–444. [Google Scholar] [CrossRef]
- Wild, C.P.; Weiderpass, E.; Stewart, B.W. (Eds.) World Cancer Report: Cancer Research for Cancer Prevention; International Agency for Research on Cancer: Lyon, France, 2020; Available online: https://www.ncbi.nlm.nih.gov/books/NBK606505/.
- Fidler, M.M.; Bray, F.; Soerjomataram, I. The global cancer burden and human development: A review. Scand. J. Public Health 2018, 46, 27–36. [Google Scholar] [CrossRef]
- Bray, F.; Laversanne, M.; Sung, H.; Ferlay, J.; Siegel, R.L.; Soerjomataram, I.; et al. Global cancer statistics 2022: GLOBOCAN estimates of incidence and mortality worldwide for 36 cancers in 185 countries. CA Cancer J. Clin. 2024, 74, 229–263. [Google Scholar] [CrossRef]
- Li, L.; Shan, T.; Zhang, D.; Ma, F. Nowcasting and forecasting global aging and cancer burden: Analysis of data from the GLOBOCAN and Global Burden of Disease Study. J. Natl. Cancer Cent. 2024, 4, 223–232. [Google Scholar] [CrossRef]
- Torre, L.A.; Siegel, R.L.; Ward, E.M.; Jemal, A. Global cancer incidence and mortality rates and trends—An update. Cancer Epidemiol. Biomark. Prev. 2016, 25, 16–27. [Google Scholar] [CrossRef]
- Shah, S.C.; Kayamba, V.; Peek, R.M., Jr.; Heimburger, D. Cancer control in low- and middle-income countries: Is it time to consider screening? J. Glob. Oncol. 2019, 5, 1–8. [Google Scholar] [CrossRef]
- Miljus, D.; Zivkovic, S.; Bozic, Z. Malignant Tumours in Republic of Serbia 2022; Institute of Public Health of Serbia: Belgrade, Serbia, 2024; Available online: https://www.batut.org.rs/download/publikacije/MalignTumoriURepubliciSrbiji2022.pdf.
- International Agency for Research on Cancer (IARC). GLOBOCAN 2022: Serbia Fact Sheet; World Health Organization: Lyon, France, 2024; Available online: https://gco.iarc.who.int/media/globocan/factsheets/populations/688-serbia-fact-sheet.pdf.
- Djekic Malbasa, J.; Kovacevic, T.; Zaric, B.; Dugandzija, T.; Nikolin, B.; Radovanovic, D.; et al. Decade of lung cancer in Serbia: Tobacco abuse and gender differences. Eur. Rev. Med. Pharmacol. Sci. 2023, 27, 3105–3116. [Google Scholar] [CrossRef]
- Sipetić, S.; Bjegović-Mikanović, V.; Vlajinac, H.; Marinković, J.; Janković, S.; Terzić, Z.; et al. The burden of disease preventable by risk factor reduction in Serbia. Vojnosanit. Pregl. 2013, 70, 445–451. [Google Scholar] [CrossRef]
- Kim, H.J.; Fay, M.P.; Feuer, E.J.; Midthune, D.N. Permutation tests for joinpoint regression with applications to cancer rates. Stat. Med. 2000, 19, 335–351. [Google Scholar] [CrossRef]
- National Cancer Institute. Joinpoint Regression Program, Version 5.2.0.0. In Statistical Research and Applications Branch; National Cancer Institute: Bethesda, MD, USA, 2024; Available online: https://surveillance.cancer.gov/joinpoint/.
- World Health Organization. International Statistical Classification of Diseases and Related Health Problems, 10th Revision. World Health Organization: Geneva, Switzerland, 2019; Volume 1, Available online: https://www.who.int/classifications/classification-of-diseases.
- Institute of Public Health of Serbia “Dr Milan Jovanović Batut”. Cancer Incidence and Mortality in the Republic of Serbia; Institute of Public Health of Serbia “Dr Milan Jovanović Batut”: Belgrade, Serbia; Available online: https://www.batut.org.rs/.
- Statistical Office of the Republic of Serbia. Population Estimates and Demographic Statistics of the Republic of Serbia. Statistical Office of the Republic of Serbia: Belgrade, Serbia. Available online: https://www.stat.gov.rs/.
- Segi, M. Cancer Mortality for Selected Sites in 24 Countries (1950–1957). In Department of Public Health, Tohoku University School of Medicine; Sendai, Japan, 1960. [Google Scholar]
- National Cancer Institute. Joinpoint Regression Program, Version 5.2.0.0. In Statistical Research and Applications Branch; National Cancer Institute: Bethesda, MD, USA, 2024; Available online: https://surveillance.cancer.gov/joinpoint/.
- Bray, F.; Laversanne, M.; Sung, H.; Ferlay, J.; Siegel, R.L.; Soerjomataram, I.; et al. Global cancer statistics 2022: GLOBOCAN estimates of incidence and mortality worldwide for 36 cancers in 185 countries. CA Cancer J. Clin. 2024, 74, 229–263. [Google Scholar] [CrossRef]
- GBD 2019 Cancer Collaboration. Cancer incidence, mortality, years of life lost, years lived with disability, and disability-adjusted life years for 29 cancer groups from 2010 to 2019: A systematic analysis for the Global Burden of Disease Study 2019. JAMA Oncol. 2022, 8, 420–444. [Google Scholar]
- Arnold, M.; Morgan, E.; Rumgay, H.; Mafra, A.; Singh, D.; Laversanne, M.; et al. Current and future burden of cancer in Europe: Insights from the Global Cancer Observatory. Ann. Oncol. 2022, 33, 691–702. [Google Scholar]
- Vaccarella, S.; Georges, D.; Bray, F.; et al. Socioeconomic inequalities in cancer mortality between and within countries in Europe: A population-based study. Lancet Reg. Health Eur. 2022, 25, 100551. [Google Scholar] [CrossRef]
- GBD 2021 Risk Factors Collaborators. Global burden and strength of evidence for 88 risk factors in 204 countries and 811 subnational locations, 1990–2021: A systematic analysis for the Global Burden of Disease Study 2021. Lancet 2024, 403, 2162–2203. [CrossRef]
- White, M.C.; Holman, D.M.; Boehm, J.E.; et al. Age and cancer risk: A potentially modifiable relationship. Am. J. Prev. Med. 2014, 46, S7–S15. [Google Scholar]
- Arnold, M.; Sierra, M.S.; Laversanne, M.; Soerjomataram, I.; Jemal, A.; Bray, F. Global patterns and trends in colorectal cancer incidence and mortality. Gut 2017, 66, 683–691. [Google Scholar] [CrossRef]
- Ginsburg, O.; Bray, F.; Coleman, M.P.; et al. The global burden of women's cancers: A grand challenge in global health. Lancet 2017, 389, 847–860. [Google Scholar] [CrossRef]
- Malvezzi, M.; Carioli, G.; Bertuccio, P.; Negri, E.; La Vecchia, C. Cancer mortality in Europe in 2020 and trends since 1990: Evidence from EU-27 countries. Eur. J. Cancer Prev. 2021, 30, 558–567. [Google Scholar]
- Carioli, G.; Malvezzi, M.; Rodriguez, T.; Bertuccio, P.; Negri, E.; La Vecchia, C. Trends and predictions to 2030 in breast cancer mortality in Europe. Breast 2017, 36, 89–95. [Google Scholar] [CrossRef]
- Maringe, C.; Spicer, J.; Morris, M.; et al. The impact of the COVID-19 pandemic on cancer deaths due to delays in diagnosis in England, UK. Lancet Oncol. 2020, 21, 1023–1034. [Google Scholar] [CrossRef]
- Arbyn, M.; Weiderpass, E.; Bruni, L.; de Sanjosé, S.; Saraiya, M.; Ferlay, J.; et al. Estimates of incidence and mortality of cervical cancer in 2018: A worldwide analysis. Lancet Glob. Health 2020, 8, e191–e203. [Google Scholar] [CrossRef]
- World Health Organization. Guide to Cancer Early Diagnosis; World Health Organization: Geneva, Switzerland, 2017. [Google Scholar]
- OECD. Beating Cancer Inequalities in the EU: Spotlight on Cancer Prevention and Early Detection; OECD Publishing: Paris, France, 2024. [Google Scholar]
- Rehm, J.; Shield, K.D. Alcohol use and cancer in the European Union. Eur. Addict Res. 2021, 27, 1–8. [Google Scholar] [CrossRef]
Figure 1.
Distribution of deaths from malignant neoplasms (C00–C97) according to age groups and sex, Republic of Serbia excluding the Autonomous Province of Kosovo and Metohija, 2000–2021.
Figure 1.
Distribution of deaths from malignant neoplasms (C00–C97) according to age groups and sex, Republic of Serbia excluding the Autonomous Province of Kosovo and Metohija, 2000–2021.
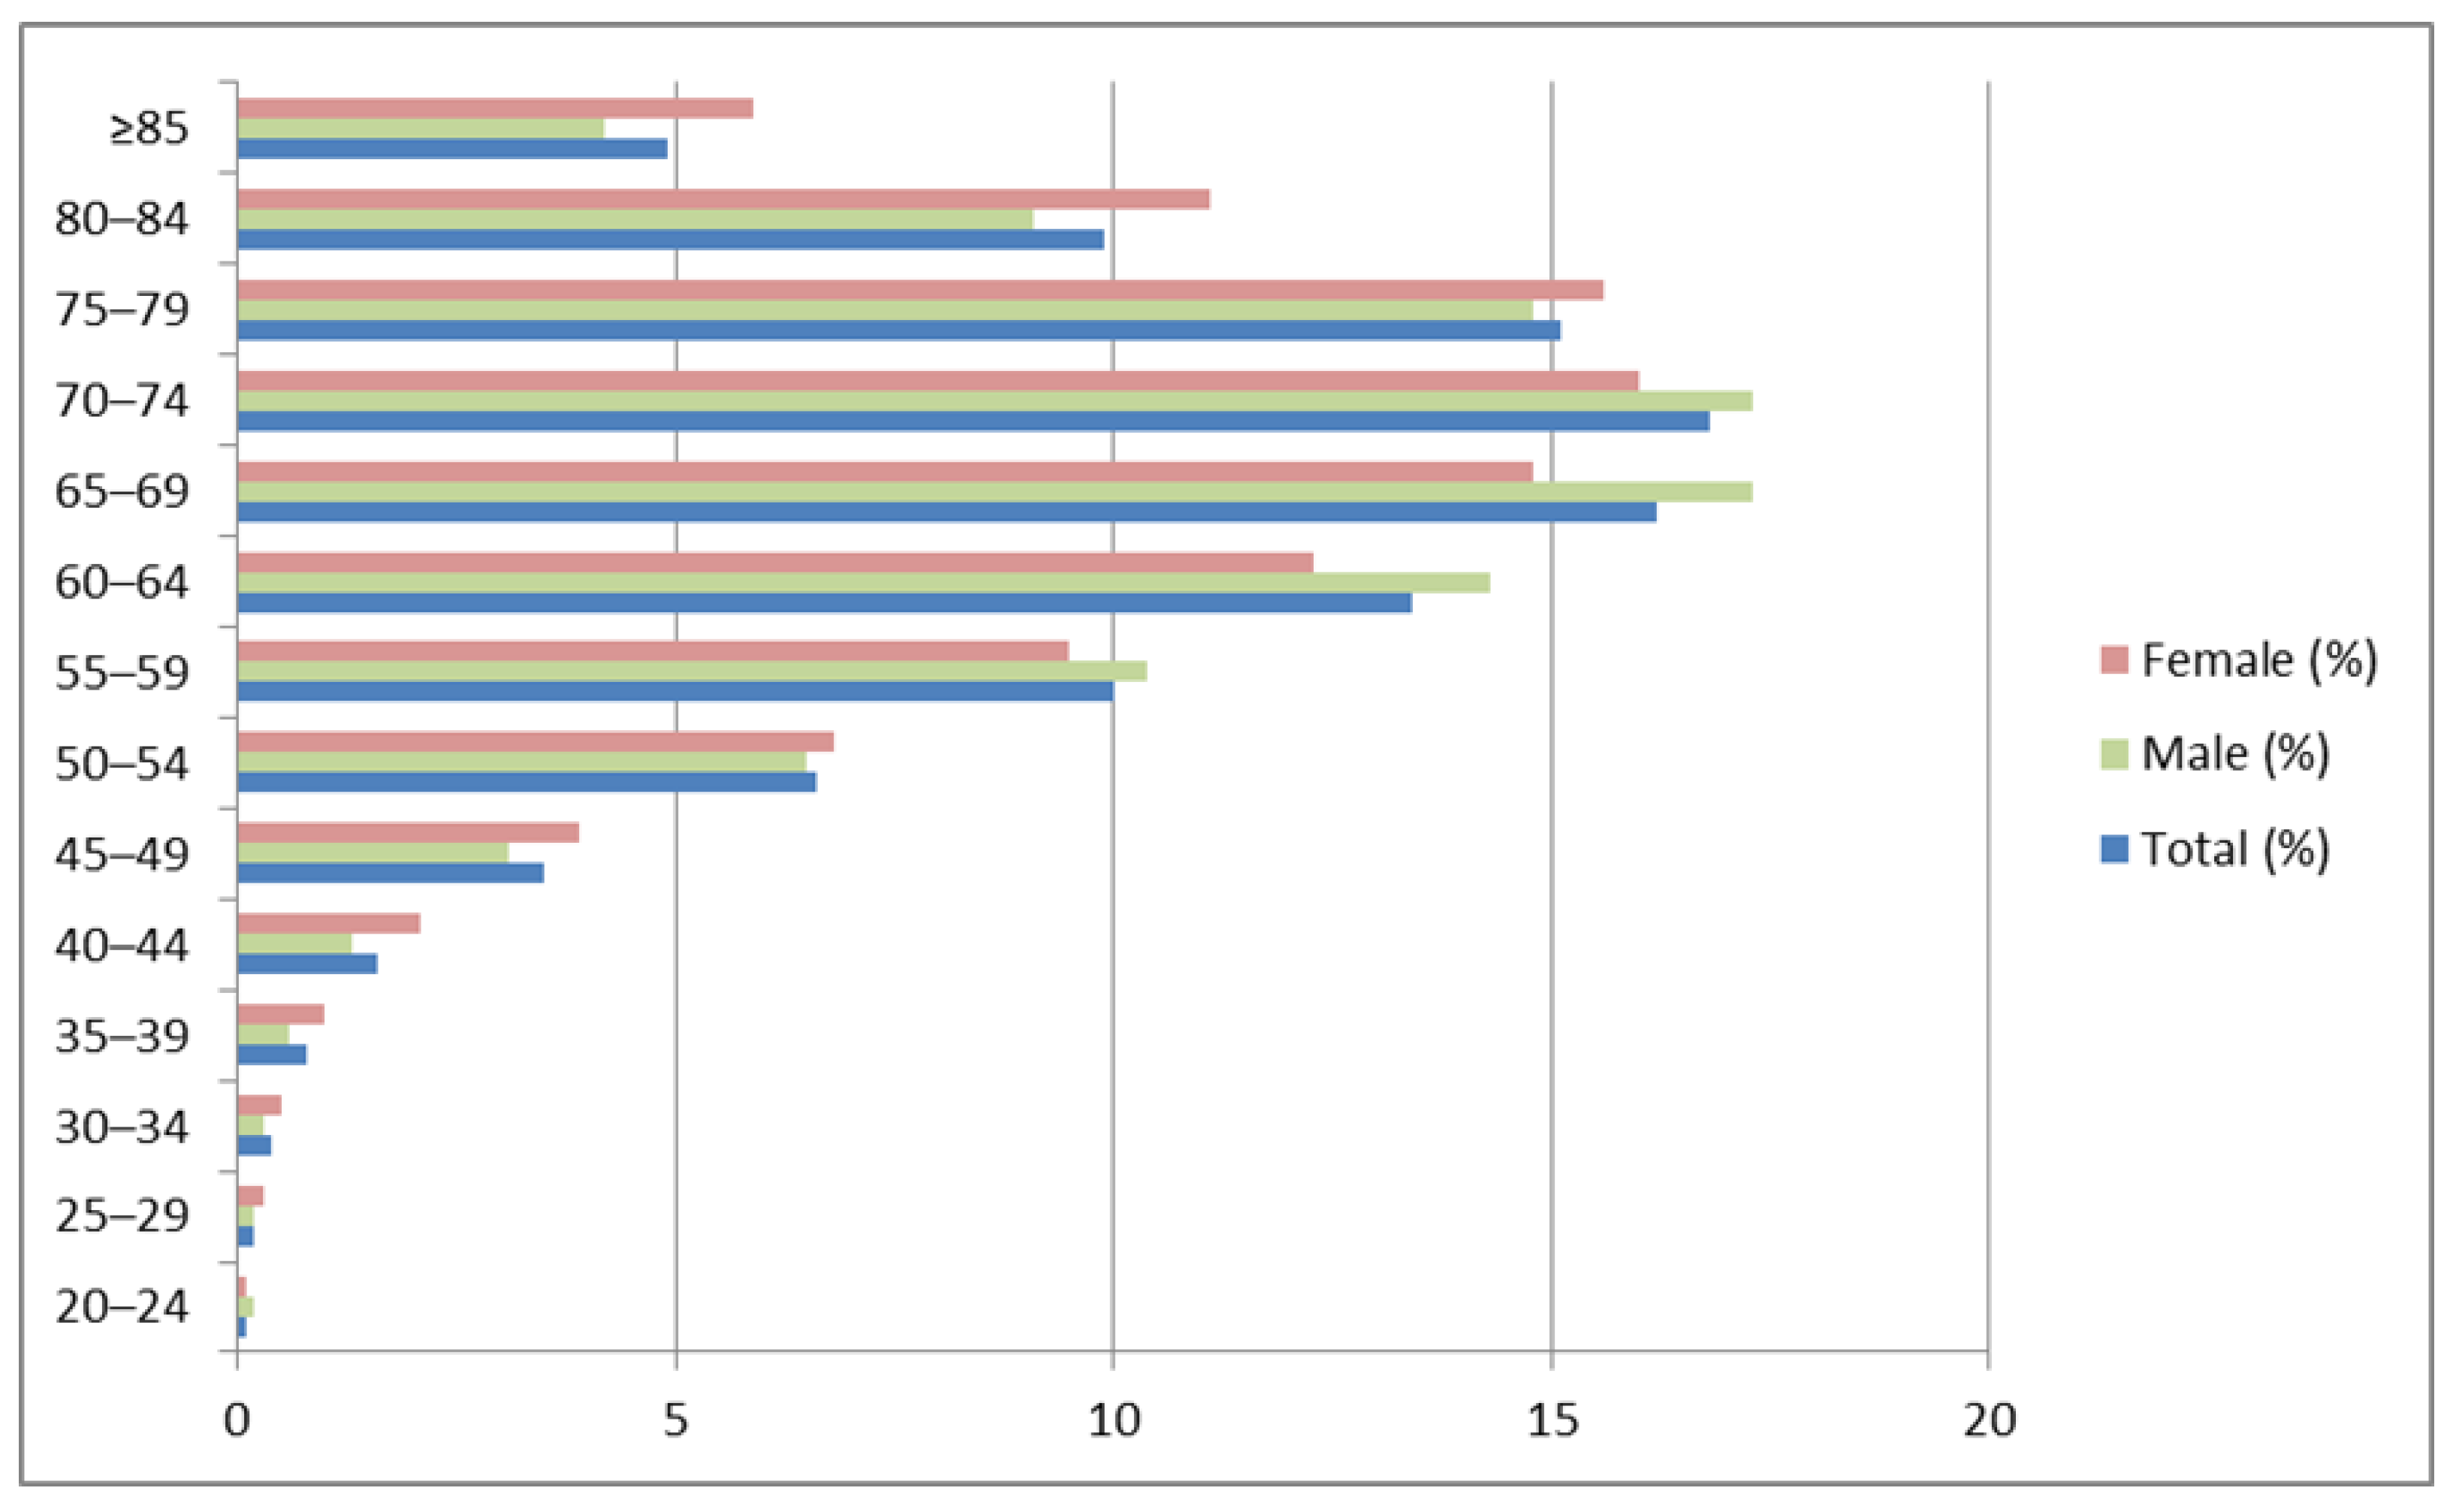

Table 1.
Number of deaths, crude mortality rates, and age-standardized mortality rates (ASR) for malignant neoplasms (C00–C97), by sex, Republic of Serbia (excluding the Autonomous Province of Kosovo and Metohija), 2000–2021.
Table 1.
Number of deaths, crude mortality rates, and age-standardized mortality rates (ASR) for malignant neoplasms (C00–C97), by sex, Republic of Serbia (excluding the Autonomous Province of Kosovo and Metohija), 2000–2021.
| Year | Total | Male | Female | ||||||
| N | CR | ASR | N | CR | ASR | N | CR | ASR | |
| 2000 | 17,873 | 237.8 | 131.9 | 10,179 | 278.4 | 165.7 | 7,694 | 199.3 | 104.3 |
| 2001 | 17,915 | 238.8 | 130.6 | 10,173 | 278.8 | 164.3 | 7,742 | 200.8 | 103.5 |
| 2002 | 18,547 | 247.3 | 133.6 | 10,634 | 291.6 | 169.2 | 7,913 | 205.4 | 105.2 |
| 2003 | 18,857 | 252.1 | 134.5 | 10,688 | 293.8 | 169.2 | 8,169 | 212.6 | 106.4 |
| 2004 | 19,358 | 259.4 | 136.3 | 10,980 | 302.6 | 171.4 | 8,378 | 218.5 | 107.8 |
| 2005 | 19,737 | 265.3 | 138.1 | 11,166 | 308.6 | 174.2 | 8,571 | 214.0 | 109.4 |
| 2006 | 20,216 | 272.8 | 140.2 | 11,494 | 319.0 | 177.0 | 8,722 | 229.1 | 110.5 |
| 2007 | 20,411 | 276.5 | 139.8 | 11,730 | 326.8 | 178.7 | 8,681 | 228.9 | 108.4 |
| 2008 | 20,570 | 279.9 | 140.4 | 11,807 | 330.4 | 177.9 | 8,763 | 232.1 | 110.3 |
| 2009 | 21,031 | 287.3 | 141.8 | 11,982 | 336.6 | 179.2 | 9,049 | 240.6 | 111.7 |
| 2010 | 21,138 | 289.9 | 142.3 | 12,120 | 341.8 | 180.5 | 9,018 | 240.8 | 111.4 |
| 2011 | 21,007 | 290.3 | 137.3 | 12,085 | 342.9 | 174.5 | 8,922 | 240.3 | 107.5 |
| 2012 | 21,261 | 295.2 | 137.6 | 12,130 | 345.9 | 173.7 | 9,131 | 247.2 | 109.0 |
| 2013 | 21,090 | 294.3 | 135.3 | 12,100 | 346.7 | 171.5 | 8,990 | 244.5 | 106.5 |
| 2014 | 21,320 | 298.9 | 135.9 | 12,116 | 348.9 | 170.7 | 9,204 | 251.5 | 108.2 |
| 2015 | 21,375 | 301.3 | 135.5 | 12,377 | 358.2 | 172.9 | 8,998 | 247.2 | 105.5 |
| 2016 | 21,524 | 304.9 | 135.7 | 12,251 | 356.4 | 169.4 | 9,273 | 256.1 | 109.1 |
| 2017 | 21,475 | 305.9 | 133.5 | 12,087 | 353.4 | 165.1 | 9,388 | 260.7 | 108.6 |
| 2018 | 21,607 | 309.4 | 133.1 | 12,174 | 357.9 | 164.8 | 9,433 | 263.4 | 108.1 |
| 2019 | 21,339 | 307.3 | 130.9 | 12,134 | 358.6 | 163.7 | 9,205 | 258.5 | 104.7 |
| 2020 | 20,761 | 300.9 | 127.1 | 11,607 | 345.4 | 156.3 | 9,154 | 258.7 | 104.0 |
| 2021 | 19,979 | 292.3 | 122.7 | 10,974 | 329.9 | 148.2 | 9,005 | 256.8 | 103.0 |
| Total/Average | 448,391 | 282.2 | 135.2 | 254,988 | 329.7 | 196.9 | 193,403 | 232.1 | 105.3 |
* N – number of deaths; CR – crude mortality rate (per 100,000 population); ASR – age-standardized mortality rate (per 100,000 population).
Table 2.
Number of deaths, percentage distribution, and age-specific mortality rates from malignant neoplasms (C00–C97) according to age groups and sex, Republic of Serbia excluding the Autonomous Province of Kosovo and Metohija, 2000–2021.
Table 2.
Number of deaths, percentage distribution, and age-specific mortality rates from malignant neoplasms (C00–C97) according to age groups and sex, Republic of Serbia excluding the Autonomous Province of Kosovo and Metohija, 2000–2021.
| Age Groups | Total | Male | Female | ||||||
| N | % | ASMR | N | % | ASMR | N | % | ASMR | |
| 0–4 | 296 | 0.1 | 3.9 | 171 | 0.1 | 4.3 | 125 | 0.1 | 3.3 |
| 5–9 | 251 | 0.1 | 3.1 | 150 | 0.1 | 3.6 | 101 | 0.1 | 2.6 |
| 10–14 | 243 | 0.1 | 2.9 | 141 | 0.1 | 3.2 | 102 | 0.1 | 2.4 |
| 15–19 | 422 | 0.1 | 4.5 | 242 | 0.1 | 5.1 | 180 | 0.1 | 3.9 |
| 20–24 | 663 | 0.1 | 6.6 | 418 | 0.2 | 8.1 | 245 | 0.1 | 4.9 |
| 25–29 | 1,066 | 0.2 | 10.0 | 573 | 0.2 | 10.6 | 493 | 0.3 | 9.2 |
| 30–34 | 1,904 | 0.4 | 17.7 | 879 | 0.3 | 16.2 | 1,025 | 0.5 | 18.7 |
| 35–39 | 3,476 | 0.8 | 32.3 | 1,535 | 0.6 | 28.4 | 1,941 | 1.0 | 35.3 |
| 40–44 | 7,283 | 1.6 | 66.4 | 3,312 | 1.3 | 60.7 | 3,971 | 2.1 | 70.0 |
| 45–49 | 15,609 | 3.5 | 135.4 | 8,023 | 3.1 | 140.0 | 7,586 | 3.9 | 127.4 |
| 50–54 | 29,609 | 6.6 | 251.4 | 16,553 | 6.5 | 285.0 | 13,056 | 6.8 | 214.4 |
| 55–59 | 44,929 | 10.0 | 403.4 | 26,603 | 10.4 | 495.0 | 18,326 | 9.5 | 312.8 |
| 60–64 | 60,181 | 13.4 | 577.4 | 36,485 | 14.3 | 744.4 | 23,696 | 12.3 | 418.6 |
| 65–69 | 72,744 | 16.2 | 767.0 | 44,144 | 17.3 | 1,023.7 | 28,600 | 14.8 | 540.7 |
| 70–74 | 75,156 | 16.8 | 951.6 | 44,140 | 17.3 | 1,287.2 | 31,016 | 16.0 | 681.2 |
| 75–79 | 67,876 | 15.1 | 1,141.1 | 37,801 | 14.8 | 1,561.5 | 30,075 | 15.6 | 841.0 |
| 80–84 | 44,504 | 9.9 | 1,254.6 | 23,113 | 9.1 | 1,692.6 | 21,391 | 11.1 | 995.5 |
| ≥85 | 22,176 | 4.9 | 1,154.8 | 10,703 | 4.2 | 1,541.2 | 11,473 | 5.9 | 922.5 |
| Total/Average | 448,391 | 100 | 376.9 | 254,988 | 100 | 495.0 | 193,403 | 100 | 289.1 |
*ASMR – age-specific mortality rate (per 100,000 population).
Table 3.
Linear trends in age-standardized mortality rates from malignant neoplasms (C00–C97) according to age groups and sex, Republic of Serbia excluding the Autonomous Province of Kosovo and Metohija, 2000–2021.
Table 3.
Linear trends in age-standardized mortality rates from malignant neoplasms (C00–C97) according to age groups and sex, Republic of Serbia excluding the Autonomous Province of Kosovo and Metohija, 2000–2021.
| Age group (years) | Total: Linear trend model | p-value | Men: Linear trend model | p-value | Women: Linear trend model | p-value |
| 0–4 | y = −0.0643x + 4.5989 | 0.074 | y = −0.0714x + 5.1512 | 0.125 | y = −0.0504x + 3.8926 | 0.278 |
| 5–9 | y = −0.0434x + 3.6448 | 0.173 | y = −0.117x + 4.9813 | 0.054 | y = −0.0419x + 2.0919 | 0.226 |
| 10–14 | y = −0.048x + 3.4077 | 0.095 | y = −0.1044x + 4.3961 | 0.053 | y = 0.0196x + 2.2117 | 0.598 |
| 15–19 | y = −0.0635x + 5.2701 | 0.121 | y = −0.0996x + 6.2001 | 0.062 | y = −0.0612x + 4.0454 | 0.800 |
| 20–24 | y = −0.1413x + 8.1773 | 0.001* | y = −0.1932x + 10.278 | 0.008* | y = −0.0749x + 5.7369 | 0.232 |
| 25–29 | y = −0.1868x + 12.190 | 0.003* | y = −0.240x + 13.371 | 0.001* | y = −0.1008x + 10.378 | 0.231 |
| 30–34 | y = −0.3887x + 22.207 | <0.001* | y = −0.3734x + 20.532 | <0.001* | y = −0.324x + 22.432 | 0.003* |
| 35–39 | y = −0.5698x + 38.811 | <0.001* | y = −0.4779x + 33.910 | 0.006* | y = −0.5415x + 41.558 | 0.011* |
| 40–44 | y = −1.6096x + 84.937 | <0.001* | y = −1.7324x + 80.589 | <0.001* | y = −1.1772x + 83.532 | 0.001* |
| 45–49 | y = −3.5329x + 176.03 | <0.001* | y = −4.7077x + 194.11 | <0.001* | y = −1.8826x + 149.02 | 0.007* |
| 50–54 | y = −4.4200x + 302.22 | <0.001* | y = −7.2304x + 368.11 | <0.001* | y = −1.0661x + 226.66 | 0.170 |
| 55–59 | y = 1.7754x + 423.85 | 0.088 | y = −4.2659x + 544.09 | 0.007* | y = 1.2263x + 298.72 | 0.227 |
| 60–64 | y = −1.8803x + 555.76 | 0.040* | y = 1.0965x + 731.78 | 0.485 | y = 3.8325x + 374.57 | 0.051 |
| 65–69 | y = 4.0582x + 720.35 | <0.001* | y = 4.2451x + 974.85 | 0.005* | y = 5.3947x + 478.67 | 0.021* |
| 70–74 | y = 2.6585x + 921.01 | 0.025* | y = 1.2973x + 1272.3 | 0.459 | y = 5.1163x + 622.37 | 0.020* |
| 75–79 | y = 4.5026x + 1089.4 | 0.008* | y = 6.4454x + 1487.4 | 0.024* | y = 3.3155x + 802.88 | 0.093 |
| 80–84 | y = 11.507x + 1122.3 | <0.001* | y = 21.525x + 1445.0 | <0.001* | y = 2.189x + 970.37 | 0.394 |
| 85+ | y = 13.980x + 994.08 | <0.001* | y = 25.986x + 1242.3 | <0.001* | y = 9.358x + 814.92 | 0.014* |
| Overall | y = −0.2839x + 138.45 | 0.074 | y = −0.5439x + 176.16 | 0.033* | y = −0.0400x + 107.87 | 0.654 |
Table 4.
Annual Percent Change (APC) and Average Annual Percent Change (AAPC) in age-standardized mortality rates from malignant neoplasms (C00–C97) according to sex, Republic of Serbia excluding the Autonomous Province of Kosovo and Metohija, 2000–2021.
Table 4.
Annual Percent Change (APC) and Average Annual Percent Change (AAPC) in age-standardized mortality rates from malignant neoplasms (C00–C97) according to sex, Republic of Serbia excluding the Autonomous Province of Kosovo and Metohija, 2000–2021.
| Group | Segment | Lower Endpoint | Upper Endpoint | APC (%) | Lower 95% CI | Upper 95% CI | P-value |
| Total – 2 Joinpoints | 1 | 2000 | 2008 | 1.0067* | 0.7567 | 1.3238 | <0.000001 |
| Total – 2 Joinpoints | 2 | 2008 | 2019 | -0.6718* | -0.8211 | -0.4897 | 0.000800 |
| Total – 2 Joinpoints | 3 | 2019 | 2021 | -3.4531* | -4.4050 | -2.0571 | <0.000001 |
| Men – 2 Joinpoints | 1 | 2000 | 2008 | 1.1748* | 0.8834 | 1.5276 | <0.000001 |
| Men – 2 Joinpoints | 2 | 2008 | 2019 | -0.8610* | -1.0329 | -0.6618 | <0.000001 |
| Men – 2 Joinpoints | 3 | 2019 | 2021 | -4.8794* | -6.0302 | -3.2360 | <0.000001 |
| Women – 1 Joinpoint | 1 | 2000 | 2008 | 0.8562* | 0.3517 | 1.8665 | 0.001200 |
| Women – 1 Joinpoint | 2 | 2008 | 2021 | -0.4786* | -0.8556 | -0.2392 | <0.000001 |
* Indicates that the Annual Percent Change (APC) is significantly different from zero at the α = 0.05 significance level.
Table 5.
Average Annual Percent Change (AAPC).
| Group | Range | Lower Endpoint | Upper Endpoint | AAPC (%) | Lower 95% CI | Upper 95% CI | Test Statistic | P-value |
| Total – 2 Joinpoints | Full Range | 2000 | 2021 | -0.3057* | -0.3991 | -0.2143 | -- | <0.000001 |
| Men – 2 Joinpoints | Full Range | 2000 | 2021 | -0.4832* | -0.5933 | -0.3738 | -- | <0.000001 |
| Women – 1 Joinpoint | Full Range | 2000 | 2021 | 0.0278 | -0.1312 | 0.2249 | -- | 0.698260 |
* Indicates that the Average Annual Percent Change (AAPC) is significantly different from zero at the α = 0.05 significance level.
Disclaimer/Publisher’s Note: The statements, opinions and data contained in all publications are solely those of the individual author(s) and contributor(s) and not of MDPI and/or the editor(s). MDPI and/or the editor(s) disclaim responsibility for any injury to people or property resulting from any ideas, methods, instructions or products referred to in the content. |
© 2026 by the authors. Licensee MDPI, Basel, Switzerland. This article is an open access article distributed under the terms and conditions of the Creative Commons Attribution (CC BY) license (http://creativecommons.org/licenses/by/4.0/).
Copyright: This open access article is published under a Creative Commons CC BY 4.0 license, which permit the free download, distribution, and reuse, provided that the author and preprint are cited in any reuse.