

Submitted:
01 September 2026
Posted:
02 September 2026
You are already at the latest version
Abstract
Background/Objectives: Childhood overweight and obesity are major public health concerns influenced by modifiable dietary and lifestyle behaviors. This study examined associations between dietary habits, lifestyle factors, and body mass index (BMI) among children and adolescents in Tirana, Albania. Methods: A repeated cross-sectional study included 1,200 participants aged 6–17 years during 2025–2026, selected using multistage cluster sampling. Data were collected using a structured questionnaire developed for the study, with selected items adapted from the UNICEF/Institute of Public Health/WHO report on childhood obesity in Albania. BMI was analyzed as a continuous outcome. Associations were assessed using Spearman’s correlation, Mann–Whitney U and Kruskal–Wallis tests, followed by multivariable linear regression. Statistical significance was set at p < 0.05. Results: Among participants, 56.9% were female and 40.1% were aged 14–17 years. BMI was higher among males than females (20.51 ± 3.92 vs. 19.52 ± 3.51 kg/m2, p < 0.001) and increased with age (p < 0.001). Older age (B = 0.393, 95% CI: 0.329–0.457; p < 0.001) and male gender (B = 1.192, 95% CI: 0.787–1.597; p < 0.001) were associated with higher BMI, whereas higher fruit consumption (B = −0.313, 95% CI: −0.539 to −0.087; p = 0.007) and better self-perceived eating habits (B = −0.510, 95% CI: −0.885 to −0.135; p = 0.008) were associated with lower BMI. The model explained 18.4% of BMI variability. Conclusions: BMI was independently associated with age, sex, and selected dietary behaviors. Integrated school- and family-based strategies may help promote healthy dietary behaviors and prevent childhood overweight and obesity.
Keywords:
body mass index
; children
; adolescents
; dietary habits
; eating behaviors
; childhood obesity
1. Introduction
Childhood overweight and obesity have emerged as major global public health challenges, with their prevalence increasing substantially over recent decades. Excess body weight during childhood is associated with a broad range of adverse health outcomes, many of which may persist into adulthood. According to the World Health Organization (WHO), more than 390 million children and adolescents aged 5–19 years were overweight in 2022, including more than 160 million living with obesity [1]. Similarly, data from the WHO European Childhood Obesity Surveillance Initiative (COSI) indicate that overweight and obesity remain highly prevalent among school-aged children across Europe, underscoring the need for effective prevention strategies targeting modifiable behavioral risk factors [1,2]. Childhood overweight and obesity are associated with an increased risk of cardiometabolic disease, impaired psychosocial well-being, reduced quality of life, and obesity persisting into adulthood [3].
Body mass index (BMI) is one of the most widely used anthropometric measures for assessing nutritional status in children and adolescents. Because BMI changes with age and differs by sex throughout childhood and adolescence, its interpretation in pediatric populations requires age- and sex-specific reference standards, such as those provided by the WHO [4,5]. Although BMI is commonly categorized into weight-status groups for clinical and public health purposes, its use as a continuous measure allows a more detailed assessment of factors associated with variation in BMI beyond predefined weight-status categories.
Dietary habits are among the most important modifiable factors influencing BMI during childhood and adolescence. Regular consumption of fruits, vegetables, whole grains, legumes, and other nutrient-dense foods has been associated with healthier body weight, whereas frequent consumption of sugar-sweetened beverages, ultra-processed foods, fast food, sweets, and other energy-dense foods has been associated with higher BMI and an increased risk of overweight and obesity [6,7,8,9,10,11,12]. Increasing evidence demonstrates that overall dietary patterns, rather than individual foods alone, are important determinants of BMI and long-term cardiometabolic health in children and adolescents [6,7].
Lifestyle behaviors also play an important role in the health and well-being of school-aged children and adolescents. International surveillance data from the Health Behaviour in School-aged Children (HBSC) study provide evidence on physical activity, sedentary behaviors, dietary habits, sleep, and other health-related behaviors among this population [13]. Insufficient physical activity, prolonged sedentary behavior, excessive screen time, and inadequate sleep duration have each been associated with higher BMI and an increased risk of overweight and obesity [14,15,16,17,18]. These behaviors frequently coexist and may interact with one another, potentially influencing energy balance, growth trajectories, and health outcomes during childhood and adolescence [17,18].
Beyond individual dietary and lifestyle behaviors, children's health behaviors are shaped by socioeconomic and environmental conditions. Family socioeconomic status, parental education, and the home and school food environments may influence dietary choices, physical activity, and the risk of overweight and obesity [19,20,21,22,23,24]. These relationships are consistent with the Social Cognitive Theory, the Theory of Planned Behavior, and the Ecological Model, which emphasize the interplay between individual, social, and environmental influences in shaping health behaviors [23,24,25].
Despite the international evidence, research examining the combined associations of dietary habits, food consumption patterns, lifestyle behaviors, and BMI among school-aged children and adolescents in Albania remains limited. Furthermore, previous research has largely focused on BMI or weight-status categories, with less attention given to factors associated with variation in BMI as a continuous measure. Population-specific evidence is therefore needed to better understand the modifiable behavioral factors associated with BMI among Albanian children and adolescents and to inform evidence-based nutrition and lifestyle interventions.
Therefore, this repeated cross-sectional study aimed to investigate the associations between dietary habits, food consumption patterns, lifestyle behaviors, and BMI among school-aged children and adolescents aged 6–17 years in Tirana, Albania, and to identify modifiable behavioral factors associated with variation in BMI.
2. Materials and Methods
2.1. Study Design and Population
A repeated cross-sectional study was conducted to investigate the associations between dietary habits, lifestyle behaviors, and body mass index (BMI) among school-aged children and adolescents in Tirana, Albania. Data were collected in 2025 and 2026 from independent samples of children and adolescents aged 6–17 years enrolled in public schools in Tirana, covering primary education (Grades 1–5), lower secondary education (Grades 6–9), and upper secondary education (Grades 10–12).
The repeated cross-sectional design involved the recruitment of different participants in each survey year, with no longitudinal follow-up. A total of 1,200 participants were included in the final analysis, with 600 recruited in 2025 and 600 in 2026. Data from the two survey years were pooled and analyzed as a single study population (N = 1,200).
2.2. Participants and Selection Criteria
Participants were recruited using a multistage sampling procedure designed to include children and adolescents from different educational levels and residential areas within the Municipality of Tirana, Albania. In the first stage, administrative units were randomly selected. In the second stage, public schools within the selected administrative units were randomly selected. A total of 11 public schools participated in the study, covering primary education (Grades 1–5), lower secondary education (Grades 6–9), and upper secondary education (Grades 10–12).
In the third stage, classes from Grades 1–12 were selected using stratified sampling within each participating school. In the final stage, students were selected from the chosen classes using systematic random sampling. The first pupil was selected at random, after which pupils were selected at a predetermined sampling interval, with approximately 20 pupils recruited per selected class.
The minimum required sample size was calculated using Cochran’s formula [26], based on the relevant population estimates reported by the Institute of Statistics of Albania (INSTAT) [27]. Assuming a 95% confidence level, a 5% margin of error, and an expected prevalence of 50%, the minimum required sample size was estimated at 384 participants per survey year. The target sample was increased to 600 participants per year to improve the precision and statistical power of the study and to allow for potential non-response and incomplete data. A total of 1,200 participants were therefore recruited across the two survey years.
Eligible participants were children and adolescents aged 6–17 years who were enrolled in one of the selected schools during the study period and provided complete questionnaire data, including information on body weight and height. For children, weight and height were reported by a parent or guardian, whereas adolescents reported their own weight and height. Participants with incomplete questionnaires or missing weight or height information were excluded from the analysis.
The same sampling procedure was applied in 2025 and 2026. The two samples comprised different individuals and were therefore treated as independent cross-sectional samples. For the primary analysis, data from both survey years were pooled and analyzed as a single study population (N = 1,200).
2.3. Data Collection and Study Variables
Data were collected using a structured self-administered questionnaire developed for the present study, informed by previously used instruments assessing dietary behaviors, lifestyle factors, and health-related behaviors among children and adolescents. Selected questionnaire items were adapted from the UNICEF/Institute of Public Health/WHO report on childhood obesity in Albania, which incorporated elements of the WHO European Childhood Obesity Surveillance Initiative (COSI) [28]. The questionnaire was pilot-tested before the main data collection to assess the clarity, comprehensibility, and feasibility of the questions.
The variables included in the present analysis were grouped into three main categories: sociodemographic characteristics, dietary behaviors, and lifestyle-related factors. The selection of variables was based on their potential association with body mass index (BMI) and their relevance as potentially modifiable determinants of childhood weight status.
2.3.1. Sociodemographic Variables
Sociodemographic characteristics included age, sex, residential area, parental educational level, and perceived family economic status. Age was recorded in completed years and categorized into three developmental groups: 6–9 years, 10–13 years, and 14–17 years, representing childhood, early adolescence, and late adolescence, respectively. Gender was categorized as female or male. Residential area was classified as urban, semi-urban, or rural according to the location of the participant’s residence.
Parental educational level was collected separately for mothers and fathers and categorized as primary, secondary, or university education. Perceived family economic status was assessed by self-report and categorized as low, medium, or high.
2.3.2. Dietary Variables
Dietary behaviors were assessed through questions on meal patterns, meal timing, food consumption frequency, and eating-related behaviors.
Meal pattern variables included breakfast, lunch, and dinner consumption frequency, meal skipping, bringing food to school, and the usual timing of the first and last meal of the day. Breakfast, lunch, and dinner consumption were assessed using four predefined categories: never, 1–3 times/week, 4–6 times/week, and every day. Meal skipping was assessed by asking participants which meal they most frequently omitted (breakfast, lunch, or dinner), with participants who reported not skipping meals categorized as “none.” Bringing food to school was categorized as always, sometimes, or never.
The usual time of the first meal was categorized as 06:00–08:00, 09:00–11:00, or 12:00–14:00, while the usual time of the last meal was categorized as 14:00–16:00, 17:00–19:00, 20:00–22:00, or after 22:00.
Participants were also asked whether they had received information about healthy eating, categorized as yes or no. Sources of nutrition information were categorized as family, school, peers, television/radio, internet/social networks, or multiple sources.
Food consumption frequency was assessed using a structured food frequency questionnaire (FFQ) developed for the present study, informed by established dietary assessment methodology [29]. Participants reported their usual frequency of consumption for each food group using four predefined categories: never or less than once per week, 1–3 times per week, 4–6 times per week, and daily or more. For statistical analyses, these categories were coded as ordinal variables reflecting increasing frequency of consumption. The assessed food groups and dietary items included fruits, vegetables, French fries, dairy products, whole grains, refined grains, fish, white meat, red meat, processed meat, eggs, sweets, salty snacks, Coca-Cola, packaged fruit juices, fresh fruit juices, energy drinks, and fast food.
Self-perceived eating habits were assessed using three categories: not good, good, and very good.
2.3.3. Lifestyle Variables
Lifestyle-related variables included participation in organized sports, weekly duration of organized sports, active play outside school, school-based physical activity, transportation to and from school, daily screen time, eating while watching television, and sleep duration.
Participation in organized sports was categorized as yes or no. Weekly organized sports duration was categorized as none, <1 hour/week, 1 hour/week, 2 hours/week, or ≥3 hours/week. Active play outside school was categorized as none, <1 hour/day, 1 hour/day, 2 hours/day, or ≥3 hours/day.
School-based physical activity was categorized according to reported weekly duration as <45 minutes, 90 minutes, 135 minutes, or >135 minutes. Transportation to and from school was classified as active or passive. Active transport included walking and cycling, whereas passive transport included electric scooter use, public transportation, and private vehicles.
Daily screen time was categorized as none/<1 hour, approximately 1 hour, approximately 2 hours, or ≥3 hours. Eating while watching television was categorized as yes or no. Sleep duration was categorized as <9 hours/day or ≥9 hours/day.
2.3.4. Anthropometric Outcome Variable
The primary outcome variable was body mass index (BMI). Body weight and height were reported by a parent or guardian for children and self-reported by adolescents. Weight was reported in kilograms (kg) and height in centimeters (cm). BMI was calculated using the standard formula:
BMI = weight (kg)/[height (m)]2
BMI was analyzed as a continuous outcome variable in the statistical analyses. This approach was selected to retain the full variability of BMI values across childhood and adolescence and to evaluate associations between dietary habits, lifestyle behaviors, and variation in BMI.
For pediatric interpretation, BMI values were evaluated according to age- and sex-specific WHO Growth References for children and adolescents aged 5–19 years [4,5]. However, BMI-for-age categories were not used as the primary outcome measure in the present analysis, as the objective was to examine factors associated with continuous variation in BMI rather than differences between weight-status categories.
2.4. Statistical Analysis
Statistical analyses were performed using IBM SPSS Statistics for Windows, version 27.0 (IBM Corp., Armonk, NY, USA). Continuous variables were summarized as mean ± standard deviation (SD) or median and interquartile range (IQR), as appropriate, while categorical variables were presented as frequencies and percentages.
The distribution of continuous variables was assessed using the Shapiro–Wilk and Kolmogorov–Smirnov tests, together with graphical inspection of the data distribution. Differences in BMI across two-group categorical variables were assessed using the Mann–Whitney U test, while differences across more than two groups were assessed using the Kruskal–Wallis test.
Associations between BMI and food consumption frequency were assessed using Spearman’s rank correlation coefficient (ρ), with correlation coefficients and corresponding p-values reported. Food frequency categories were treated as ordinal variables reflecting increasing consumption frequency.
Multivariable linear regression analysis was performed to identify factors independently associated with BMI. Variables considered clinically relevant and/or showing evidence of association in preliminary analyses were considered for inclusion in the multivariable model. Regression coefficients (B), standard errors (SE), standardized coefficients (β), 95% confidence intervals (CI), t-values, and p-values were reported.
Model assumptions were assessed, including multicollinearity using tolerance and variance inflation factor (VIF) values. A VIF value <5 was considered indicative of no relevant multicollinearity. Statistical significance was defined as a two-sided p-value <0.05.
2.5. Ethical Considerations
The study was conducted in accordance with the ethical principles for research involving human participants and the Declaration of Helsinki. The study protocol and research instrument were reviewed and approved by the Ethics Council for Third-Cycle Students/Doctoral Studies Program (approval date: September 17, 2025; Protocol No. 2002). Written informed consent was obtained from parents or legal guardians for children, and informed assent was obtained from adolescents prior to participation. All collected data were anonymized and treated confidentially.
3. Results
3.1. Characteristics of the Study Population
A total of 1,200 children and adolescents aged 6–17 years participated in the study, with 600 participants recruited in each survey year (2025 and 2026). Overall, 56.9% of participants were female, and the largest age group was 14–17 years (40.1%). Mean BMI differed significantly by sex and age group, with higher BMI values observed among males and older participants. BMI also differed significantly according to maternal education and perceived family economic status. No significant differences in BMI were observed according to residential area or paternal education (Table 1).
3.2. Dietary Behaviors, Eating Patterns, and Lifestyle Factors Associated with BMI
Dietary behaviors, eating patterns, and lifestyle characteristics varied across the study population. Most participants reported good (60.7%) or very good (36.1%) self-perceived eating habits, and the majority reported receiving information about healthy eating (89.1%). Among participants who reported receiving nutrition information, multiple sources (41.3%) and family (33.3%) were the most frequently reported sources.
Regarding meal patterns, daily lunch (85.1%) and dinner consumption (78.0%) were commonly reported, whereas daily breakfast consumption was reported by 47.2% of participants. Breakfast was the meal most frequently reported as skipped (48.7%). Nearly half of participants reported always bringing food to school (43.2%), while 27.3% reported never bringing food from home.
The most commonly reported time for the first meal was 09:00–11:00 (48.7%), followed by 06:00–08:00 (39.8%). The majority of participants reported having their last meal between 20:00 and 22:00 (65.0%).
Regarding lifestyle behaviors, approximately half of participants participated in organized sports (50.7%), while 49.3% reported no organized sports participation. Active play outside school for approximately 1 hour/day was the most common category (29.3%). Daily screen time of approximately 2 hours was reported by 33.5% of participants, while 28.3% reported ≥3 hours/day. Eating while watching television was reported by 61.2% of participants, and 61.6% reported sleeping less than 9 hours/day.
BMI differed significantly across categories of self-perceived eating habits, healthy eating information, nutrition information source, meal consumption, meal skipping, bringing food to school, first and last meal timing, organized sports participation and duration, active play outside school, screen time, eating while watching television, and sleep duration (all p < 0.05). In contrast, school-based physical activity and transport to and from school were not significantly associated with BMI (p = 0.078 and p = 0.345, respectively) (Table 2).
3.3. Frequency of Food Consumption
The frequency of consumption of major food groups and beverages among study participants is presented in Table 3. Fruits were the most frequently consumed food group, with 54.2% of participants reporting daily or more frequent consumption. Dairy products (36.0%) and eggs (30.6%) also showed relatively frequent daily consumption, whereas daily vegetable consumption was reported by 28.2% of participants. In contrast, fish and whole grains were consumed less frequently, with 69.1% and 33.0% of participants, respectively, reporting consumption less than once per week.
Among discretionary foods and beverages, daily or more frequent consumption was reported for salty snacks (19.1%), fresh fruit juices (20.1%), sweets (16.3%), coca-cola (15.5%), and packaged fruit juices (16.3%). Fast food was consumed daily or more frequently by 6.8% of participants, while energy drinks were less frequently consumed, with 76.0% reporting consumption never or less than once per week.
3.4. Association Between Food Consumption Frequency and BMI
Spearman’s rank correlation analysis revealed several weak but statistically significant associations between BMI and the frequency of consumption of specific food groups and beverages. Higher consumption frequencies of fruits, vegetables, and eggs were associated with lower BMI values, whereas higher consumption frequencies of French fries, processed meat, packaged fruit juices, Coca-Cola, energy drinks, and fast food were associated with higher BMI values.
Among the positive associations, the strongest correlation was observed for energy drink consumption (ρ = 0.197, p < 0.001), followed by fast food (ρ = 0.147, p < 0.001) and Coca - Cola (ρ = 0.131, p < 0.001). Packaged fruit juices (ρ = 0.086, p = 0.003), French fries (ρ = 0.069, p = 0.017), and processed meat (ρ = 0.061, p = 0.038) also showed weak positive correlations with BMI. Conversely, fruit consumption showed the strongest inverse association with BMI (ρ = −0.109, p < 0.001), followed by egg consumption (ρ = −0.105, p < 0.001) and vegetable consumption (ρ = −0.059, p = 0.040). Overall, all statistically significant associations were weak (|ρ| < 0.20). The strength and direction of these correlations are presented in Figure 1.
3.5. Multivariable Linear Regression Analysis of Factors Associated with BMI
Multiple linear regression analysis identified several factors independently associated with BMI (Table 4). The final model explained 18.4% of the variability in BMI (R2 = 0.184; adjusted R2 = 0.178) and was statistically significant (F = 29.14, p < 0.001). Each additional year of age was associated with a 0.393 kg/m2 higher BMI (B = 0.393, 95% CI: 0.329–0.457, p < 0.001), while males had a 1.192 kg/m2 higher BMI than females (B = 1.192, 95% CI: 0.787–1.597, p < 0.001). Higher fruit consumption was independently associated with lower BMI (B = −0.313, 95% CI: −0.539 to −0.087, p = 0.007). Each one-category increase in self-perceived eating habits was associated with a 0.510 kg/m2 lower BMI (B = −0.510, 95% CI: −0.885 to −0.135, p = 0.008). Each one-category increase in weekly organized sports duration was associated with a 0.192 kg/m2 higher BMI (B = 0.192, 95% CI: 0.066–0.317, p = 0.003). Energy drink consumption, eating while watching TV, sleep duration, and active play outside school were not independently associated with BMI (all p > 0.05). No evidence of relevant multicollinearity was observed, with all VIF values below 5.
4. Discussion
4.1. Main Findings and Contribution of the Study
This repeated cross-sectional study investigated the associations between dietary behaviors, food consumption patterns, lifestyle factors, and body mass index (BMI) among 1,200 school-aged children and adolescents aged 6–17 years in Tirana, Albania. The findings demonstrate that BMI was associated with a combination of demographic, dietary, and lifestyle factors. Older age and male gender were independently associated with higher BMI, whereas higher fruit consumption and better self-perceived eating habits were independently associated with lower BMI. Weekly organized sports duration was also positively associated with BMI after adjustment for the other variables included in the model.
This study provides evidence from Albania, where population-based data on behavioral factors associated with BMI among school-aged children and adolescents remain limited. Childhood overweight and obesity are major public health challenges globally and across Europe. Recent findings from the WHO European Childhood Obesity Surveillance Initiative (COSI) indicate a substantial burden of overweight and obesity among European children and adolescents. The present findings add evidence from Southeastern Europe and support the importance of prevention strategies addressing modifiable dietary and lifestyle behaviors [1,2,30].
BMI-for-age based on the WHO growth reference is an established approach for assessing weight status among children and adolescents [3,4,5]. In the present study, BMI was analyzed as a continuous outcome, allowing the assessment of gradual differences in BMI in relation to demographic, dietary, and lifestyle factors. This approach completes categorical assessments of overweight and obesity and may help identify behavioral patterns associated with variation in BMI across childhood and adolescence.
Childhood obesity is a multifactorial condition influenced by the interaction of dietary behaviors, physical activity, sedentary behaviors, sleep, family characteristics, and broader environmental factors [7,20,21]. Consistent with this multifactorial perspective, the present study identified several independent correlates of BMI, rather than a single behavioral determinant.
4.2. Demographic Factors Associated with BMI
BMI increased significantly with age, with adolescents aged 14–17 years having higher BMI values than younger participants. Age remained the strongest independent predictor of BMI in the multivariable regression model, with each additional year of age associated with a 0.393 kg/m2 increase in BMI (B = 0.393; 95% CI: 0.329–0.457; p < 0.001). This finding is consistent with previous evidence showing that BMI generally increases throughout childhood and adolescence as a consequence of growth, pubertal maturation, and changes in body composition. Adolescence represents a particularly important period for obesity prevention, as increasing autonomy in food choices and the establishment of sedentary behaviors may influence long-term health trajectories [2,3]. In unadjusted analyses, BMI also differed significantly according to gender, maternal education, and family economic status, whereas no significant differences were observed according to residential area or paternal education (Supplementary Table S1).
Male participants had higher BMI values than females, and this association remained significant after adjustment for other variables in the regression model (B = 1.192; 95% CI: 0.787–1.597; p < 0.001). Similar gender-related differences in BMI have been reported internationally, although their magnitude and direction may vary according to age, cultural context, and lifestyle behaviors. Differences in body composition, dietary patterns, and physical activity may partly explain these observed differences [2,13].
These findings highlight the importance of considering age and gender when designing and implementing childhood obesity prevention strategies.
4.3. Dietary Behaviors and BMI
Dietary behaviors were significantly associated with BMI in this study. Participants who perceived their eating habits as healthier had lower BMI values, indicating that self-perceptions of eating habits may reflect healthier patterns of food-related behavior. Dietary behaviors are influenced by multiple factors, including knowledge about healthy eating, family practices, food availability, and social and environmental influences [6,7].
In unadjusted analyses, more frequent breakfast consumption was associated with lower BMI values (Supplementary Table S2). This finding is consistent with previous systematic reviews showing that regular breakfast consumption is associated with healthier weight in children and adolescents [8]. Possible explanations are that breakfast consumption is associated with more structured daily eating patterns, improved appetite, and reduced reliance on fast foods during the day. However, breakfast consumption may also represent an indicator of a healthier lifestyle in general, rather than a direct determinant of BMI.
Similarly, meal skipping was associated with higher BMI values in unadjusted analyses (Supplementary Table S2). Given the cross-sectional nature of the study, these associations should not be interpreted causally. Rather, skipping meals may reflect broader unhealthy dietary and lifestyle patterns, such as less structured eating routines, greater reliance on convenience foods, or changes in family eating practices.
Bringing food from home was also significantly associated with BMI in unadjusted analyses, with lower BMI values observed among participants who always brought food to school (Supplementary Table S2). Home-prepared foods may provide greater control over food quality, ingredients, and portion sizes. These findings support the importance of family- and school-based strategies for promoting healthier eating behaviors and preventing excess weight gain [22,23].
Fruit consumption showed a consistent inverse association with BMI (ρ = −0.109; p < 0.001) and remained independently associated with lower BMI in the multivariable regression model (B = −0.313; 95% CI: −0.539 to −0.087; p = 0.007). Additional unadjusted correlations between BMI and individual food groups and dietary items are presented in Supplementary Table S3. This finding is consistent with previous evidence showing that greater consumption of fruits and vegetables is associated with healthier body weight among children and adolescents [10,11]. Although the magnitude of the association was modest, its persistence after adjustment indicated that fruit consumption may represent an independent dietary correlate of BMI in this population.
Conversely, higher consumption of sugar-sweetened beverages, fast food, and other energy-dense foods was positively associated with BMI. These findings are broadly consistent with previous evidence linking frequent consumption of sugar-sweetened beverages and energy-dense, nutrient-poor foods with less favorable weight-related outcomes among children and adolescents [9,12].
The relatively modest correlations observed between individual food groups and BMI indicate that BMI is unlikely to be explained by isolated dietary components alone. Rather, overall dietary patterns, together with demographic, behavioral, and environmental factors, may play a more important role in determining weight status. Accordingly, obesity prevention strategies should emphasize overall dietary quality, including greater consumption of nutrient-dense foods and limiting sugar-sweetened beverages, fast food, and highly processed foods [7,10,12].
4.4. Lifestyle Factors Associated with BMI
Lifestyle behaviors were significantly associated with BMI, particularly screen exposure, physical activity, and sleep duration. These findings support the view that weight status in childhood and adolescence is shaped by the interplay of dietary intake, physical activity, sedentary behavior, sleep, and the broader behavioral environment.
Screen time was among the lifestyle factors most strongly associated with BMI. Participants reporting ≥3 hours/day of recreational screen exposure had significantly higher BMI-related ranks (H = 58.749; p < 0.001). Other lifestyle factors, including eating while watching television and sleep duration, were also significantly associated with BMI in unadjusted analyses (Supplementary Table S4). This finding is consistent with previous systematic reviews reporting an association between higher screen time and higher BMI among children and adolescents [15,18].
Several mechanisms may contribute to this association, including reduced opportunities for physical activity, increased sedentary time, exposure to unhealthy food marketing, and greater consumption of energy-dense snack foods during screen-based activities. Eating while watching television was also associated with higher BMI values, further indicating that screen-based eating behaviors may be associated with less favorable weight-related outcomes.
Participation in organized sports showed a positive association with BMI, which may initially seem unexpected but may be related to differences in body composition, including greater muscle mass. In unadjusted analyses, organized sports participation, weekly organized sports duration, and active play outside school were significantly associated with BMI, whereas school-based physical activity and transport to/from school were not (Supplementary Table S4). One possible explanation for the positive association between organized sports participation and BMI is that children and adolescents with higher BMI may be more likely to participate in organized sports as part of efforts to manage their weight [31]. In contrast, active play outside school was associated with lower BMI values, consistent with evidence supporting regular physical activity and reduced sedentary behavior as important components of healthy weight management in children and adolescents [14,17].
Insufficient sleep duration was also associated with higher BMI values. This finding is consistent with previous systematic reviews showing an association between insufficient sleep and higher BMI and obesity-related outcomes in children and adolescents. Proposed mechanisms include changes in appetite regulation, dietary preferences, and regular physical activity [16,18].
4.5. Interpretation Within Behavioral Theories
The findings can be interpreted within complementary behavioral frameworks that provide a broader understanding of the factors associated with BMI among children and adolescents.
According to Social Cognitive Theory (SCT), health behaviors arise from the reciprocal interactions between personal factors, behavior, social, and physical environments. From this perspective, the observed associations between perceived dietary habits, sources of nutrition information, and BMI may reflect the potential role of cognitive and social influences in shaping dietary behaviors. Family members can influence food availability, mealtime routines, dietary preferences, and attitudes toward healthy eating, while the broader social environment can reinforce or constrain these behaviors [23,32].
The Theory of Planned Behavior (TPB) provides an additional framework for understanding health-related behaviors by emphasizing the roles of attitudes, subjective norms, behavioral goals, and perceived behavioral control. Although these constructs were not directly measured in the current study, variables such as perceived diet quality and food brought from home may reflect aspects of individual attitudes, social influences, and environmental opportunities that are related to dietary behavior. Therefore, the observed associations can be considered consistent with this theory, but do not directly demonstrate, the pathways proposed by the TPB [31,33].
The Ecological Model further emphasizes that childhood obesity is influenced by factors operating across multiple levels, including individual, interpersonal, organizational, and broader environmental contexts. The findings of the present study reflect several of these levels, including individual dietary and lifestyle behaviors, family-related influences, school food environments, and exposure to digital and sedentary environments [24,25].
Taken together, these theories indicate that preventing childhood obesity must extend beyond nutrition education at the individual level and address the multiple contexts in which children and adolescents make health choices. Therefore, effective strategies for promoting healthy eating should combine family engagement, supportive school environments, opportunities for regular physical activity, adequate sleep, and approaches aimed at reducing prolonged sedentary and screen-based behaviors.
4.6. Multivariable Regression Findings
The multivariable regression analysis showed that BMI was independently associated with several demographic, dietary, and behavioral factors. The final model explained 18.4% of the variability in BMI (R2 = 0.184; adjusted R2 = 0.178), indicating that the variables included in the model accounted for a meaningful, although limited, proportion of differences in BMI. The remaining variability may reflect other factors that were not measured in the present study, including genetic, developmental, psychological, socioeconomic, and environmental influences [19,20,21,22].
Age and gender were the strongest independent predictors of BMI in the final model. The positive association with age is consistent with the progressive changes in body size and composition that occur during childhood and adolescence, while the higher BMI observed among males may partly reflect sex-related differences in growth and body composition.
Fruit consumption remained independently associated with lower BMI after adjustment for other variables (B = −0.313; 95% CI: −0.539 to −0.087; p = 0.007), supporting the potential importance of healthier dietary patterns in relation to weight status. This association was modest but remained statistically significant after accounting for demographic and behavioral factors [10,11].
The positive association between participation in organized sports and BMI should be interpreted with caution. This finding may reflect differences in age and developmental stage, reverse causality, or differences in body composition and muscle mass among physically active participants.
Several lifestyle variables, including eating while watching television, sleep duration, and active play outside of school, were not independently associated with BMI after adjustment. The loss of statistical significance for some variables may reflect the interconnected nature of dietary and lifestyle behaviors, as well as shared variance among predictors. These findings highlight the importance of simultaneously considering multiple behavioral and demographic factors when examining BMI in children and adolescents.
4.7. Strengths and Limitations
This study has several strengths, including the relatively large sample size of 1,200 participants, the inclusion of children and adolescents across a broad age range, and the repeated cross-sectional design. The study also provides valuable evidence on dietary and lifestyle factors associated with BMI in an understudied population in Albania.
Several limitations should be considered. First, the cross-sectional design prevents the establishment of causal relationships between dietary behaviors, lifestyle factors, and BMI. Second, several variables, including dietary habits, food consumption frequency, physical activity, screen time, and sleep duration, were based on self-reported information and may therefore be subject to recall and social desirability bias. In addition, weight and height were parent-reported for children and self-reported by adolescents, which may have introduced measurement error and potential reporting bias. Third, important determinants of childhood obesity, such as parental BMI, genetic predisposition, household food availability, psychological factors, and detailed dietary intake, were not assessed.
Furthermore, BMI was analyzed as an absolute measure (kg/m2) rather than using age- and sex-standardized BMI-for-age measures. Although BMI in kg/m2 provides a useful continuous indicator of body size and allowed us to examine gradual differences across the sample, BMI-for-age z-scores may provide complementary information when interpreting weight status across different developmental stages in children and adolescents. Future studies could therefore incorporate BMI-for-age z-scores, waist circumference, and, where feasible, body composition measures to provide a more comprehensive assessment of adiposity and growth-related differences.
4.8. Public Health Implications
The findings have significant implications for obesity prevention and health promotion among children in Albania. The observed links between dietary behaviors, lifestyle, and BMI support the need for integrated prevention strategies that address multiple modifiable factors during childhood and adolescence.
Schools provide an important setting for prevention through age-appropriate nutrition education, supportive food environments, and opportunities for regular physical activity. School-based strategies could promote healthy dietary choices, particularly greater consumption of fruits and vegetables and lower consumption of sugar-sweetened beverages and energy-dense foods. Schools could also provide regular opportunities for structured physical activity and incorporate age-appropriate education on healthy sleep and sedentary behavior.
Family involvement is also important because parents influence children's food choices, meal routines, physical activity, screen use, and sleep patterns. Parent-focused interventions could therefore provide practical guidance on healthy meal planning, limiting recreational screen time, encouraging active play, and establishing regular sleep routines.
At the policy and public health levels, efforts should focus on improving access to healthy foods, promoting healthier school food environments, reducing children's exposure to unhealthy food marketing, and strengthening school-based nutrition and physical activity programs. Coordinated school–family interventions may provide a practical framework for promoting healthy behaviors and supporting the early prevention of excess weight gain.
Given the urban setting of Tirana, the findings may inform locally tailored health-promotion strategies for children and adolescents in the city. Further studies in other regions of Albania are needed to determine whether similar associations and prevention priorities are observed in different geographic and population settings.
5. Conclusions
Among 1,200 children and adolescents aged 6–17 years, BMI was associated with demographic, dietary, and lifestyle factors. In the multivariable analysis, older age and male gender were independently associated with higher BMI, whereas greater fruit consumption and more favorable self-perceived eating habits were associated with lower BMI.
These findings support the need for integrated approaches to childhood obesity prevention that address dietary behaviors together with sedentary behavior, physical activity, and sleep. Schools and families represent important settings for promoting healthy behaviors and supporting healthy growth during childhood and adolescence.
Because of the cross-sectional study design, the observed associations cannot be interpreted as causal relationships. Longitudinal and intervention studies are needed to establish temporal relationships and to evaluate whether multidimensional prevention strategies can improve lifestyle behaviors and support healthier weight trajectories among children and adolescents in Albania.
Supplementary Materials
The following supporting information can be downloaded at the website of this paper posted on Preprints.org: Supplementary Table S1. Association between sociodemographic characteristics and BMI among study participants; Supplementary Table S2. Association between dietary habits and meal-related behaviors and BMI among study participants; Supplementary Table S3. Correlations between food consumption frequency and BMI among study participants; Supplementary Table S4. Association between lifestyle factors and BMI among study participants.
Author Contributions
Conceptualization, F.M.; methodology, L.K.; investigation, F.M.; data collection, F.M.; data curation, F.M.; statistical analysis, F.M.; validation, L.K.; interpretation of results, F.M. and L.K.; nutritional expertise and interpretation of dietary variables, A.H.; literature review, F.M. and A.H.; writing—original draft preparation, F.M.; writing—review and editing, L.K. and A.H.; supervision, L.K. All authors have read and agreed to the published version of the manuscript.
Funding
This research was funded by the National Agency for Scientific Research and Innovation (NASRI/AKKSHI) through the 2025 Doctoral Studies Funding Program.
Institutional Review Board Statement
The study was conducted in accordance with the Declaration of Helsinki and was approved by the Ethics Council for Third Cycle Students/Doctoral Program (Protocol No. 2002, approved on September 17, 2025).
Informed Consent Statement
Written informed consent was obtained from adolescents participating in the study. For children, written informed consent was obtained from their parents or legal guardians.
Data Availability Statement
The data presented in this study are available on request from the corresponding author due to ethical and data-protection restrictions.
Acknowledgments
The authors would like to thank all parents and pupils for their cooperation and participation in this study. We also sincerely thank the school principals and teachers for their valuable cooperation, support, and assistance in facilitating data collection.
Conflicts of Interest
The authors declare no conflict of interest. The funder had no role in the design of the study; in the collection, analyses, or interpretation of data; in the writing of the manuscript; or in the decision to publish the results.
Abbreviations
The following abbreviations are used in this manuscript:
| BMI | Body Mass Index |
| WHO | World Health Organization |
| COSI | Childhood Obesity Surveillance Initiative |
| HBSC | Health Behaviour in School-aged Children |
| INSTAT | Institute of Statistics |
| FFQ | Food Frequency Questionnaire |
| SPSS | Statistical Package for the Social Sciences |
| SCT | Social Cognitive Theory |
| TPB | Theory of Planned Behavior |
| SD | Standard Deviation |
| CI | Confidence Interval |
| B | Unstandardized Regression Coefficient |
| β | Standardized Regression Coefficient |
| ρ | Spearman's Rank Correlation Coefficient |
| R2 | Coefficient of Determination |
References
- World Health Organization. Obesity and Overweight; World Health Organization: Geneva, Switzerland, 2025; Available online: https://www.who.int/news-room/fact-sheets/detail/obesity-and-overweight.
- WHO Regional Office for Europe. European Childhood Obesity Surveillance Initiative (COSI): Sixth Round of Data Collection, 2022–2024; WHO Regional Office for Europe: Copenhagen, Denmark, 2025; Available online: https://www.who.int/europe/initiatives/childhood-obesity-surveillance-initiative.
- Hampl, S.E.; Hassink, S.G.; Skinner, A.C.; Armstrong, S.C.; Barlow, S.E.; Bolling, C.F.; Avila Edwards, K.C.; et al. Clinical Practice Guideline for the Evaluation and Treatment of Children and Adolescents with Obesity. Pediatrics 2023, 151, e2022060640. [Google Scholar] [CrossRef] [PubMed]
- World Health Organization. WHO Growth Reference for School-Aged Children and Adolescents (5–19 Years); World Health Organization: Geneva, Switzerland; Available online: https://www.who.int/tools/growth-reference-data-for-5to19-years.
- de Onis, M.; Onyango, A.W.; Borghi, E.; Siyam, A.; Nishida, C.; Siekmann, J. Development of a WHO Growth Reference for School-Aged Children and Adolescents. Bull. World Health Organ. 2007, 85, 660–667. [Google Scholar] [CrossRef] [PubMed]
- Maneschy, I.; Jimeno-Martínez, A.; Miguel-Berges, M.L.; Rupérez, A.I.; Ortega-Ramiréz, A.D.; Masip, G.; Moreno, L.A. Eating Behaviours and Dietary Intake in Children and Adolescents: A Systematic Review. Curr. Nutr. Rep. 2024, 13, 363–376. [Google Scholar] [CrossRef] [PubMed]
- Larruy-García, A.; Mahmood, L.; Miguel-Berges, M.L.; Masip, G.; Seral-Cortés, M.; De Miguel-Etayo, P.; Moreno, L.A. Diet Quality Scores, Obesity and Metabolic Syndrome in Children and Adolescents: A Systematic Review and Meta-Analysis. Curr. Obes. Rep. 2024, 13, 755–788. [Google Scholar] [CrossRef] [PubMed]
- Monzani, A.; Ricotti, R.; Caputo, M.; et al. A Systematic Review of the Association between Breakfast Consumption and Weight Status in Children and Adolescents. Nutrients 2021, 13, 1651. [Google Scholar]
- Schwingshackl, L.; Schwedhelm, C.; Hoffmann, G.; et al. Food Groups and Risk of Overweight, Obesity, and Weight Gain: A Systematic Review and Meta-Analysis of Cohort Studies. Adv. Nutr. 2021, 12, 1020–1035. [Google Scholar] [CrossRef] [PubMed]
- Głąbska, D.; Guzek, D.; Groele, B.; Gutkowska, K. Fruit and Vegetable Intake and Body Weight Status: A Systematic Review and Meta-Analysis of Observational Studies. Nutrients 2021, 13, 4355. [Google Scholar] [CrossRef] [PubMed]
- Lane, M.M.; Gamage, E.; Du, S.; et al. Ultra-Processed Food Exposure and Adverse Health Outcomes in Children and Adolescents: Umbrella Review. BMJ 2024, 384, e078354. [Google Scholar]
- Luger, M.; et al. Sugar-Sweetened Beverages and Weight Gain in Children and Adolescents: Systematic Review and Meta-Analysis. Nutrients 2021, 13, 1554. [Google Scholar] [CrossRef] [PubMed]
- Inchley, J.; Currie, D.; Cosma, A.; Samdal, O. (Eds.) Health Behaviour in School-Aged Children (HBSC) Study: International Report from the 2021/2022 Survey; WHO Regional Office for Europe: Copenhagen, Denmark, 2024. [Google Scholar]
- World Health Organization. WHO Guidelines on Physical Activity and Sedentary Behaviour; World Health Organization: Geneva, Switzerland, 2020; Available online: https://www.who.int/publications/i/item/9789240015128.
- Mougharbel, F.; Sampasa-Kanyinga, H.; Chaput, J.P.; et al. Screen Time and Body Mass Index among Children and Adolescents: A Systematic Review and Meta-Analysis. Front. Nutr. 2022, 9, 1040470. [Google Scholar]
- Porri, D.; Luppino, G.; Aversa, T.; Corica, D.; Valenzise, M.; Messina, M.F.; Pepe, G.; Morabito, L.A.; La Rosa, E.; Lugarà, C.; et al. Preventing and Treating Childhood Obesity by Sleeping Better: A Systematic Review. Front. Endocrinol. 2024, 15, 1426021. [Google Scholar] [CrossRef] [PubMed]
- Chaput, J.P.; Willumsen, J.; Bull, F.; et al. 2020 WHO Guidelines on Physical Activity and Sedentary Behaviour for Children and Adolescents Aged 5–17 Years: Summary and Implementation Considerations. Int. J. Behav. Nutr. Phys. Act. 2021, 18, 27. [Google Scholar]
- Miller, M.A.; Kruisbrink, M.; Wallace, J.; Ji, C.; Cappuccio, F.P. Sleep Duration and Incidence of Obesity in Infants, Children, and Adolescents: Systematic Review and Meta-Analysis. Sleep Med. 2021, 82, 100–109. [Google Scholar]
- Chung, A.; Backholer, K.; Wong, E.; et al. Trends in Socioeconomic Inequalities in Adolescent Overweight and Obesity: Evidence from Population-Based Studies. Int. J. Obes. 2021, 45, 1466–1475. [Google Scholar]
- Weihrauch-Blüher, S.; Wiegand, S. Risk Factors and Implications of Childhood Obesity. Curr. Obes. Rep. 2021, 10, 442–451. [Google Scholar]
- Brown, T.; Moore, T.H.M.; Hooper, L.; et al. Interventions for Preventing Obesity in Children. Cochrane Database Syst. Rev. 2021, 7, CD001871. [Google Scholar]
- Sleddens, E.F.C.; Kremers, S.P.J.; De Vries, N.K.; Thijs, C. Theoretical Approaches and Childhood Obesity Prevention: Application of Social Cognitive and Ecological Models. Int. J. Behav. Nutr. Phys. Act. 2021. [Google Scholar]
- Bandura, A. Social Foundations of Thought and Action: A Social Cognitive Theory; Prentice-Hall: Englewood Cliffs, NJ, USA, 1986. [Google Scholar]
- Story, M.; Kaphingst, K.M.; Robinson-O’Brien, R.; Glanz, K. Creating Healthy Food and Eating Environments: Policy and Environmental Approaches. Annu. Rev. Public Health 2008, 29, 253–272. [Google Scholar] [CrossRef] [PubMed]
- Bronfenbrenner, U. The Ecology of Human Development: Experiments by Nature and Design; Harvard University Press: Cambridge, MA, USA, 1979. [Google Scholar]
- Cochran, W.G. Sampling Techniques, 3rd ed.; John Wiley & Sons: New York, NY, USA, 1977. [Google Scholar]
- Institute of Statistics (INSTAT). Population of Albania; INSTAT: Tirana, Albania, 1 January 2025. [Google Scholar]
- Hyska, J.; Toçi, E.; Tomini, E. Assessment of Childhood Obesity: Impact of the COVID-19 Pandemic on the Daily Routine and Behaviours of School-Age Children in Albania. Institute of Public Health; Tirana, Albania, 2023. Available online: https://www.unicef.org/albania/reports/assessment-childhood-obesity.
- Thompson, F.E.; Subar, A.F. Dietary Assessment Methodology. In Nutrition in the Prevention and Treatment of Disease, 4th ed.; Coulston, A.M., Boushey, C.J., Ferruzzi, M.G., Delahanty, L.M., Eds.; Academic Press: London, UK, 2017; pp. 5–48. [Google Scholar]
- Breda, J.; McColl, K.; Buoncristiano, M.; Williams, J.; Abdrakhmanova, Z.; Abdurrahmonova, Z.; et al. Methodology and Implementation of the WHO European Childhood Obesity Surveillance Initiative (COSI). Obes. Rev. 2021, 22, e13215. [Google Scholar] [CrossRef] [PubMed]
- Ajzen, I. The Theory of Planned Behavior. Organ. Behav. Hum. Decis. Process. 1991, 50, 179–211. [Google Scholar] [CrossRef]
- Bandura, A. Health Promotion by Social Cognitive Means. Health Educ. Behav. 2004, 31, 143–164. [Google Scholar] [CrossRef] [PubMed]
- Ajzen, I. The Theory of Planned Behaviour: Reactions and Reflections. Psychol. Health 2011, 26, 1113–1127. [Google Scholar] [CrossRef] [PubMed]
Figure 1.
Spearman’s rank correlation coefficients between food consumption frequency and BMI. Note: Only statistically significant Spearman correlation coefficients (p < 0.05) are presented. Positive coefficients indicate higher BMI with increasing consumption frequency, whereas negative coefficients indicate lower BMI with increasing consumption frequency.
Figure 1.
Spearman’s rank correlation coefficients between food consumption frequency and BMI. Note: Only statistically significant Spearman correlation coefficients (p < 0.05) are presented. Positive coefficients indicate higher BMI with increasing consumption frequency, whereas negative coefficients indicate lower BMI with increasing consumption frequency.
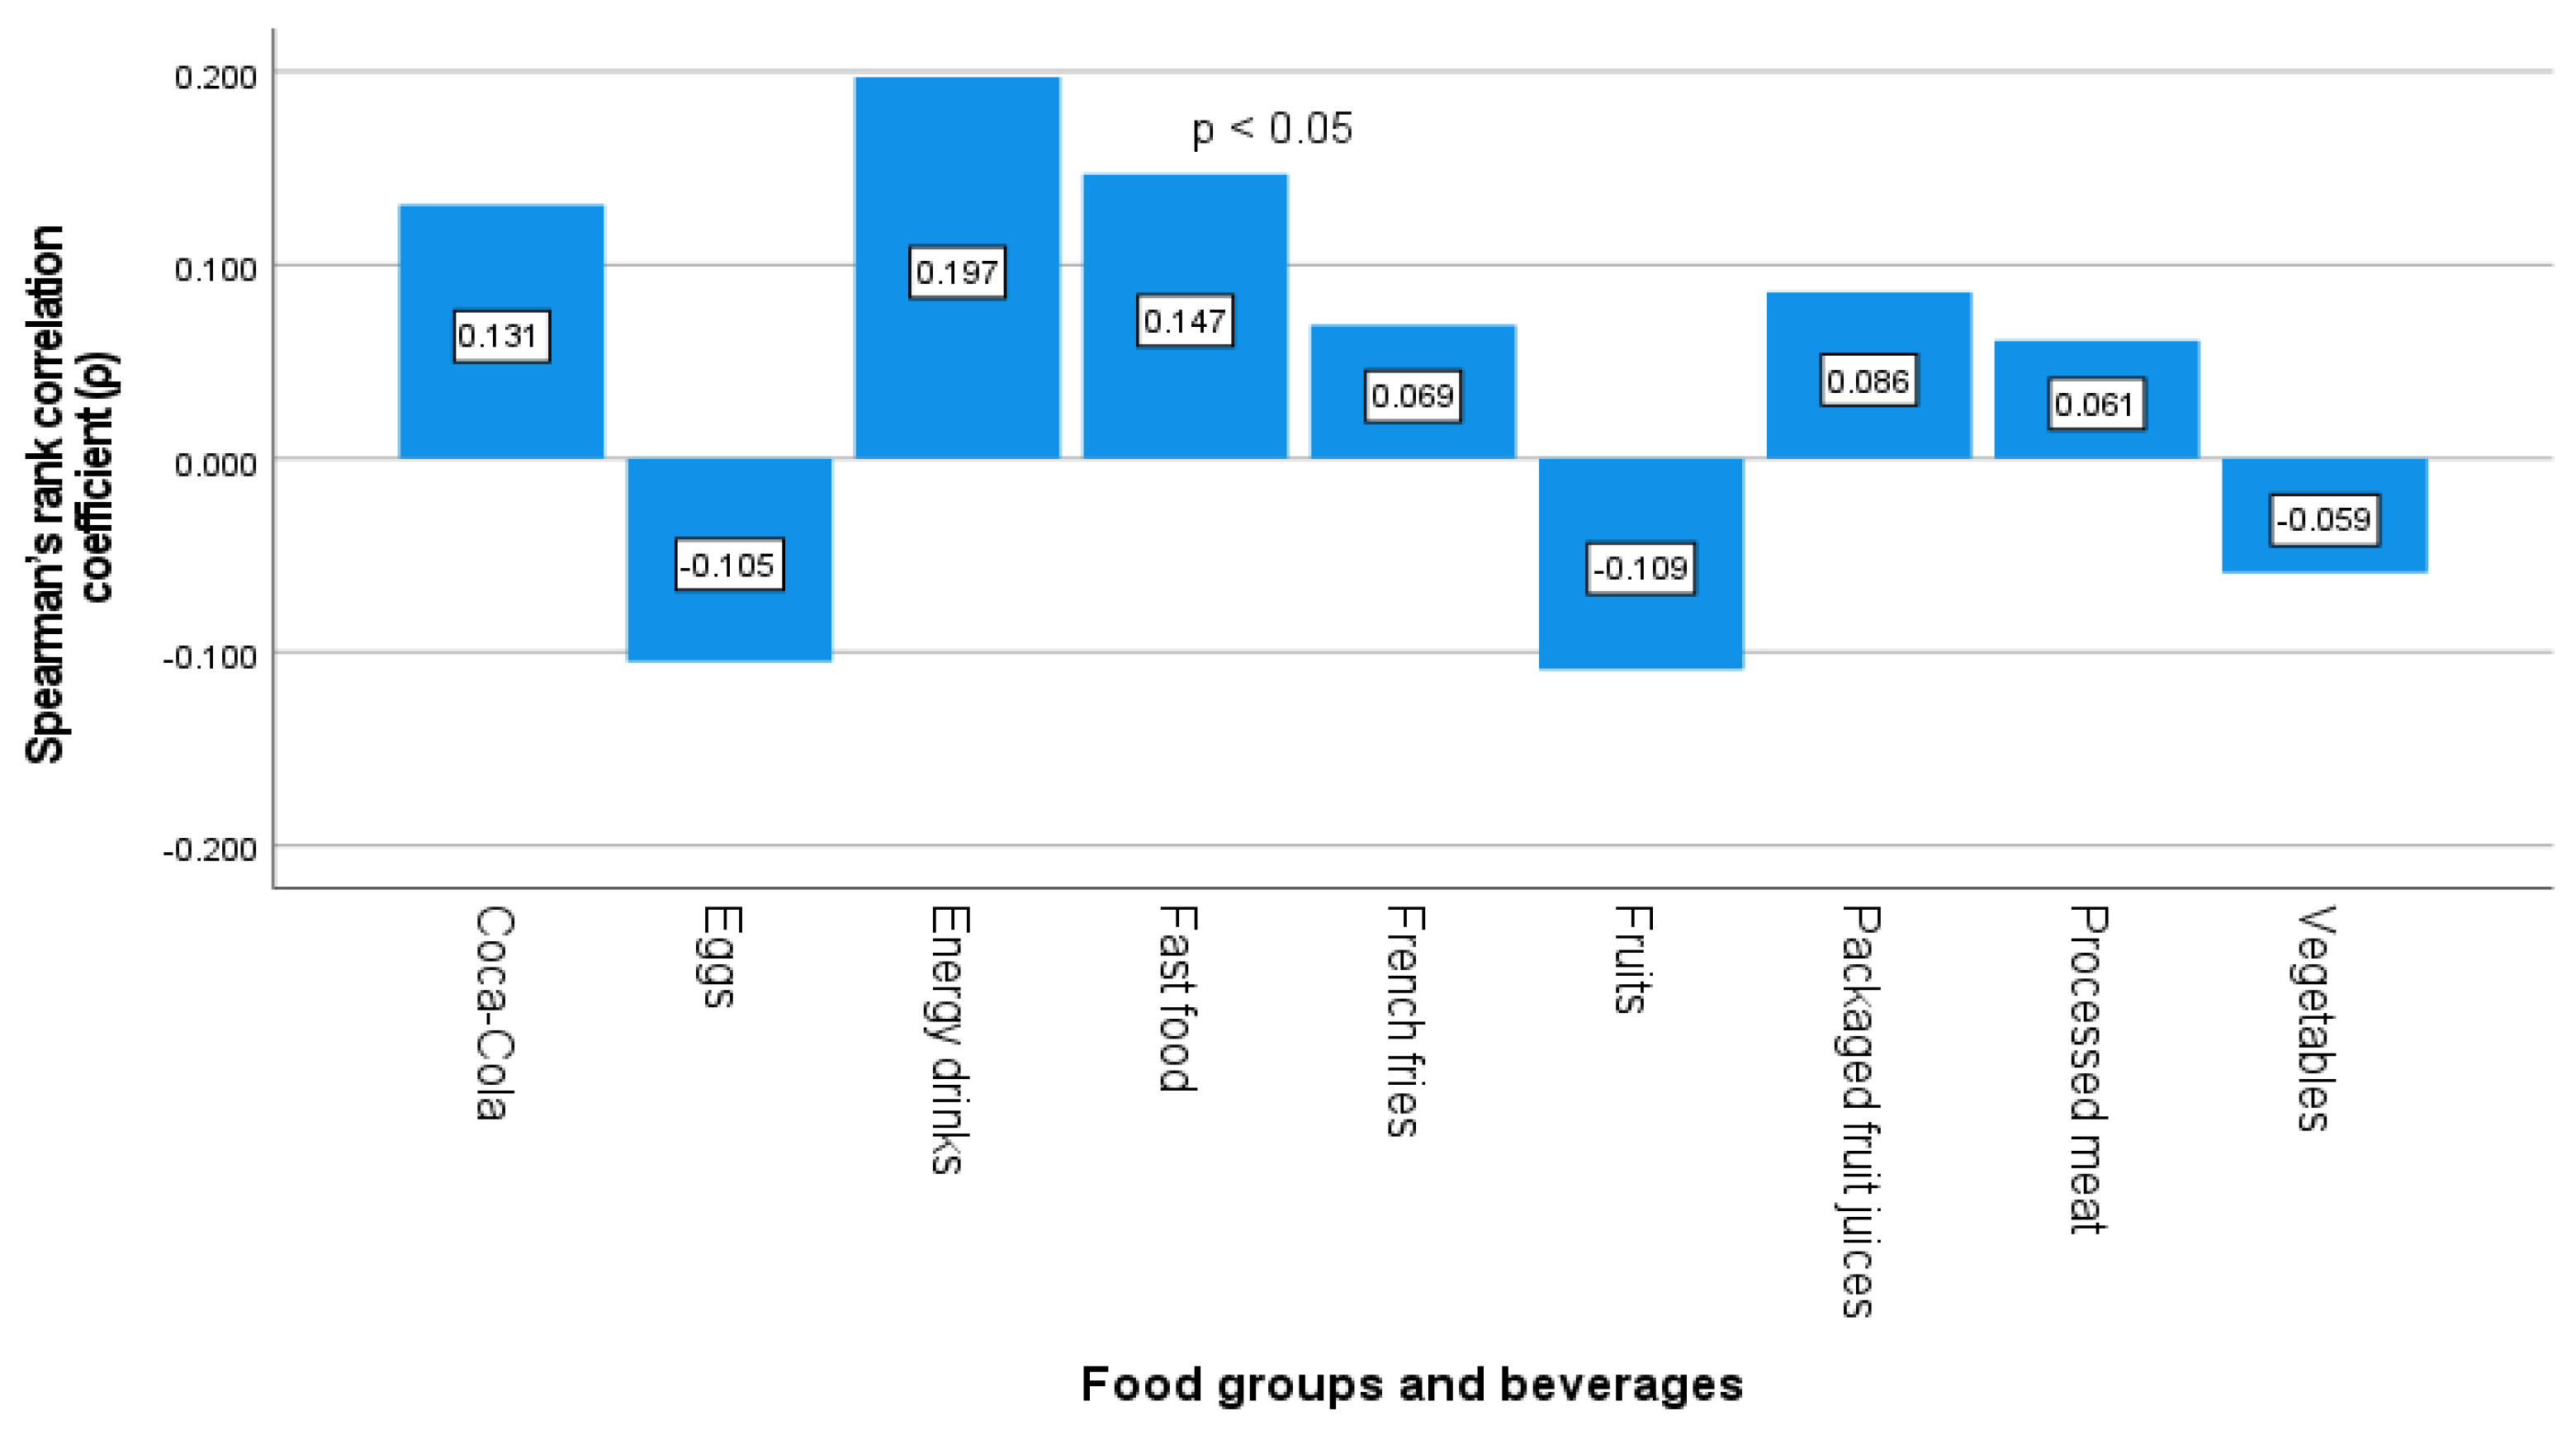

Table 1.
Sociodemographic characteristics of study participants.
| Variable | Category | N (%) | BMI (kg/m2), Mean ± SD | P-value |
|---|---|---|---|---|
| Gender | Female | 683 (56.9) | 19.52 ± 3.51 | 0.001 |
| Male | 517 (43.1) | 20.51 ± 3.92 | ||
| Age group | 6-9 years | 327 (27.3) | 18.12 ± 3.60 | <0.001 |
| 10-13 years | 392 (32.7) | 19.81 ± 3.61 | ||
| 14-17 years | 481 (40.1) | 21.31 ± 3.34 | ||
| Residential area | Urban | 705 (58.8) | 19.86 ± 3.55 | 0.942 |
| Peri-urban | 280 (23.3) | 19.95 ± 3.81 | ||
| Rural | 215 (17.9) | 20.23 ± 4.17 | ||
| Mother's education | Primary | 260 (21.7) | 20.33 ± 3.95 | 0.024 |
| Secondary | 471 (39.4) | 20.09 ± 3.65 | ||
| University | 465 (38.8) | 19.59 ± 3.66 | ||
| Father's education | Primary | 212 (17.8) | 20.12 ± 3.97 | 0.197 |
| Secondary | 560 (46.9) | 20.09 ± 3.74 | ||
| University | 421 (35.3) | 19.68 ± 3.59 | ||
| Family economic status | Low | 28 (2.5) | 21.04 ± 5.14 | 0.009 |
| Middle | 864 (76.5) | 19.78 ± 3.70 | ||
| High | 237 (21.0) | 20.36 ± 3.43 |
Note: Values are presented as n (%) or mean ± standard deviation (SD). Percentages are based on available responses; missing data were excluded from percentage calculations. Missing data were 4 for maternal education, 7 for paternal education, and 71 for family economic status. Differences in BMI between two groups were assessed using the Mann–Whitney U test and across more than two groups using the Kruskal–Wallis test. A two-sided p-value <0.05 was considered statistically significant.
Table 2.
Dietary and lifestyle characteristics according to BMI among study participants.
| Dietary habits and lifestyle behaviors | Category | N (%) | Mean BMI ± SD (kg/m2) | P-value |
|---|---|---|---|---|
| Self-perceived eating habits | Not good | 38 (3.2) | 22.80 ± 4.01 | < 0.001 |
| Good | 726 (60.7) | 20.05 ± 3.73 | ||
| Very good | 432 (36.1) | 19.52 ± 3.58 | ||
| Information about healthy eating | Yes | 1069 (89.1) | 19.86 ± 3.69 | 0.021 |
| No | 131 (10.9) | 20.66 ± 3.96 | ||
| Nutrition information source | Family | 359 (33.3) | 19.37 ± 3.77 | 0.001 |
| School | 37 (3.4) | 19.60 ± 3.04 | ||
| Peers | 9 (0.8) | 20.67 ± 2.84 | ||
| TV/Radio | 15 (1.4) | 20.66 ± 3.88 | ||
| Internet/Social networks | 204 (18.9) | 20.78 ± 3.79 | ||
| Multiple sources | 445 (41.3) | 19.22 ± 3.09 | ||
| Breakfast consumption | Never | 139 (11.6) | 21.49 ± 3.40 | < 0.001 |
| 1–3 times/week | 363 (30.3) | 20.22 ± 3.53 | ||
| 4–6 times/week | 132 (11.0) | 19.69 ± 3.70 | ||
| Every day | 566 (47.2) | 19.45 ± 3.82 | ||
| Lunch consumption | Never | 8 (0.7) | 22.02 ± 4.74 | < 0.001 |
| 1–3 times/week | 58 (4.8) | 20.94 ± 3.53 | ||
| 4–6 times/week | 113 (9.4) | 21.30 ± 3.56 | ||
| Every day | 1021 (85.1) | 19.73 ± 3.71 | ||
| Dinner consumption | Never | 15 (1.3) | 20.31 ± 4.05 | < 0.001 |
| 1–3 times/week | 89 (7.4) | 20.88 ± 3.52 | ||
| 4–6 times/week | 160 (13.3) | 21.24 ± 3.47 | ||
| Every day | 936 (78.0) | 19.63 ± 3.73 | ||
| Meal skipping | Breakfast | 584 (48.7) | 20.33 ± 3.57 | < 0.001 |
| Lunch | 42 (3.5) | 20.45 ± 4.18 | ||
| Dinner | 105 (8.8) | 20.43 ± 3.35 | ||
| None | 469 (39.1) | 19.33 ± 3.88 | ||
| Bringing food to school | Always | 518 (43.2) | 18.93 ± 3.77 | < 0.001 |
| Sometimes | 355 (29.6) | 20.19 ± 3.63 | ||
| Never | 327 (27.3) | 21.31 ± 3.27 | ||
| First meal time | 06:00–08:00 | 478 (39.8) | 19.65 ± 3.79 | < 0.001 |
| 09:00–11:00 | 584 (48.7) | 19.79 ± 3.63 | ||
| 12:00–14:00 | 138 (11.5) | 21.62 ± 3.48 | ||
| Last meal time | 14:00–16:00 | 27 (2.3) | 18.63 ± 3.24 | 0.018 |
| 17:00–19:00 | 381 (31.8) | 19.81 ± 3.76 | ||
| 20:00–22:00 | 780 (65.0) | 20.03 ± 3.72 | ||
| >22:00 | 12 (1.0) | 21.99 ± 2.68 | ||
| Participation in organized sports | Yes | 608 (50.7) | 20.26 ± 3.73 | 0.002 |
| No | 591 (49.3) | 19.63 ± 3.70 | ||
| Weekly organized sports duration | None | 559 (46.9) | 19.66 ± 3.72 | 0.023 |
| <1 hour/week | 72 (6.0) | 19.62 ± 2.97 | ||
| 1 hour/week | 146 (12.2) | 20.06 ± 3.57 | ||
| 2 hours/week | 188 (15.8) | 20.60 ± 3.83 | ||
| ≥3 hours/week | 228 (19.1) | 20.24 ± 3.91 | ||
| Active play outside school | None | 203 (17.0) | 21.05 ± 3.94 | < 0.001 |
| <1 hour/day | 271 (22.7) | 20.09 ± 3.56 | ||
| 1 hour/day | 350 (29.3) | 19.66 ± 3.55 | ||
| 2 hours/day | 272 (22.8) | 19.37 ± 3.82 | ||
| ≥3 hours/day | 98 (8.2) | 19.93 ± 3.71 | ||
| School-based physical activity | <45 min | 382 (32.0) | 19.87 ± 4.03 | 0.078 |
| 90 min | 371 (31.1) | 19.66 ± 3.65 | ||
| 135 min | 395 (33.1) | 20.26 ± 3.53 | ||
| >135 min | 45 (3.8) | 20.23 ± 3.40 | ||
| Transport to/from school | Active transport | 810 (67.5) | 19.88 ± 3.74 | 0.345 |
| Passive transport | 390 (32.5) | 20.10 ± 3.69 | ||
| Screen time/day | None/<1 hour | 81 (6.8) | 19.26 ± 3.50 | < 0.001 |
| ~1 hour | 376 (31.4) | 19.08 ± 3.57 | ||
| ~2 hours | 401 (33.5) | 19.96 ± 3.72 | ||
| ≥3 hours | 338 (28.3) | 21.07 ± 3.70 | ||
| Eating while watching TV | Yes | 733 (61.2) | 20.22 ± 3.85 | 0.001 |
| No | 464 (38.8) | 19.52 ± 3.50 | ||
| Sleep duration | <9 hours/day | 736 (61.6) | 20.15 ± 3.83 | 0.023 |
| ≥9 hours/day | 459 (38.4) | 19.63 ± 3.54 |
Note: Values are presented as n (%) or mean ± standard deviation (SD) for BMI values. Percentages were calculated based on valid responses only, and missing responses were excluded from percentage calculations. Missing data were present for some variables and were handled by available-case analysis. Sources of nutrition information were assessed only among participants who reported receiving information about healthy eating. Active transport included walking and cycling, whereas passive transport included electric scooter use, public transportation, and private vehicles. Differences in BMI across categories were assessed using the Mann–Whitney U test for two-group comparisons and the Kruskal–Wallis test for comparisons involving more than two groups. A p-value <0.05 was considered statistically significant.
Table 3.
Frequency of food consumption among study participants.
| Food groups and dietary items | Never or <1/week, n (%) | 1–3/week, n (%) | 4–6/week, n (%) | Daily or more, n (%) |
|---|---|---|---|---|
| Fruits | 62 (5.2) | 149 (12.4) | 339 (28.2) | 650 (54.2) |
| Vegetables | 178 (14.9) | 360 (30.1) | 322 (26.9) | 337 (28.2) |
| French fries | 640 (53.8) | 374 (31.4) | 105 (8.8) | 71 (6.0) |
| Dairy products | 191 (16.3) | 275 (23.4) | 286 (24.3) | 423 (36.0) |
| Whole grains | 393 (33.0) | 309 (25.9) | 213 (17.9) | 277 (23.2) |
| Refined grains | 232 (19.5) | 532 (44.7) | 279 (23.4) | 147 (12.4) |
| Fish | 824 (69.1) | 279 (23.4) | 67 (5.6) | 23 (1.9) |
| White meat | 447 (37.9) | 537 (45.5) | 149 (12.6) | 46 (3.9) |
| Red meat | 452 (38.4) | 506 (43.0) | 163 (13.8) | 56 (4.8) |
| Processed meat | 470 (40.5) | 375 (32.3) | 223 (19.2) | 92 (7.9) |
| Eggs | 205 (17.1) | 295 (24.7) | 330 (27.6) | 366 (30.6) |
| Sweets | 422 (35.6) | 371 (31.3) | 200 (16.8) | 194 (16.3) |
| Salty snacks | 442 (37.8) | 286 (24.5) | 218 (18.6) | 223 (19.1) |
| Coca-Cola | 677 (57.2) | 204 (17.2) | 119 (10.1) | 184 (15.5) |
| Packaged fruit juices | 538 (45.3) | 283 (23.8) | 173 (14.6) | 193 (16.3) |
| Fresh fruit juices | 415 (35.0) | 307 (25.9) | 226 (19.1) | 238 (20.1) |
| Energy drinks | 907 (76.0) | 108 (9.1) | 68 (5.7) | 110 (9.2) |
| Fast food | 765 (64.0) | 250 (20.9) | 99 (8.3) | 81 (6.8) |
Note: Percentages were calculated based on valid responses for each food item. Missing responses were excluded from percentage calculations. Food frequency categories were coded ordinally from lowest to highest consumption frequency for statistical analyses. The number of missing responses ranged from 0 to 40 (0.0–3.3%) across food items.
Table 4.
Multiple linear regression analysis of factors associated with BMI.
| Variable | Unstandardized B (95% CI) | Std. Error | Standardized Coefficients β | t | P-value | VIF | Tolerance |
|---|---|---|---|---|---|---|---|
| (Constant) | 16.676 (14.920 to 18.431) | 0.895 | — | 18.633 | <0.001 | — | — |
| Age | 0.393 (0.329 to 0.457) | 0.033 | 0.359 | 12.027 | <0.001 | 1.267 | 0.790 |
| Male gender | 1.192 (0.787 to 1.597) | 0.206 | 0.158 | 5.780 | <0.001 | 1.062 | 0.941 |
| Fruit consumption | −0.313 (−0.539 to −0.087) | 0.115 | −0.074 | −2.721 | 0.007 | 1.058 | 0.945 |
| Energy drink consumption | −0.178 (−0.401 to 0.044) | 0.113 | −0.046 | −1.575 | 0.116 | 1.210 | 0.826 |
| Self-perceived eating habits | −0.510 (−0.885 to −0.135) | 0.191 | −0.073 | −2.666 | 0.008 | 1.067 | 0.937 |
| Weekly organized sports duration | 0.192 (0.066 to 0.317) | 0.064 | 0.083 | 3.003 | 0.003 | 1.100 | 0.909 |
| Eating while watching TV | −0.373 (−0.785 to 0.038) | 0.210 | −0.049 | −1.779 | 0.075 | 1.067 | 0.938 |
| Sleep duration | −0.243 (−0.647 to 0.160) | 0.206 | −0.032 | −1.184 | 0.237 | 1.022 | 0.979 |
| Active play outside school | −0.115 (−0.298 to 0.068) | 0.093 | −0.037 | −1.231 | 0.219 | 1.275 | 0.784 |
Note: B = unstandardized regression coefficient; CI = confidence interval; SE = standard error; β = standardized regression coefficient; VIF = variance inflation factor. Model statistics: R2 = 0.184; adjusted R2 = 0.178; F = 29.14; p < 0.001. Female sex was the reference category. Self-perceived eating habits were coded ordinally as 1 = poor, 2 = good, and 3 = very good. Weekly organized sports duration was coded ordinally as 1 = none, 2 = <1 hour/week, 3 = 1 hour/week, 4 = 2 hours/week, and 5 =≥3 hours/week. No evidence of relevant multicollinearity was observed (all VIF values < 5).
Disclaimer/Publisher’s Note: The statements, opinions and data contained in all publications are solely those of the individual author(s) and contributor(s) and not of MDPI and/or the editor(s). MDPI and/or the editor(s) disclaim responsibility for any injury to people or property resulting from any ideas, methods, instructions or products referred to in the content. |
© 2026 by the authors. Licensee MDPI, Basel, Switzerland. This article is an open access article distributed under the terms and conditions of the Creative Commons Attribution (CC BY) license.
Copyright: This open access article is published under a Creative Commons CC BY 4.0 license, which permit the free download, distribution, and reuse, provided that the author and preprint are cited in any reuse.