

Submitted:
01 September 2026
Posted:
02 September 2026
You are already at the latest version
Abstract
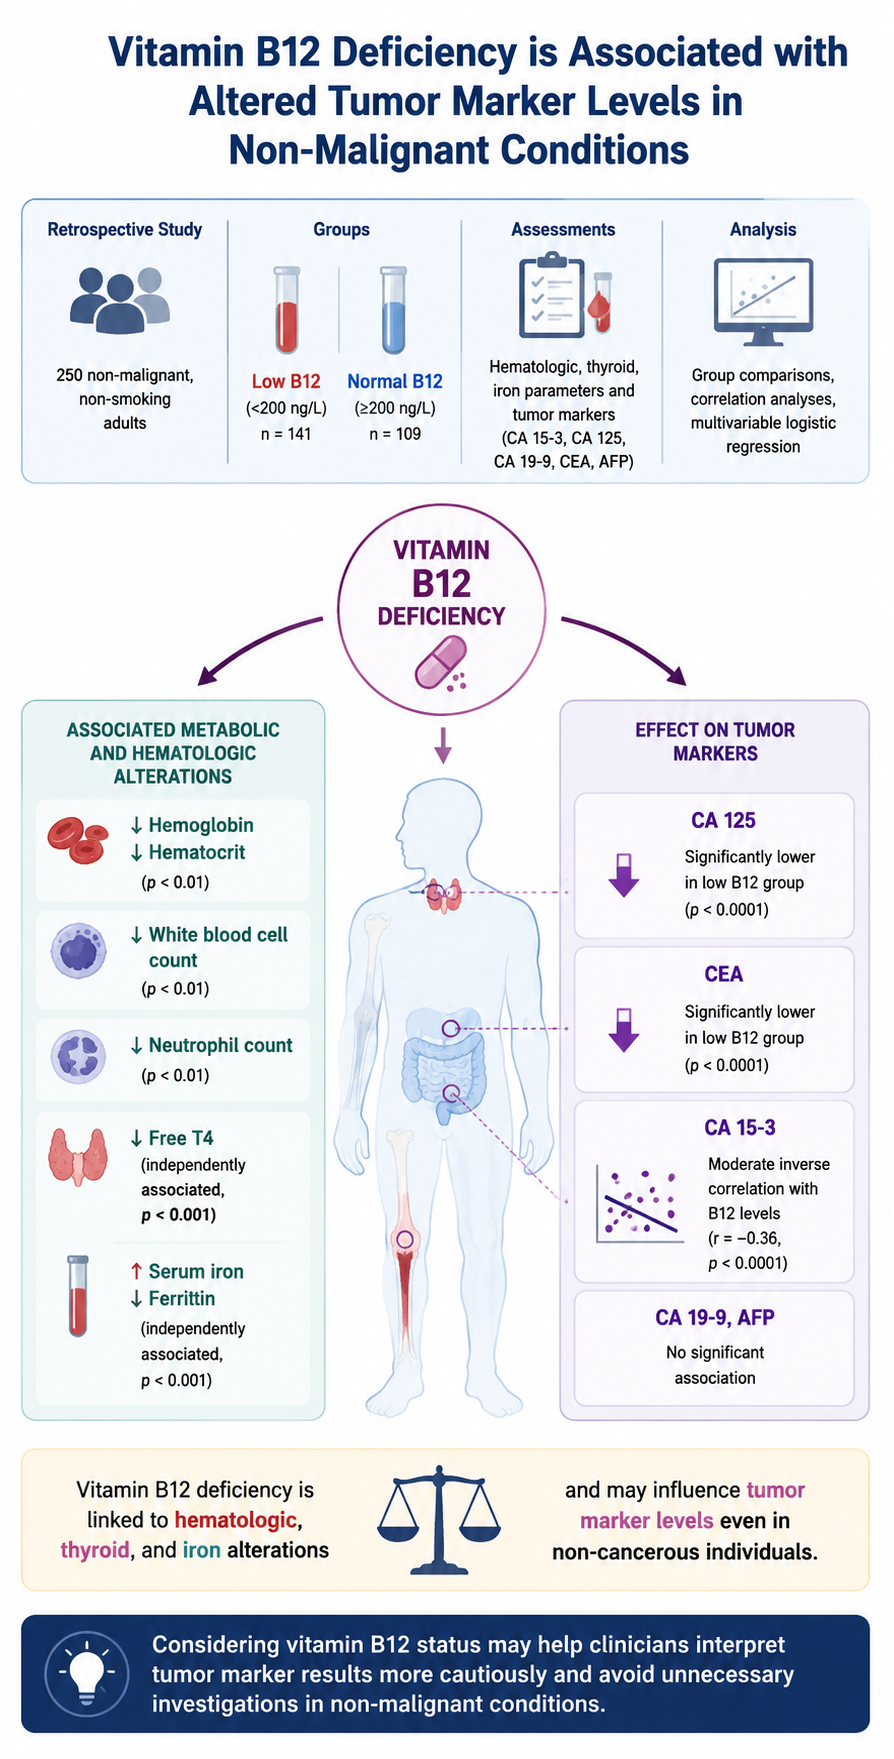
Background/Objectives: Vitamin B12 (cobalamin) plays an essential role in DNA synthesis, erythropoiesis, and cellular metabolism. Its deficiency is common in the general population and may influence various biochemical markers. Tumor markers such as CA 125, CA 15-3, CA 19-9, CEA, and AFP are widely used in oncology, yet their levels can also be affected by non-malignant conditions. This study aimed to investigate the relationship between serum vitamin B12 levels and tumor marker concentrations in non-cancerous patients. Methods: This retrospective study included 250 adult participants (141 with low serum vitamin B12 < 200 ng/L and 109 with normal B12 ≥ 200 ng/L) who presented to Etlik City Hospital between June 2022 and June 2025. All participants were non-smokers and had no history of chronic kidney disease or malignancy. Hematologic, biochemical, thyroid, and iron parameters were analyzed alongside tumor markers (CA 15-3, CA 125, CA 19-9, CEA, and AFP) using standard immunoassay techniques. Statistical analyses included group comparisons, correlation testing, and logistic regression to identify factors independently associated with low vitamin B12 levels. Results: Patients with low vitamin B12 levels exhibited significantly lower hemoglobin, hematocrit, white blood cell, and neutrophil counts (p < 0.01 for all). Free T4 and serum iron were independently associated with low B12 levels in multivariable analysis (p < 0.001). Among tumor markers, CA 125 and CEA were significantly reduced in patients with vitamin B12 deficiency (p < 0.0001), while CA 15-3 showed a moderate inverse correlation with B12 concentration (r = –0.36, p < 0.0001). Conclusions: Vitamin B12 deficiency is associated with alterations in hematologic, thyroid, and iron parameters and may be associated with serum tumor marker levels even in non-cancerous individuals. Recognizing the potential association between B12 status and tumor marker variability may contribute to more cautious interpretation of tumor marker results in clinical practice.
Keywords:
vitamin B12 deficiency
; tumor markers
; CA 15-3
; CA 125
; CEA
; non-malignant conditions
1. Introduction
Vitamin B12 (cobalamin) is an essential water-soluble vitamin that plays a critical role in DNA synthesis, erythropoiesis, and the maintenance of neurological and metabolic functions. Deficiency of vitamin B12 is relatively common in the general population, especially among the elderly, individuals with malnutrition, gastrointestinal disorders, or long-term medication use such as proton pump inhibitors or metformin [1]. Clinically, low vitamin B12 levels are associated with hematologic abnormalities, megaloblastic anemia, neuropathy, cognitive impairment, and in severe cases, irreversible neurological damage. Although vitamin B12 deficiency is often evaluated in the context of nutritional and hematologic disorders, emerging evidence suggests that it may also influence biochemical markers that are commonly interpreted in the assessment of malignancy [2].
Tumor markers such as carcinoembryonic antigen (CEA), cancer antigen 125 (CA 125), CA 15-3, CA 19-9, and alpha-fetoprotein (AFP) are widely used in clinical practice for the detection, prognosis, and monitoring of treatment response or disease recurrence in various cancers [3,4]. However, elevations in these markers are not specific to malignant conditions and may also occur in several benign disorders including liver disease, renal dysfunction, thyroid disorders, inflammatory conditions, and even vitamin deficiencies [5]. False-positive elevations of tumor markers in non-malignant states can lead to unnecessary anxiety, over-investigation, and misinterpretation of laboratory results [6]. Therefore, understanding non-cancerous factors that influence tumor marker concentrations is essential for accurate clinical interpretation.
Vitamin B12 metabolism is tightly linked to cellular proliferation and methylation pathways [5]. A deficiency in vitamin B12 can lead to impaired DNA synthesis, increased oxidative stress, and altered cell turnover, mechanisms that might indirectly affect the production or clearance of glycoproteins such as tumor markers [7]. Several observational studies have reported altered levels of CEA, CA 125, and CA 15-3 in patients with anemia or metabolic disturbances, yet data on their relationship with vitamin B12 levels remain limited and inconsistent [8]. Furthermore, the interplay between vitamin B12 deficiency and other biochemical parameters, such as thyroid hormones, iron metabolism, and renal function, may further modulate tumor marker expression in non-cancerous patients.
In routine clinical practice, clinicians frequently encounter elevated tumor markers in patients who do not have cancer. Determining whether such changes reflect early malignant transformation or benign metabolic derangements poses a diagnostic challenge. Given that vitamin B12 deficiency is both common and reversible, clarifying its association with tumor marker alterations could have important implications for diagnostic accuracy and clinical decision-making.
The present retrospective study aimed to investigate the relationship between serum vitamin B12 concentrations and commonly used tumor markers (CA 125, CA 15-3, CA 19-9, CEA, and AFP) in non-cancerous adult patients. Additionally, we sought to explore the associations between vitamin B12 levels and other hematologic, biochemical, and thyroid parameters to identify potential predictors of low vitamin B12 status. By distinguishing biochemical variations related to vitamin B12 deficiency from those associated with malignancy, this study intends to provide insights that may help prevent diagnostic confusion and improve the interpretation of tumor marker results in routine laboratory practice.
2. Methods
2.1. Study Approval
This study was approved by the Ankara Etlik City Hospital Scientific Research Evaluation and Ethics Committee on 17 November 2025 (Approval ID: AEŞH-BADEK1-2025-641). Written informed consent was obtained from all participants in accordance with the principles of the 1975 Declaration of Helsinki.
2.2. Study Design and Patient Population
After obtaining Ethics Committee approval, the medical records of patients evaluated between June 2022 and June 2025 were retrospectively reviewed. The study included 141 participants with low serum vitamin B12 levels and 109 participants with normal vitamin B12 levels, aged 18 to 97 years. Eligible participants were non-pregnant adults without chronic kidney disease or a prior cancer diagnosis. Participants were non-smokers.
2.3. Measurement of Laboratory Parameters
All laboratory results were retrospectively retrieved from the hospital’s electronic medical record system. Biochemical and immunochemical analyses were performed in the central biochemistry laboratory of Etlik City Hospital using the Roche cobas® 8000 Modular Analyzer Series (c702 clinical chemistry, e801 immunochemistry, and ISE modules; Roche Diagnostics GmbH, Mannheim, Germany). Assays were performed according to the manufacturer’s standard operating procedures.
Routine biochemical parameters, including blood urea nitrogen (BUN), creatinine, uric acid, liver enzymes (AST, ALT), albumin, total protein, and total and direct bilirubin, were measured on the c702 module using validated enzymatic and photometric methods. Iron metabolism indices (serum iron, total iron-binding capacity [TIBC], and ferritin) were evaluated using FerroZine®-based photometric assays (c702) and electrochemiluminescence immunoassay (ECLIA) for ferritin (e801).
Thyroid function tests (TSH and free T4) and vitamin B12 levels were analyzed on the e801 module using ECLIA methods.
Complete blood counts were performed with a Sysmex XN-9000 analyzer (Sysmex Corporation, Kobe, Japan) employing impedance/optical principles for erythrocyte and platelet counts, the SLS-Hb method for hemoglobin measurement, and fluorescence flow cytometry for leukocyte differentiation. Erythrocyte sedimentation rate (ESR) was measured using the Vision™ Automated ESR Analyzer (R&R Mechatronics, The Netherlands).
Tumor markers, including CA 15-3, CA 125, CA 19-9, CEA, and AFP, were quantified using electrochemiluminescence immunoassay on the Roche cobas e801 module. The reference intervals established by the manufacturer were as follows: CA 15-3: < 28.5 U/mL, CA 125: < 35 U/mL, CA 19-9: < 34 U/mL, CEA: < 3.8 µg/L, AFP: < 7 µg/L.
All assays were performed according to the manufacturer’s instructions, and internal quality controls were used daily to ensure analytical accuracy and precision.
2.4. Statistical Analysis
Categorical variables were expressed as absolute numbers (n) and percentages (%), while continuous variables were summarized as means with standard deviations. Clinical, demographic, and laboratory characteristics were compared using the chi-square or Fisher’s exact test for categorical data. The distribution of continuous variables was assessed with the Shapiro-Wilk test. Variables with a normal distribution (p > 0.05) were compared using the independent-samples t-test, whereas non-normally distributed variables (p < 0.05) were compared using the Mann–Whitney U test.
Correlations between continuous variables were assessed using either Pearson’s correlation coefficient (r) for normally distributed data or Spearman’s rank correlation coefficient (ρ) for non-normal or ordinal variables. Univariate and multivariate logistic regression analyses were conducted to determine factors independently associated with vitamin B12 deficiency. Vitamin B12 deficiency, defined as serum vitamin B12 < 200 ng/L, was used as the dependent variable. Variables with p < 0.10 in univariate analysis were entered into the multivariate model, and a two-sided p value < 0.05 was considered statistically significant.
3. Results
3.1. Patient Characteristics
A total of 250 non-cancerous adults were included in this study, comprising 141 participants with low serum vitamin B12 levels (< 200 ng/L) and 109 participants with normal B12 levels (≥ 200 ng/L). The mean age was 58.81 ± 18.66 years in the low B12 group and 61.37 ± 19.06 years in the normal B12 group, with no statistically significant difference between them (p = 0.318). The sex distribution was comparable, with 55 males (50.5%) in the normal group and 78 males (55.3%) in the low B12 group (p = 0.523) (Table 1).
3.2. Comparison of Hematologic and Biochemical Parameters
As summarized in Table 1, significant differences were observed between groups in several hematologic indices. Patients with low vitamin B12 levels had lower white blood cell count (7.24 ± 3.31 vs. 9.78 ± 5.08 × 10³/μL, p < 0.0001), hemoglobin (10.86 ± 2.89 vs. 12.11 ± 2.69 g/dL, p = 0.0007), and hematocrit (33.61 ± 8.76 vs. 37.19 ± 7.53%, p = 0.0025) compared to those with normal B12 levels. The neutrophil count was also significantly lower in the low B12 group (4.53 ± 2.58 vs. 6.93 ± 4.58 × 10³/μL, p < 0.0001).
Regarding biochemical markers, BUN (43.16 ± 33.49 vs. 63.25 ± 48.82 mg/dL, p = 0.0010) and creatinine (1.04 ± 0.93 vs. 1.33 ± 0.78 mg/dL, p < 0.0001) were both significantly lower in the low B12 group. FT4 was also markedly reduced in patients with B12 deficiency (1.06 ± 0.41 vs. 1.28 ± 0.30 ng/dL, p < 0.0001).
AST and ALT levels were significantly lower in patients with low vitamin B12 levels compared with those with normal vitamin B12 levels (AST: 27.60 ± 35.04 vs. 32.02 ± 35.09 U/L, p = 0.0309; ALT: 25.89 ± 42.74 vs. 28.90 ± 37.49 U/L, p = 0.0142).
In contrast, there were no statistically significant differences between groups in TSH, albumin, total protein, or bilirubin fractions (p > 0.05 for all). LDH levels were higher in the low B12 group (492 ± 832 vs. 253 ± 169 U/L), though this difference did not reach statistical significance (p = 0.120).
3.3. Iron Metabolism and Related Parameters
Significant differences were observed between the study groups in parameters related to iron metabolism (Table 1). Patients with low vitamin B12 levels had markedly higher serum iron concentrations compared with those with normal B12 levels (p < 0.0001). Similarly, serum ferritin levels were significantly lower in the B12-deficient group (184.4 ± 425.7 µg/L vs. 254.7 ± 454.4 µg/L, p = 0.0128). In contrast, there were no significant differences between groups in TIBC or erythrocyte sedimentation rate (ESR) (both p > 0.05).
3.4. Tumor Marker Levels in Relation to Vitamin B12 Status
Among tumor markers, CA 125 (13.85 ± 12.8 U/mL vs. 21.89 ± 18.07 U/mL, p < 0.0001) and CEA (2.17 ± 1.50 μg/L vs. 2.98 ± 1.58 μg/L, p < 0.0001) were significantly lower in the low B12 group compared to the normal B12 group. CA 15-3 showed a mild reduction that did not reach statistical significance (p = 0.0749). There were no significant differences in CA 19-9 or AFP levels between groups (p > 0.05).
3.5. Univariate Logistic Regression Analysis
Univariate logistic regression results are presented in Table 2. Factors significantly associated with low vitamin B12 levels included WBC (OR = 0.85; 95% CI 0.78–0.91; p < 0.0001), hemoglobin (OR = 0.85; 95% CI 0.77–0.93; p = 0.0006), hematocrit (OR = 0.94; 95% CI 0.91–0.97; p = 0.0008), neutrophil count (OR = 0.80; 95% CI 0.72–0.87; p < 0.0001), BUN (OR = 0.98; 95% CI 0.98–0.99; p = 0.0001), creatinine (OR = 0.67; 95% CI 0.47–0.91; p = 0.0095), LDH (OR = 1; 95% CI 1–1; p = 0.0010), uric acid (OR = 0.87; 95% CI 0.78–0.96; p = 0.0040), FT4 (OR = 0.10; 95% CI 0.03–0.27; p < 0.0001), iron (OR = 1.01; 95% CI 1.01–1.02; p < 0.0001), CA 125 (OR = 0.96; 95% CI 0.94–0.98; p < 0.0001), and CEA (OR = 0.71; 95% CI 0.59–0.84; p < 0.0001).
3.6. Multivariate Logistic Regression Analysis
After adjusting for potential confounding factors, FT4 and serum iron were independently associated with low B12 levels (Table 2). In multivariable analysis, decreased FT4 (OR = 0.02; 95% CI 0.00–0.24; p = 0.0008) and elevated iron levels (OR = 1.02; 95% CI 1.01–1.03; p < 0.0001) were independently associated with B12 deficiency. Other hematologic and biochemical parameters lost significance in the multivariate model.
3.7. Correlation Between Vitamin B12 and Tumor Markers
The relationships between vitamin B12 and tumor marker levels are illustrated in Figure 1 and Figure 2. In patients with low B12, a moderate negative correlation was observed between vitamin B12 and CA 15-3 (r = –0.36, p < 0.0001). A weak positive correlation was also observed between vitamin B12 and CEA (r = 0.23, p = 0.0057), whereas no significant correlations were found with CA 125, CA 19-9, or AFP (all p > 0.05).
Conversely, in the normal B12 group, vitamin B12 showed a weak positive correlation with CA 125 (r = 0.27, p = 0.0047), whereas other markers exhibited no significant associations.
4. Discussion
This retrospective study evaluated the relationship between serum vitamin B12 concentrations and tumor marker levels in a cohort of non-cancerous adult patients. The main findings were that (i) low vitamin B12 levels were associated with significant alterations in hematologic and biochemical parameters, (ii) serum FT4 and iron were independently associated with low vitamin B12 levels, and (iii) tumor markers, particularly CA 15-3, CA 125, and CEA, showed significant variations or correlations with B12 levels even in the absence of malignancy. To our knowledge, few previous studies have comprehensively examined the influence of vitamin B12 status on tumor markers in a non-cancer population [9,10].
Our results demonstrate that patients with vitamin B12 deficiency had lower hemoglobin, hematocrit, and white blood cell counts, consistent with the known hematologic effects of cobalamin deficiency on erythropoiesis and bone marrow activity [11]. Similar findings have been reported in several studies linking low B12 with macrocytosis and cytopenias due to impaired DNA synthesis in hematopoietic precursors [12].
The significant relationship observed between vitamin B12 and thyroid hormone (FT4) levels is also noteworthy. Thyroid dysfunction, particularly hypothyroidism, has been associated with altered cobalamin metabolism and reduced gastric acid secretion, which may impair intrinsic factor–mediated absorption [13]. Conversely, thyroid hormones influence hepatic metabolism and binding proteins that can indirectly affect B12 kinetics [14,15]. Our multivariate analysis showed that FT4 and serum iron were independently associated with low B12 levels, in agreement with studies showing an overlap between thyroid and B12 abnormalities in endocrine practice.
Iron metabolism also emerged as an important factor, with higher serum iron levels observed in patients with vitamin B12 deficiency. This may reflect ineffective erythropoiesis in cobalamin deficiency, in which impaired iron utilization and intramedullary destruction of erythroid precursors can result in increased circulating iron and may mask concomitant iron deficiency, complicating the interpretation of iron status and hematologic indices [16,17]. Furthermore, iron and cobalamin share common pathways in erythropoiesis, and disturbances in one can modulate compensatory responses in the other.
Regarding tumor markers, our study revealed that CA 125 and CEA levels were significantly lower in the low B12 group, while CA 15-3 showed a moderate inverse correlation with B12 concentrations. Although data on this specific relationship are limited, similar non-malignant fluctuations in tumor markers have been reported in metabolic and inflammatory states [18]. CA 125, a glycoprotein produced by mesothelial cells, is known to be influenced by inflammation, hormonal changes, and hepatic metabolism [19,20].
CEA and CA 15-3, which are commonly used as markers for colorectal and breast cancers, respectively, are also known to be modulated by benign conditions such as anemia, liver disease, lung disease and autoimmune disorders [21]. Symeonidis et al. showed that serum CA-15.3 levels are abnormally elevated in patients with untreated pernicious anemia, but they return to normal once the anemia is corrected [19]. This rise does not appear to originate from breast tissue; instead, it is likely linked to the release of the antigen from apoptotic megaloblastic erythroblasts in the bone marrow. In line with these observations, Obeid et al., in a systematic review, reported that apart from liver cancer, the relationship between plasma vitamin B12 concentrations and cancer was inconsistent across studies [22]. They found no clear temporal or dose-response relationship, and the available randomized trials did not establish causality between high plasma B12 and cancer. Moreover, low B12 levels were frequently observed among cancer patients themselves. These findings suggest that alterations in vitamin B12 may reflect secondary metabolic changes rather than a direct carcinogenic effect, reinforcing the notion that fluctuations in B12 and tumor-marker levels can occur independently of malignancy.
The present findings have several clinically relevant implications. First, they underscore that alterations in tumor marker levels do not necessarily indicate malignancy. Vitamin B12 deficiency, common in elderly and chronically ill patients, can subtly influence laboratory biomarkers, leading to misinterpretation of mildly abnormal results. Recognizing this association may contribute to a more cautious interpretation of isolated tumor marker changes and may help inform subsequent diagnostic evaluation.
Second, the independent associations of FT4 and serum iron with low B12 levels highlight the interconnected nature of metabolic and endocrine pathways. Assessment of thyroid function and iron status may therefore be considered in patients with unexplained B12 abnormalities.
Third, the observed associations between vitamin B12 status and certain tumor markers suggest that nutritional and metabolic factors should be considered when interpreting tumor marker variations. However, the clinical relevance of these findings, particularly in oncologic follow-up, requires confirmation in prospective studies.
The strengths of this study include a relatively large sample of non-cancerous patients, comprehensive biochemical profiling, and the use of both univariate and multivariate regression analyses to evaluate independent associations. The retrospective design, however, imposes inherent limitations, including potential residual confounding and the lack of control for dietary habits or medication use (such as metformin or proton pump inhibitors) that may be associated with vitamin B12 levels. Another limitation is that functional biomarkers of vitamin B12 deficiency, such as methylmalonic acid and homocysteine, were not measured in this patient population and therefore could not be included in the analysis. Consequently, vitamin B12 deficiency was defined solely on the basis of serum vitamin B12 concentrations, which may not fully reflect functional cobalamin status. Additionally, the cross-sectional nature of the data precludes causal inference, and tumor markers were not repeated longitudinally to assess temporal changes following B12 correction.
Future prospective studies are warranted to confirm these associations and to evaluate whether vitamin B12 replacement modifies tumor marker levels over time. Mechanistic studies exploring the biochemical pathways linking B12 metabolism to glycoprotein synthesis could also provide insight into how micronutrient deficiencies influence tumor marker expression [23].
5. Conclusions
This study demonstrates that vitamin B12 deficiency is associated with significant alterations in hematologic, thyroid, and iron parameters and may affect tumor marker levels in non-cancerous individuals. Among the tumor markers studied, CA 15-3 showed a moderate inverse relationship with B12 concentration, while CA 125 and CEA levels were significantly lower in patients with vitamin B12 deficiency. These findings suggest that vitamin B12 status may be considered among the metabolic factors potentially associated with tumor marker variability in non-cancerous individuals.
Author Contributions
Conceptualization: C.A., G.S., S.K., Y.S. and A.A.K.; Methodology: G.S., C.A. and S.K.; Software: S.K., Y.S. and C.A.; Validation: C.A., G.S. and S.K.; Formal Analysis: C.A., G.S., S.K., Y.S. and A.A.K.; Investigation: C.A., G.S., Y.S, A.A.K. and S.K.; Resources: Y.S., A.A.K. and C.A.; Data Curation: C.A., G.S. and S.K.; Writing – Original Draft Preparation: C.A., G.S. and S.K.; Writing – Review & Editing: C.A., G.S., S.K., Y.S. and A.A.K.; Visualization: C.A., A.A.K. and G.S.; Supervision: C.A.; Project Administration: C.A., S.K., Y.S. and A.A.K.; Funding Acquisition: C.A., S.K., Y.S. and A.A.K.
Funding
This research received no external funding.
Institutional Review Board Statement
This study was approved by the Ankara Etlik City Hospital Scientific Research Evaluation and Ethics Committee on 17 November 2025 (Approval ID: AEŞH-BADEK1-2025-641).
Informed Consent Statement
Informed consent was obtained from all subjects involved in the study.
Data Availability Statement
The individual participant data underlying the results reported in this article, as well as the dataset generated or analyzed during the study, are available from the corresponding author upon reasonable request.
Conflicts of Interest
The authors declare no conflict of interest.
References
- Stabler, S.P. Clinical practice. Vitamin B12 deficiency. N. Engl. J. Med. 2013, 368, 149–160. [Google Scholar] [CrossRef] [PubMed]
- Duffy, M.J. Tumor Markers in Clinical Practice: A Review Focusing on Common Solid Cancers. Med. Princ. Pract. 2013, 22, 4–11. [Google Scholar] [CrossRef] [PubMed]
- Lee, T.; Teng, T.Z.J.; Shelat, V.G. Carbohydrate antigen 19-9 - tumor marker: Past, present, and future. World. J. Gastrointest. Surg. 2020, 12, 468–490. [Google Scholar] [CrossRef] [PubMed]
- Charkhchi, P.; Cybulski, C.; Gronwald, J.; Wong, F.O.; Narod, S.A.; Akbari, M.R. CA125 and Ovarian Cancer: A Comprehensive Review. Cancers 2020, 12, 3730. [Google Scholar] [CrossRef] [PubMed]
- Issac, T.G.; Soundarya, S.; Christopher, R.; Chandra, S.R. Vitamin B12 Deficiency: An Important Reversible Co-Morbidity in Neuropsychiatric Manifestations. Indian J. Psychol. Med. 2015, 37, 26–29. [Google Scholar] [CrossRef] [PubMed]
- Yu, H.; Yu, T.N.; Cai, X.J. Tumor biomarkers: help or mislead in the diagnosis of xanthogranulomatous cholecystitis?-analysis of serum CA 19-9, carcinoembryonic antigen, and CA 12-5. Chin. Med. J. 2013, 126, 3044–3047. [Google Scholar] [CrossRef]
- Ebbing, M.; Bonaa, K.H.; Nygård, O.; Arnesen, E.; Ueland, P.M.; Nordrehaug, J.E.; Rasmussen, K.; Njolstad, I.; Refsum, H.; Nilsen, D.W.; et al. Cancer Incidence and Mortality After Treatment With Folic Acid and Vitamin B12. JAMA 2009, 302, 2119–2126. [Google Scholar] [CrossRef] [PubMed]
- Hung, N.; Shen, C.; Hu, Y.; Hu, L.; Yeh, C.; Teng, C.; Kuan, A.; Chen, S.; Chen, T.; Liu, C. Risk of Cancer in Patients with Iron Deficiency Anemia: A Nationwide Population-Based Study. PLoS ONE 2015, 10, e0119647. [Google Scholar] [CrossRef] [PubMed]
- Karakoyun, I.; Duman, C.; Arslan, F.D.; Baysoy, A.; Basok, B.I. Vitamin B12 and folic acid associated megaloblastic anemia: Could it mislead the diagnosis of breast cancer? Int. J.. Vitam. Nutr. Res. 2019, 89, 255–260. [Google Scholar] [CrossRef] [PubMed]
- Soltani, N.; Moghimian-Boroujeni, B.; Abdolalian, M.; Javan, M.R. Association between tumor markers and anemia: a short review. Acta. Haematol. Pol. 2023, 54, 72–76. [Google Scholar] [CrossRef]
- Smith, A.; Refsum, H. Homocysteine, B Vitamins, and Cognitive Impairment. Annu. Rev. Nutr. 2016, 36, 211–239. [Google Scholar] [CrossRef] [PubMed]
- Fernàndez-Roig, S.; Lai, S.-C.; Murphy, M.M.; Fernandez-Ballart, J.; Quadros, E.V. Vitamin B12 deficiency in the brain leads to DNA hypomethylation in the TCblR/CD320 knockout mouse. Nutr. Metab. (Lond) . 2012, 9, 41. [Google Scholar] [CrossRef] [PubMed]
- Gupta, R.; Choudhary, S.; Chatterjee, T. A Study on Vitamin B12 Levels in Hypothyroid Patients Presenting to a Tertiary Care Teaching Hospital. Cureus 2023, 15, e44197. [Google Scholar] [CrossRef] [PubMed]
- Benites-Zapata, V.A.; Ignacio-Cconchoy, F.L.; Ulloque-Badaracco, J.R.; Hernandez-Bustamante, E.A.; Alarcón-Braga, E.A.; Al-kassab-Córdova, A.; Herrera-Añazco, P. Vitamin B12 levels in thyroid disorders: A systematic review and meta-analysis. Front. Endocrinol. . 2023, 14, 1070592. [Google Scholar] [CrossRef] [PubMed]
- Aktas, H.S. Vitamin B12 and Vitamin D Levels in Patients with Autoimmune Hypothyroidism and Their Correlation with Anti-Thyroid Peroxidase Antibodies. Med. Princ. Pract. 2020, 29, 364–370. [Google Scholar] [CrossRef] [PubMed]
- Rogez, J.; Urbanski, G.; Vinatier, E.; Lavigne, C.; Dupin, I.; Ravaiau, C.; Lacombe, V. Iron deficiency in pernicious anemia: Specific features of iron deficient patients and preliminary data on response to iron supplementation. Clin. Nutr. 2024, 43, 1025–1032. [Google Scholar] [CrossRef] [PubMed]
- Solmaz, S.; Özdoğu, H.; Boğa, C. Cobalamin deficiency can mask depleted body iron reserves. Indian. J. Hematol. Blood. Transfus. 2015, 31, 255–258. [Google Scholar] [CrossRef] [PubMed]
- Sharma, S. Tumor markers in clinical practice: General principles and guidelines. Indian. J. Med. Paediatr. Oncol. 2009, 30, 1–8. [Google Scholar] [CrossRef] [PubMed]
- Symeonidis, A.; Kouraklis-Symeonidis, A.; Apostolopoulos, D.; Arvanitopoulou, E.; Giannakoulas, N.; Vassilakos, P.; Zoumbos, N. Increased serum CA-15.3 levels in patients with megaloblastic anemia due to vitamin B12 deficiency. Oncology 2004, 67, 359–367. [Google Scholar] [CrossRef] [PubMed]
- Duffy, M.J.; Evoy, D.; McDermott, E.W. CA 15-3: Uses and limitation as a biomarker for breast cancer. Clin. Chim. Acta. 2010, 411, 1869–1874. [Google Scholar] [CrossRef] [PubMed]
- Ros-Lucas, J.A.; Pascual-Figal, D.A.; Noguera-Velasco, J.A.; Hernández-Vicente, A.; Cebreiros-López, I.; Arnaldos-Carrillo, M.; Martínez-Ardil, I.M.; García-Vázquez, E.; Aparicio-Vicente, M.; Solana-Martínez, E.; et al. CA 15-3 prognostic biomarker in SARS-CoV-2 pneumonia. Sci. Rep. 2022, 12, 6738. [Google Scholar] [CrossRef] [PubMed]
- Obeid, R. High plasma vitamin B12 and cancer in human studies: a scoping review to judge causality and alternative explanations. Nutrients 2022, 14, 4476. [Google Scholar] [CrossRef] [PubMed]
- Venturelli, S.; Leischner, C.; Helling, T.; Burkard, M.; Marongiu, L. Vitamins as Possible Cancer Biomarkers: Significance and Limitations. Nutrients 2021, 13, 3914. [Google Scholar] [CrossRef] [PubMed]
Figure 1.
Correlation between serum vitamin B12 and tumor markers in patients with low vitamin B12 levels (<200 ng/L). Scatter plots show the relationships between vitamin B12 concentrations and tumor markers across five panels: (A) CA 125, (B) CA 15-3, (C) CA 19-9, (D) CEA, and (E) AFP. A moderate negative correlation was observed between vitamin B12 and CA 15-3 levels (panel B; r = –0.36, p < 0.0001). In addition, a weak but statistically significant positive correlation was observed between vitamin B12 and CEA levels (panel D; r = 0.23, p = 0.0057), whereas no significant associations were found for the other tumor markers (p > 0.05). Each point represents an individual patient; regression lines indicate correlation trends.
Figure 1.
Correlation between serum vitamin B12 and tumor markers in patients with low vitamin B12 levels (<200 ng/L). Scatter plots show the relationships between vitamin B12 concentrations and tumor markers across five panels: (A) CA 125, (B) CA 15-3, (C) CA 19-9, (D) CEA, and (E) AFP. A moderate negative correlation was observed between vitamin B12 and CA 15-3 levels (panel B; r = –0.36, p < 0.0001). In addition, a weak but statistically significant positive correlation was observed between vitamin B12 and CEA levels (panel D; r = 0.23, p = 0.0057), whereas no significant associations were found for the other tumor markers (p > 0.05). Each point represents an individual patient; regression lines indicate correlation trends.
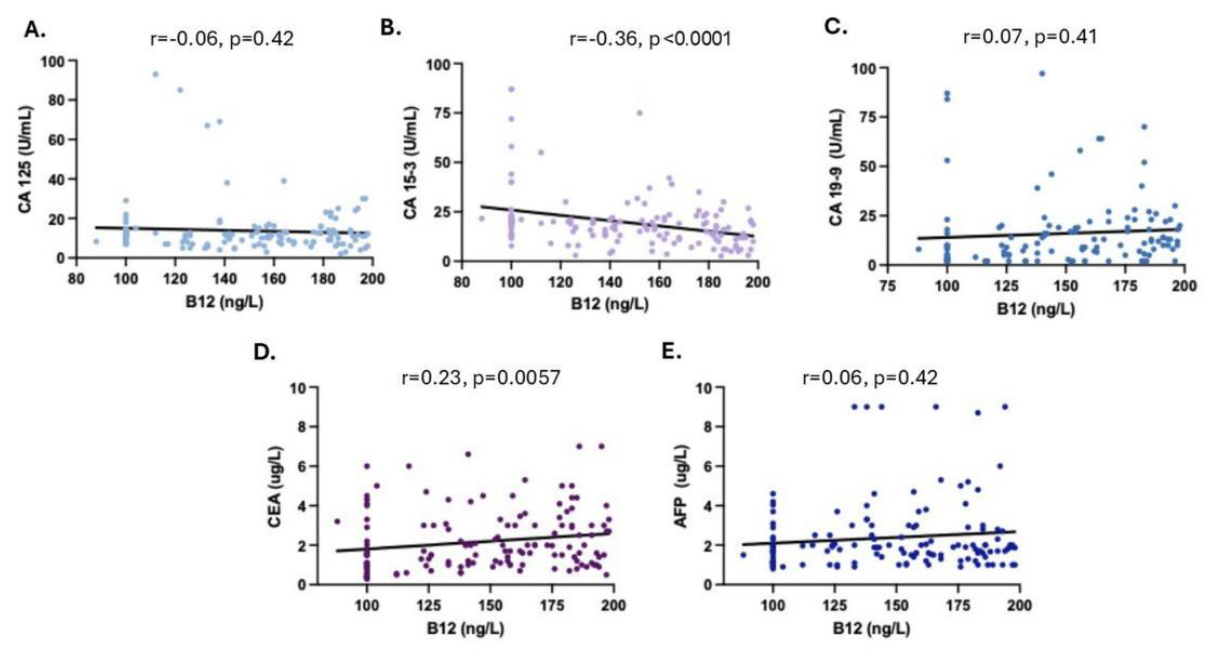
Figure 2.
Correlation between serum vitamin B12 and tumor markers in patients with normal vitamin B12 levels (≥200 ng/L). Scatter plots show the relationships between vitamin B12 concentrations and tumor markers across five panels: (A) CA 125, (B) CA 15-3, (C) CA 19-9, (D) CEA, and (E) AFP. A weak but statistically significant positive correlation was observed between vitamin B12 and CA 125 (panel A; r = 0.27, p = 0.0047), whereas no significant correlations were found for the other tumor markers (p > 0.05). Each point represents an individual patient; regression lines indicate correlation trends.
Figure 2.
Correlation between serum vitamin B12 and tumor markers in patients with normal vitamin B12 levels (≥200 ng/L). Scatter plots show the relationships between vitamin B12 concentrations and tumor markers across five panels: (A) CA 125, (B) CA 15-3, (C) CA 19-9, (D) CEA, and (E) AFP. A weak but statistically significant positive correlation was observed between vitamin B12 and CA 125 (panel A; r = 0.27, p = 0.0047), whereas no significant correlations were found for the other tumor markers (p > 0.05). Each point represents an individual patient; regression lines indicate correlation trends.
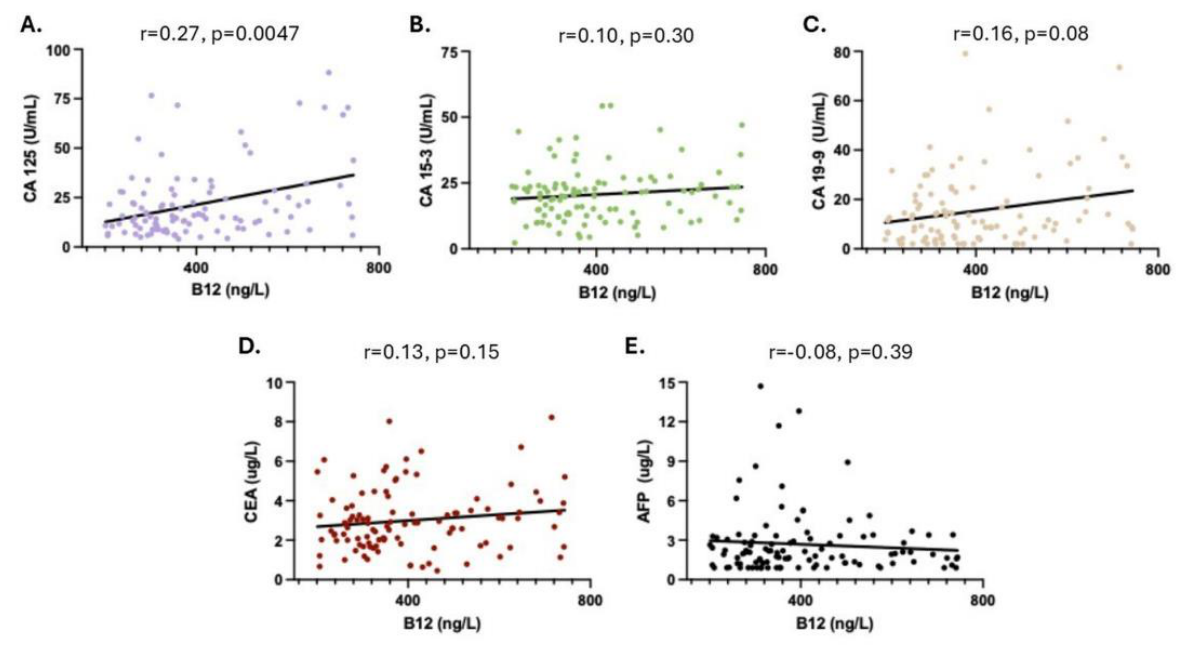

Table 1.
Comparison of parameters in normal B12 and low B12 patients.
| Normal B12 (Mean ± SD [95% CI]) | Low B12 (Mean ± SD [95% CI]) | p value | |
| Age | 61.37 ± 19.06 [57.75-64.99] | 58.81 ± 18.66 [55.70-61.91] | 0.3181*** |
| Sex (Male) | 55 (50.5%) | 78 (55.3%) | 0.5229 |
| White Blood Cell Count (103/uL) | 9.78 ± 5.08 [8.80-10.76] | 7.24 ± 3.31 [6.69-7.79] | <0.0001 |
| Hemoglobin (g/dL) | 12.11 ± 2.69 [11.59-12.63] | 10.86 ± 2.89 [10.38-11.35] | 0.0007*** |
| Hematocrit (%) | 37.19 ± 7.53 [35.74-38.64] | 33.61 ± 8.76 [32.15-35.07] | 0.0025* |
| MCV (fL) | 85.81 ± 8.53 [84.17-87.44] | 87.02 ± 11.86 [85.05-89] | 0.6478* |
| Platelet (103/uL) | 254.8 ± 99.10 [235.8-273.8] | 234.7 ± 108.9 [216.6-252.8] | 0.1117* |
| Neutrophil Count (103/uL) | 6.93 ± 4.58 [6.05-7.81] | 4.53 ± 2.58 [4.10-4.96] | <0.0001* |
| Lymphocyte Count (103/uL) | 1.72 ± 0.90 [1.60-1.95] | 1.68 ± 0.88 [1.53-1.83] | 0.3453* |
| BUN (mg/dL) | 63.25 ± 48.82 [53.98-72.52] | 43.16 ± 33.49 [37.58-48.73] | 0.0010* |
| Creatinine (mg/dL) | 1.33 ± 0.78 [1.18-1.48] | 1.04 ± 0.93 [0.89-1.20] | <0.0001* |
| Total Bilirubin (mg/dL) | 0.78 ± 0.83 [0.62-0.94] | 0.87 ± 1.21 [0.67-1.07] | 0.4410* |
| Direct Bilirubin (mg/dL) | 0.35 ± 0.59 [0.24-0.47] | 0.38 ± 0.78 [0.25-0.51] | 0.6562* |
| Indirect Bilirubin (mg/dL) | 0.42 ± 0.32 [0.36-0.48] | 0.48 ± 0.73 [0.36-0.61] | 0.4867* |
| AST (U/L) | 32.02 ± 35.09 [25.36-38.68] | 27.6 ± 35.04 [21.74-33.46] | 0.0309* |
| ALT (U/L) | 28.90 ± 37.49 [21.78-36.02] | 25.89 ± 42.74 [18.77-33.00] | 0.0142* |
| LDH (U/L) | 253.30 ± 169.60 [221.10-285.50] | 492 ± 832 [348.7-635.2] | 0.1202* |
| Uric Acid (mg/dL) | 8.67 ± 22.35 [4.43-12.92] | 5.64 ± 2.36 [5.21-6.07] | 0.0123* |
| Total Protein (g/L) | 62.86 ± 8.33 [61.28-64.44] | 61.04 ± 8.129 [59.67-62.40] | 0.0848*** |
| Albumin (g/L) | 36.87 ± 7.10 [35.52-38.22] | 36.25 ± 6.089 [35.23-37.28] | 0.1956* |
| TSH (mIU/L) | 2.52 ± 4.74 [1.62-3.42] | 2.72 ± 4.79 [1.92-3.52] | 0.4497* |
| FT4 (ng/dL) | 1.28 ± 0.30 [1.22-1.33] | 1.06 ± 0.41 [0.99-1.13] | <0.0001* |
| B12 (ng/L) | 436.8 ± 246.5 [390-483.6] | 146.4 ± 34.32 [140.70-152.10] | <0.0001* |
| Folate (ug/L) | 7.36 ± 4.13 [6.57-8.14] | 7.68 ± 4.20 [6.97-8.38] | 0.4216* |
| Ferritin (ug/L) | 254.7 ± 454.4 [168.4-341.0] | 184.4 ± 425.7 [113.5-255.3] | 0.0128* |
| Iron (ug/dL) | 45.38 ± 28.02 [40.04-50.72] | 322.3 ± 507.9 [236.5-408.1] | <0.0001* |
| TIBC (ug/dL) | 229.4 ± 82.01 [213.80-245] | 221 ± 101.70 [204-237.9] | 0.4800*** |
| Sedimentation | 24.15 ± 21.80 [20.03-28.27] | 26.45 ± 22.43 [22.72-30.19] | 0.2932* |
| CA 125 (U/mL) | 21.89 ± 18.07 [18.58-25.20] | 13.85 ± 12.8 [11.72-15.98] | <0.0001* |
| CA 15-3 (U/mL) | 21.43 ± 15.78 [18.57-24.28] | 19.68 ± 13.99 [17.35-22.01] | 0.0749* |
| CA19-9 (U/mL) | 15.98 ± 14.64 [13.36-18.60] | 15.97 ± 17.56 [13.02-18.93] | 0.5462* |
| CEA (ug/L) | 2.98 ± 1.58 [2.68-3.29] | 2.17 ± 1.50 [1.92-2.42] | <0.0001* |
| AFP (ug/L) | 2.64 ± 2.30 [2.22-3.06] | 2.37 ± 1.74 [2.08-2.66] | 0.4717* |
Abbreviations: BUN, blood urea nitrogen; TSH, thyroid-stimulating hormone; FT4, free thyroxine; LDH, lactate dehydrogenase; AST, aspartate aminotransferase; ALT, alanine aminotransferase; TIBC, total iron-binding capacity; CA 125, cancer antigen 125; CA 15-3, cancer antigen 15-3; CA 19-9, cancer antigen 19-9; CEA, carcinoembryonic antigen; AFP, alpha-fetoprotein; MCV, mean cell volume; SD, standard deviation; CI, confidence interval. * Mann-Whitney U Test, ** Fisher’s test , *** t-Test.
Table 2.
Predictors of low B12 levels in entire population.
| Feature | Univariate Analysis | Multivariate Analysis | ||
| OR (95% CI) | p-value | OR (95% CI) | p-value | |
| Sex (female vs. male) | 0.82 (0.49-1.35) | 0.4450 | - | - |
| White Blood Cell Count (103/uL) | 0.85 (0.78-0.91) |
<0.0001 |
0.82 (0.61-1.09) | 0.1853 |
| Hemoglobin (g/dL) | 0.85 (0.77-0.93) | 0.0006 | 0.79 (0.37-1.69) | 0.5524 |
| Hematocrit (%) | 0.94 (0.91-0.97) | 0.0008 | 1.04 (0.78-1.38) | 0.7706 |
| Mean Cell Volume (fL) | 0.98 (0.96-1.01) | 0.3657 | - | - |
| Platelet (103/uL) | 0.99 (0.99-1.) | 0.1336 | - | - |
| Neutrophil Count (103/uL) | 0.80 (0.72-0.87) |
<0.0001 |
1.06 (0.77-1.47) | 0.6966 |
| Lymphocyte Count (103/uL) | 0.88 (0.66-1.16) | 0.3843 |
- | - |
| BUN (mg/dL) | 0.98 (0.98-0.99) | 0.0001 | 0.98 (0.96-1.01) | 0.3829 |
| Creatinine (mg/dL) | 0.67 (0.47-0.91) | 0.0095 | 1.15 (0.47-4.09) | 0.7792 |
| Total Bilirubin (mg/dL) | 1.08 (0.85-1.42) | 0.5082 | - | - |
| Direct Bilirubin (mg/dL) | 1.06 (0.74-1.60) | 0.7328 | - | - |
| Indirect Bilirubin (mg/dL) | 1.21 (0.77-2.22) | 0.4076 | - | - |
| AST (U/L) | 0.99 (0.99-1.01) | 0.3239 | - | - |
| ALT (U/L) | 1 (0.98-1) | 0.5604 | - | - |
| LDH (U/L) | 1 (1-1) | 0.0010 | 1 (0.99-1) | 0.8994 |
| Uric Acid (mg/dL) | 0.87 (0.78-0.96) | 0.0040 | 0.98 (0.86-1) | 0.3080 |
| Total Protein (g/L) | 0.97 (0.94-1) | 0.0831 | 0.96 (0.91-1.01) | 0.1853 |
| Albumin (g/L) | 0.98 (0.94-1.02) | 0.4614 | - | - |
| TSH (mIU/L) | 1 (0.95-1.07) | 0.7405 | - | - |
| FT4 (ng/dL) | 0.10 (0.03-0.27) | <0.0001 | 0.02 (0-0.24) | 0.0008 |
| Folate (ug/L) | 1.01 (0.95-1.08) | 0.5495 | - | - |
| Ferritin (ug/L) | 0.99 (0.99-1) | 0.2036 | - | - |
| Iron (ug/dL) | 1.01 (1.01-1.02) | <0.0001 | 1.02 (1.01-1.03) | <0.0001 |
| TIBC (ug/dL) | 0.99 (0.99-1) | 0.4778 | - | - |
| Sedimentation | 1 (0.99-1.01) | 0.4096 | - | - |
| CA 125 (U/mL) | 0.96 (0.94-0.98) | <0.0001 | 0.98 (0.94-1.02) | 0.4083 |
| CA 15-3 (U/mL) | 0.99 (0.97-1) | 0.3425 | - | - |
| CA19-9 (U/mL) | 0.99 (0.98-1.01) | 0.9408 | - | - |
| CEA (ug/L) | 0.71 (0.59-0.84) | <0.0001 | 0.74 (0.53-1.02) | 0.0709 |
| AFP (ug/L) | 0.93 (0.82-1.05) | 0.2745 | - | - |
Abbreviations: OR, Odds Ratio; CI, Confidence Interval; BUN, Blood Urea Nitrogen; AST, Aspartate Aminotransferase; ALT, Alanine Aminotransferase; LDH, Lactate Dehydrogenase; TSH, Thyroid-Stimulating Hormone; FT4, Free Thyroxine; TIBC, Total Iron-Binding Capacity; ESR, erythrocyte sedimentation rate; CA 125, Cancer Antigen 125; CA 15-3, Cancer Antigen 15-3; CA19-9, Cancer Antigen 19-9; CEA, Carcinoembryonic Antigen; AFP, Alpha-Fetoprotein.
Disclaimer/Publisher’s Note: The statements, opinions and data contained in all publications are solely those of the individual author(s) and contributor(s) and not of MDPI and/or the editor(s). MDPI and/or the editor(s) disclaim responsibility for any injury to people or property resulting from any ideas, methods, instructions or products referred to in the content. |
© 2026 by the authors. Licensee MDPI, Basel, Switzerland. This article is an open access article distributed under the terms and conditions of the Creative Commons Attribution (CC BY) license (http://creativecommons.org/licenses/by/4.0/).
Copyright: This open access article is published under a Creative Commons CC BY 4.0 license, which permit the free download, distribution, and reuse, provided that the author and preprint are cited in any reuse.