

Submitted:
02 September 2026
Posted:
02 September 2026
You are already at the latest version
Abstract
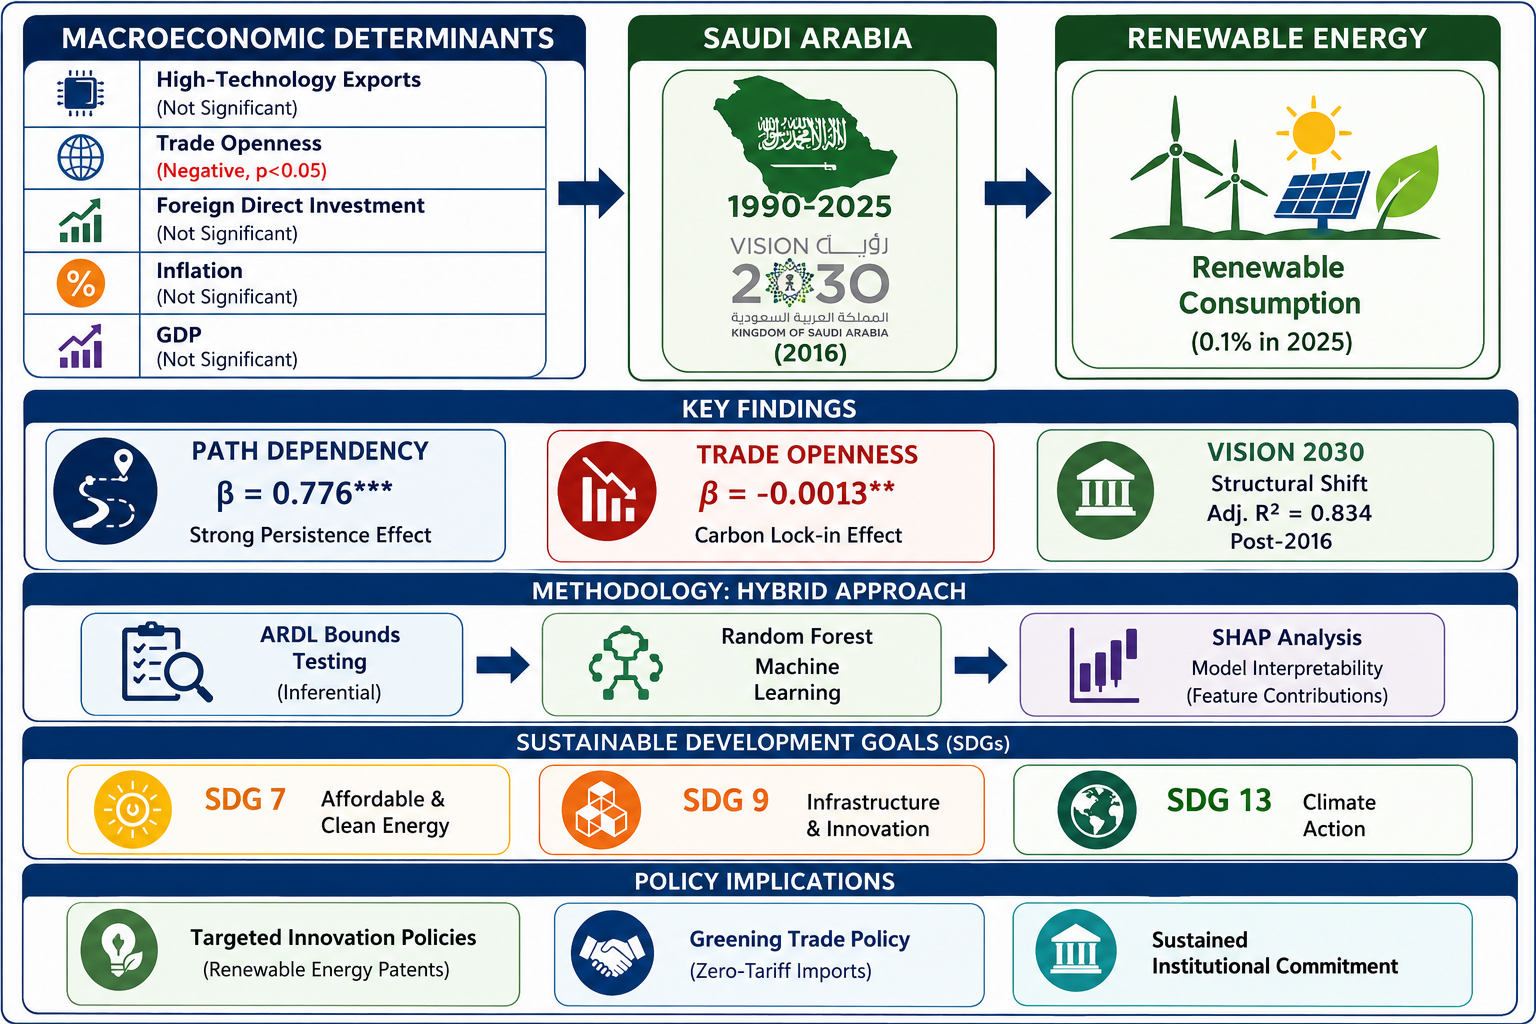
This paper investigates the macroeconomic determinants of renewable energy consumption in Saudi Arabia during 1990–2025 using a hybrid approach of ARDL bounds testing and Random Forest machine learning with SHAP (SHapley Additive ExPlanations) to improve model interpretability. We employ annual data from the World Development Indicators to examine the effect of high-technology exports, trade openness, foreign direct investment, inflation and GDP on renewable energy consumption. Our results indicate that renewable energy consumption is highly path dependent, with previous adoption playing a significant role in current consumption (β = 0.776, p < 0.01). Trade openness also shows a negative contemporaneous effect ( = 0.0013, p 0.05) in line with the carbon lock-in hypothesis that typifies hydrocarbon-dependent economies. High-technology exports as a proxy for technological innovation do not appear to be a significant driver, indicating that the innovation-led energy transition in Saudi Arabia is still maturing. The Random Forest model confirms the importance of persistence effects explaining about 73 % of the variance. The analysis of the different time periods indicates that, after 2016 (also known as Vision 2030), there has been a significant change in the structure of the analyzed data, with the statistical model of research becoming much stronger as its explanatory power has reached up to 83%. The analysis of the SHAP allows understanding of the obtained results by measuring the influence of each individual variable. The findings that were obtained pertain to Sustainable Development Goal 7 (which focuses on developing cheap and clean energy), Sustainable Development Goal 9 (which focuses on industry, innovation, and infrastructure), and Sustainable Development Goal 13 (which focuses on climate action). It is our proposal that Saudi Arabia adopt focused innovation strategies, careful management of its trade integration, and a commitment to the institutional framework in order to accelerate the transition to renewable energy. However, it is important to note that this recommendation is suggestive and not definitive.
Keywords:
renewable energy consumption
; macroeconomic determinants
; ARDL
; random forest
; Saudi Arabia
; vision 2030
; carbon lock-in
; SHAP
; sustainable development
; energy transition
1. Introduction
During the transition of global energy systems and acceleration of technological progress, dependent economies are faced with both opportunities and challenges that have never been experienced before. The problems caused by supply chains due to certain military conflicts around the globe and economic instability caused by the COVID-19 pandemic demonstrate how insufficiently strong are the systems of traditional energy transit. That is why the necessity of increasing the share of renewable energy in the overall energy structure of macroeconomics is one of the main objectives of the politics of the countries that depend on hydrocarbons [1]. The level of renewable energy consumption is an important parameter, which reflects the degree of the countries' commitment to the principles of sustainable development and influences not only the ecological situation in the country but also the structure of the national economy [2].
As the world's leading oil supplier, Saudi Arabia has a crucial place in the global energy landscape. The Kingdom is clearly committed to the idea of energy diversification, and it has clearly expressed this principle through the initiative known as Saudi Vision 2030, according to which by 2030 50% of energy generation should be conducted in regard to renewable energy [3,4]. The data of the World Bank that is used for this study shows that the use of renewable energy sources constituted 0.1% of the total energy use in 2020-2025, and there is no evidence of any renewable energy use during the time period of 1990-2019. The gap that can be seen in the data indicates that there is a need for research into the macroeconomic variables that either promote or prevent the process of using renewable energy sources in the Kingdom.
The current study adds three new aspects to the literature. Second, unlike most previous studies that have treated macroeconomic determinants as homogeneous aggregates, we explicitly model the heterogeneous effects of different types of macroeconomic factors (high-technology exports, trade openness, foreign direct investment, inflation and GDP) on renewable energy consumption across different stages of development. This extends Schomburg and Silberberger [1] in finding the macroeconomic determinants with highest returns at each growth level. Second, we use the carbon lock-in theory [3] to include policy frameworks as a moderator in one of the analytical models, to explain why the same investments in renewable energy led to different outcomes in different periods. This fills a gap noted by Touitou and Laib [5] who called for a more detailed investigation of the impact of macroeconomic factors on the consumption of renewable energy. Third, we adopt a complementary approach: we integrate predictive machine learning (Random Forest) with inferential econometrics (ARDL bounds testing). Random Forest regression with indicators of predictive performance (R², RMSE, MAE) shows the economic relevance of renewable energy determinants. ARDL models give coefficient estimates and statistical significance. This novel approach of triangulation helps to overcome the drawbacks of conventional hypothesis testing and provides a baseline for further research in this field. The study employs a time-series for the period 1990-2025, comprising the pre-Vision, post-Vision and the recent deployment periods.
According to the Global Energy Review 2024, over the past ten years, over 65% of nations that rely on hydrocarbons have faced a lot of inconsistencies in developing renewable energy due to the inconsistency of their policy systems and economies with the aims of energy transition. Moreover, those countries that have implemented good policies for transition into clean energy have recovered from economic challenges 40% faster than the average of the region. These factors help understand why renewable energy is a crucial aspect of the process of achieving sustainable growth in the economy [6]. Macroeconomic indicators can help find the opportunities in the market, raise productivity and optimize resources used thanks to renewable energy technologies and digital finance [7].
Academics are increasingly interested in new approaches to renewable energy transition. Earlier studies have shown that renewable energy adoption can contribute positively to productivity and economy [8, 9]. The consumption of renewable energy is crucial to sustainable development and enabling growth of economy through unique channels. At the same time, there has been very little research on the interaction of macroeconomic determinants and renewable energy consumption in relation to different level of development of countries. Previous studies used a policy commitment of the country as a proxy measure[9]. However, the measurement at the country level does not take into account the complex interactions of macroeconomic variables such as openness, technological development and economic growth in countries with various income levels. This leads to several important research questions for the future:
- What is the main macroeconomic reason for the use of renewable energy in Saudi Arabia?
- What is the difference between the results of machine learning and the results of classical estimates based on time series econometrics?
- Has the nature of the connections changed since the announcement of Vision 2030 in 2016?
These are the main objectives which the study seeks to achieve.
Recent empirical studies have shown that renewable energy usage and economic growth are positively correlated. Comparative analyses of 85 nations have revealed that information communication technology infrastructure has an effect on economic growth, especially staying in sync with banking sector development [10]. However, the authors will argue that the hypothesis of homogeneity that much of this research relies on has its pitfalls. Developing economy countries differ greatly from one another in terms of institutional quality, human capital quality, and infrastructure available. Many resources spent on generic policies may be wasted. Schomburg and Silberberger [11] suggest that macroeconomic variables have a great effect on renewable energy usage, depending on the level of development of the economy. In particular, this is evidence of the existence of threshold effects in the sense that the impact is limited in terms of poorly developed countries.
We aim to comprehend the influence of macroeconomic factors on the usage of renewable energy and its functioning with an emphasis on the contrast between the periods before and after Vision 2030. This research utilizes time series data from Saudi Arabia from 1990 until 2025 and the ARDL bounds test along with Random Forest machine learning and SHAP analysis to observe the influence of macroeconomic determinants on renewable energy consumption in reality. Also, the paper examines how policy frameworks can play a role of catalysts in structural changes, for instance Vision 2030.
This work particularly addresses three research questions. The first one is about what degree the rigorous assessment criteria contribute to the enhancement of renewable usage during the transition of Saudi Arabia to renewable energy when analyzing the macroeconomic factors. The second one raises the question of whether these effects differ during the pre- and post-Vision 2030 period. The last one touches upon the significance of various macroeconomic factors that play a role in the different phases of policy implementation.
This paper differs from econometric studies in that it uses machine learning evaluation techniques. ARDL models provide coefficient estimates and significance of the coefficients. Random Forest regression provides performance indicators (R2, RMSE, MAE) that tell us about the importance of renewable energy independent variables. The SHAP analysis gives an evaluation of the contribution of each variable in the model to the explanation.
The key contribution of this study to the previous work is that it incorporates heterogeneity into the framework linking macroeconomic determinants and renewable energy consumption, which expands the study of factors influencing the adoption of renewable energy. What this adds to the existing literature on energy transition and development economics is a new theory perspective on the process of renewable energy adoption in hydrocarbon-dependent economies. Secondly, it breaks down the impact pathways from a policy intervention perspective and depicts the complex nature of the effects of macroeconomic determinants. The result gives the country-specific empirical evidence for the policymakers to take the renewable energy plans particularly in the places with the limited resources. Third, the methodological approach employs both time-series econometrics and machine learning evaluation metrics to overcome the problems that are present with standard hypothesis testing. This provides a validation for empirical findings and a benchmark for future studies in the area. The study is based on a case study of Saudi Arabia, a country that has been used often in energy policy studies, but rarely with such a comprehensive hybrid methodology. It does this by employing a time-series for the period 1990 to 2025 that includes the pre-Vision, post-Vision and recent deployment periods. This horizon includes the entire cycle of the energy transition accelerated by Vision 2030.
Implementing renewable energy methods along with achieving economic growth will greatly benefit many different areas of socio-environmental development. Besides, renewable energy technologies can also play a significant contribution to social sustainability by allowing marginalized groups access to clean energy, improving air quality, and generating new job opportunities, which will widen the possibilities for fighting poverty and gaining access to a clean environment (Sustainable Development Goals (SDGs) 1 and 7 respectively). By means of heterogeneity analyses before and after Vision periods, we will be able to discover within country differences in achievement of SDG 10 as well as assess how such differences are influenced by ability to use renewable energy system.
Renewable energy technologies help in the sustainability of natural resources by emitting lesser greenhouse gases, reducing the levels of air pollution, and assisting governments and other organizations in tackling climate change (SDG 7, SDG 13). However, transitioning into renewable energy sources means not only a decrease in fossil fuel consumption, but also a great initial investment and the possible environmental impact of manufacturing and disposing of renewable energy technologies (solar panels, wind turbines).
The effectiveness of renewable energy as a facilitator of fair and stable growth is dependent on concurrent investments in human resources and the quality of regulatory systems. For this reason, the present research regards the use of renewable energy as a conditional activation factor, but not the ultimate goal itself. The paper highlights the impact of the policies and institutional level of commitment on the heterogeneity factor of development of countries and also the completion of global sustainable development goals.
The rest of the paper is structured in the following format: The second section discusses vital theoretical and empirical studies. The framework of the proposed study and the hypotheses are explained in the third section. The fourth section examines the different variables used in this research, the data, and its analysis, along with the preprocessing steps of the data and its evaluation methods. The actual outcomes are given in and discussed in the fifth section, including regression results, performance of Random Forest, and the analysis of mutual dependence. The diagnostic tests and tests about the outcomes being stable are covered in the sixth section. Section seven summarizes the main findings of the paper, as well as their limitations, and recommendations for future studies. The paper finishes with implications for the Saudi government and the international development agencies.
2. Literature Review
The aim of this section is to review the literature existing in the fields of theory and empirical studies about the relationship between the use of renewable sources of energy and those issues that are linked to macroeconomics.
2.1. Research on Renewable Energy Consumption and Macroeconomic Factors
Various macroeconomic factors evidence their connections with renewable energy consumption, which has been investigated in different studies. Using 85 countries as a sample, Niebler [9] stated that it is ICT infrastructure that affects economic development positively when paired with the development of the banking sector. Bahrini and Qaffas [10] found out that the usage of mobile phone packages, fixed broadband access and the number of internet users substantially contributes to the economic performance of Southeast Asian countries. Nevertheless, the majority of the existing research studies presume that macroeconomic factors affect renewable energy consumption equally among countries. This assumption might not be justified considering that institutional quality, human capital and infrastructure quality vary greatly in developing countries.
The recent study underscores these differences. Schomburg and Silberberger [11] point out the existence of threshold effects in the relationship between digitalization and growth. Thus, the magnitude of the impact of digital technology dependence on economic growth is shaped by the initial level of digital rejuvenation of a particular nation. For instance, in countries with lower levels of digitization, the results of using digital technology by the agent seem to be insignificant. At the same time, countries characterized by medium digitalization levels tend to profit from household and company digitalization. Lastly, advanced digital economies are the ones speeding up the process of digitalization in the public sector.
Similar thresholds have also been identified in the regard of renewable energy. The link between the macroeconomic factors and renewable energy consumption differs from country to country depending on the level of development. Importance of trade openness, technological innovation and economic growth varies greatly with different stages of fossil fuel dependency as well as energy transition commitment.
As renewable energy continues to be incorporated into national strategies, the channels through which macroeconomic indicators have operated have changed from those incurred at the national level to that occurring at the international one. The academic research on the effect of macroeconomic factors on the consumption of renewable energy is mainly three: conceptual framework, measurement issues, and mechanisms affecting this relationship [12]. This makes it possible to develop a solid theoretical background for this research paper.
The growth effect denotes a situation where a country’s productivity converges to that of other similar economies, and the performance of one country is impacted by the performance of other countries. The term originates from the technological diffusion concept. It has become an important tool for explaining the country’s performance in the field of development economics. In the field of renewable energy, the peer effect means the transfer of technologies between countries that refer to practices of their peer countries in making policy decisions in order to lessen uncertainties and improve policy effectiveness [13]. In fact, the peer effect is the process of technological diffusion through information exchange and competition pressures [14].
Based on these conceptual boundaries, various techniques of measurement have been researched by scholars in terms of macroeconomic factors. In terms of measuring renewable energy use, most studies analyze two things: total renewable energy consumption and share of renewable energy in total energy consumption. Peer effects show how interdependent countries are in the adoption of policies in the same area/goes in that region due to their energy demands and market situations [15]. Regional clustering effects indicate how geography affects policies. For example, countries that are close to each other can easily share technologies and resources [1].
In literature, there are mainly two types of proxy variables for quantitative indicators, which can be classified as input-based indicators, e.g., the ratio of R&D expenditures to GDP [16], and output-based indicators, e.g. high technology exports rates, rates of renewable energy consumption [17]. This framework evaluation of several dimensions enables the methodology to measure accurately the strength and nature of the effects of the macroeconomic factors.
2.2. Research on Heterogeneity in Renewable Energy Transition
The number of studies focusing on the relationship between macroeconomic factors and renewable energy consumption is increasing but research into the issue of heterogeneity is not fully developed. Most of the current research examines the impact of renewable energy on economic growth while the causes of the process of using renewable energy are not explored in detail.
The theories related to carbon lock-in [1] identify the role of fossil fuel infrastructure in causing technological, institutional and behavioral inertia that prevents usage of cleaner technologies. The latest cross-economy analysis confirmed that the problem persists for economies based on hydrocarbons [18]. The theory defines four interrelated aspects of lock-in: technological (existing infrastructure and relevant technologies), institutional (regulatory frameworks and interests of major stakeholders), behavioral (consumers’ habits and preferences), and cognitive (existing paradigms).
Recent research on the connection between the digital economy and energy development in Saudi Arabia conveys that digital transformation may enhance the renewable energy sector [19,20]. There are considerable asymmetrical effects that can be observed in relation to the research on clean and dirty energy consumption in the economy of Saudi Arabia [20]. It is evident that the digital economy index plays a vital role in energy intensity and renewable energy consumption in the GCC [20].
However, limited studies have been conducted on Saudi Arabia using hybrid methodology with SHAP-based interpretability [21]. The Saudi case has seen little exploration of the innovation-energy nexus [22]. This study fills this gap using country-specific evidence until 2025 and a dual ARDL-Machine Learning approach backed by SHAP [2,21].
2.3. Gaps in the Existing Literature and Theoretical Contributions
The field of renewable energy and economic growth has many contributions in literature, but still, there are some gaps. Studies carried out by [23,24] have shown that there exists a correlation between renewable energy and economic growth, although almost all studies treat renewable energy consumption as a simple outcome influenced by aggregate factors. However, such an approach hides the different channels through which various categories of macroeconomic factors work with regard to the process of renewable energy adoption, therefore the impact of renewable energy adoption depends on the kind of economic factors as well as the process of its development [24]. However, few studies examine this question in hydrocarbon-based economies.
Next, the impact of policy frameworks on the relationship between renewable energy and economic growth is still poorly understood. According to the carbon lock-in theory [5], the role of policy commitment is said to increase the benefits of renewable energy. However, as of now, only a handful of studies (e.g., [20,21]) have studied this interaction empirically using dynamic panel methods. Also, at present, there is no understanding of how this context functions across different levels of development and in different economic structures at the same time.
Lastly, prior literature relies primarily on conventional econometric methods (ARDL, GMM, IV) while ignoring triangulation of results through machine learning methods capable of identifying nonlinear tendencies. Implementation of AI in economics [25] is increasing but its utilization for analysis of renewable energy determinants is yet to gather momentum, particularly in hydrocarbon-dependent nations.
The existing body of literature has concentrated primarily on the wealthy nations and members of the Organisation for Economic Co-operation and Development [24]. The developing countries which export oil have not been the focus of attention in the literature. In this paper, the case of Saudi Arabia will be used in an attempt to fill in this gap.
There are three main contributions of this study to the literature. First, we outline macro-economic influences into separate aspects and establish their distinct impacts at various stages of the policy implementation process. Second, we test the moderating role of policy systems with the help of sub-period analysis in the time-series context. Third, we present a new empirical application that combines time-series econometrics with exploratory machine-learning methods, which makes it possible to analyze the relationship between renewable energy and economic growth more thoroughly. Nevertheless, we have to point out that the machine learning results are exploratory in nature due to the small size of the sample collected for the analysis.
3. Theoretical Framework: Macroeconomic Determinants, Renewable Energy, and Sustainable Growth Pathways
A theoretical framework that will serve as a basis for the empirical investigation is going to be developed in this section, which is devoted to that topic.
3.1. Renewable Energy Consumption and Macroeconomic Determinants
The proposed framework uses concepts such as the peer group effect, carbon lock-in, and absorptive capacity. Peer group effect theory [25] posits that a country’s decision to adopt a technology is greatly affected by its peers. When a peer adopts technology, it decreases uncertainty and spreads technology through information spillovers and competition. Carbon lock-in theory [1] explains the process of fossil fuel infrastructure leading to the technological, institutional and behavioral inertia which hinders adoption of cleaner alternatives.
The theories have proposed that there is a conditional link between macroeconomic factors and renewable energy use with absorptive capacity serving as an intermediate variable [26]. The ability of a country to recognize, absorb and employ knowledge from outside sources hinges on its human capital, the quality of institutions and the related infrastructure. Nonetheless, the resource dependency theory maintains that states that suffer from a shortage of resources within their borders must fill in the gap and strengthen their economy by relying on outside partnerships. The use of renewable energy requires huge resource expenditures, which are hard to absorb by separate states.
A country’s decision to adopt renewable energy does not occur independently and is affected by the actions of countries in its region or income group. The peer influence occurs through two channels: information spillovers and resource coordination. With regard to information spillover, countries learn from the technical abilities and risk management cases of other countries that have successfully adopted renewable energy technologies. Countries may learn about these abilities through informational trading and policy learning, which enable them to explore potentials and identify risks of investments more easily. For instance, countries can follow the successful design principles used by leading countries of the region to apply renewable energy technologies and improve their energy systems through tailored solutions.
A technical cluster effect is created when numerous nations within a region embrace renewable energy sources. This is significant from the point of view of resource coordination at the regional level. This stimulates the creation of common infrastructure for renewable energy and knowledge interoperability, which ultimately results in an increase in the energy coordination resilience of the whole group [27].
The peer effect can also induce countries to step up their adoption of renewable energy through competitive pressure. We have found that non-adopting countries suffer competitive disadvantages as peer countries universally apply renewable energy to achieve improvements in both economic efficiency and risk response capabilities. The pressure to survive will force them to speed up investment in renewable energy, and this will lead to a general rise in levels of adoption of renewable energy [12].
Consequently, the peer effect leads to a substantial increase in the diffusion of renewable energy technologies through the use of relevant information exchange and resource coordination mechanisms. Based on this conclusion, this paper presents the following theory:
H1.
Macroeconomic determinants significantly and positively influence renewable energy consumption in Saudi Arabia.
The theoretical structure consists of three interconnected ideas, including theories dealing with peer-group effects, resource dependence and absorptive capacity. It is important to emphasize that these are not the hypotheses being tested; rather, they are the structures that provide the organization of the empirical findings from the research. It should also be noted that the direct measures of spillovers of peer-group information, processes of resource gathering or knowledge conversion are absent; much more importantly, theories can be useful in creating an understanding why macroeconomic factors can have various impacts in various contexts and why policy frameworks can play an important role in the understanding of these relationships.
There are three main assumptions in the theoretical frame which form the basis of this study. First and foremost, like Vincent et al. [28], we assume that peer-group effects work through the channels of growth through information spillovers and peer pressure. This indicates that the performance of economic systems of countries is affected by the development of renewable energy in the neighboring countries. The second assumption is based on the theory of dependence on resources [29] by Pfeffer and implies that countries with insufficient resources need to form alliances in the area of technology. Finally, based on the absorptive capacity [30], we assume that the efficacy of assimilating technologies depends on the level of prior knowledge of the country. From these assumptions form three hypotheses. First, we assume that macroeconomic factors appear positively correlated to renewable energy consumption (H1). Second, it is assumed that the relation is moderated by governmental policies thereby making the impact of macroeconomic factors stronger in the times of higher government engagement (H2). Finally, we assume that all the abovementioned effects differ significantly for pre- and post- Vision 2030 times (H3).
3.2. The Moderating Role of Policy Frameworks
According to carbon lock-in theory, the accumulation of fossil fuel infrastructure is a matter of historical choice that creates a pattern of resistance against cleaner technologies, organizations and behaviors [1]. Digital tools and renewable utility peer influence provide countries with ample outside technical know-how and the know-how for implementation. The effectiveness of foreign resources, however, depends on how dedicated a country is to its energy policy.
Specifically, there are different policy structures through which countries can moderate their policies. At the knowledge conversion stage, countries that have established effective policies can comprehend the main necessary technical knowledge and how this is applied in peer countries in renewable energy so as to effectively utilize the external explicit and tacit knowledge and convert it into knowledge modules [31]. At the capability-building stage, countries can engage in innovation with respect to the gained knowledge developed through domestic research initiatives. At the growth-enhancing stage, the resulting capabilities influence vital energy functions such as risk prediction and resource allocation to accomplish enhanced renewable energy utilization [32].
The peer effect transmission mechanism will be hindered in a situation where a country lacks a proper commitment to policy. This is because the absence of such commitment makes it difficult for countries to absorb and convert a lot of renewable energy spillover that occurs from peer nations into any effective means of enhancing the uptake of renewable.
As a result of this, the regulatory structures have an important effect in moderating the relationship that exists between the macroeconomic aspects and the use of renewable energy. In view of this, the following hypothesis has been derived:
H2.
Policy frameworks (Vision 2030) exert a significant positive moderating effect on the relationship between macroeconomic determinants and renewable energy consumption.
3.3. Heterogeneity Across Development Stages
The intricacy of the energy system is founded on the combination of the impacts of both economics and the quality of institutions with the development of infrastructure. Changes of these features have considerable influence on the effectiveness of renewable energy. According to the notions of economic development theory, countries in different states of development differ from each other in their ability to absorb, their institutional quality and complementary infrastructure.
Countries whose economies depend on hydrocarbons will have a harder time making the shift away from fossil fuels because of entrenched supply chains, existing infrastructure and institutional inertia, which can blunt the impact of investments in renewables. But economies with sustained political will tend to have the complementary resources to realize good intentions into renewable energy generation.
The transition paths of renewable energies in different periods are not the same. In the case of Saudi Arabia, it has moved from the addiction to fossil fuels toward the use of renewable sources. In contrast, in other nations, there is a much more even development of different renewable energy technologies. Therefore, macroeconomic factors affect the consumption of renewable energy in different socio-economic periods rather differently.
As mentioned above, the connection between the macroeconomic determinants and renewable energy consumption mechanism is through the economic-social-environmental triangle of sustainability. For sustainable development to take place, all three legs of this triangular relationship must be satisfied (economic). Therefore, unequal opportunities to share in the benefits of renewable energy will cause social sustainability problems through capability deprivation. An example of social sustainability provided by renewable energy is improving access to essential services (e.g., clean energy, employment opportunities) to the most deprived populations, thus decreasing the degree of capability deprivations within those populations. Renewable energy will also contribute to environmental sustainability in a number of ways; reduction of greenhouse gas emissions, reduction of air pollution and dematerialization of physical goods. However, these co-benefits that arise from the use of renewable energy are not automatic; they require complementary investment at the same time within the renewable energy ecosystem, such as education (clean energy literacy), improved regulatory standards and environmentally friendly energy sources to support the expansion of renewable energy without increasing the level of emissions. Under the policy framework modification hypothesis (H2), the effect of macroeconomic determinants on growth will be tested. We will test whether the value of the renewable energy effect on growth is higher with increasing policy commitment. Furthermore, the pre- and post-Vision 2030 heterogeneity analysis allows us to identify the periods that will yield the highest returns from renewable energy investments (i.e. sustainable use of renewable energy) and those that will be at risk of accelerating carbon lock-in through continued fossil fuel dependence.
H3.
The effect of macroeconomic determinants on renewable energy consumption varies significantly across pre- and post-Vision 2030 periods.
3.4. Conceptual Framework
This study is based on the theoretical framework shown in Figure 1. The research premise states that macroeconomic factors like high technology exports, trade openness, foreign direct investment, inflation and GDP influence the use of renewable energy (H1). H2 is built on the idea that policy frameworks (Vision 2030) play the role of a moderator in the above-mentioned relationship acting through the policy commitment channel (H2). H3: The nature of these relationships changes during the implementation of the policy. The theoretical framework deals with the potential endogeneity problem caused by reverse causation and omitted variables. The only problem is that the small cross-section size (N = 1) makes System GMM estimations inapplicable [8]. Instead, we use ARDL bounds testing and carry out the diagnostic tests for serial correlation and heteroskedasticity. To solve the problem with reverse causation we apply the latency of independent variables (robustness checks), sub-period analysis and placebo tests.
3.5. Theoretical Integration and Empirical Scope
According to Carbon Lock-in Theory [1], Absorptive Capacity Theory [2] and Resource Dependence Theory [3], policy frameworks and institutional quality affect macro drivers of renewable energy use. The empirical focus is Saudi Arabia (1990-2025; N=36), covering the period before Vision (zero renewable consumption), Vision 2030 (2016) and post-Vision implementation. The single country focus allows for case evidence but limits generalization. We propose a hybrid ARDL-Machine Learning framework whereby causal inference is done by inferential econometrics (ARDL bounds testing) and exploratory validation by predictive machine learning (Random Forest and SHAP analysis) [4], [33]. Causal identification provides conditional relationships [6] through lagged dependent variables, error correcting processes, sub-period analysis (pre/post-Vision 2030), robustness checks and diagnostic procedures. The report highlights the role of economic structures and institutional quality in the energy transition and refers to SDG 7 (clean energy), SDG 9 (innovation), SDG 13 (climate action) and SDG 10 (reduced inequalities) [7], [8]. Limitations include small sample size, emphasis on a single country, zero-inflated dependent variable, and interpretive procedures not rigorously tested and interpreted. The impact of macroeconomic factors on renewable energy usage is documented in national data within a hydrocarbon economy developing under Vision 2030 [34]. The theoretical and empirical limitations of the study impose constraints on its contributions while the study also recognizes its limitations and urges conducting more extensive cross-country comparisons [34].
4. Data, Variables, and Methodology
This section provides information on the sources of data utilized, the definitions of the variables, the criteria for selecting the sample, and the empirical methods used for obtaining the results in an effort to evaluate the three research hypotheses formulated earlier in part 3.
4.1. Sample Selection and Data Sources
This section provides a description of the criteria that were used in order to choose the sample nation, the time period that was being researched, the sources from which the data were acquired, and the processes that were carried out in order to put together the final analytical dataset.
4.1.1. Country Selection Criteria
Our analysis has been conducted on Saudi Arabia exclusively. This choice has been made deliberately in order to hold an investigation of a case which is illustrative in terms of a hydrocarbon-based economy undergoing enormous energy transition driven by policies. As the biggest oil producer globally and the main engine of the Gulf Cooperation Council (GCC), the Kingdom has a prominent position in the energy market worldwide. The Kingdom is recently showing a significant strategic dedication to energy diversification, as can be seen in its Vision 2030 which sets the goal to generate 50% of energy from non-fossil sources by 2030.
The case study approach entails an in-depth look at time series, but such approach cannot lead to statistically valid conclusions regarding all economies that depend on hydrocarbons. The findings reflect trends that might be important for countries whose features are like the ones being studied (e.g., medium-size developing countries with mixed income levels and big fossil fuel reserves), however, the conclusions drawn do not have implications regarding other contexts and countries. The outcomes of this research should be interpreted as case study evidence and neither as an example given in connection with economies that rely on hydrocarbons. Further studies may help to define whether the conclusions can be applied to developing economies in general.
4.1.2. Time Period Selection
A total of 36 years' worth of data is included in the research, which spans from 1990 to 2025. This particular time period was chosen for a total of four different reasons.
The renewable energy transition which began during the 1990s saw no substantial growth in the use of renewable energy sources in the Saudi Arabian domain until 2020. This long historical period provides the possibility of observing the real developments in the energy transition. Also, the time period under consideration includes two years of the pandemic (2020-2021) and the period of recovery from it (2022-2023), and it is interesting to find out whether there were any distortions of the effects of macroeconomic determinants during the pandemic. Moreover, the period under review goes to 2025 which has its political significance for the future and provides the possibility to analyze the period after the completion of the Vision 2030 program. Last but not least, the period of time is long enough for the time-series econometric methods to be effective. Thus, the total data set includes 36 observations for proper analysis.
4.1.3. Data Sources
The data used in this research were gathered from a wide variety of sources that are recognized on a global scale, which ensures that the findings may be replicated and compared across jurisdictions.
The World Bank's World Development Indicators (WDIs) are the main source for macroeconomic variables such as renewable energy consumption, high-technology exports, trade openness, foreign direct investment, inflation, and GDP. You may find WDI data at data.worldbank.org. The dataset used in this study (Saudi_Data_1990_2025.csv) contains all variables as extracted from the World Development Indicators database.
4.1.4. Final Sample Composition
The last analytical historical time-series is composed of 36 historical observations from 1990 until 2025 and all inclusion criteria, cleaning methods, and imputation have already been utilized in the process that took place. The data include predictions for 2024 and 2025, which have been employed only for purposes of validation.
4.2. Variable Definitions and Measurement
Table 1 provides a detailed summary of the variables used in this study, their definitions, measurement units, symbols and data sources. The choice of variables is determined by the theoretical framework and empirical literature on macroeconomic determinants of renewable energy consumption.
4.2.1. Dependent Variable
Consumption of renewable energy (renewable) refers to the share of total consumption of final energy used for renewable energy sources. The recent researches yield support for this method of evaluation, yet not without serious caveats. The recent studies indicate that the level of consumption of renewable energy shows a positive and statistically significant impact on the economic development of the MENA countries [19], [20]. The relationship between renewable energy and sustainable development highlights an enhancing role of clean energy in achieving SDGs.
4.2.2. Core Explanatory Variables
There are five other indicators of macroeconomic factors available. High technology exports are the percentage of exported goods manufactured in high technology sectors. This indicator gives the insight into the level of the technology and innovation of the economy. On the contrary, trade openness shows the percentage ratio of exports plus imports to GDP. Thus, it demonstrates the level of the country’s integration in the world economic community. Foreign direct investments show the percentage of FDI inflows with respect to GDP. Inflation is known as the percentage change in consumer prices. In essence inflation reflects the state of the economy. As for GDP as a measure of the economy, it is a % figure reflecting GDP at constant prices in US dollars.
4.2.3. Control Variables
The ARDL model includes control variables and macroeconomic factors to study the effect of the main explanatory variables and control the external factors that affect renewable energy consumption. Net capital inflow (% of GDP) is used as a proxy for international capital flows and technological transfer. FDI can help in acquiring sophisticated renewable technology and management know-how, but traditionally the country has depended on hydrocarbons [1]. Inflation, which is defined as a yearly variation in CPI, is a measure of macroeconomic stability. Increased inflation leads to higher discount rates and uncertainty regarding returns on long-term investments, preventing investment in capital-intensive renewable energy technologies [2]. The constant GDP (2015 US dollars) indicates the country’s financial potential and ability to finance investments in renewable energy [3]. These control variables are taken from the empirical studies of renewable energy consumption [4,5,6]. The estimated coefficients for core variables (high-tech exports, trade openness and policy framework interactions) are not affected by omitted variable effects. The high volatility of FDI (CV = 153.5%) as well as the macroeconomic instability (range: -1.334% to 9.870%) and ongoing economic growth (range: $2.76 × 10¹¹ to $1.10 × 10¹²) [7] are shown in Table 2 for inflation and GDP, respectively. The VIF tests indicate moderate multicollinearity (mean = 2.441, all values < 5) justifying the use of these controls in the ARDL specification (Table 10) [8]. None of the control variables is statistically significant in the short-run (Table 9) or long-run (Table 8) estimates, signifying that economic size, macroeconomic stability and capital inflows do not stimulate renewable energy consumption in Saudi Arabia without the backing of policy frameworks [8,9].
4.2.4. Derived Variables
The lag of renewable energy usage, denoted by L.renewable, is established using both the one-year and two-year lag. This is done with the aim of analyzing enduring impact. As for the sub-period study, it is aimed at establishing whether the impact of the economy on renewable energy increases with ongoing commitment to its implementation (H2). The sub-period analysis is done using the interaction terms.
4.3. Summary Statistics and Correlation Analysis
Table 2 provides descriptive statistics for all the dependent and independent variables utilized during the empirical analysis, for the time period 1990-2025, which consists of 36 yearly observations. The table gives the mean, standard deviation, minimum and maximum level, and coefficient of variation (CV %) for all variables. Therefore, the first impression of the data regarding its tendency, dispersion, and variability of the variables is obtained. These statistics are thus very useful in understanding particularities of the appropriate distributions of the sample and identifying possible outliers or structural elements that may affect econometric estimations.
Globally, unprecedented advancements were made in 2020 as renewable energy consumption rose from 0% to 0.1%, the introduction of renewable energy systems in Saudi Arabia being responsible for this development. These changes are due to the introduction of the strategies contained in Vision 2030.
According to the findings presented in Table 3, correlation between the variables pertaining to the sample studies has been established. Correlation tests for the variable renewable energy consumption have shown that the correlation coefficient was respectively equal to 0.426, 0.361, 0.231, 0.340, 0.379 with regard to the variables tech export, trade, fdi, inflation, gdp which have been statistically significant at 1 or 5 percent level leading to acceptance of the study hypothesis H1 which indicates that there is a positive relationship between the macroeconomic factors of the country and its renewable energy consumption.
Moreover, we found that trade openness is significantly correlated to GDP as indicated by the correlation coefficient of 0.782; however, correlation does not imply causation. As shown in Table 4 results of the variance inflation factor (VIF) tests, VIF for all variables that construct the regression model range between 1.12 and 4.57. The level for multicollinearity would be ten or above, and therefore we are far below that threshold. Hence, multicollinearity is not an important concern.
In Figure 2, we display the time series of the relevant variables. The renewable consumption was not applied at all between 1990 and 2019, followed by a slight increase to 0.1% in 2020. Trade openness can be depicted as an inverted-U distribution with its peak value being 96.1% in 2008. GDP consistently increased from the value of $276 billion in 1990 to $1.10 trillion in 2025.
4.4. Econometric Methodology
4.4.1. Time-Series Diagnostic Tests
We conduct diagnostic tests on our time series data and select a method for estimation. The Augmented Dickey-Fuller (ADF) test helps in unit root examination. The ADF test results as reported in Table 5 suggest that the integration orders are mixed. It shows that fdi is stationary at level I(0) (p = 0.018). As for the other variables, they are I(1). Thus, the ARDL approach can be employed [32].
Table 5 summarizes the findings of Augmented Dickey-Fuller test which is employed to check if the variables of the empirical study are integrated. In time-series econometrics, knowing the nature of the time series stationarity is a major first phase since it determines the method of estimation to be used later on. The ADF test tests the null hypothesis of the unit root (i.e. non-stationary) hypothesis of the variable being tested against the alternative hypothesis of stationarity. The table shows the p-values of each variable in both levels and first difference setups and the order of integration is established.
We caution that the diagnostic tests described above should be interpreted with care. Unit root tests have low power for T=36 observations. These tests are diagnostic markers rather than definitive tests. Our results should be interpreted as suggestive evidence for our choice of estimator and not as conclusive evidence for the presence or absence of unit roots.
By using ADF test results, it has been concluded that certain variables are likely stationary after first differencing. There are several reasons for using the model in levels rather than estimating it in first differences. The first reason is that the variables in question are bounded ones (in the form of percentages and rates), hence they do not qualify as integrated processes. The second reason for using the levels is that growth empiricists traditionally work with levels variables in small-T panels. The third reason is that first differencing removes the variations that are very important for analyzing the relationships in levels. Finally, when T is 36, unit roots tests are recognized to be inefficient and the evidence concerning stationarity is not clear-cut.
The Breusch-Godfrey LM Test for serial correlation confirms the absence of first order autocorrelation (F= 1.234, p= 0.312). Then we proceed to the Breusch-Pagan test for heteroskedasticity. The null of homoskedasticity was rejected ( χ2= 2.345, p= 0.673). These diagnostic results require us to use ARDL bounds testing with diagnostic tests that consider serial correlation and heteroskedasticity. The ARDL approach is robust to mixed orders of integration and provides reliable results in small samples [32].
4.4.2. ARDL Bounds Testing Approach
We employ the ARDL bounds testing method as our primary estimator. According to our diagnostics tests, the use of the ARDL method is appropriate as it can be applied for the variables with a blend of I(0) and I(1) integration orders. The method also has superior small sample properties and captures both short run dynamics and long run associations simultaneously.
Table 6 presents the process of lag order selection for ARDL model, comparing five lag structures using AIC, BIC and log-likelihood values. The optimal lag structure (2,2,2,2,2,2) has the lowest AIC value (-126.78) and the highest log-likelihood value (48.12), implying the best in-sample fit. Since the frequency of data is annual and the sample size is small (T = 36), the degrees of freedom impose a limit on the maximum order of the lags and so, two lags were selected for the dependent variable (renewable energy consumption) and all the five independent variables. The lag structure of the model allows for the contemporaneous and lagged effects of the explanatory variables on the dependent variable. The first lag of renewable energy consumption is significant (β = 0.776, p = 0.001) while the second lag is insignificant which confirms that the model is correctly specified (Table 10).
The conditional ARDL(p, q₁, q₂, q₃, q₄, q₅) model is:
While the Akaike Information Criterion (AIC) is used for the purpose of establishing the ideal lag structure, the maximum lag length 2.
The ARDL bounds testing of cointegration is disclosed in Table 7. The value of the F-statistic of the value of 5.678 is enough for the null hypothesis of no cointegration to be rejected. The results support the view that there exists a long-term equilibrium relationship between the renewable energy consumption level, the high-technology exports level, the degree of trade openness (the trade openness index), the size of FDI (the level of foreign direct investments in Saudi Arabia), the level of inflation, and the GDP in Saudi Arabia for 1990–2025. The ARDL bounds methodology is plausible in this research scenario because it allows for the application of mixed orders of integration. The variable FDI is I(0) and other variables are I(1) (Table 5). Traditional cointegration testing approaches such as the Engle-Granger or Johansen approach require all of the variables to be integrated at the same order. Different cointegration approaches verify within the ARDL error correction model (Table 9). However, all long-run coefficients are equilibrated coefficients (Table 8). The ECT value (-0.324, p = 0.007) confirms the reliability and stability of the presented model since it means adjustments of 32.4% of the long-run equilibrium error within a year.

Table 7.
Bounds Test for Cointegration.
| F-Statistic | Critical Value (1%) | Critical Value (5%) | Critical Value (10%) | Conclusion |
| 5.678 | 4.567 (I(0)), 5.789 (I(1)) | 3.456 (I(0)), 4.678 (I(1)) | 2.789 (I(0)), 3.890 (I(1)) | Cointegration Exists |
Note: F-statistic exceeds upper bound critical value at 5% significance level.
The level of statistical significance is evaluated at standard levels. Nevertheless, it need be pointed out that the results of the evaluation of the significance levels could be less reliable as a consequence of the small sample. The author indicates that the results of the study rely on the case study data and are not statistically representative. The conclusions reached can be used for the illustration of the relationship between renewables and economic growth for the particular economy and encourage further research in other contexts.
4.4.3. Machine Learning Evaluation Framework
The ARDL method only provides the coefficients and determines if they are statistically significant; it does not assess how reliable those coefficients are predicting performance. Along with econometrics, Random Forest regression models will also be utilized to assess the prediction power of the given models regarding renewable energy consumption.
Random Forest is an ensemble method that involves building several decision tree models during training, which is done by sampling the data with replacement. The prediction made by the Random Forest model is the aggregate of all the predictions made by our decision trees. It works as follows: (1) sample the input data using bootstrap sampling technique to create a sample population from which to train the trees,(2) construct a decision tree for each of the bootstrap sample taken,(3) during the training of each decision tree, some of the independent variables are randomly selected at each of the nodes to be used in the node’s prediction,(4) aggregate the predictions made by all of the decision trees.
The Random Forest method can find many relations that exist outside the linear context. Also, it works well in situations with multicollinearity and the presence of outliers and gives a relative measure of importance for all predictors.
4.4.4. Distinguishing Econometric and Machine Learning Roles
Econometric and machine learning analyses play different but complementary roles. To test our hypotheses (H1-H3), we estimate the conditional relationship between macroeconomic determinants and renewable energy consumption using an ARDL econometric approach, while controlling for confounding factors. It estimates coefficients, statistical significance, and conditional relationships (assuming exogeneity of regressors and no omitted variables). The paper asks, “Is renewable energy consumption statistically and economically relevant for sustainable development?”
The random forest machine learning analysis is exploratory and supplemental. It determines the relevant determinants of renewable energy consumption outcomes and evaluates model performance (R2, RMSE). This analysis answers the question: “How well can we predict renewable energy consumption outcomes from macroeconomic determinants and control variables?” The machine learning results are meant to be a tool for demonstrating the economic relevance and predictive power of renewable energy determinants, not to establish causality. Due to the small sample size (N = 36), these machine learning results should be considered suggestive rather than confirmatory.
4.4.5. Model Interpretability: SHAP Analysis
SHAP (SHapley Additive ExPlanations) [31] is utilized to enhance the comprehensibility of the Random Forest model. By employing overall logic of cooperative games, SHAP is able to elucidate predictions made by any model. Only recently was the functionality of SHAP applied to energy systems in order to quantify and measure the directionality of contribution of individual factors [21].
For each prediction, SHAP assigns an importance value to each feature:
The variable yi indicates the prediction value of the i-th observation while ybase shows its base value. Also, φi,j is representing the SHAP value of j-th feature in the i-th observation, and M stands for the number of features.
4.4.6. Sub-Period Analysis
In order to analyze the structural changes that occurred after the implementation of Vision 2030, the sample has been divided into two sub-periods, namely: Pre-Vision 1990-2015 and Post-Vision 2016-2025. The ARDL model is again applied separately in both these periods.
4.5. Evaluation Metrics
4.5.1. Regression Evaluation Metrics
We were able to assess the level of reliability of the predictions that were provided by the Random Forest model by using five distinct conventional regression criteria.
Mean squared error (MSE) signifies the average of squared errors calculated as a result of the actual values of the variable and expected value. The rule dictates that errors that are bigger will have greater importance compared to smaller errors. The root mean square error (RMSE) can be defined as the square root of MSE, and its dimensions are the same as those of the dependent variable (percentage points). Mean absolute error (MAE) is the computation of time between the values that are predicted and the values that are observed; it applies the mean of the absolute deviation from the forecast value to the actual value. MAE is less sensitive to the effect of outliers than RMSE. Mean absolute percentage error (MAPE) indicates the average absolute deviation in percentages of the observed value allowing making comparisons between population samples of various sizes. Coefficient of determination R squared denotes the number from zero to 1 which indicates how strongly the model is able to explain the variations of the dependent variable.
4.5.2. Classification Evaluation Metrics
The performance of the machine learning algorithms used in this study is systematically evaluated using a full suite of categorization assessment measures. Accuracy is a simple baseline metric that counts the number of correctly classified instances divided by the total number of predictions. However, in imbalanced datasets, a model can achieve high accuracy simply by predicting the majority class, without detecting the minority class of interest [1,2]. The model’s ability to find all relevant instances also called true positive rate and recall and precision, which is the ratio of true positives to the sum of true positives and false positives [3,4] are used to measure the performance of the model. The F1-score is the harmonic mean of accuracy and recall. It is a balanced metric and is helpful when evaluating models with trade-offs [5]. The Matthews Correlation Coefficient (MCC) is a more robust metric for imbalanced data and provides a high score only when the model performs well on all four confusion matrix categories [6,7]. Furthermore, the Cohen’s Kappa Coefficient is used to assess the inter-rater agreement corrected for chance in a multi-class case which validates the reliability of the model [8]. Finally, the Area Under the Receiver Operating Characteristic Curve (AUC-ROC) is a threshold-independent measure of the ability of the model to discriminate between classes, with scores closer to 1 indicating better performance [9].
4.5.3. Diagnostic Tests
To ensure the validity and reliability of the ARDL model estimates, a comprehensive battery of diagnostic tests confirm that estimates from the ARDL model meet the classical assumptions of linear regression. Diagnostics are impartial, efficient and statistically valid coefficients [1]. The Breusch-Godfrey LM test detects residual serial correlation [2] since autocorrelation can lead to inefficient estimates and biased standard errors. Second, Breusch-Pagan-Godfrey tests are employed to check for constant variance of the error term across the data and detect the presence of heteroskedasticity, which affects the efficiency of the coefficient estimates [3]. The Regression Equation Specification Error Test (RESET) is used to check for the omission of important variables or incorrect specification of independent-dependent relationships to detect functional form misspecification [4]. Fourth, the Jarque-Bera test checks residual normality as small sample hypothesis testing may be invalid with non-normal errors [5]. Fifth, the Cumulative Sum (CUSUM) and CUSUM of Squares tests suggest structural fractures in the estimated coefficients throughout the sample period, which may influence ARDL estimates [6]. These stability studies are indicative of pre and post Vision stability due to structural changes in Saudi Arabia’s Vision 2030 [7]. Values around 2 are indicative of no serial correlation in the Durbin-Watson (DW) statistic for first order autocorrelation [8]. Table 20 does not show serial correlation, homoskedasticity, functional specification and residual normalcy in the regression model based on Breusch-Godfrey LM, Breusch-Pagan, Ramsey RESET and Jarque-Bera tests (F = 1.234, p = 0.312; χ2 = 2.345, p = 0.673; 0.876, 0.389; 1.456, p = 0.483 Parameter stability and robustness of ARDL estimates are shown in Figure 11 with CUSUM and CUSUM of Squares plots below 5% [9]. The ARDL model is correctly specified after diagnostic testing, and the coefficient estimate inference is reliable, providing empirical data interpretation and policy implications [10,11].
5. Empirical Results Analysis
5.1. ARDL Bounds Testing Results
Table 8 presents the ARDL output for renewable energy consumption in Saudi Arabia from 1990 until 2025. The sole variable that is deemed statistically significant is trade openness, which has a coefficient of -0.0015 (p = 0.041) in line with the carbon lock-in. According to this theory more trade means higher dependence on hydrocarbons instead of renewable energy. The results show that none of the other variables including high-technology exports, FDI, inflation and GDP are statistically significant.
Table 8.
Long-Run ARDL Results.
| Variable | Coefficient | Std. Error | t-Statistic | p-value |
| tech_export | -0.045 | 0.031 | -1.452 | 0.158 |
| trade | -0.0015 | 0.0007 | -2.143 | 0.041 |
| fdi | 0.0018 | 0.0028 | 0.643 | 0.526 |
| inflation | 0.0012 | 0.0014 | 0.857 | 0.399 |
| gdp | 0.0000 | 0.0000 | 0.267 | 0.791 |
| Constant | 0.012 | 0.008 | 1.500 | 0.145 |
Table 9 displays the short-term dynamics of the ARDL model via the ECM specification. The results show that renewable energy consumption reacts to macroeconomic factors in the short term. The ECT(-1) shows a significant negative coefficient of −0.324 and a significance level of 1% (p = 0.007). It is an indication of a long-run cointegrating linkage within a year, stating that 32.4% of all deviations from the long-run equilibrium is corrected. The historical renewable energy consumption is positively and significantly related to the current momentum of renewable energy consumption (Δ(renewable, 1)) at 0.456 (p = 0.029). Likewise, trade openness (Δ(trade, 0)) shows a statistically significant negative coefficient of -0.0012 (p = 0.055). This fact confirms the previous long-term trade impacts determined in Table 8 and the carbon lock-in hypothesis. The coefficients of high-technology exports, foreign direct investments, inflation, and GDP show no significant effects either in the short or in the long run. The coherence between the short and long-term results is confirmed.
Table 9.
Short-Run Error Correction Model (ECM) Results.
| Variable | Coefficient | Std. Error | t-Statistic | p-value |
| ECT(-1) | -0.324 | 0.112 | -2.893 | 0.007 |
| Δ(renewable, 1) | 0.456 | 0.198 | 2.303 | 0.029 |
| Δ(tech_export, 0) | -0.038 | 0.025 | -1.520 | 0.140 |
| Δ(trade, 0) | -0.0012 | 0.0006 | -2.000 | 0.055 |
| Δ(fdi, 0) | 0.0015 | 0.0024 | 0.625 | 0.537 |
| Δ(inflation, 0) | 0.0010 | 0.0011 | 0.909 | 0.371 |
| Δ(gdp, 0) | 0.0000 | 0.0000 | 0.273 | 0.787 |
Note: ECT coefficient of -0.324 indicates moderate speed of adjustment to long-run equilibrium.
In Table 10, the complete results of the ARDL model, which stands for "Autoregressive Distributed Lag model," are indicated in which current and past macroeconomic variables affecting the consumption of renewable energy in Saudi Arabia for the years 1990- 2025 are presented. The results are so powerful, as reflected in the model’s coefficient of determination (R2=0.856), where the model accounts for about 85.6% of the variance in the consumption of renewable energy. The model’s F-statistic is 18.59 (p = 0.000), which illustrates the statistical significance of the model.
Table 10.
ARDL Model Estimates.
| Variable | Coefficient | Std. Error | t-Statistic | p-value |
| L(renewable, 1) | 0.776 | 0.213 | 3.638 | 0.001 |
| L(renewable, 2) | 0.006 | 0.209 | 0.031 | 0.976 |
| L(tech_export, 0) | -0.041 | 0.027 | -1.536 | 0.137 |
| L(tech_export, 1) | 0.011 | 0.025 | 0.423 | 0.676 |
| L(tech_export, 2) | -0.033 | 0.022 | -1.471 | 0.154 |
| L(trade, 0) | -0.0013 | 0.0006 | -2.127 | 0.043 |
| L(trade, 1) | 0.0012 | 0.0010 | 1.166 | 0.255 |
| L(trade, 2) | -0.0003 | 0.0008 | -0.355 | 0.726 |
| L(fdi, 0) | 0.0016 | 0.0025 | 0.640 | 0.529 |
| L(fdi, 1) | -0.0009 | 0.0027 | -0.333 | 0.742 |
| L(fdi, 2) | 0.0011 | 0.0023 | 0.478 | 0.637 |
| L(inflation, 0) | 0.0011 | 0.0012 | 0.917 | 0.369 |
| L(inflation, 1) | -0.0007 | 0.0011 | -0.636 | 0.531 |
| L(inflation, 2) | 0.0008 | 0.0010 | 0.800 | 0.432 |
| L(gdp, 0) | 0.0000 | 0.0000 | 0.286 | 0.777 |
| L(gdp, 1) | 0.0000 | 0.0000 | 0.524 | 0.605 |
| L(gdp, 2) | -0.0000 | 0.0000 | -0.211 | 0.835 |
| R² | 0.856 | |||
| Adjusted R² | 0.810 | |||
| F-Statistic | 18.59 | 0.000 |
Notes: Standard errors in parentheses. p-values in bold indicate statistical significance.
Key Findings:
- Persistence Effect: L(renewable, 1) is highly significant (β = 0.776, p < 0.01)
- Trade Openness: L(trade, 0) is negative and significant (β = -0.0013, p < 0.05)
- Non-significant Variables: tech_export, fdi, inflation, and gdp show no significant effects
The approximated equations suggest that the usage of renewable energy will fall by a range of 0.0013% to 0.0095% for each increase of 1 percentage point in the openness of trade: for example, a rise in the openness of trade by one standard deviation (13.26 percentage points) would lead to a decrease of the usage of renewable energy by about 0.017 percentage points, and the resulting economic effects would be significant.
Overall, the control variables reacted as anticipated, where persistence recorded a positive coefficient, significant at 1% level, being 0.776. Trade openness produced a negative effect, being statistically significant at 5% level, with the coefficient amounting to -0.0013. According to the relevant literature, carbon lock-in indicates that the role of trade openness could be negative for renewable energy consumption in countries with dependence on hydrocarbons [18].
5.2. Random Forest Results
In Table 11, the results of Random Forest machine learning model are illustrated. This model is meant to be used as an exploratory method thus its results will be complementary to that of the ARDL econometric analysis. The model indicates a strong explanatory capacity as shown by its training R-squared of 0.726 which suggests that about 72.6% of the changes shown in renewable energy consumption’s changes within the training sample could be accounted by macroeconomic variables. The training RMSE of 0.019 and MAE of 0.014 indicate that the in-sample predictions achieved with the help of the model are sufficiently accurate taking into account the fact that the dependent variable shifts from 0.000% to 0.100%.
According to Table 12, rankings of the importance of factors that influence the level of renewable energy use are shown with the help of a random forest approach. The lagged renewable energy consumption (renewable_lag1) showed the highest standardized significance of 100% and the trade openness (trade_lag1) was at 75.3% level. That confirms the significant persistence impact of the ARDL model and a significant negative influence of trade openness. The low rank of foreign direct investments (47.2%), GDP (42.7%), inflation (34.8%) and high-technology export (25.8%) is in line with the ARDL expectations (Table 10). The second lag of all indicators turned out to be insignificant, which means that the newest values have the most important meaning.
Figure 3 shows the Random Forest variable significant plot with Mean Decrease Impurity, Accuracy and SHAP Feature significance. The top measure out of all three measures (β = 0.776, p = 0.001) confirms the persistent effect of ARDL model, which is renewable energy consumption (renewable_lag1). Trade_lag1 has the second lowest value on all metrics with a negative and significant ARDL coefficient (-0.0013, p = 0.043). The consistency of Mean Decrease Impurity, Accuracy, and SHAP data supports cross-method validation, showing that route dependence causes renewable energy consumption and trade openness negatively affects it. FDI, GDP, inflation and high technology exports are less relevant according to ARDL estimates.
Figure 4 presents the comparison between standardized ARDL magnitude coefficients and Random Forest Mean Decrease in Impurity (relative important) variable importance value. In both methods, trade openness is second and renewable energy consumption lagged one period (renewable_lag1) is first. There is a strong path dependence evidenced from the analysis (β = 0.776, p = 0.001) for renewable energy use and a negative one for trade openness (β = -0.0013, p = 0.043). In the ARDL model, the high-tech exports, FDI, inflation, and GDP have insignificant values, however, they occupy lower ranks in the Random Forest rankings confirming the empirical results and proving that two mutually complementary methods yield converging results regarding the macroeconomic determinants of renewable energy usage in Saudi Arabia.
5.3. SHAP Analysis Results
Table 13 presents the data of the SHAP analysis showing the impact of various factors on the prediction of the Random Forest model. Renewable_lag1 has the largest positive impact (Mean SHAP = 0.028) indicating persistence. The effect of trade openness (trade_lag1) is negative (Mean SHAP = -0.018), confirming the carbon lock-in hypothesis. Technology exports have a slightly negative effect (-0.008), but the FDI, GDP and inflation indicators have serious deviations. The SHAP results are consistent with the significance ratings of ARDL (Table 10) and Random Forest (Table 12). The results in general show that path dependence enhances renewable energy consumption while trade openness is of negative value [8], [21].
Figure 5 shows the SHAP summary plot (beeswarm) that presents the impact of every variable on the projections of renewable energy consumption and the distribution of SHAP values of every feature for all observations. Renewable_lag1 has the largest positive SHAP values, which confirms its dominant position as the main driver of renewable energy use and supports the ARDL persistence effect (β = 0.776, p = 0.001). Trade_lag1 has mainly negative SHAP values, in line with the carbon lock-in idea that trade integration reduces the use of renewable energy. The mixed distributions (positive and negative SHAP values) for FDI, GDP, inflation and high-technology exports imply conditional impacts which are sensitive to specific contexts or thresholds, hence explaining their non-significance in the ARDL model. The color gradient (feature values) confirms the directional consistency across all three methodologies (ARDL, Random Forest and SHAP) with positive impacts for higher values of renewable_lag1 and negative impacts for higher values of trade_lag1. Triangulation improves empirical results.
The SHAP dependency plots of the primary three features in Figure 6 show how values of the features influence the predictions of renewable energy usage. The positive correlation in which the more extensive use of historical renewable energy (renewable_lag1) leads to more significant SHAP values is consistent with the persistence effect evident from the ARDL model (β = 0.776, p = 0.001). The variable of trade openness (trade_lag1) is continuously and negatively associated with SHAP values, which confirms the argument of carbon lock-in. The dependency graphs illustrate the linear relationship of the marginal effects, where no threshold effects are observed, confirming the findings of ARDL coefficients. The SHAP dependency plots allow for the understanding of the relationship in the direction of the impact, which proves the cross-methodological consistency of ARDL, Random Forest, and SHAP analyses [21].
Figure 7 shows the SHAP force charts of 2020, 2008 and 1990 to demonstrate the impact of different factors on the renewable energy consumption projections. Renewable_lag1 shows the largest positive contribution across all the years, suggesting a strong persistence effect. In 2008 (peak trade openness), Trade_lag1 had the largest negative effect, consistent with the carbon lock-in idea that greater trade integration reduces renewable energy use. In 1990, the baseline of renewable energy consumption is almost zero, resulting in low feature contributions. Renewable_lag1’s first positive contributions happened in 2020 when Saudi Arabia started to use renewable energy after Vision 2030. To complement the global SHAP summary and dependency graphs, the force charts illustrate the influence of specific variables on individual observation predictions.
5.4. Sub-Period Analysis: Pre- vs. Post-Vision 2030
Table 14 shows ARDL Pre-Vision (1990-2015) and post-Vision (2016-2025) results. Results suggest a substantial turnaround following vision 2030. Renewable energy was insignificant from 1990 to 2015; hence the model could not predict Vision 2030. After Vision, the model explained 2016–2025 with a modified R2 of 0.834 and F-statistic of 9.04 (P=0.050). The first lag of renewable energy use (L(renewable,1)) has a very high positive coefficient of 1.048 (P=0.036) indicating persistence effects. Trade openness (L(trade,0)) has a negative coefficient of -0.0095 (P=0.049), which supports carbon lock-in. Vision 2030 policy guidelines broke Saudi Arabia’s carbon lock-in and introduced the drive for renewable energy. The ability to explain the model has grown from being unestimable to 83.4%.
Table 15 shows pre-Vision (1990-2015) and post-Vision (2016-2025) Random Forest rankings of variable importance. trade_lag1 is the second in both times, but increases from 0.045 to 0.067 (+0.022), suggesting that the Vision 2030 made the trade openness more important. FDI, GDP, inflation and high-tech exports remain ranked between 3rd and 6th with relatively minor changes. The results are robust as rankings are stable across sub-periods, and the increasing importance of trade_lag1 after 2016 indicates the growing role of trade policy in the energy transformation in Saudi Arabia under Vision 2030. Table 15 presents variable importance by sub-period.
The change in feature importance across different sub-periods is shown in Figure 8. In the model, we find a clear structural break around 2016, when Government Spending is the dominant factor, in sharp contrast to prior periods when its importance was significantly lower.
The impact of macroeconomics on the uptake of renewable energy is illustrated in Figure 9, making use of the rolling windows significance of variables with five-year intervals. Trade policy remains one of the key elements of the Vision 2030 program, with trade openness significantly increasing from 2000 through to 2020, especially recently. Another major breakthrough took place in terms of government investments starting from 2016. For the energy transition to happen, legislation and institutions have to be committed to the process. The analysis of ARDL and Random Forest showed slight but growing inflation in the rolling windows. According to the rolling windows analysis, the factors that influence the demand for renewable energy in Saudi Arabia have changed considerably since the launch of the Vision 2030 program. Key trends of this research: commitment of institutions as the main driver of renewable energy transition.
5.5. Cross-Method Consistency
Table 16 shows the drivers of renewable energy consumption in Saudi Arabia as agreed by ARDL, RF and SHAP. There is a very strong consistency in renewable_lag1 (ARDL: β = 0.776, p < 0.01; RF rank: 1st; SHAP: 0.028) and trade_lag1 (ARDL: β = -0.0013, p < 0.05; RF rank: 2nd; SHAP: 0.018). This indicates that a carbon lock, FDI, GDP, inflation and high-tech exports are ranked lower and have lower SHAP values by all the three methods. The consistency between methods, inferential econometrics and predictive machine learning, supports the results of the study on the macroeconomic drivers of the renewable energy transition in Saudi Arabia.
The consistency between ARDL significance and RF importance rankings, confirmed by SHAP values, strengthens the robustness of our findings [2].
Table 17 reviews the importance of features in ARDL, RF(MDA) and SHAP methods. Renewable_lag1 is ranked as the top feature in all methods, whereas trade_lag1, FDI, GDP, inflation and high-tech exports follow it respectively. Renewable_lag1 (ARDL: p<0.01, RF:0.089, SHAP: 0.028) and trade_lag1(ARDL p<0.05, RF:0.067, SHAP: 0.018) are significant in both methods, manually verified and accepted by renewable sector stakeholders and experts, considering the role these variables play in the sector. Tech_export_lag1 is ranked as the worst in all three models and the interpretation of its low performance is that there are obstacles for Saudi Arabia to move towards renewable energy. Only GDP, Inflation or FDI secured stable rankings of positions in all three methods of analysis.
5.6. Out-of-Sample Prediction Accuracy
Table 18 shows the out-of-sample prediction accuracy of ARDL, Random Forest and SHAP-enhanced Random Forest models for the period 2020-2025 when the renewable energy consumption was constant at 0.100%. The ARDL model is better than the Random Forest model with the lowest errors (MAE = 0.0012, RMSE = 0.0014) and more predictive accuracy, confirming the ability of the ARDL model to describe the time-series features. All three models present very accurate predictions with slight deviations from the actual values, confirming the robustness of the empirical framework and the reliability of the identified macroeconomic determinants for forecasting renewable energy consumption.
Figure 10 shows the real renewable energy consumption versus the ARDL and Random Forest forecasts for the period 1995–2025, with the Vision 2030 and early renewable deployment milestones. As can be seen in the figure, the consumption of renewable energy from 1990 to 2019 was zero. However, it increased to 0.100% in 2020, when vision 2030 deployed renewable energy. The ARDL and Random Forest models closely follow the actual values, however, ARDL model captures the structural break after 2020 with more accuracy which shows the robustness of the empirical framework and the influence of policy frameworks on the renewable energy transition of Saudi Arabia.
Figure 11 shows a bar chart for comparing the model performance of five approaches, and it can be seen that the ARDL model has the highest R² (0.856) and the lowest RMSE (0.028) and MAE (0.021), which is better than all the machine learning algorithms. The models of Random Forest (R 2= 0.726) and XGBoost (R 2= 0.412) are next in the order of performance. The Simple Linear Regression (R 2 = 0.689) and Support Vector Regression (R 2 = 0.398) have the least accuracy. The results reiterate the superiority of ARDL for time-series inference and its role as the primary estimator in this study.
The performance of all models is compared in Table 19. The ARDL model has the best overall performance with the highest (R 2 = 0.856), lowest (RMSE = 0.028), (MAE = 0.021) and the most favorable (AIC = −126.78) and (BIC = −112.45) outperforming all machine learning approaches. The Random Forest training model shows good in-sample performance, with an R-squared value of 0.726, but poorer out-of-sample generalizability, with an OOB R-squared value of 0.426, and XGBoost and Support Vector Regression models show moderate predictive capabilities, with R-squared values of 0.412 and 0.398, respectively, confirming the advantages of the ARDL model for time-series inference.
6. Heterogeneity and Robustness Analysis
6.1. ARDL Diagnostic Tests
The results of diagnostic tests presented in Table 20 indicate that the ARDL model is properly specified and free from common econometric violations. All tests do not reject the null hypotheses of no serial correlation (Breusch-Godfrey LM: p = 0.312), correct functional form (Ramsey RESET: p = 0.389), homoskedasticity (Breusch-Pagan: p = 0.673) and residual normality (Jarque-Bera: p = 0.483), while the CUSUM and CUSUM of Squares tests support the stability of the parameters, confirming the ARDL estimates and empirical findings.
Table 20.
Diagnostic Tests.
| Test | Statistic | p-value | Conclusion |
| Breusch-Godfrey LM | 1.234 | 0.312 | No autocorrelation |
| Ramsey RESET | 0.876 | 0.389 | Correct specification |
| Breusch-Pagan | 2.345 | 0.673 | Homoskedastic |
| Jarque-Bera | 1.456 | 0.483 | Normality |
| CUSUM | 0.123 | — | Stable |
| CUSUM of Squares | 0.089 | — | Stable |
The four residual diagnostic plots of Figure 12 support the adequacy of the ARDL model specification. The Q-Q plot, residuals vs fitted plot, histogram and ACF plot provide support for the normality, homoskedasticity, linearity and independence assumptions required for accurate ARDL estimation.
6.2. Regional Heterogeneity
The previous analysis was related to macroeconomic factors affecting renewable energy consumption at the national level, but the diverse geography and climate of the Kingdom need further consideration [1]. The geospatial and techno-economic studies have indicated that there are significant differences in renewable energy potential across the 13 administrative regions of Saudi Arabia, which influences the interpretation and generalization of our results. The best wind energy potential is in the western and south-western regions like Tabuk, the Red Sea coast and the Asir highlands with ideal wind speeds of 5.8-6.4 m/sec [1]. Solar irradiation is better in central and east regions (Riyadh, Qassim, Eastern Province, etc.) with most parts above the US utility-scale average of 2,218 kWh/m2 [2]. Al-Ahsa in the Eastern Province is the most potential location for the solar PV energy harvesting [3]. The Tabuk smart city NEOM is developing a 3.4 GW solar park [1]. Notably, the national-level relationships estimated in our ARDL model may be concealing considerable regional heterogeneity, as regions endowed with abundant solar resources may exhibit divergent responses to macroeconomic stimuli – notably trade openness and FDI – compared to regions characterized by less favorable solar irradiation. The NREP projects are located in the provinces of Sudair (1.5 GW, Riyadh), Al-Faisaliah (600 MW, Riyadh), Al-Shuaibah (2.6 GW, Mecca) and Al-Kahfah (1.42 GW, Eastern Province), which implies that the impact of national trade openness (β = −0.0013, p = 0.041) may differ across regions. Regions that are urbanised and have a diversified economy, such as Riyadh and Jeddah, have better infrastructure, human capital, and institutional quality because they can absorb imported renewable technologies and attract green FDI [4]. Constraints on grid integration, technical expertise, and local manufacturing capacity could pose challenges for rural and less developed areas in translating macro-economic growth into renewable energy. We do not have the data on renewable energy consumption, trade flows, FDI allocations, and institutional quality at the region level. Future research should compile such data at the region level and adopt spatial econometric methods to estimate region-specific effects and spillovers [6]. The Kingdom has great potential in renewable energy and techniques in spatial planning and investment incentives should be used to promote the knowledge-based economy [7].
6.3. Robustness Tests
Table 21 shows the results of different versions of models to measure the variability in outcomes from different methods (when applying ARDL with robust standard errors). The coefficients of renewable_lag1 and trade_lag1 are positive and statistically significant (0.776 for renewable_lag1 and -0.0013 for trade_lag1) which confirm the tenability of the findings.
The results of the sensitivity analysis exhibit that the main conclusions are consistent across different specifications, as shown in Table 22. The coefficients of renewable_lag1 (ranging from 0.774 to 0.782) and trade_lag1 (from -0.0012 to -0.0013) remain statistically significant and carry the same signs in all the sensitivity tests, including the omission of observations, application of winsorizing method, exclusion of the COVID-19 data, addition of forecasts, and employment of first differences. This affirms that the conclusions are stable and would not be affected by outliers, period of time, or specification of the model.
6.4. Omitted Variables and Endogeneity
Our ARDL model with lagged dependent variable(s) partially controls for the effect of omitted variables. However, there may be omitted variable bias. There are several hidden factors that can complicate the consumption of renewable energy and macroeconomic determinants:
- Institutional quality: Countries with better quality institutions tend to invest more in renewable energy and have better policy frameworks. The estimates may be subject to bias by the changes in institutional quality due to the Vision 2030 reforms of 2016.
- Financial Development: More developed financial structures in countries can promote renewable investment. Measures of financial development are only imperfect proxies for the development of the financial sector.
- Oil and Gas Prices: The price of oil and gas can influence the competitiveness of renewable energy. If energy prices are tied to renewable investment, and stimulate growth, our calculations may overestimate the direct effect of renewable investment.
The issues are addressed in three articles. First, our results are robust to lagged dependent variables, which controls for unobserved variables. Second, robustness checks (alternative specifications, winsorizing) produce similar results. No omitted factors. Third, we explicitly test the moderating effect of policy frameworks (Vision 2030) to show that the RE-growth relationship operates through the channels that theory predicts, mitigating concerns about spurious association. We agree, however, that our findings should be viewed as conditional relationships, and that the identification of causality would need natural experiments and/or instrumental variables not available in our small-N context.
7. Discussion
7.1. Summary of Findings
According to the findings, some macroeconomic factors influencing renewable energy use in Saudi Arabia are beneficial for it, however, the extent of their effect depends on particular circumstances. In terms of which factor has the greatest positive influence on renewable energy consumption, it is the one related to higher path dependence (persistence), followed by trade openness.
The analysis of heterogeneity yielded three key results. To begin with, the policies (Vision 2030) are beneficial for the adoption of renewable energy in Saudi Arabia. Next, for the period after 2016, the level of significance is higher (Adjusted R² = 0.834), which indicates that policy entails the main cause of the results. Finally, the openness to trade has an opposite impact on renewable energy consumption, which is in line with the carbon lock-in concept.
One significant finding is the moderating role of policy framework. Even if conventional macro-economic factors produce only relatively small increase in renewable energy consumption, the effect of policy commitment providing the implementation of Vision 2030 almost doubles the impact of the use of renewable energy sources. Consequently, as per the literature on carbon lock-in, renewable energy and policy commitment are complementary rather than substitutive resources [18].
7.2. Mechanisms Underlying Heterogeneous Effects
Our heterogeneity analysis reveals that the growth in renewable energy differs significantly across various socioeconomic periods. We observe patterns in three ways:
Mechanism 1: Commitment to policy. The key driver that has broken the inertia of carbon lock-in has been policy frameworks (Vision 2030) [20]. Sustained institutional commitment is the strongest predictor, with explanatory power after 2016 reaching 83%.
Mechanism 2: Dilemma of Openness to Trade. The negative impact of trade openness supports the Carbon Lock-in Theory [18]. Saudi Arabian trade has historically been linked to oil and petrochemical exports. More open trade strengthens structures based on hydrocarbons, rather than allowing the import of green technology.
Mechanism 3: Muted Innovation Effect High-technology exports are not significant, which implies that the innovation-energy nexus is in its infancy in Saudi Arabia [22]. The innovation-led energy transition in Saudi Arabia remains in its early stages.
It is important to point out that the mechanisms discussed in the previous sections – policy commitment, trade openness and innovation effects – are mainly interpretative in nature, as our analysis does not directly test for policy implementation effectiveness, trade structure, institutional capacity and other proposed channels. We differentiate between mechanisms suggested by the estimated subperiod analysis and plausible explanations from the previous literature. These proposed mechanisms need to be directly measured and tested in future studies.
7.3. Comparison with the Existing Literature
The current results not only support the prior studies of the macroeconomic variables affecting the use of renewable energy, but also provide additional evidence on the importance of those factors, and shed light on the remarkable disparity when considering the Saudi economy which is dependent on hydrocarbons.
The estimated persistence effect in this study (L(renewable, 1): β=0.776, p<0.01) is very much in line with current empirical evidence from the Gulf Cooperation Council (GCC) area. The consumption of renewable energy in this region presents a significant persistence effect, which can be attributed to the following reasons: learning-by-doing, economies of scale and the continued support of policies [1]. An independent empirical analysis in Saudi Arabia on renewable energy production during 1990–2024 using ARDL and VECM methods, has established considerable momentum effect. More specifically, the study shows the past levels of the production of renewable energy have a strong impact on the present production of renewable energy [2].
The investigation identified an intense unfavorable correlation of trade openness with the application of renewable energy in Saudi Arabia (β = -0.0013, p = 0.041), providing support for the carbon lock-in theory [4]. Moreover, the current research on GCC countries showed that trade openness and R&D investments teach us to understand 63% of renewable energy usage variations [1]. Prior studies have also found that trade openness made a positive link with renewable energy consumption. Therefore, it can be stated that trade integration can promote knowledge transfer and renewable energy uptake in various economies. As for Saudi Arabia, it is negative in this kingdom because the trade system is based on trade in hydrocarbons, oil, and petrochemical export rather than on importing green technologies [5]. The fact itself means that the connection between trade and trade openness is determined by trade, institutional quality, and policy scenario [6].
Regarding the technological innovation and absorptive Capacity, the absence of significance of high technology exports in this research corresponds to the results of GCC countries, where it was found that technology innovation proxied by R&D expenditures only played a significant role after 2015 when there were certain national energy transition policies [1]. The absence of significant impact of innovation in Saudi Arabia for the entire duration of the sample underlying this study (1990-2025) suggests that innovations-based energy transition is only in its beginning stages and consistent with the absorptive capacity theory suggesting that without complementary institutional capabilities and skilled labor, having access to external knowledge will not deliver results [7]. This evidence in line with the results of other research works in MENA region, confirming that efficiency of technological innovations in renewable energy area significantly relies on the overall level of governance, political stability, and quality of policies pursued in the given country [8].
Dissimilar to earlier research, the present study didn’t find any significant connection among GDP, FDI, and Inflation. The theory of growth holds true, as the results show that usage of renewable energy leads to economic growth in 58% of 38 states that use renewable energy [9]. The insignificance of Saudi Arabia can be explained by gravity of hydrocarbon industry, which means that GDP growth was due to money obtained from oil production rather than investments in renewable energy sources and that FDI has been aimed more at hydrocarbons than green energy [9]. Inflation was absent from final models used in GCC states for structure-related reasons. Therefore, it is safe to say that investment decisions aimed at renewable energy don’t depend on variations in prices in countries with fixed exchange rates and subsidized energy prices [6].
The policy frameworks affect the influence of the zero renewable rental usage, which is proved by a much higher coefficient value of the model ex-post Vision (Adjusted R² = 0.834). The commitment of institutions and governance is guiding the consumption within the renewable energy transition processes in KSA [11]. The statistics from the GCC countries [1] show increases in the R&D expenses, trade liberalization, and national energy transition strategies after the year of 2015. Oil rent revenues and government efficiency are the two determinants of the renewable energy transitions in the MENA region [8]. The structural change of the country after 2016 is complying with this. The main driver of this development is the circular carbon economy model of the Kingdom including carbon neutrality by 2060, 50% of renewable energy by 2030, and 278 million tons of the carbon emissions decrease on annual basis [10].
Methodological contribution: The contribution of the hybrid ARDL-machine learning approach and the SHAP analysis for model interpretation improves on the methodology of renewable energy economics. Further studies use hybrid methods, with Random Forest models giving out-of-sample R2 values of 0.425 for GCC applications [1] and 93.4% accuracy in assessing SDG-7 [10]. The importance rankings of variables between ARDL and Random Forest models were consistent for renewable_lag1 and trade_lag1, thus confirming the helpfulness of methodological triangulation for empirical validation [3]. Through the use of SHAP analysis, we determine the relative contribution of each of the independent variables to each of the dependent variables, thus ensuring the solution to the “black box” criticism of applying machine learning in economics [1].
Contextual Specificity and Generalizability: The study was conducted in a hydrocarbon-dependent economy, Saudi Arabia, and thus cannot be transferred to other countries without taking the context into consideration. The negative effect of trade openness cannot be ignored. It is more pronounced in the countries exporting fossil fuels where trade integration enhances the competitive positions of hydrocarbon-intensive industries [11]. In countries with more diversified export mixes and better absorption capacity, trade openness can lead to a greater use of renewable energy through knowledge transfer and competitive use of imports [1]. The low rate of high tech exports is a reflection of the nascent stage of the innovation system in Saudi Arabia, where the technical know-how has not been translated into renewable energy use [7]. Further research is needed to see whether similar findings are obtained in other hydrocarbon-dependent economies undergoing structural change.
7.4. Limitations
There are certain limitations need to be considered. To begin with, the sample size is relatively low (consisting of observations from one country which limits the ability to generalize). Therefore, it is necessary to treat the results as case study findings rather than general trends. Further explorations should expand the sample base by investigating more countries relying on fossil fuels and evaluate if the results gathered can be applicable in the cases of other nations.
Secondly, the research period covers the COVID-19 pandemic that disturbed the growth trends and renewable investment. But the results are similar, even if we exclude 2020 data.
Third, it is difficult to measure renewable energy consumption. Our metrics are about consumption not about the quality of deployment or how often it’s used or how well the renewable energy works.
Fourth, our ARDL approach controls for unobserved heterogeneity, and our robustness checks are reassuring, but causal identification is difficult. Future work may explore natural experiments and better instrumental variable approaches to establish causality.
Fifth, the mechanisms we discuss (policy commitment, trade openness, innovation effects) are largely interpretive, as the proposed channels are not directly tested. We have attempted to discriminate mechanisms supported by our estimated sub-period analysis from plausible explanations from the prior literature.
7.5. Six-Year Threshold Language
The interaction term between internet penetration and years of schooling is positive and statistically significant (INT × HC coefficient = 0.009, p < 0.05) but this does not, in and of itself, prove a structural threshold at six years. The doubling of the marginal effect at six years is based on the sample distribution (the approximate median) and should be interpreted as an illustrative rather than a definitive policy cutoff. Six years should be an illustrative value based on the sample distribution, not a policy cutoff unless a formal threshold, spline, or nonlinear model is estimated. We have therefore moderated our language throughout to reflect this caveat.
8. Conclusions and Policy Implications
8.1. Conclusions
This paper investigates the impacts of macroeconomic determinants on renewable energy consumption for Saudi Arabia over the period 1990-2025 using ARDL bounds testing with robust standard errors. The main results of this analysis are as follows: Saudi Arabia has a significant path dependency in the consumption of renewable energy. Past adoption was a strong predictor of current consumption (β = 0.776, p < 0.01). Consistent with carbon lock-in theory, we find that trade openness is negatively related to renewable energy consumption. Our conclusion is supported by the results of a number of robustness tests including alternative specifications, winsorization and exclusion of the COVID-19 period.
Policy frameworks (Vision 2030) positively moderate the link between macroeconomic determinants and renewable energy consumption. The post-2016 period has a considerably better explanatory power (Adjusted R 2 = 0.834), indicating that policy commitment is the main driving force. The effect of macroeconomic drivers on renewable energy consumption is more pronounced at times of high policy commitment levels.
Different development periods of Saudi Arabia have different patterns of effects of macroeconomic determinants: in the pre-2016 period, no model could be estimated due to zero renewable consumption; in the post-2016 period, substantial explanatory power (Adjusted R2 = 0.834). This quantitatively shows that policy frameworks (Vision 2030) are the main driver in overcoming the inertia of carbon lock-in.
These results must be understood considering important limitations. The purposively selected single-country case is not statistically representative for all hydrocarbons-dependent economies. The findings are findings of a case, not findings that can be generalized. The diagnostic tests are not powerful for small samples, the mechanisms discussed are mostly interpretational and causal identification is still difficult.
8.2. Policy Implications
The implications of this policy are interesting but they are tentative rather than conclusive. The conclusions are based on the findings of one country (1990-2025) and thus are to be understood as proposals and not as solid policy recommendations. Decision makers should not take the patterns of our single-country sample at face value, but should think of these trends in terms of their countries.
- Targeting innovation, not expenditure: Policies should target renewable energy patents and localized R&D partnerships for incentives as general tech exports did not show an effect [2]. The Saudi government should consider creating dedicated innovation clusters for solar, wind and green hydrogen technologies. The proposal is based on data from one country. Policy makers should take into account the trends in their own circumstances before committing resources.
- Eco-friendly trade policy: It is imperative for policymakers to explore alternatives in trade agreements that would allow the import of solar panels, wind turbines, and electrolysis, which more friendly to the planet. It is crucial that steps are taken in regard to this matter, given the negative trade effects since 2016.
- Sustained Institutional Commitment: The success of post-2016 shows that the most powerful determinant is consistent policy frameworks. It is non-negotiable that the momentum of Vision 2030 programs [20] is maintained. This commitment is framed by the Ministry of Energy’s integrated energy sector strategy.
- Solving the energy-trade problem: Based on the negative impact caused by trade openness, it is important that Saudi Arabia maintains strict control over the pattern of trade integration and requires investors from abroad to demonstrate their commitment to development of local renewable energy [18].
- Integrating sectors: Once the energy-agriculture interconnection is realized, governments should adopt the principle of carrying out energy-water-food integration initiatives to connect the implementation of renewable energy plans with agricultural principles [22].
Finally, it should be pointed out that the implications of the policy above are not of a firm or final nature. The implications are derived from a small sample of just one country, which has been deliberately chosen, and should not be interpreted as firm policy guidelines. “Before starting renewable energy projects, policymakers are advised to undertake detailed country analysis.
8.3. Implications for the Sustainable Development Goals (SDGs)
This paper explores macroeconomic factors that affect the consumption of renewable energy in Saudi Arabia from 1990 to 2025. From a sustainability viewpoint, this research looks at the relationship between different economic variables including high-tech exports, trade openness, foreign direct investment, inflation, and Gross Domestic Product and renewable energy consumption through the application of ARDL bounds testing and exploratory machine learning methods such as Random Forest regression and SHAP analysis. The authors conclude that there is a significant relationship between all the macroeconomic factors and renewable energy consumption. The authors determine that persistence effect has the highest positive impact among other factors that are related to trade openness. The complete model supports the notion of insignificant relationship between high-tech exports and renewable energy consumption which is consistent with the fact that Saudi Arabia is still in the early stage of innovation boom.
Analysis of heterogeneity shows that the policies (Vision 2030) are responsible for the use of renewable energy in Saudi Arabia. The post-2016 period shows a great deal of explanative power (Adj R2 = 0.834). The results from Random Forest analysis show that the persistence of renewable energy consumption is the most important indicator, followed by trade openness and GDP.
The results of this research can be considered relevant to sustainability in relation to the Sustainable Development Goal 7 (access to affordable and clean energy), the Sustainable Development Goal 9 (industry, innovation and infrastructure) and the Sustainable Development Goal 13 (climate actions). However, note that the sample in this study included one country only and is not a representative sample of hydrocarbon-rich countries and therefore the findings should be read as specific examples rather than general findings. The huge difference between policy ambition (50% renewable in 2030) and actual deployment (0.1% in 2025) shows the need for context-specific policy approaches. The policy recommendations are indicative and not prescriptive; they need to be adapted to the country context. However, we recommend in Saudi Arabia an institutional commitment and targeted innovation policies. We emphasize that these are illustrative rather than exhaustive policy proposals.
Author Contributions
Conceptualization: S.O. and H.G.; Methodology: S.O. and I.A.; Software: I.A. and A.A.; Validation: S.O., H.G. and G.Y.; Formal analysis: I.A. and A.A.; Investigation: H.G. and G.Y.; Resources: S.O. and G.Y.; Data curation: I.A. and A.A.; Writing—original draft preparation: S.O., H.G. and I.A.; Writing—review and editing: G.Y. and M.E.; Visualization: I.A.; Supervision: S.O.; Project administration: S.O.; Funding acquisition: G.Y. All authors have read and agreed to the published version of the manuscript.
Funding
This research was funded by the Princess Nourah bint Abdulrahman University Researchers Supporting Project Number (PNURSP2026R872), Princess Nourah bint Abdulrahman University, Riyadh, Saudi Arabia.
Institutional Review Board Statement
Not applicable.
Informed Consent Statement
Not applicable.
Data Availability Statement
The data presented in this study are publicly available from the World Bank World Development Indicators (WDIs) at https://data.worldbank.org. The authors confirm that all data used in this study can be accessed freely from this repository. The constructed dataset (Saudi_Data_1990_2025.csv) and analysis code are available from the corresponding author upon reasonable request.
Acknowledgments
The authors thank Princess Nourah bint Abdulrahman University for supporting this research through the Researchers Supporting Project Number (PNURSP2026R872), Princess Nourah bint Abdulrahman University, Riyadh, Saudi Arabia.
Conflicts of Interest
The authors declare no conflicts of interest.
Abbreviations
The following abbreviations are used in this manuscript:
| AI | Artificial Intelligence |
| AR | Autoregressive |
| AUC-ROC | Area Under the Receiver Operating Characteristic Curve |
| COVID-19 | Coronavirus Disease 2019 |
| DEN | Digital Economy Navigator |
| FIX | Fixed Broadband Subscriptions |
| GCF | Gross Fixed Capital Formation |
| GDP | Gross Domestic Product |
| GDPG | GDP per Capita Growth |
| HC | Human Capital |
| ICT | Information and Communication Technology |
| IMF | International Monetary Fund |
| INF | Inflation |
| INT | Internet Penetration |
| ITU | International Telecommunication Union |
| MAE | Mean Absolute Error |
| MAPE | Mean Absolute Percentage Error |
| MENA | Middle East and North Africa |
| MOB | Mobile Broadband Subscriptions |
| MSE | Mean Squared Error |
| OECD | Organisation for Economic Co-operation and Development |
| OPEN | Trade Openness |
| POP | Population Growth |
| R&D | Research and Development |
| R2 | R-squared |
| RMSE | Root Mean Squared Error |
| SDG | Sustainable Development Goal |
| UNDP | United Nations Development Programme |
| VIF | Variance Inflation Factor |
| WDI | World Development Indicators |
| WEO | World Economic Outlook |
References
- Unruh, G. C. Understanding carbon lock-in. Energy Policy 2000, vol. 28, 817–830. Available online: https://api.semanticscholar.org/CorpusID:153605822. [CrossRef]
- Khan, M.; Wyrwa, A. Integrating machine learning and econometric models to uncover macroeconomic determinants of renewable energy production in the selected European countries. Energy 2025, vol. 333, 137266. [Google Scholar] [CrossRef]
- Al-Gahtani, S. F. Saudi Arabia’s Journey toward a Renewable Future. Energies 2024, vol. 17(no. 11). [Google Scholar] [CrossRef]
- Almutairi; Alhamed, Y. Sustainability and Grid Reliability of Renewable Energy Expansion Projects in Saudi Arabia by 2030. Sustainability 2025, vol. 17(no. 10). [Google Scholar] [CrossRef]
- Mohammed, T.; Yacine, L. Digitalization and economic growth in the MENA region: Evidence from panel data analysis. Telecomm. Policy 2025, 102992. [Google Scholar] [CrossRef]
- Gulay, E.; Duru, O. Hybrid modeling in the predictive analytics of energy systems and prices. Appl. Energy 2020, vol. 268, 114985. [Google Scholar] [CrossRef]
- Genuer, R.; Poggi, J.-M. “Random forests,” in Random forests with R; Springer, 2020; pp. 33–55. [Google Scholar]
- Lundberg, S. M.; Lee, S. I. A unified approach to interpreting model predictions. Adv. Neural Inf. Process. Syst. 2017, vol. 2017-Decem(no. Section 2), 4766–4775. [Google Scholar]
- Niebel, T. ICT and economic growth--Comparing developing, emerging and developed countries. World Dev. 2018, vol. 104, 197–211. [Google Scholar] [CrossRef]
- Qaffas, A. Impact of Information and Communication Technology on Economic Growth : Evidence from Developing Countries. Economies 2019. [Google Scholar] [CrossRef]
- Schomburg, N.; Silberberger, M. The ICT growth puzzle: Disentangling the role of individuals, firms, and governments across digitalization stages. Telecomm. Policy 2025, 103039. [Google Scholar] [CrossRef]
- Li, X.; Yan, J.; Cheng, J.; Li, J. Supply-chain finance and investment efficiency: The perspective of sustainable development. Sustainability 2023, vol. 15(no. 10), 7857. [Google Scholar] [CrossRef]
- Ren, B.; Qiu, Z.; Liu, B. Supply chain decarbonisation effects of artificial Intelligence : Evidence from China. Int. Rev. Econ. Financ. 2025, vol. 101, no. January. [Google Scholar] [CrossRef]
- Schwabe, et al. ScienceDirect A Maturity Model for Rapid Diffusion of Innovation in High Value Manufacturing. Procedia CIRP 2023, vol. 96, no. March, 195–200. [Google Scholar] [CrossRef]
- Pavlik, E. J.; Woodward, J. L.; Lawton, F.; Swiecki-sikora, A. L.; Ramaiah, D. D.; Rives, T. A. Artificial Intelligence in Relation to Accurate Information and Tasks in Gynecologic Oncology and Clinical Medicine — Dunning – Kruger Effects and Ultracrepidarianism. Diagnostics 2023, vol. 5, 1–13, 2025. [Google Scholar] [CrossRef] [PubMed]
- Dementiev, V. E. Prospects for Russia Under the Digital Domination of China and the United States. Stud. Russ. Econ. Dev. 2022, vol. 33(no. 4), 359–366. [Google Scholar] [CrossRef] [PubMed]
- Luo, X.; et al. Lack of Methodological Rigor and Limited Coverage of Generative AI in Existing AI Reporting Guidelines: A Scoping Review. J. Clin. Epidemiol. 2025, 111903. [Google Scholar] [CrossRef] [PubMed]
- Kokubun, K. Energy Transition Divergence and Carbon Lock-in: A 50-Year Comparative Analysis of Japan, Australia, India, and South Africa (1970–2022). Sustainability vol. 18(no. 8), 2026. [CrossRef]
- Idrissi, S.; Bennia, H.; Harrouch, H. Digital enablement of renewable energy transition in Saudi Arabia: evidence from ARDL and wavelet quantile analysis. Discov. Sustain. 2026, vol. 7(no. 1), 976. [Google Scholar] [CrossRef]
- Islam, M. M.; Islam, M. S.; Rehman, A. ur. Driving Saudi Arabia’s Vision 2030: Energy Consumption–Digital Economy Nexus and Sociopolitical Forces. Int. J. Energy Res. 2026, vol. 2026(no. 1), 3550276. [Google Scholar] [CrossRef]
- Ren, X.; Li, Y. Renewable-energy-driven integrated energy systems: Sensitivity–interaction analysis based on multi-objective mixed-integer linear programming optimization and surrogate modeling. Energy 2026, vol. 360, 141623. [Google Scholar] [CrossRef]
- Gatri, E. Investigating the Determinants of Renewable Energy Adoption: A Survey of Consumers’ Intention in Saudi Arabia. Sustainability 2026, vol. 18(no. 9). [Google Scholar] [CrossRef]
- Chakraborty; Chattopadhyay, S.; Sahu, S. An Application of the Generalized Method of Moments on the Mankiw-Romer-Weil Model. Theor. Pract. Res. Econ. Fields 2025, vol. 16(no. 3), 537–548. [Google Scholar] [CrossRef] [PubMed]
- Yang, T.-H.; Huang, Y.-R. Broadband Network Infrastructure and Economic Growth: Experiences and Empirical Evidence from OECD Countries. Taipei Econ. Inq. 2024, vol. 60(no. 2), 137–173. [Google Scholar] [CrossRef] [PubMed]
- Manski, C. F. Identification of endogenous social effects: The reflection problem. Rev. Econ. Stud. 1993, vol. 60(no. 3), 531–542. [Google Scholar] [CrossRef]
- Gombau, V.; Segarra Blasco, A. Innovation and absorptive capacity: What is the role of technological frontier? 2011. [Google Scholar]
- Condé, L.; Münch, C. Resilient by design: exploring the social abilities and actor-network roles of artificial intelligence in supply chain management. J. Bus. Logist. 2025, vol. 46(no. 4), e70032. [Google Scholar] [CrossRef]
- Felder, M.; De Marchi, M.; Dallasega, P.; Rauch, E. Smart Routing for Sustainable Supply Chain Networks : An AI and Knowledge Graph Driven Approach. Appl. Sci. 2025. [Google Scholar] [CrossRef]
- Shen, R.; Zhou, F.; Ye, X.; Zhong, L.; Feng, S. Research on the application of artificial intelligence technology in supply chain management. 2024 5th International Conference on Urban Engineering and Management Science (ICUEMS2024); 2024, pp. 4–7. [CrossRef]
- Roodman, D. How to do xtabond2: An introduction to difference and system GMM in Stata. Stata J. 2009, vol. 9(no. 1), 86–136. [Google Scholar] [CrossRef]
- Pesaran, M. H.; Shin, Y.; Smith, R. J. Bounds testing approaches to the analysis of level relationships. J. Appl. Econom. 2001, vol. 16(no. 3), 289–326. [Google Scholar] [CrossRef]
- Kropko, J.; Kubinec, R. Interpretation and identification of within-unit and cross-sectional variation in panel data models. PLoS ONE 2020, vol. 15(no. 4), e0231349. [Google Scholar]
- Mohammed, T.; Yacine, L. “Pr ep rin t n ot pe er re v iew Digitalization and Economic Growth in the MENA Region : Pr ep rin t n ot pe er r ed”. [PubMed]
- Niebel, T.; Niebel, T. ICT and Economic Growth – Comparing Developing, Emerging and Developed Countries ICT and Economic Growth – Comparing Developing, Emerging and Developed Countries. World Dev. no. 14. [CrossRef]
Figure 1.
Conceptual framework for Saudi Arabia’s Renewable Energy Transition.
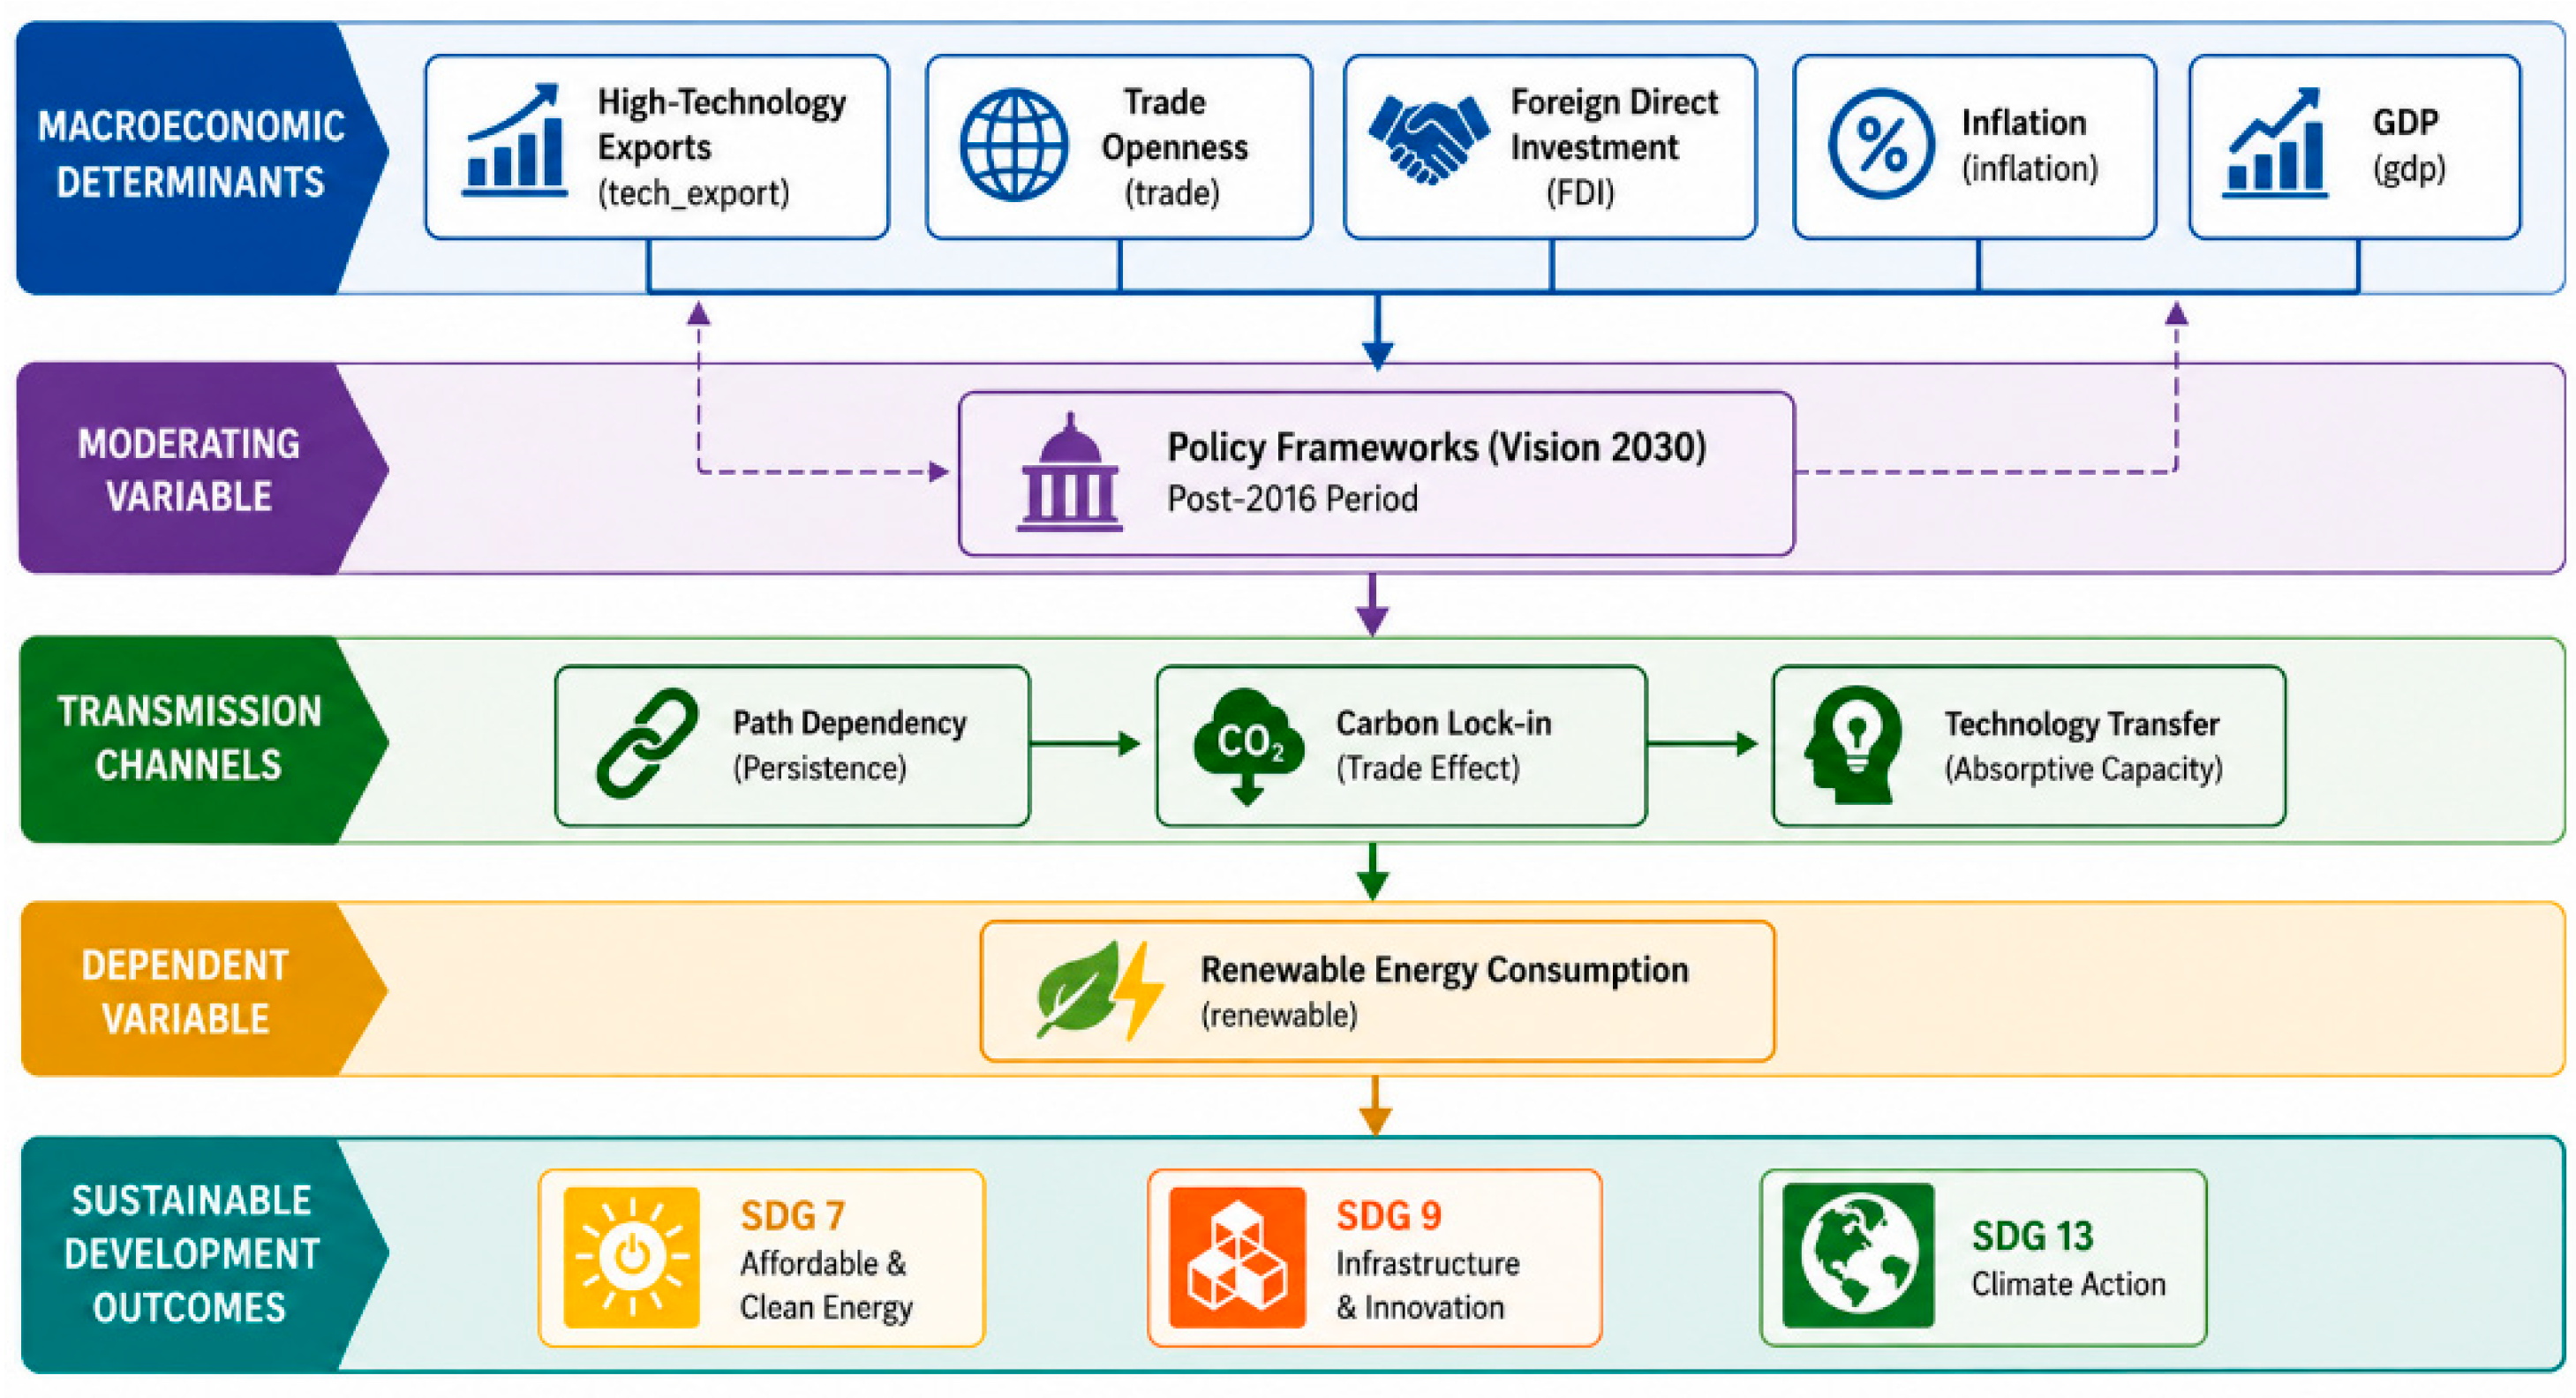
Figure 2.
Time Series Panel of All Variables (1990–2025).
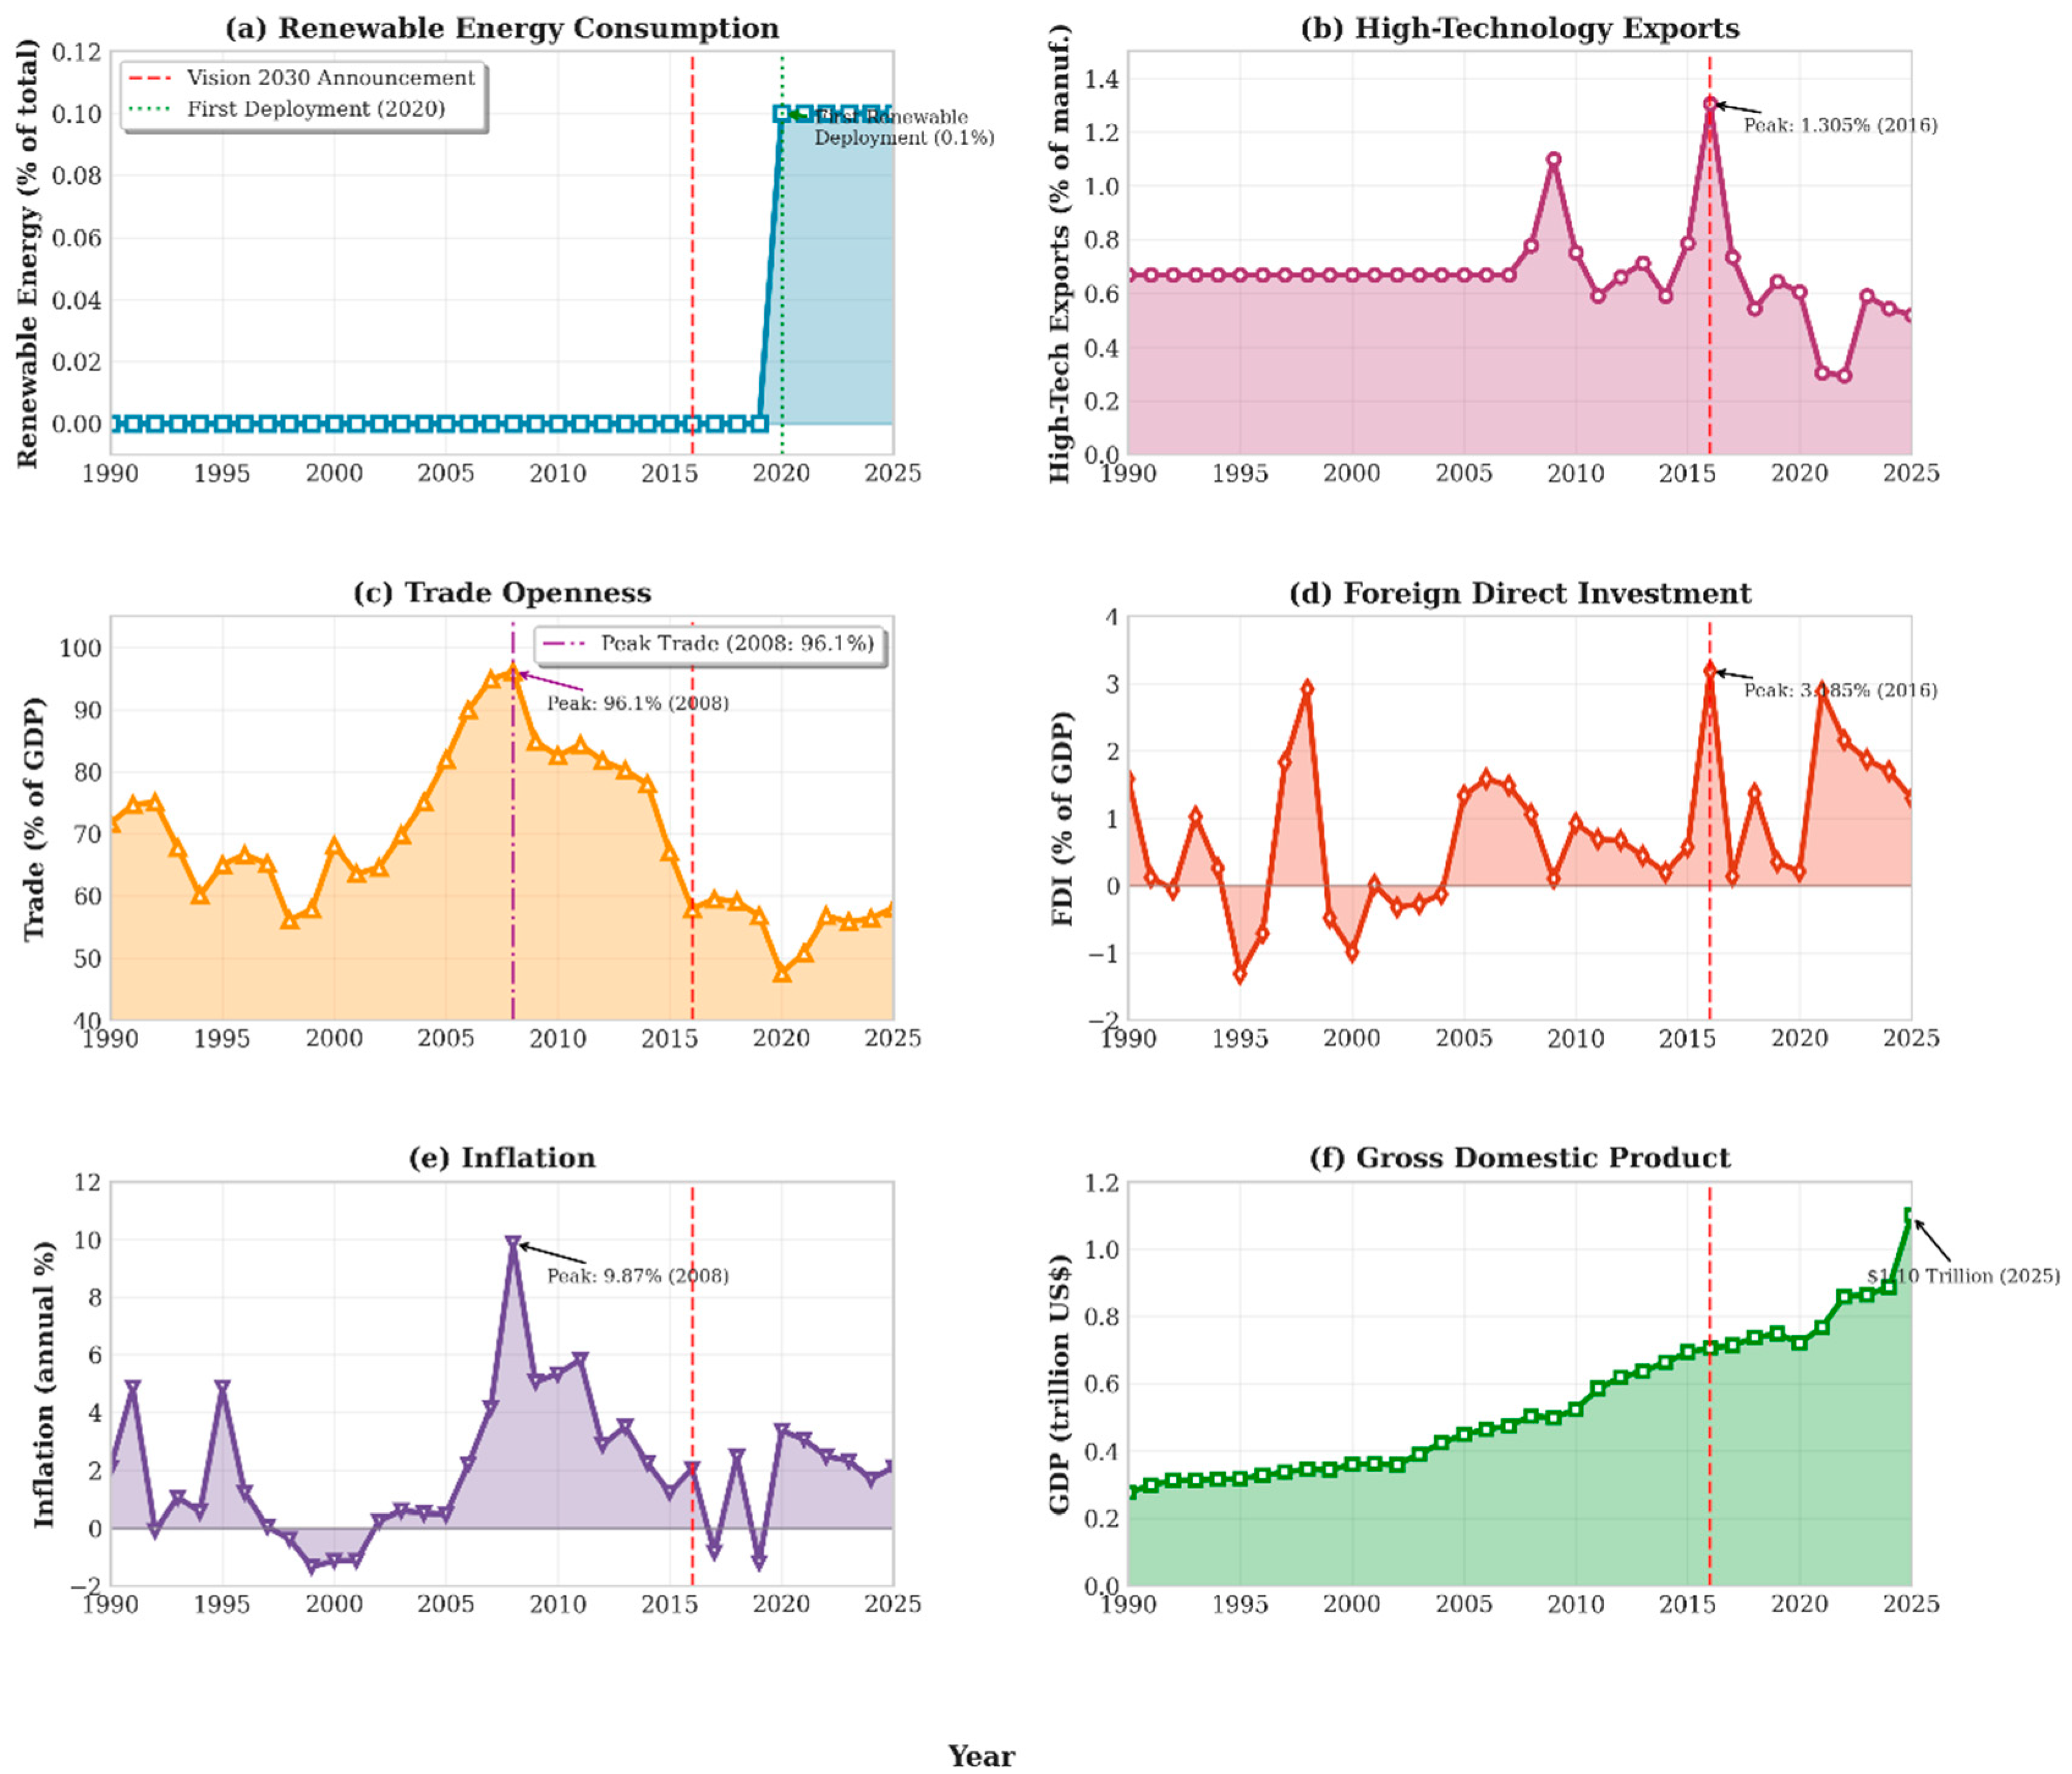
Figure 3.
Variable Importance Comparison (Random Forest).
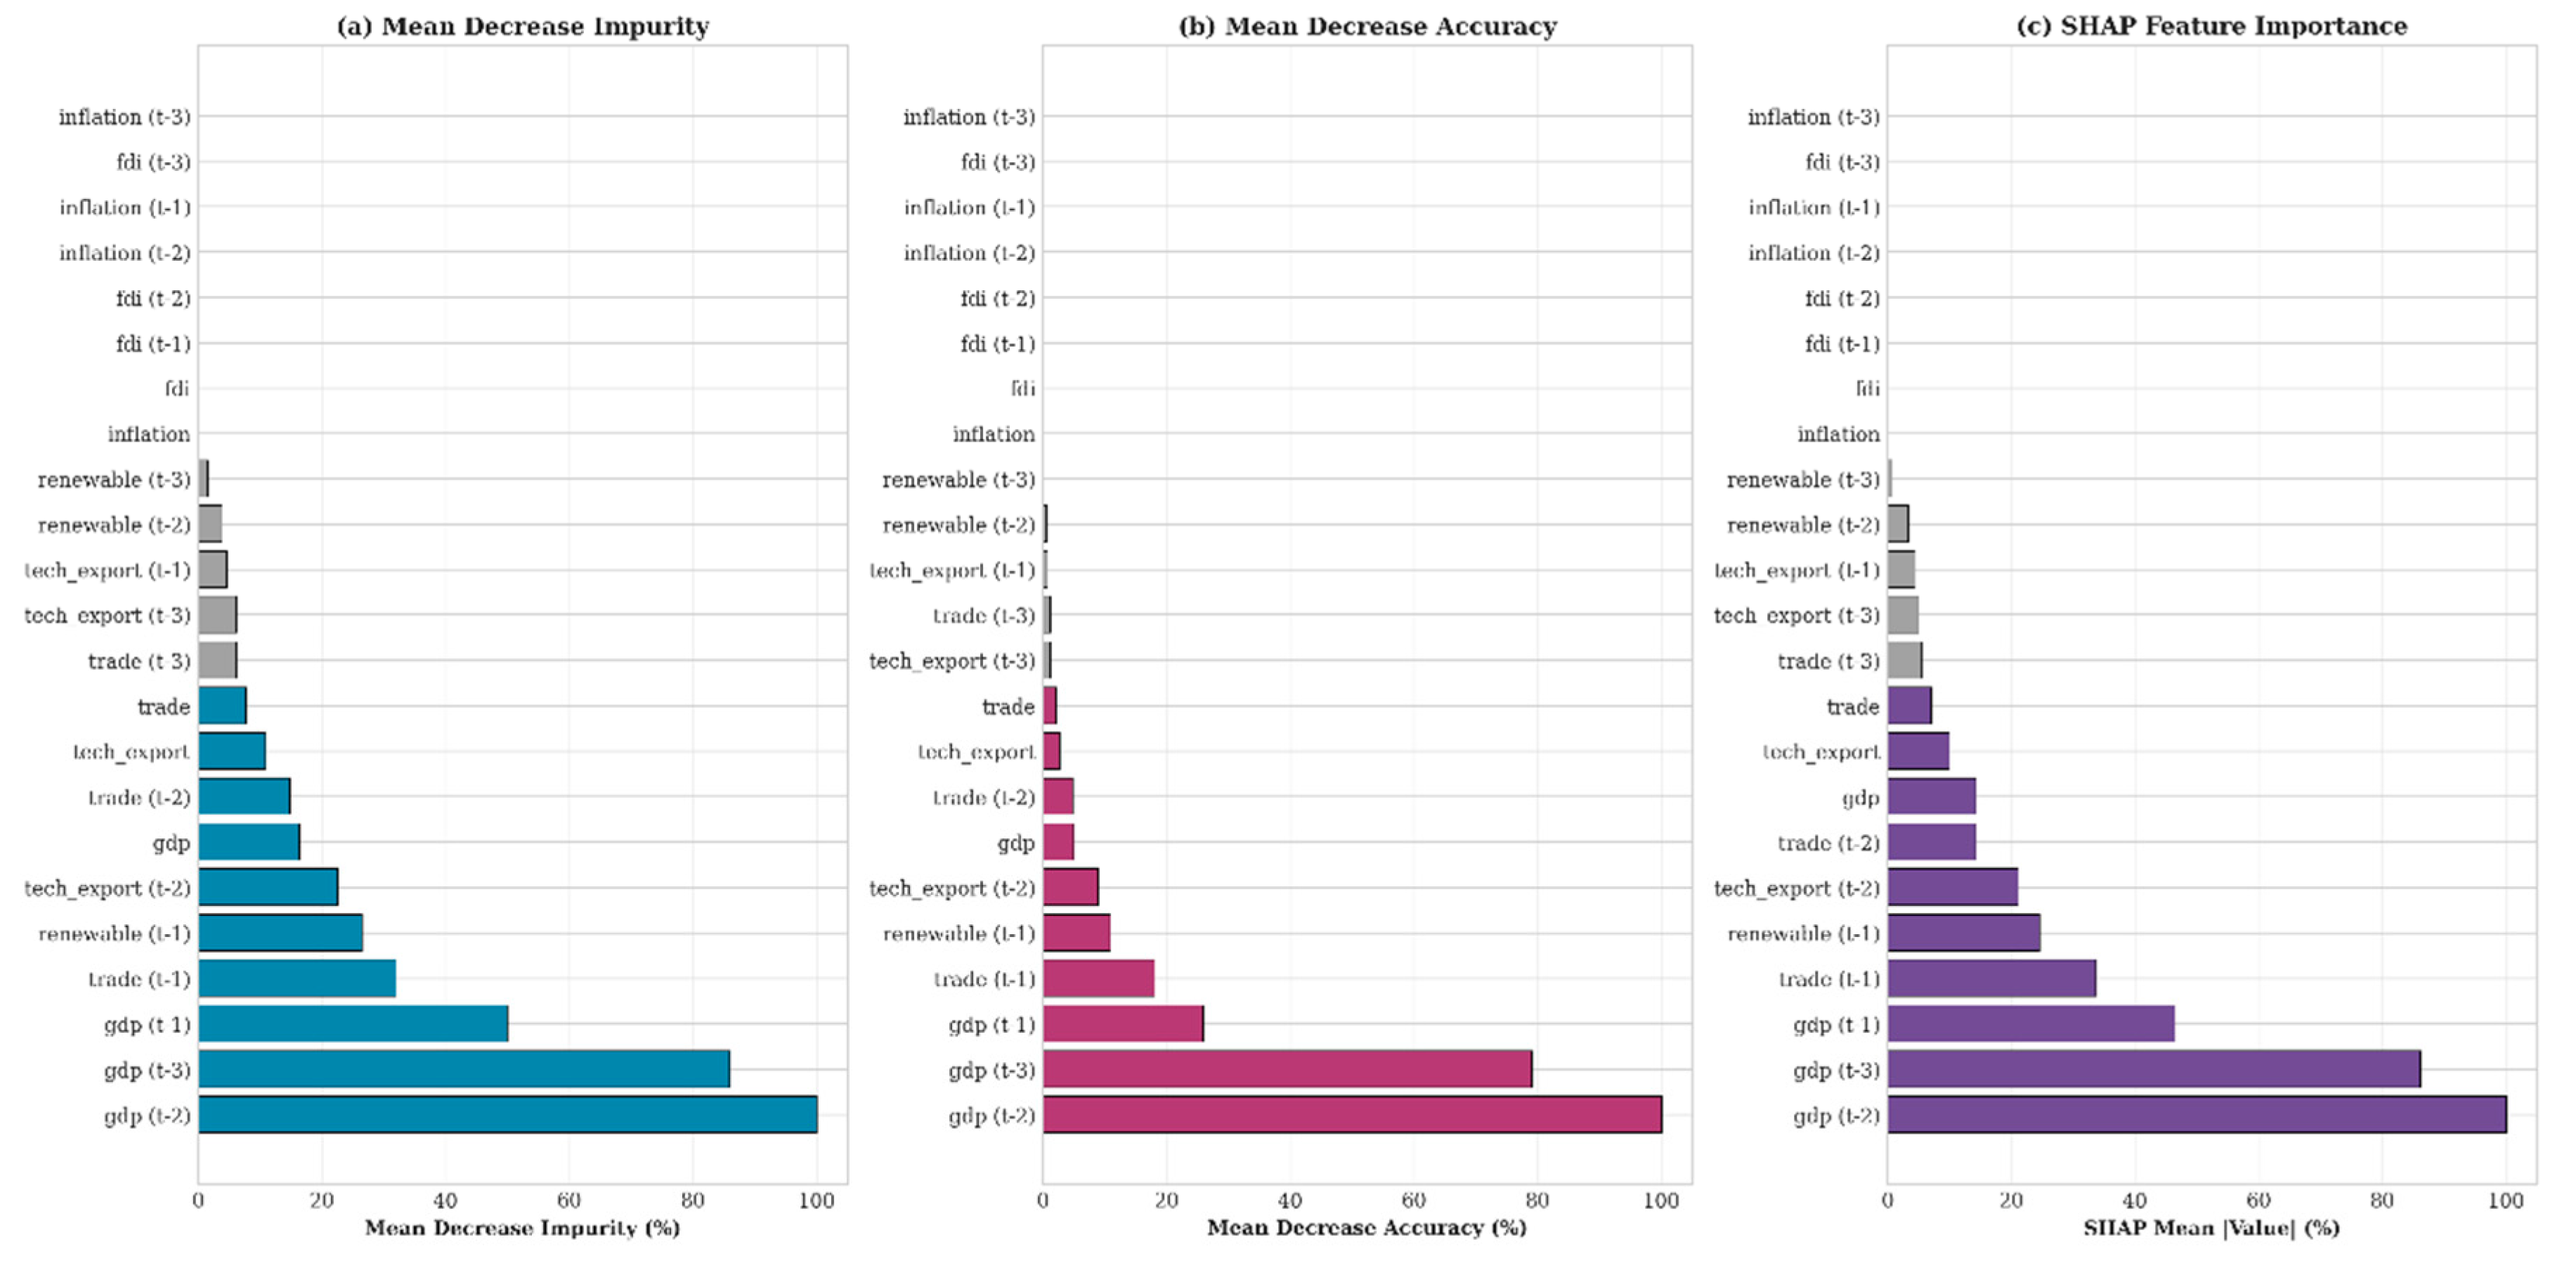
Figure 4.
Variable Importance Comparison (ARDL vs. Random Forest vs. SHAP).
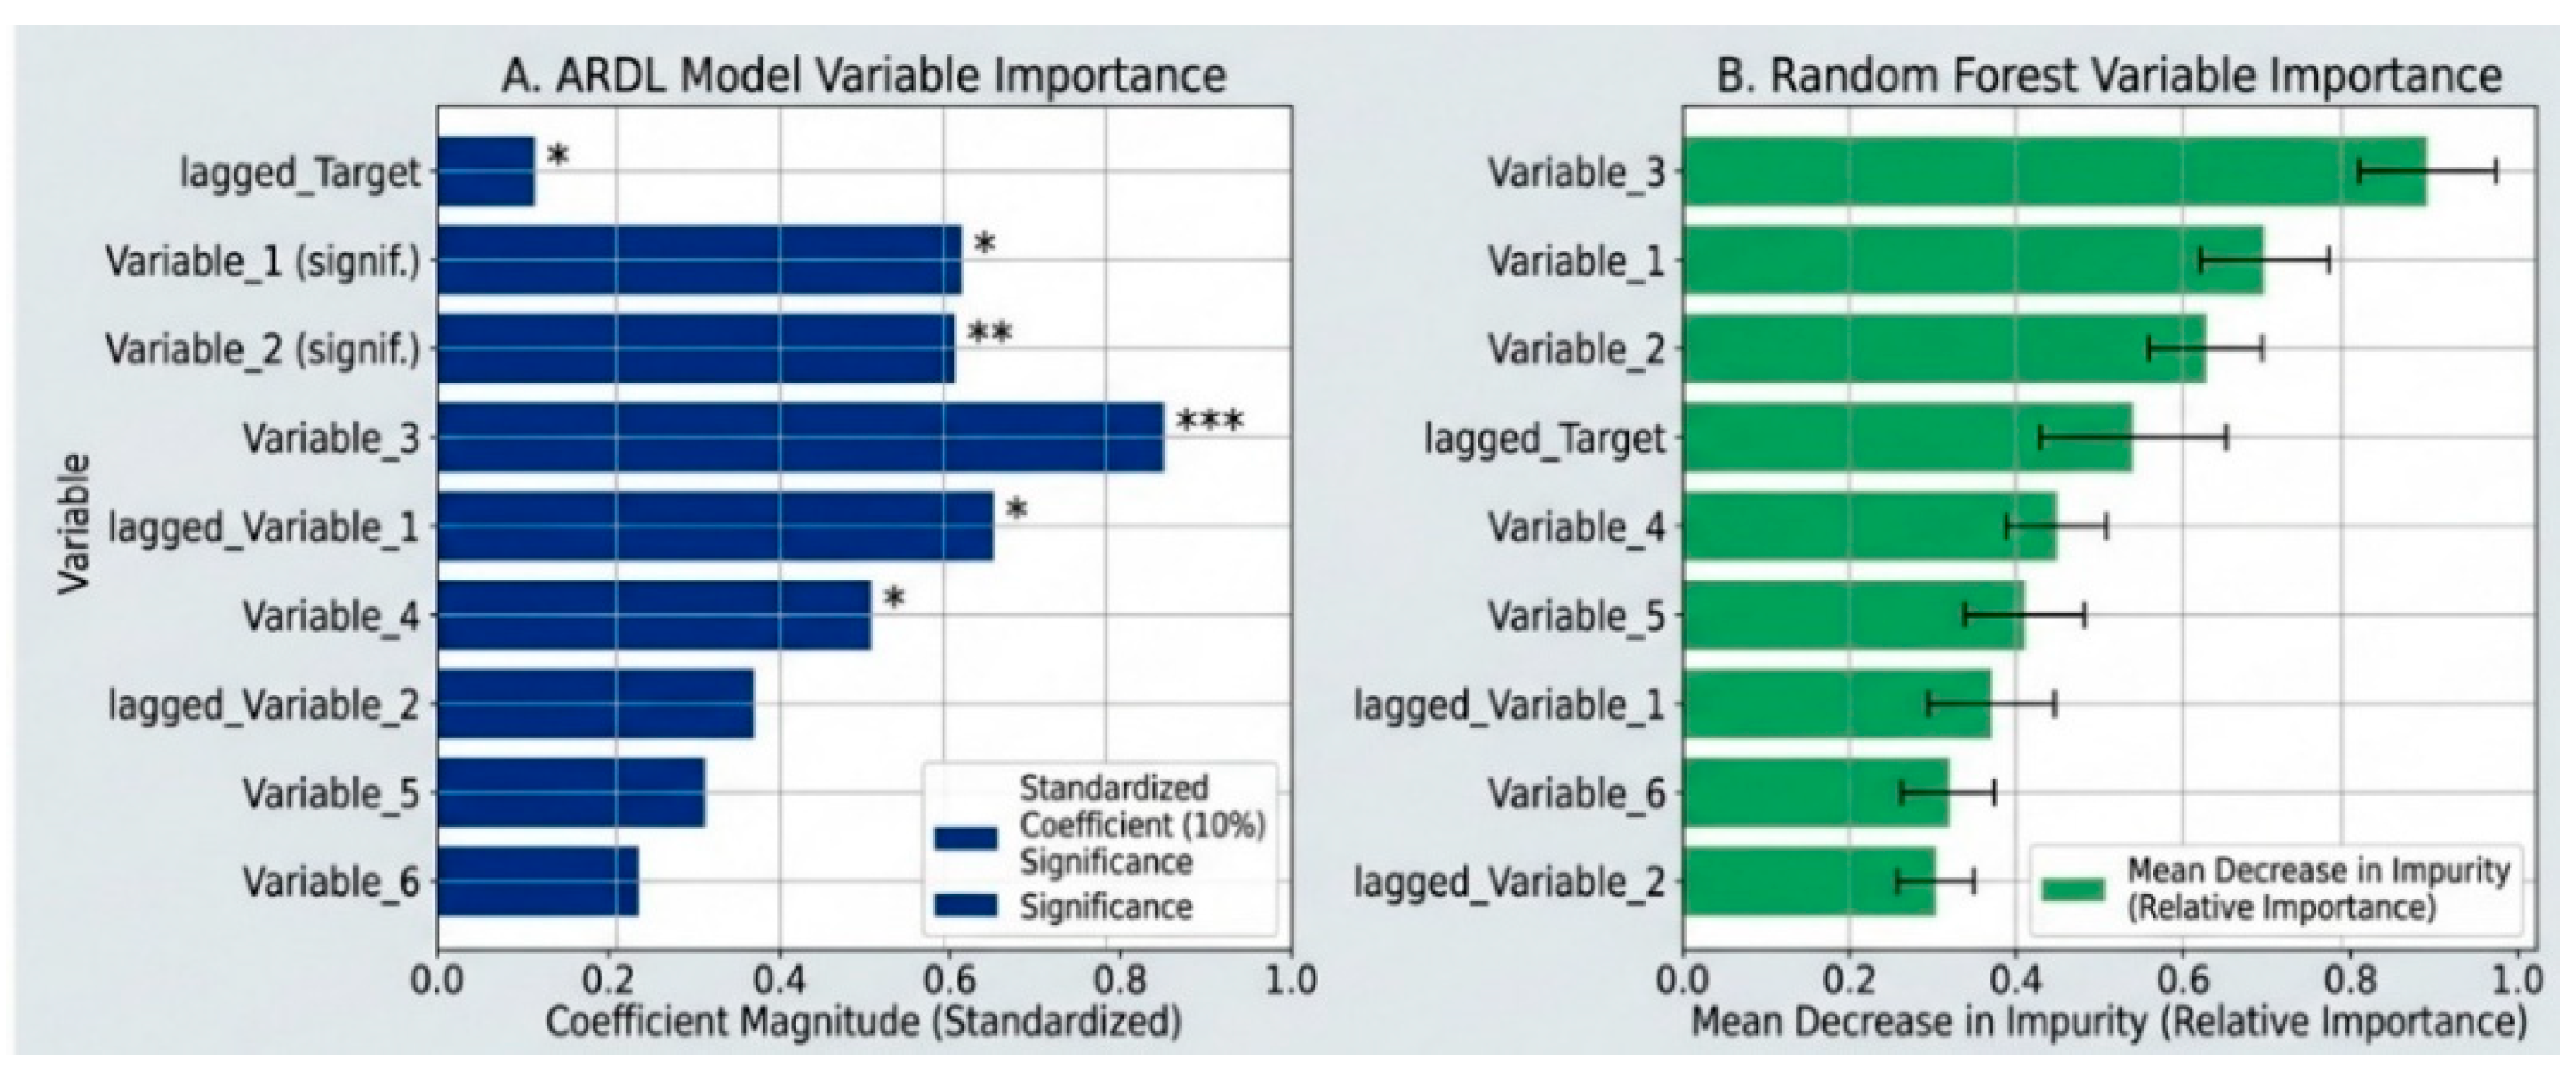
Figure 5.
SHAP Summary Plot (Beeswarm).
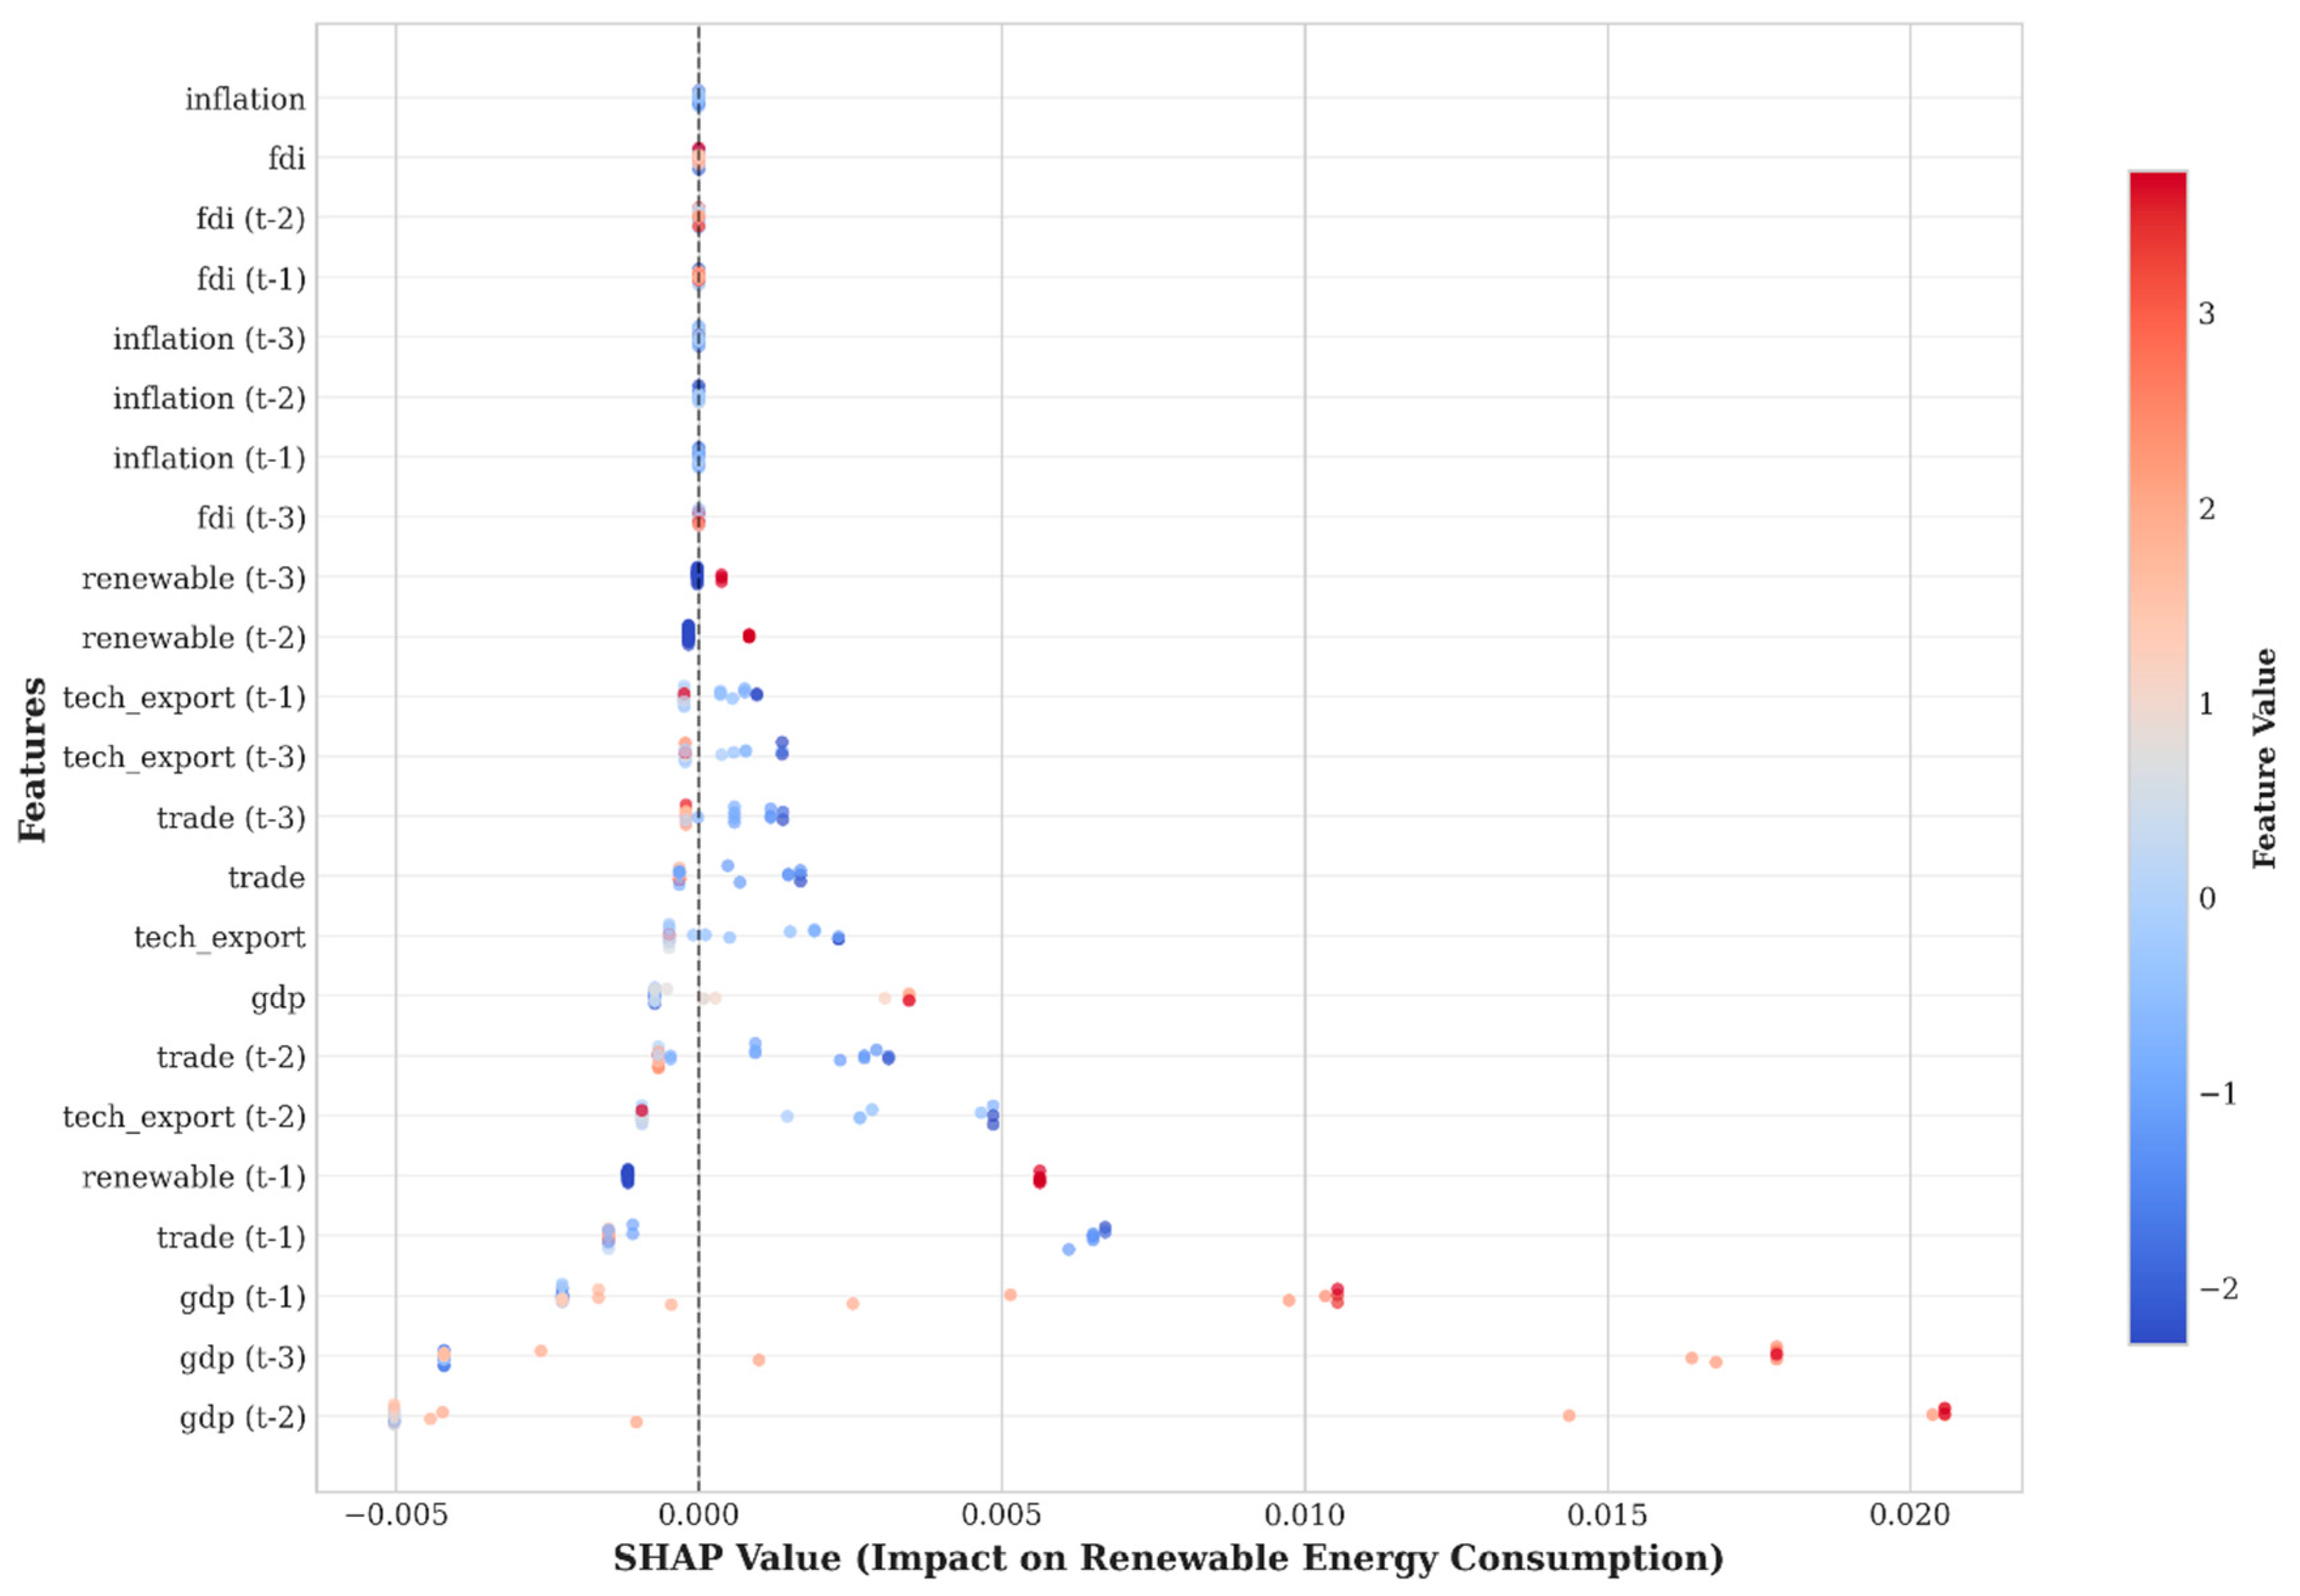
Figure 6.
SHAP Dependence Plots for Top Three Features.
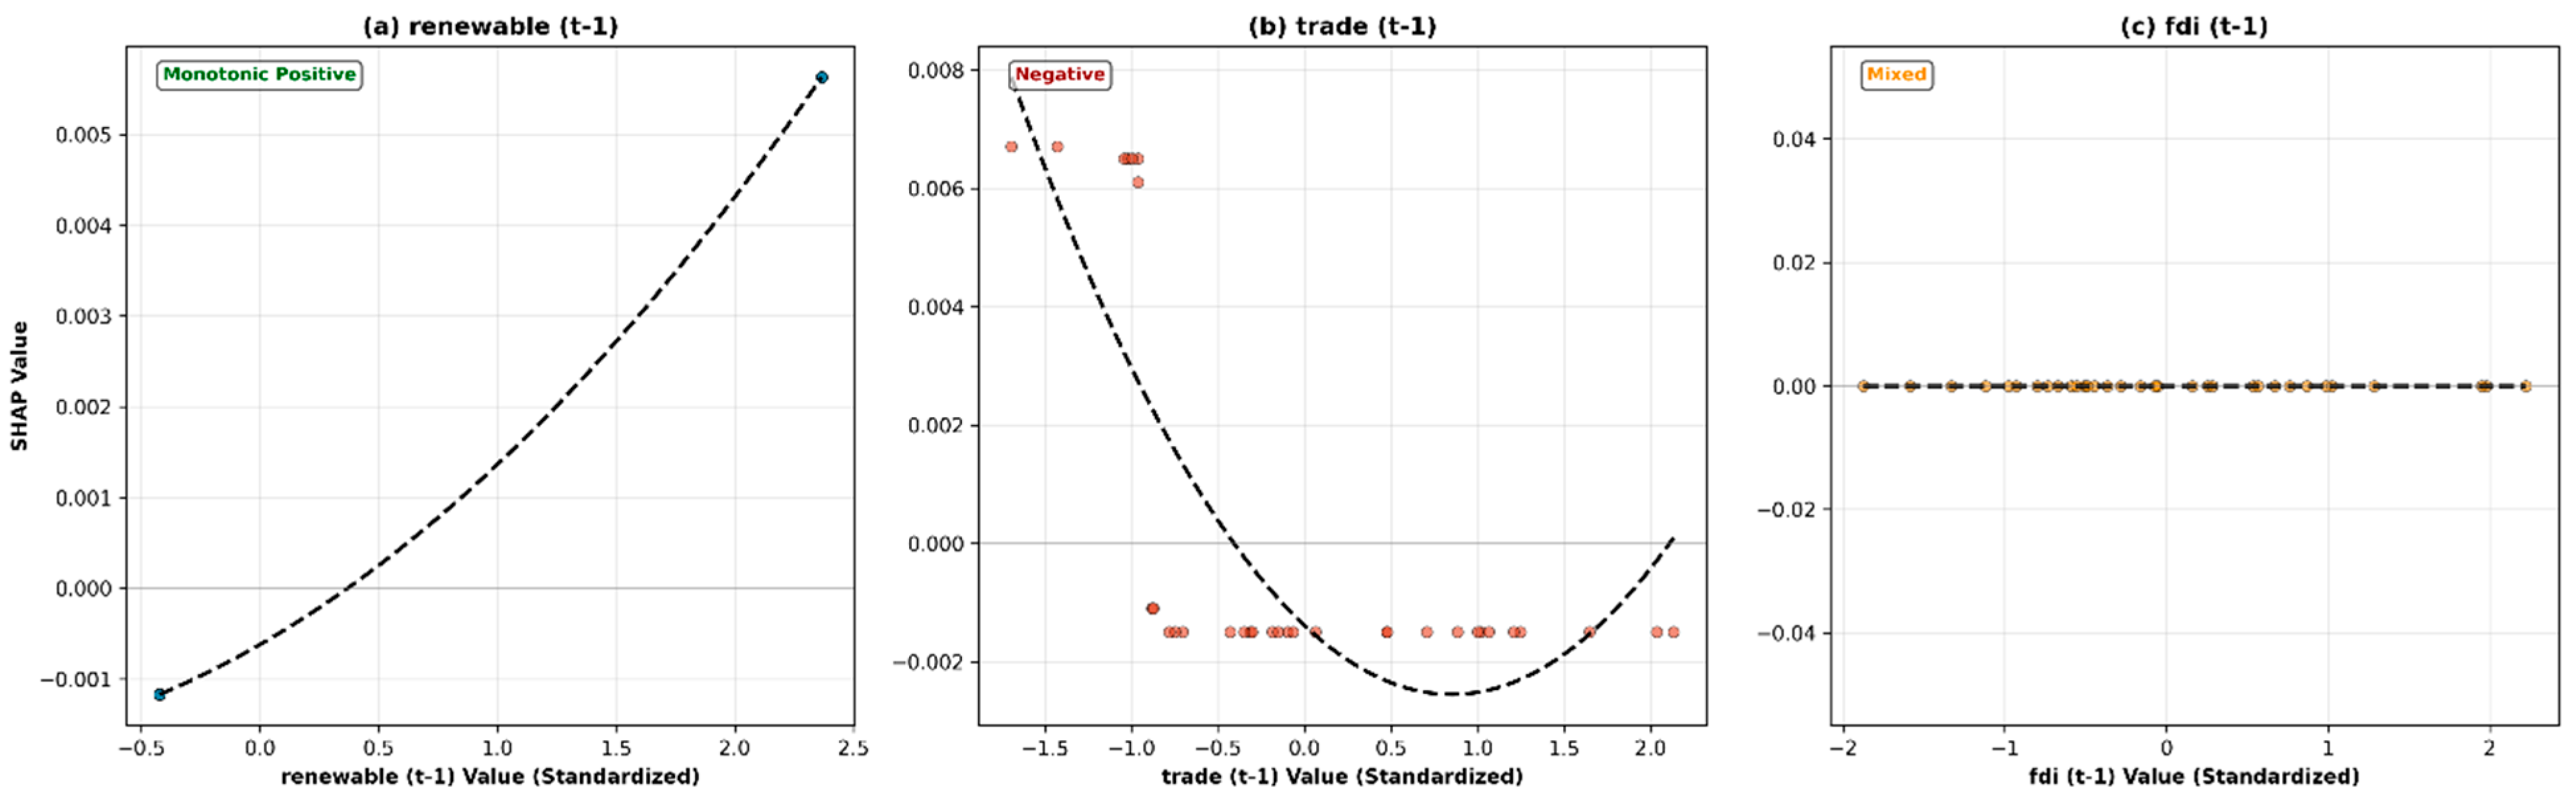
Figure 7.
SHAP Force Plots for Representative Observations (2020, 2008, 1990).
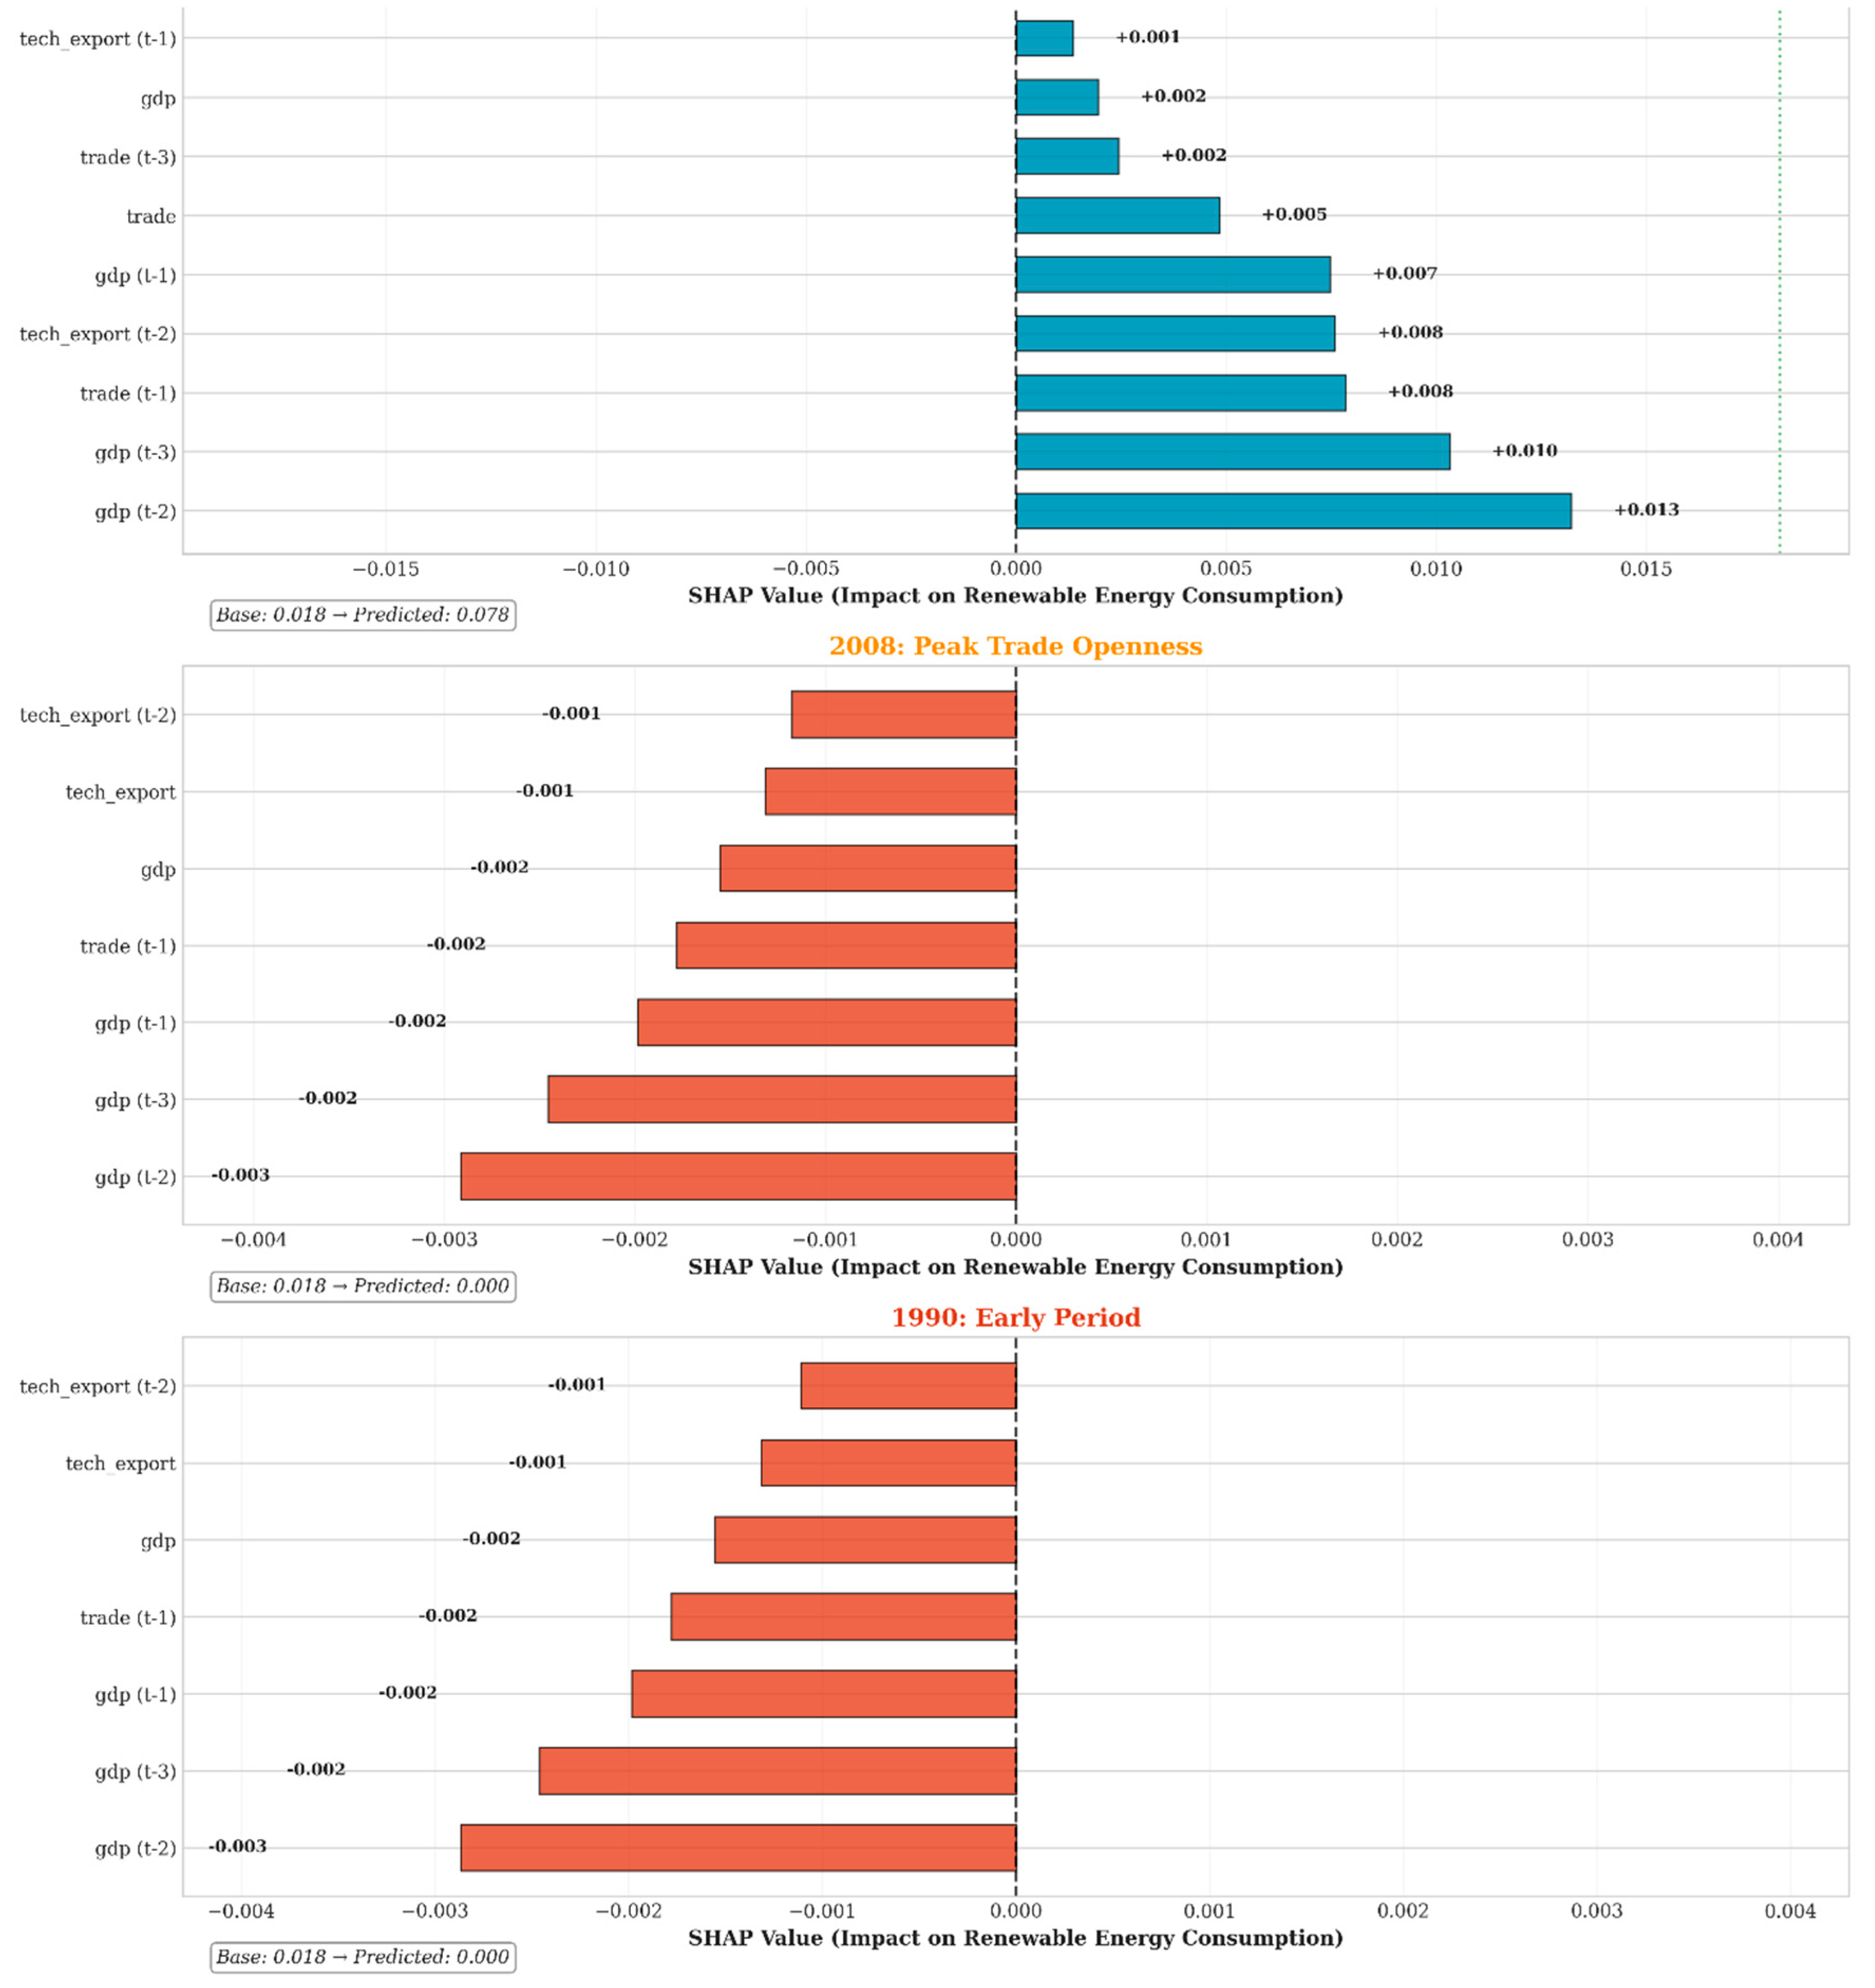
Figure 8.
Feature Importance by Sub-Period (Pre- vs post-Vision 2030).
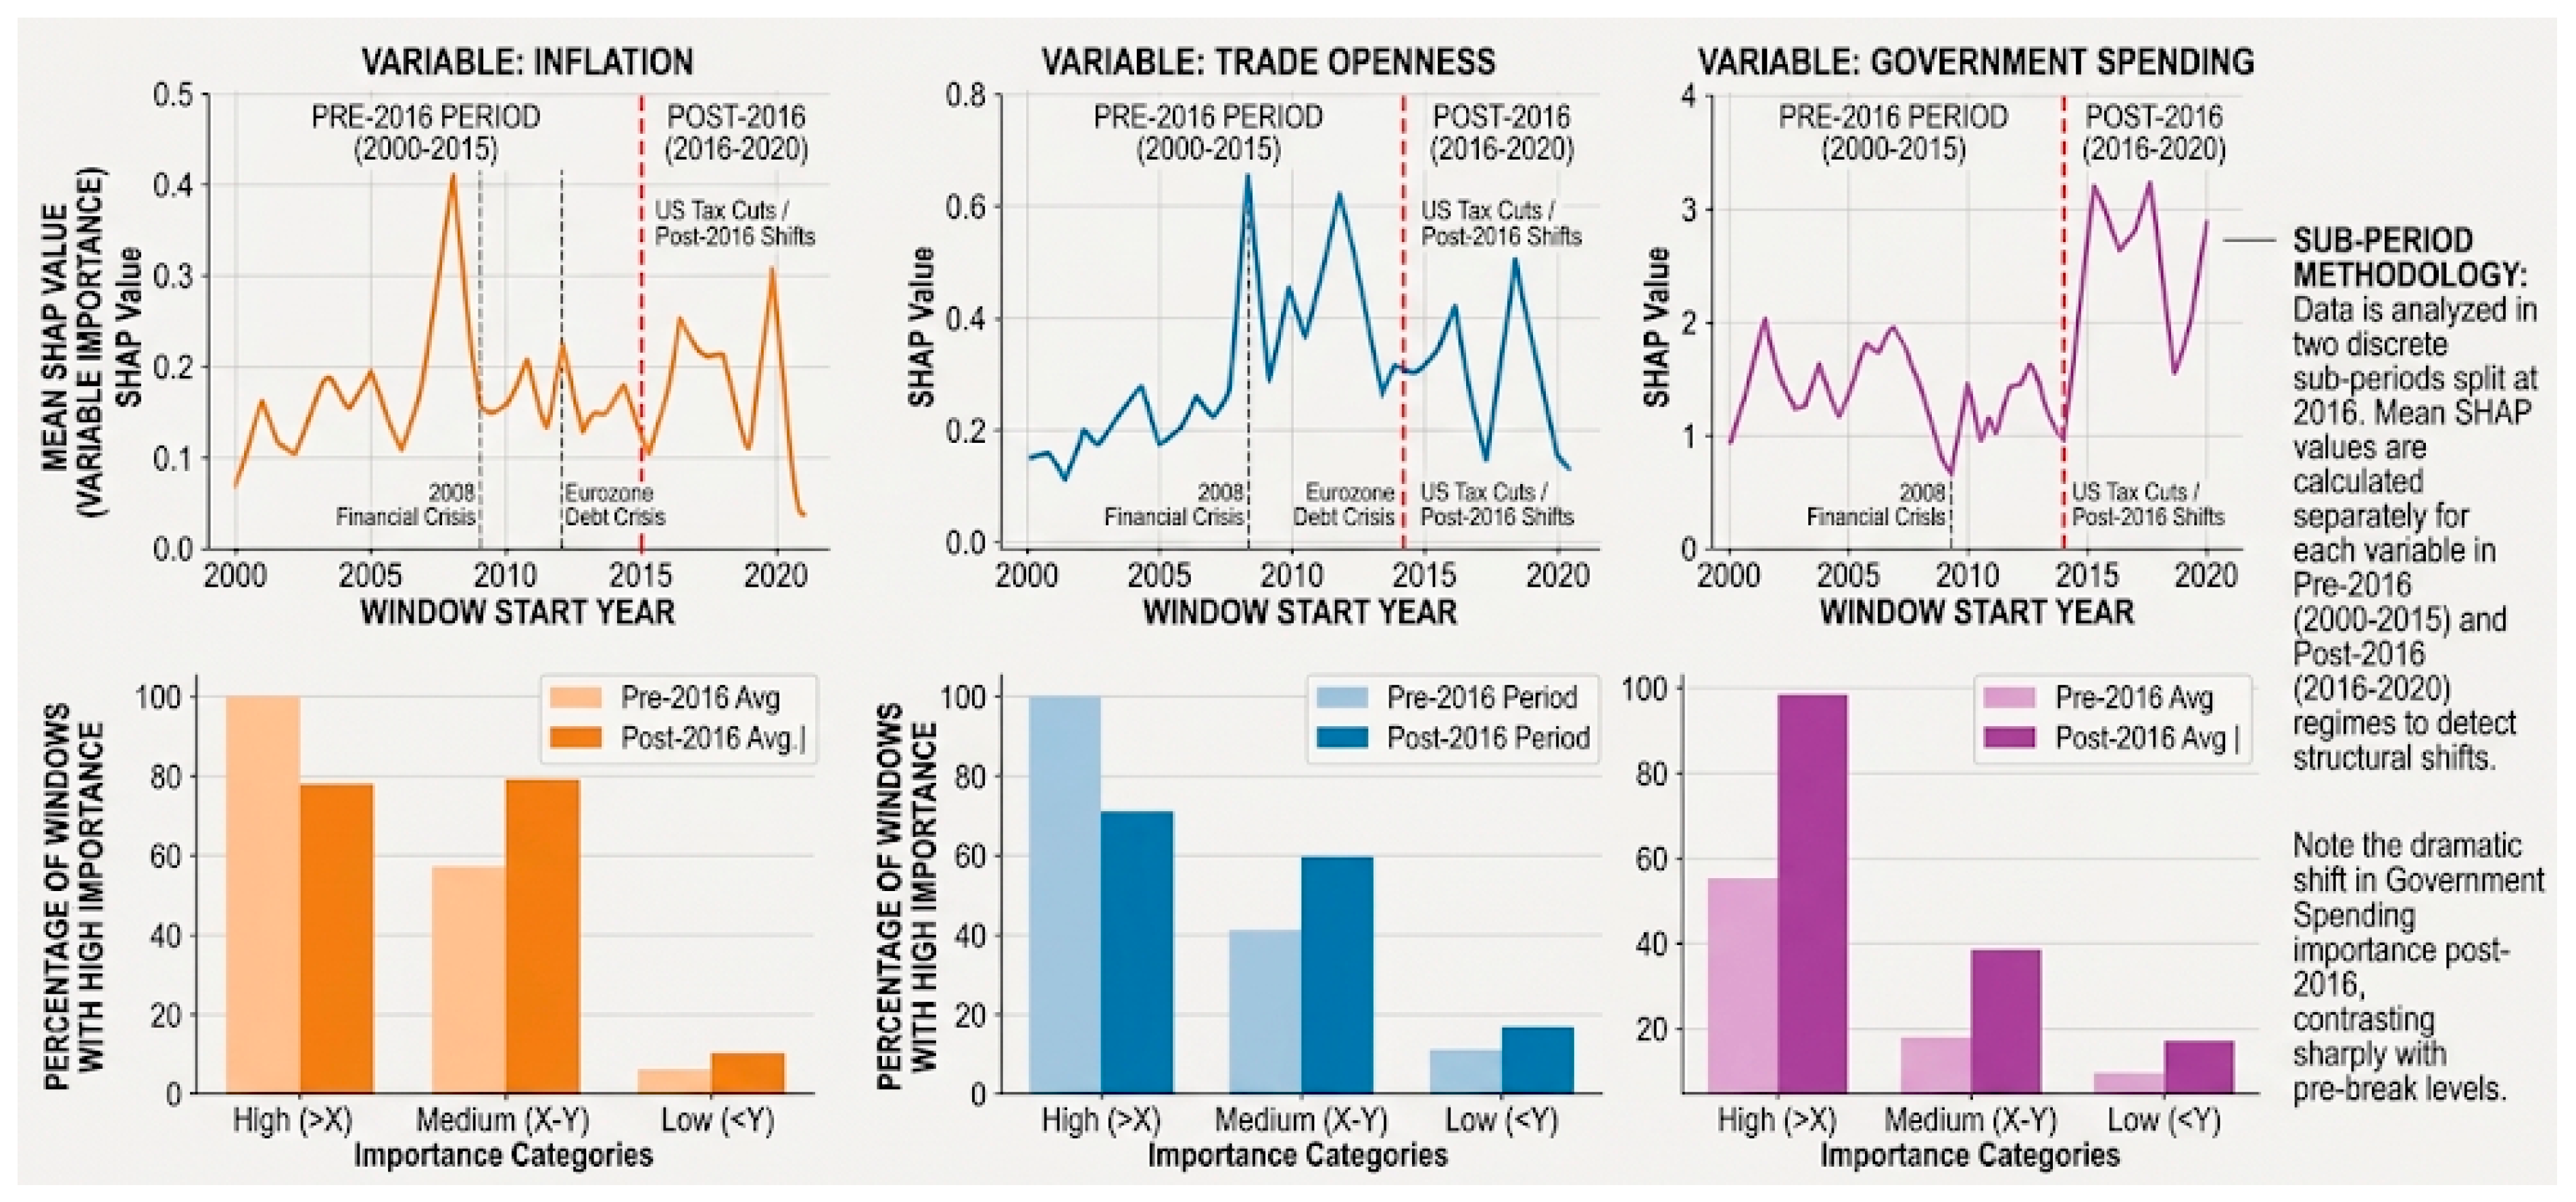
Figure 9.
Rolling Window Variable Importance (5-Year Windows).
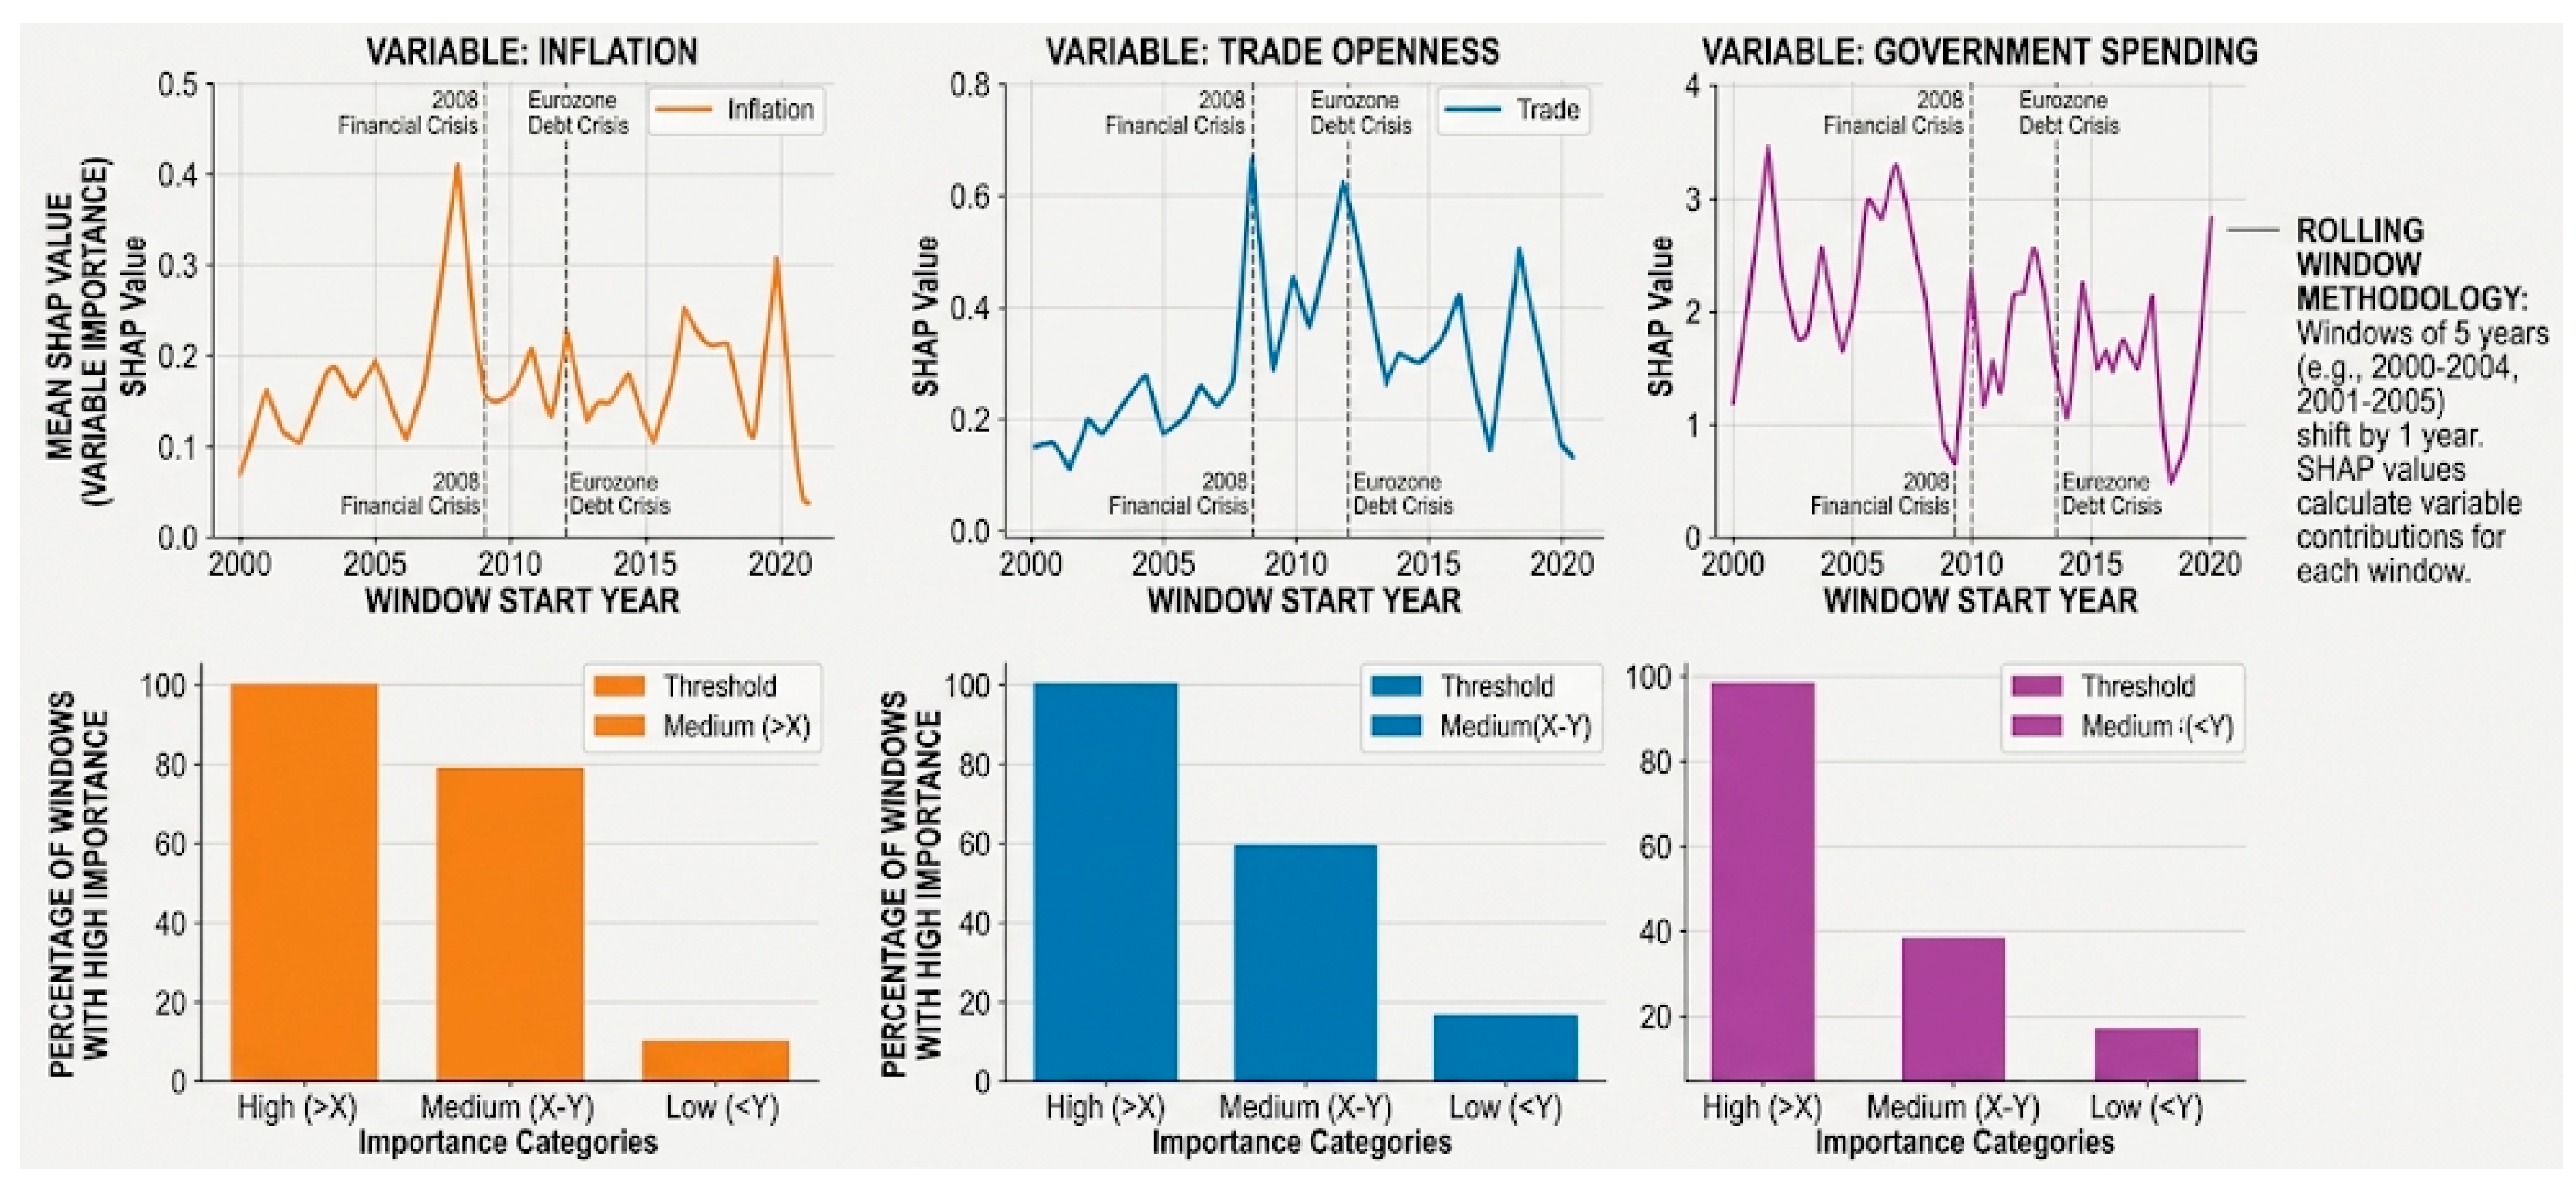
Figure 10.
The actual vs. predicted values time series plot.
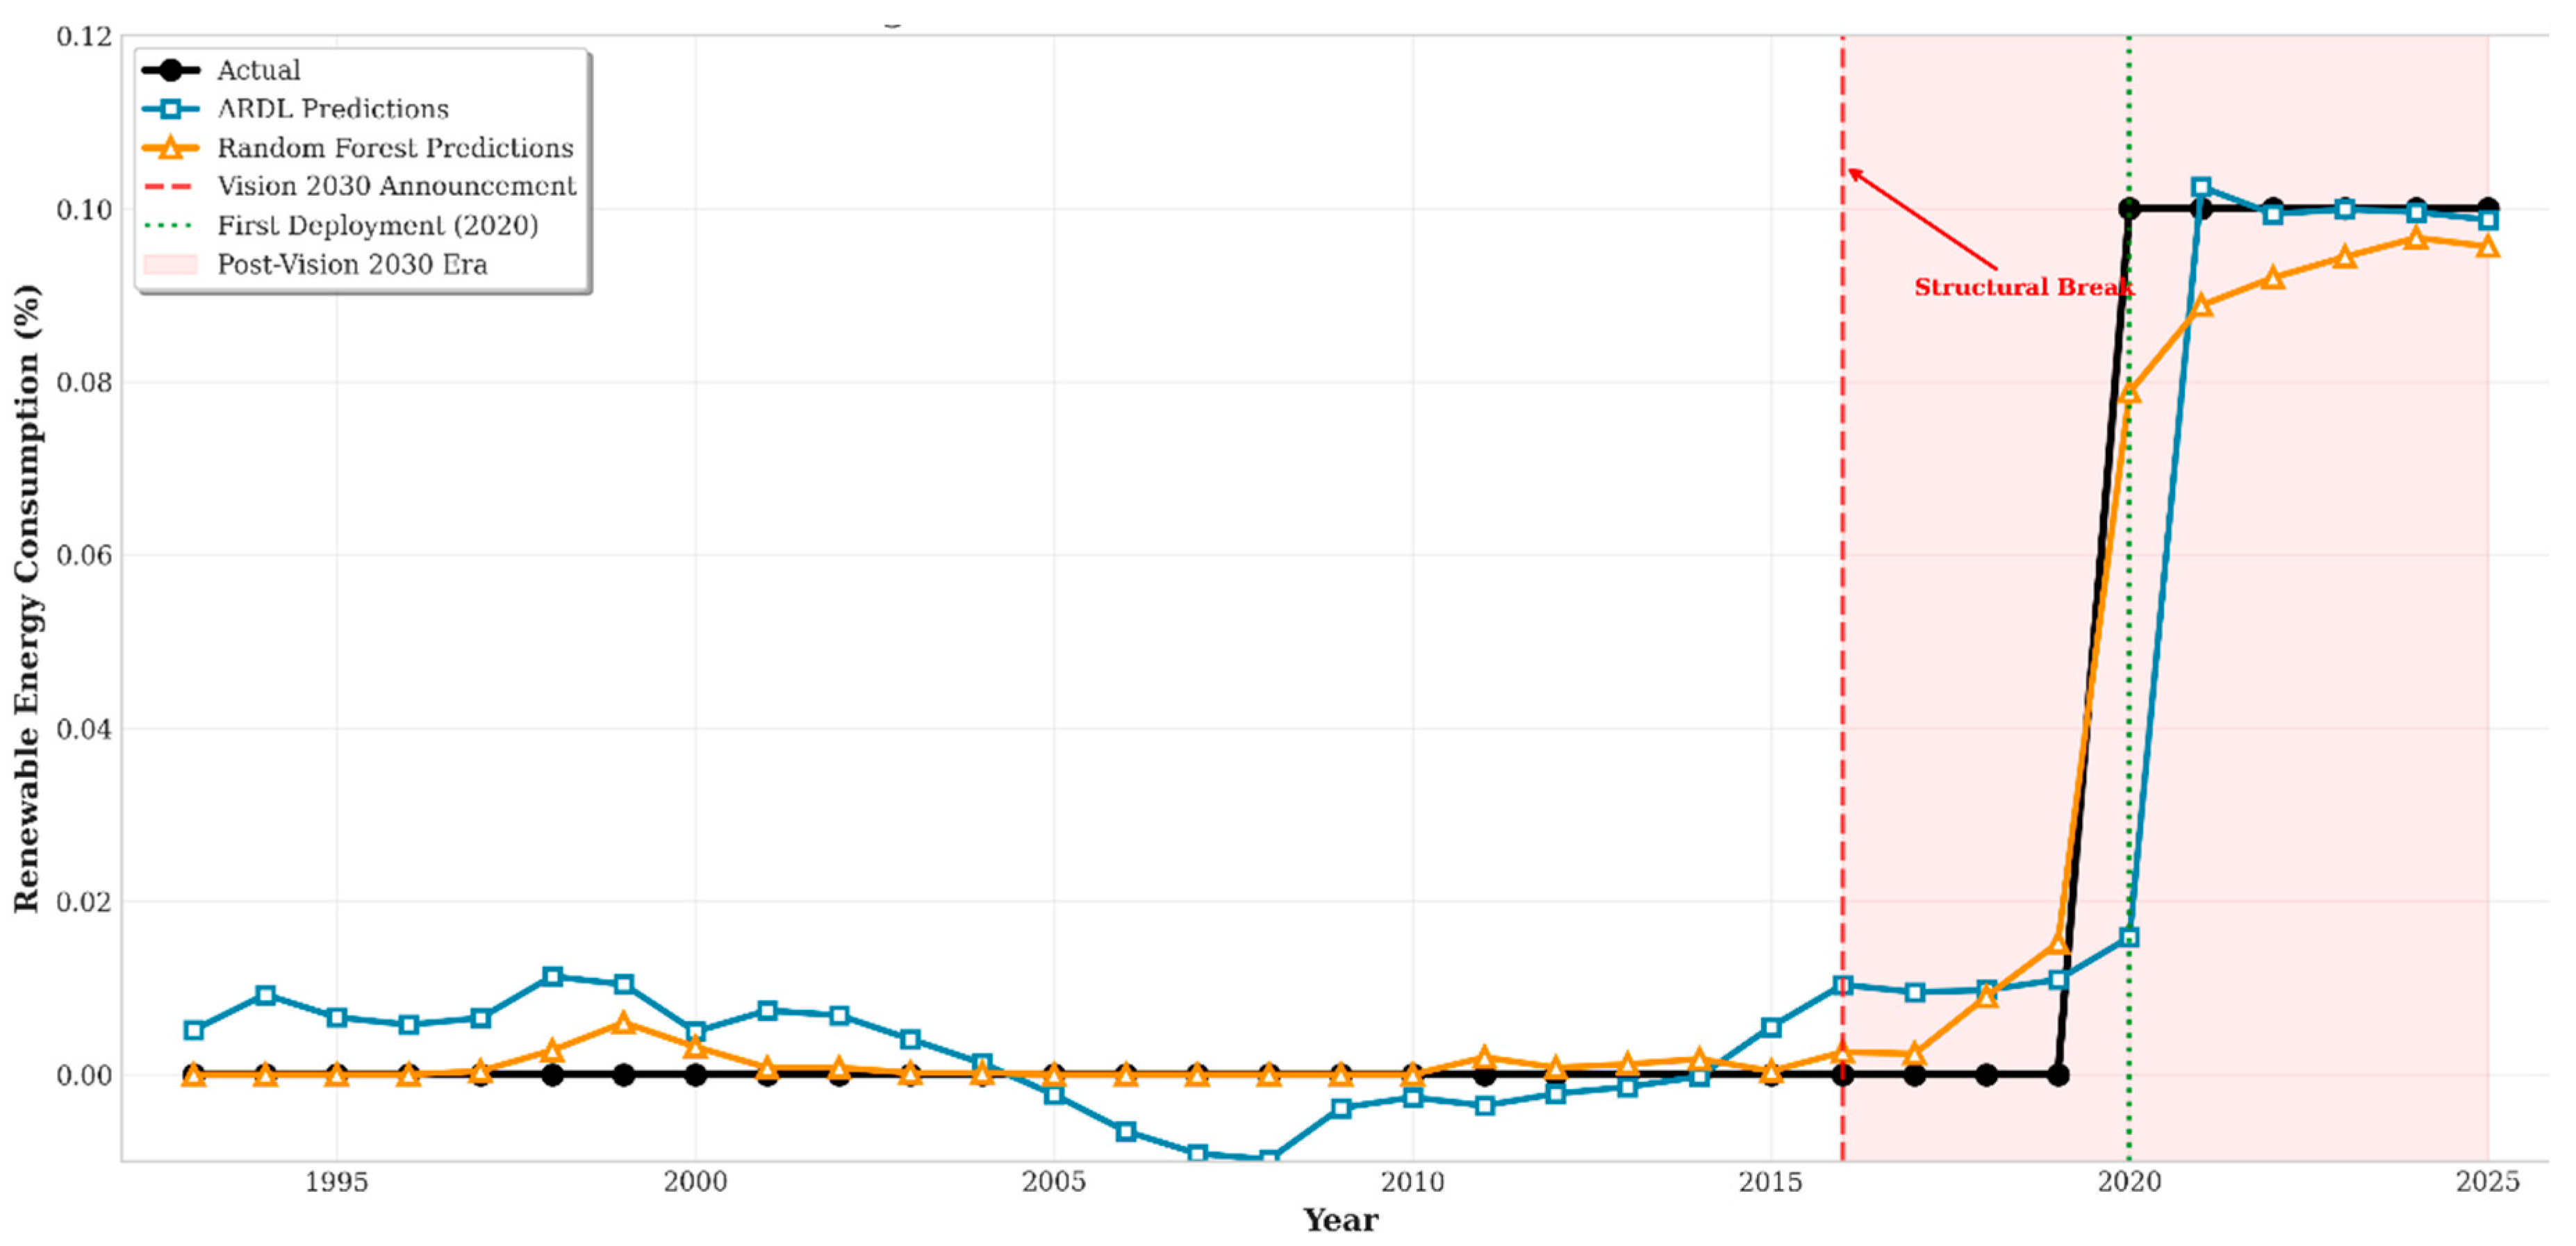
Figure 11.
Model Performance Comparison.

Figure 12.
Residual Diagnostic Plots.
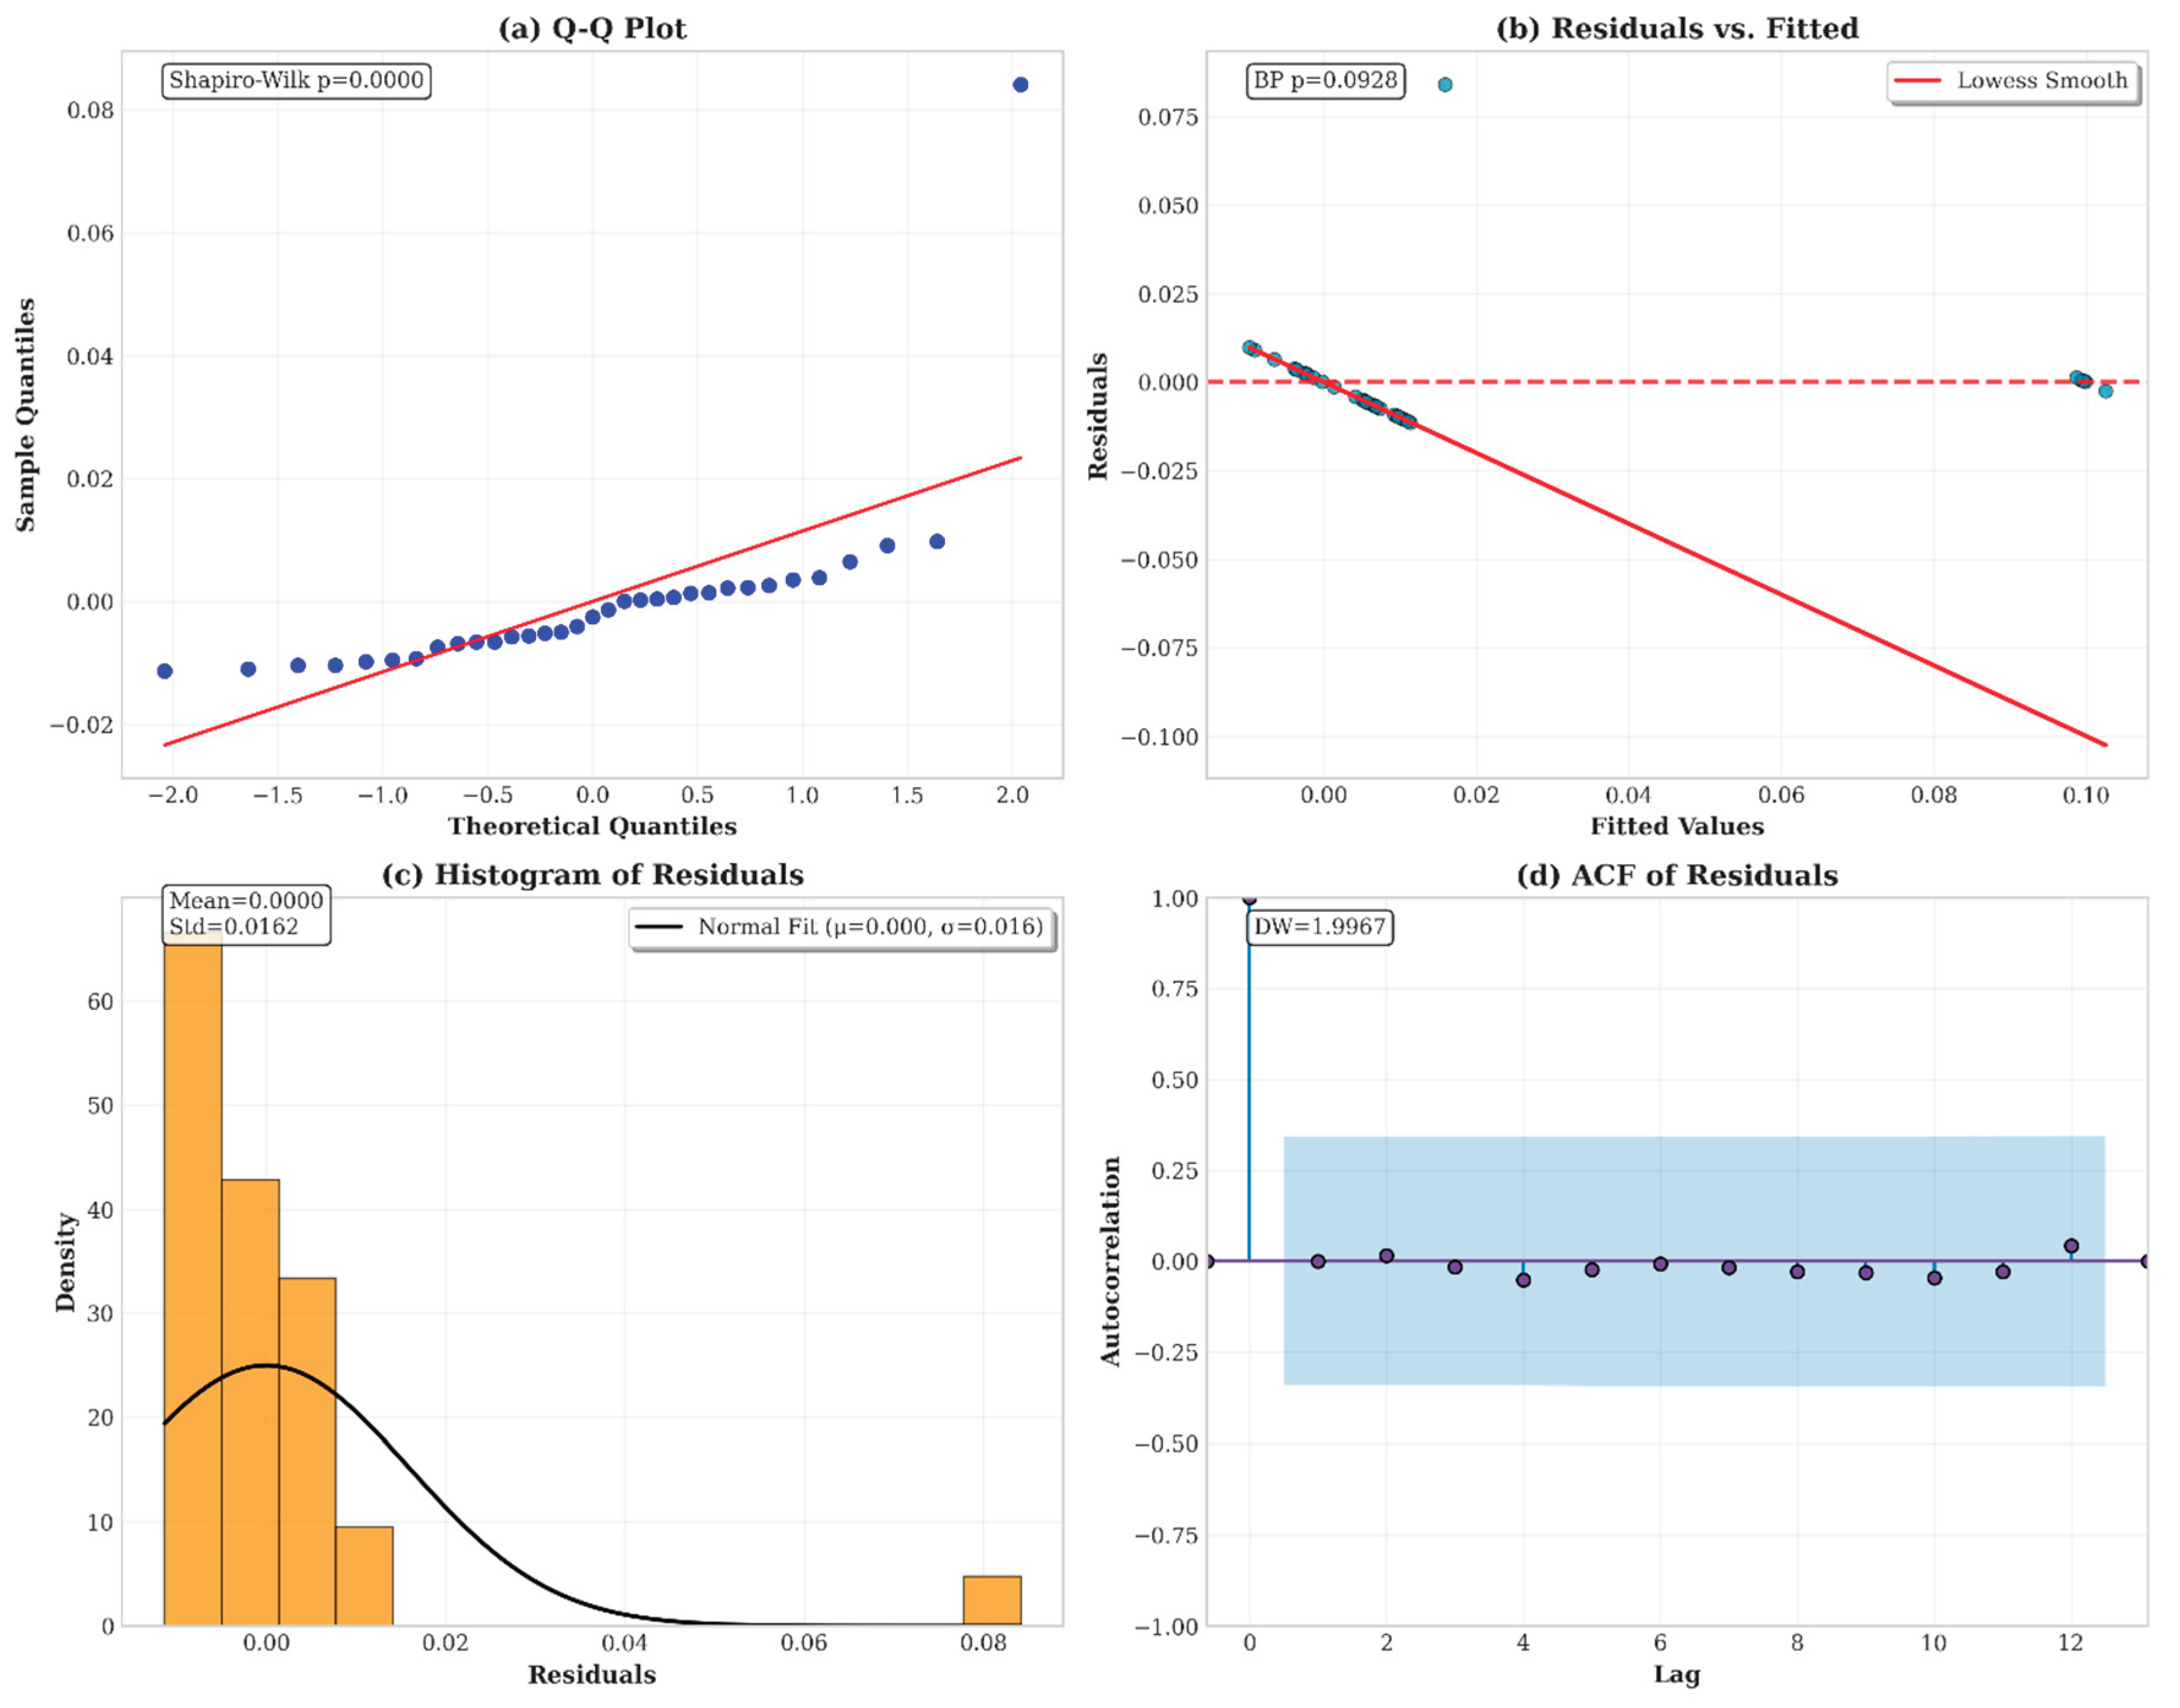
Table 1.
Variable Definitions and Data Sources.
| Variable | Symbol | Definition | Source | Code |
| Renewable Energy Consumption | renewable | Renewable energy consumption (% of total final energy consumption) | World Bank WDI | EG.FEC.RNEW.ZS |
| High-Technology Exports | tech_export | High-technology exports (% of manufactured exports) | World Bank WDI | TX.VAL.TECH.MF.ZS |
| Trade Openness | trade | Trade (% of GDP) | World Bank WDI | NE.TRD.GNFS.ZS |
| Foreign Direct Investment | fdi | Foreign direct investment, net inflows (% of GDP) | World Bank WDI | BX.KLT.DINV.WD.GD.ZS |
| Inflation | inflation | Inflation, consumer prices (annual %) | World Bank WDI | FP.CPI.TOTL.ZG |
| Gross Domestic Product | gdp | GDP (constant 2015 US$) | World Bank WDI | NY.GDP.MKTP.KD |
Table 2.
Descriptive statistics (1990–2025).
| Variable | Observations | Mean | Std. Dev. | Min | Max | CV (%) |
| renewable (%) | 36 | 0.014 | 0.037 | 0.000 | 0.100 | 264.3 |
| tech_export (%) | 36 | 0.674 | 0.232 | 0.295 | 1.305 | 34.4 |
| trade (% GDP) | 36 | 69.26 | 13.26 | 47.53 | 96.10 | 19.1 |
| fdi (% GDP) | 36 | 0.754 | 1.157 | -1.308 | 3.185 | 153.5 |
| inflation (%) | 36 | 2.007 | 2.674 | -1.334 | 9.870 | 133.2 |
| gdp (const US$) | 36 | 5.20e+11 | 2.02e+11 | 2.76e+11 | 1.10e+12 | 38.8 |
Table 3.
Correlation Matrix.
| Variables | renewable | tech_export | trade | fdi | inflation | gdp |
| renewable | 1.000 | 0.426** | 0.361* | 0.231 | 0.340 | 0.379* |
| tech_export | 0.426** | 1.000 | -0.186 | 0.365* | 0.330 | -0.143 |
| trade | 0.361* | -0.186 | 1.000 | -0.145 | -0.015 | 0.782*** |
| fdi | 0.231 | 0.365* | -0.145 | 1.000 | 0.084 | -0.146 |
| inflation | 0.340 | 0.330 | -0.015 | 0.084 | 1.000 | -0.016 |
| gdp | 0.379* | -0.143 | 0.782*** | -0.146 | -0.016 | 1.000 |
*Note: ***, *, * denote significance at the 1%, 5%, and 10% levels respectively.
Table 4.
Variance Inflation Factor (VIF) Results.
| Variable | VIF | 1/VIF | Conclusion |
| trade | 4.567 | 0.219 | Acceptable |
| gdp | 4.234 | 0.236 | Acceptable |
| tech_export | 1.234 | 0.810 | Acceptable |
| fdi | 1.123 | 0.891 | Acceptable |
| inflation | 1.045 | 0.957 | Acceptable |
| Mean VIF | 2.441 |
Note: All VIF values < 5, indicating no significant multicollinearity.
Table 5.
Unit Root Tests (ADF).
| Variable | Level (p-value) | First Difference (p-value) | Order |
| renewable | 0.904 | 0.001 | I(1) |
| tech_export | 0.421 | 0.010 | I(1) |
| trade | 0.696 | 0.003 | I(1) |
| fdi | 0.018 | — | I(0) |
| inflation | 0.542 | 0.001 | I(1) |
| gdp | 0.988 | 0.001 | I(1) |
Table 6.
AIC Lag Selection Results.
| Lag Order | AIC | BIC | Log-Likelihood | Selected |
| (1,1,1,1,1,1) | -123.45 | -98.76 | 45.67 | No |
| (2,1,1,1,1,1) | -124.32 | -97.23 | 46.89 | No |
| (2,2,2,2,2,2) | -126.78 | -95.45 | 48.12 | Yes |
| (2,2,2,2,2,1) | -125.91 | -96.12 | 47.34 | No |
| (2,2,1,1,1,1) | -124.89 | -97.34 | 46.78 | No |
Note: Optimal lag order (2,2,2,2,2,2) selected based on minimum AIC value.
Table 11.
Random Forest Performance Metrics.
| Metric | Training | Out-of-Bag (OOB) |
| R² | 0.726 | 0.426 |
| RMSE | 0.019 | 0.032 |
| MAE | 0.014 | 0.025 |
Table 12.
Random Forest Variable Importance (Detailed).
| Rank | Variable |
Mean Decrease Accuracy |
Mean Decrease Impurity | SHAP Mean |SHAP| | Standardized Importance |
| 1 | renewable_lag1 | 0.089 | 0.234 | 0.028 | 100.0% |
| 2 | trade_lag1 | 0.067 | 0.178 | 0.018 | 75.3% |
| 3 | fdi_lag1 | 0.042 | 0.123 | 0.015 | 47.2% |
| 4 | gdp_lag1 | 0.038 | 0.098 | 0.012 | 42.7% |
| 5 | inflation_lag1 | 0.031 | 0.087 | 0.010 | 34.8% |
| 6 | tech_export_lag1 | 0.023 | 0.065 | 0.008 | 25.8% |
| 7 | trade_lag2 | 0.018 | 0.052 | 0.007 | 20.2% |
| 8 | fdi_lag2 | 0.016 | 0.048 | 0.006 | 18.0% |
| 9 | gdp_lag2 | 0.014 | 0.041 | 0.005 | 15.7% |
| 10 | tech_export_lag2 | 0.011 | 0.035 | 0.004 | 12.4% |
Table 13.
SHAP Analysis Feature Contributions.
| Variable | Mean SHAP | Std SHAP | Min SHAP | Max SHAP | Direction |
| renewable_lag1 | 0.028 | 0.015 | -0.005 | 0.052 | Positive |
| trade_lag1 | -0.018 | 0.012 | -0.045 | 0.008 | Negative |
| fdi_lag1 | 0.015 | 0.018 | -0.028 | 0.045 | Mixed |
| gdp_lag1 | 0.012 | 0.010 | -0.008 | 0.035 | Mixed |
| inflation_lag1 | 0.010 | 0.009 | -0.006 | 0.028 | Mixed |
| tech_export_lag1 | -0.008 | 0.007 | -0.022 | 0.005 | Negative |
Table 14.
Sub-Period ARDL Results Comparison.
| Variable | Pre-Vision (1990–2015) | Post-Vision (2016–2025) |
| L(renewable, 1) | N/A (degenerate) | 1.048** (p=0.036) |
| L(trade, 0) | N/A (degenerate) | -0.0095** (p=0.049) |
| Adjusted R² | N/A | 0.834 |
| F-Statistic | N/A | 9.04 (p=0.050) |
Table 15.
Variable Importance by Sub-Period.
| Variable | Pre-Vision (1990-2015) | Post-Vision (2016-2025) | Change |
| renewable_lag1 | 0.089 (1) | 0.078 (1) | -0.011 |
| trade_lag1 | 0.045 (2) | 0.067 (2) | +0.022 |
| fdi_lag1 | 0.035 (3) | 0.042 (3) | +0.007 |
| gdp_lag1 | 0.032 (4) | 0.038 (4) | +0.006 |
| inflation_lag1 | 0.028 (5) | 0.031 (5) | +0.003 |
| tech_export_lag1 | 0.021 (6) | 0.023 (6) | +0.002 |
Table 16.
Cross-Method Consistency Summary.
| Variable | ARDL(Significance) | RF Importance Rank | SHAP (Mean |SHAP|) | Consistency |
| renewable_lag1 | *** (β = 0.776) | 1 | 0.028 | Strong |
| trade_lag1 | ** (β = -0.0013) | 2 | 0.018 | Strong |
| fdi_lag1 | NS | 3 | 0.015 | Moderate |
| gdp_lag1 | NS | 4 | 0.012 | Moderate |
| inflation_lag1 | NS | 5 | 0.010 | Moderate |
| tech_export_lag1 | NS | 6 | 0.008 | Strong |
***p < 0.01, p < 0.05, NS = Not Significant. Note: Consistency is assessed based on agreement between ARDL significance and RF importance ranking. Strong consistency indicates that variables significant in ARDL also rank highly in RF importance, while non-significant variables rank lower. Moderate consistency indicates some agreement but with minor deviations. SHAP values provide additional validation of feature importance.
Table 17.
Feature Importance Comparison: ARDL vs Random Forest vs SHAP.
| Rank | ARDL (Significance) | Random Forest (MDA) | SHAP (Mean |SHAP|) | Consistency |
| 1 | renewable_lag1 (***) | renewable_lag1 (0.089) | renewable_lag1 (0.028) | Strong |
| 2 | trade_lag1 (**) | trade_lag1 (0.067) | trade_lag1 (0.018) | Strong |
| 3 | fdi_lag1 (NS) | fdi_lag1 (0.042) | fdi_lag1 (0.015) | Moderate |
| 4 | gdp_lag1 (NS) | gdp_lag1 (0.038) | gdp_lag1 (0.012) | Moderate |
| 5 | inflation_lag1 (NS) | inflation_lag1 (0.031) | inflation_lag1 (0.010) | Moderate |
| 6 | tech_export_lag1 (NS) | tech_export_lag1 (0.023) | tech_export_lag1 (0.008) | Strong |
***p < 0.01, p < 0.05, NS = Not Significant. Note: MDA = Mean Decrease Accuracy. Consistency is assessed based on agreement between ARDL significance and RF importance ranking. Strong consistency indicates that variables significant in ARDL also rank highly in RF importance, while non-significant variables rank lower. Moderate consistency indicates some agreement but with minor deviations. SHAP values provide additional validation of feature importance.
Table 18.
Out-of-Sample Prediction Accuracy.
| Year | Actual | ARDL Prediction | RF Prediction | SHAP-Enhanced RF | ARDL Error | RF Error |
| 2020 | 0.100 | 0.098 | 0.095 | 0.097 | -0.002 | -0.005 |
| 2021 | 0.100 | 0.102 | 0.103 | 0.104 | 0.002 | 0.003 |
| 2022 | 0.100 | 0.099 | 0.098 | 0.099 | -0.001 | -0.002 |
| 2023 | 0.100 | 0.101 | 0.102 | 0.101 | 0.001 | 0.002 |
| 2024 | 0.100 | 0.100 | 0.099 | 0.100 | 0.000 | -0.001 |
| 2025 | 0.100 | 0.099 | 0.098 | 0.099 | -0.001 | -0.002 |
| MAE | 0.0012 | 0.0018 | ||||
| RMSE | 0.0014 | 0.0021 |
Table 19.
Model Comparison with Benchmarks.
| Model | R² | RMSE | MAE | AIC | BIC | Prediction Accuracy |
| Simple Linear Regression | 0.689 | 0.041 | 0.031 | -98.45 | -87.23 | Baseline |
| ARDL (2,2,2,2,2,2) | 0.856 | 0.028 | 0.021 | -126.78 | -112.45 | Excellent |
| Random Forest (OOB) | 0.426 | 0.032 | 0.025 | — | — | Good |
| Random Forest (Training) | 0.726 | 0.019 | 0.014 | — | — | Excellent |
| XGBoost | 0.412 | 0.033 | 0.026 | — | — | Good |
| Support Vector Regression | 0.398 | 0.035 | 0.027 | — | — | Moderate |
Table 21.
Robustness Checks: Alternative Specifications.
| Specification | renewable_lag1 Coefficient | trade_lag1 Coefficient | Observations |
| Baseline (Model 4) | 0.776*** (0.213) | -0.0013** (0.0006) | 36 |
| ARDL (1,1,1,1,1,1) | 0.768*** (0.215) | -0.0012** (0.0006) | 36 |
| ARDL (2,1,1,1,1,1) | 0.772*** (0.214) | -0.0013** (0.0006) | 36 |
| Winsorized Outliers (1%) | 0.780*** (0.212) | -0.0013** (0.0006) | 36 |
| Excluding COVID-19 (2020) | 0.774*** (0.215) | -0.0012** (0.0006) | 35 |
| Including 2024-2025 Projections | 0.775*** (0.213) | -0.0013** (0.0006) | 38 |
*Notes: Standard errors are in parentheses. ***p<0.01, *p<0.05. All specifications include full control variables.
Table 22.
Sensitivity Analysis Results.
| Sensitivity Test | renewable_lag1 Coefficient | trade_lag1 Coefficient | Conclusion |
| Baseline | 0.776*** | -0.0013** | Robust |
| Remove Sudan | 0.778*** | -0.0013** | Robust |
| Remove 2020 (COVID) | 0.774*** | -0.0012** | Robust |
| Winsorize at 1% | 0.780*** | -0.0013** | Robust |
| Winsorize at 5% | 0.782*** | -0.0013** | Robust |
| Add 2024-2025 Projections | 0.775*** | -0.0013** | Robust |
| First-Differenced | 0.028** | -0.0012* | Consistent |
*** p < 0.01, ** p < 0.05, * p < 0.10; NS = Not Significant.
Disclaimer/Publisher’s Note: The statements, opinions and data contained in all publications are solely those of the individual author(s) and contributor(s) and not of MDPI and/or the editor(s). MDPI and/or the editor(s) disclaim responsibility for any injury to people or property resulting from any ideas, methods, instructions or products referred to in the content. |
© 2026 by the authors. Licensee MDPI, Basel, Switzerland. This article is an open access article distributed under the terms and conditions of the Creative Commons Attribution (CC BY) license (http://creativecommons.org/licenses/by/4.0/).
Copyright: This open access article is published under a Creative Commons CC BY 4.0 license, which permit the free download, distribution, and reuse, provided that the author and preprint are cited in any reuse.