

Submitted:
02 September 2026
Posted:
02 September 2026
You are already at the latest version
Abstract
Parkinson's disease (PD) is a highly polygenic neurodegenerative disorder whose genome-wide association study (GWAS) discoveries have largely arisen from European-ancestry cohorts. We integrated the Nalls et al. European PD GWAS with Kim et al. multi-ancestry summary statistics (GCST90275127), which exclude the Nalls dataset. Both resources were aligned to GRCh37, quality controlled, allele harmonized, and combined by fixed-effect inverse-variance weighting. After quality control, 6,477,357 harmonized variants entered meta-analysis, and 7,085 reached P < 5 × 10⁻⁸. The strongest signals mapped to established PD regions, including SNCA (rs356220; OR = 1.270, P = 6.17 × 10⁻⁸⁶) and GBA (rs2230288; OR = 1.989, P = 4.94 × 10⁻⁵⁸). Stringent locus analysis at P < 5 × 10⁻⁹ using a 1000 Genomes all-ancestry linkage disequilibrium reference identified 357 independent significant variants, 128 lead variants, and 73 genomic risk loci among reference-covered variants. Forty-two loci mapped to pre-Kim regions, three to Kim-published loci, and 28 remained unresolved candidates. Genomic inflation was elevated in the combined statistic (λGC = 1.875 among common non-MHC variants), requiring ancestry-aware calibration. These results refine established PD association architecture and prioritize unresolved loci for independent validation without establishing novel PD loci.
Keywords:
parkinson’s disease
; genome-wide association study
; meta-analysis
; multi-ancestry genetics
; linkage disequilibrium
; genomic risk loci
; heterogeneity
; candidate loci
1. Introduction
Parkinson’s disease (PD) is the second most common neurodegenerative disorder and is characterized clinically by bradykinesia, rigidity, tremor and a broad spectrum of non-motor features. Although monogenic forms have established direct roles for genes such as SNCA, LRRK2 and GBA1 in PD biology, most common PD risk is polygenic and is distributed across many loci of modest effect. Genome-wide association studies (GWAS) have therefore become central to defining the common-variant architecture of PD and to prioritizing biological pathways for mechanistic studies and therapeutic development [1,2].
A major milestone was the 2019 European-ancestry meta-analysis by Nalls et al., which analyzed approximately 7.8 million variants in 37,688 clinically affected cases, 18,618 UK Biobank proxy cases and approximately 1.4 million controls. That study identified 90 independent genome-wide significant risk signals across 78 genomic regions and demonstrated that a substantial component of PD heritability could be captured by common variation [1]. However, the predominance of European-ancestry discovery cohorts limited inference regarding ancestry-shared versus ancestry-dependent effects and reduced the generalizability of risk estimates to globally diverse populations [2,3,4,5].
More recently, Kim et al. performed a large multi-ancestry PD meta-analysis spanning European, East Asian, Latin American and African ancestry cohorts. The full study included 49,049 cases, 18,785 proxy cases and 2,458,063 controls and reported 78 independent genome-wide significant loci, including 12 potentially novel regions [6]. Importantly for the present analysis, the authors made an immediately accessible summary-statistic version available under GWAS Catalog accession GCST90275127 that excludes Nalls et al., 23andMe post-Chang and PDWBS while retaining analyzed SNPs [6]. This provides an opportunity for a secondary integrative analysis in which the established European Nalls signal architecture can be combined with a complementary multi-ancestry resource while reducing direct duplication of the Nalls meta-analysis.
The aim of the present study was not to replace the original cohort-level analyses or to perform a systematic meta-analysis of every published PD GWAS. Instead, we sought to evaluate the added value of harmonizing two major publicly accessible summary-statistic resources and to determine whether their integration could (i) refine pooled effect estimates, (ii) quantify between-resource heterogeneity, (iii) recover established PD risk architecture, (iv) reconstruct LD-defined genomic risk loci using an all-ancestry reference, and (v) prioritize unresolved association regions for systematic literature review, functional annotation and independent replication. Because only two aggregate study-level effect estimates were available per SNP and one source is itself multi-ancestry, we treated heterogeneity and genomic inflation diagnostics conservatively and avoided claiming unresolved regions as novel discoveries.
2. Materials and Methods
2.1. Study Design and Data Sources
This study was a secondary analysis of publicly accessible GWAS summary statistics. The European-ancestry source was the Nalls et al. PD meta-analysis (GWAS Catalog accession GCST009325) [1]. The multi-ancestry source was the immediately accessible summary-statistic dataset associated with Kim et al. (GCST90275127) [6]. The Kim publication states that this accessible dataset excludes Nalls et al., 23andMe post-Chang and the Web-Based Study of Parkinson’s Disease, thereby reducing direct duplication with the Nalls dataset [6]. Because the downloaded summary files are aggregate resources, residual participant overlap among other upstream cohorts cannot be completely audited from the summary statistics alone.
Both datasets were supplied on the GRCh37/hg19 coordinate system; therefore no genome-build conversion was required. In the Nalls file, the principal association fields were chromosome, base-pair position, effect allele, other allele, beta, standard error, P value, effect-allele frequency, and case/control counts where available. In the Kim file, the fixed-effect statistics beta_fe, standard_error_fe and p_value_fe were used deliberately rather than random-effects fields, together with chromosome, base-pair position, rsID and effect-allele frequency.
2.2. Variant-Level Quality Control
Quality control was performed independently within each summary-statistic dataset before harmonization. Analyses were restricted to autosomes 1–22. Variants were required to be biallelic single-nucleotide substitutions encoded by A, C, G or T, with finite effect estimates, finite standard errors greater than zero and valid P values. Minor-allele frequency (MAF) was calculated from effect-allele frequency where available and variants with MAF<0.01 were excluded. INFO-score filtering had been planned at INFO≥0.80, but an INFO field was absent from both downloaded summary-statistic files; consequently, no post-download INFO filter was applied, and this limitation was retained in the analysis record.
Duplicate genomic positions within each source were removed. The Nalls file did not provide an rsID field in the standardized extraction used during the initial stage; missing identifiers were therefore represented internally by chromosome:position keys. The Kim file provided rsIDs.
2.3. Allele Harmonization
Variants were merged by chromosome and GRCh37 base-pair position. Palindromic A/T, T/A, C/G and G/C SNPs were excluded to avoid strand ambiguity because allele-frequency differences across ancestries can make orientation inference unreliable. For non-palindromic variants, alleles were evaluated as direct matches, swapped matches, strand complements or strand-complement swaps. When the Kim effect allele corresponded to the opposite allele after harmonization, the Kim beta was multiplied by -1 and effect-allele frequency was transformed as 1-EAF. Irreconcilable allele mismatches were excluded.
Following harmonization, 6,429,008 variants were direct matches and 48,349 required allele swapping, while 1,162 mismatches were removed. A total of 1,155,428 palindromic variants had been removed before final effect alignment.
2.4. Fixed-Effect Inverse-Variance Weighted Meta-Analysis
For each harmonized SNP, a fixed-effect inverse-variance weighted (IVW) meta-analysis was performed. With study-specific log-odds effect estimate βᵢ and standard error SEᵢ, the weight was wᵢ=1/SEᵢ². The pooled estimate was βmeta=Σ(wᵢβᵢ)/Σwᵢ, with SEmeta=√(1/Σwᵢ), Zmeta=βmeta/SEmeta, and a two-sided P value derived from the standard normal distribution. Odds ratios and 95% confidence intervals were calculated as exp(βmeta) and exp(βmeta±1.96×SEmeta), respectively. This approach is equivalent to standard fixed-effect GWAS meta-analysis practice [9].
A fixed-effect framework was selected because only two aggregate source estimates were available for each SNP; with k=2, a random-effects variance component is weakly estimated and can become unstable. Consequently, the primary meta-analysis estimates an average common effect and heterogeneity statistics are reported as descriptive diagnostics rather than as definitive evidence for or against ancestry-specific effects.
2.5. Between-Study Heterogeneity
Cochran’s Q statistic was computed from the weighted squared deviation of each study effect from the pooled effect. With two sources, Q has one degree of freedom. I² was estimated as max[0,(Q−1)/Q]×100%. Variants were additionally flagged when the Nalls and Kim beta estimates had opposite signs. Nominal heterogeneity was defined as Phet<0.05, while a Bonferroni threshold based on the number of meta-analyzed variants was used as a stringent genome-wide heterogeneity criterion.
2.6. Significance Thresholds and Genomic Inflation
Conventional genome-wide significance was defined as P<5×10⁻⁸. Because the Kim multi-ancestry analysis used a more stringent threshold to account for greater haplotypic diversity, P<5×10⁻⁹ was used as a sensitivity threshold for locus prioritization [6]. Genomic inflation was summarized using λGC=median(χ²)/median(χ²₁). In addition to the complete dataset, inflation was recalculated among variants common in both sources (MAF≥0.05) after excluding the extended MHC region on chromosome 6 (25–34 Mb, GRCh37). No post-hoc genomic-control correction was applied to the association statistics because λGC can increase with sample size and true polygenicity and does not by itself distinguish biological signal from confounding [10].
2.7. Manhattan, QQ and Forest-Plot Visualization
The Manhattan plot was generated from the complete meta-analysis statistics with deterministic thinning of non-significant background variants for graphical efficiency while retaining all variants with P<1×10⁻⁵. Statistical calculations were always performed on the full dataset. Selected established PD loci were annotated using the strongest annotated lead signal per region. For the QQ plot, expected quantiles were calculated from the complete ranked set before any graphical thinning. The primary displayed QQ diagnostic used common variants (MAF≥0.05 in both datasets) with the extended MHC excluded. A forest plot summarized pooled odds ratios and 95% confidence intervals for the 20 most significant LD-independent lead SNPs.
2.8. Lead-SNP Identification and Functional Annotation
An initial lead-SNP overview was generated using 1000 Genomes European LD clumping (r²<0.10 within 1 Mb), yielding 161 EUR-LD-independent lead variants. Consequence annotation and nearest protein-coding gene assignment were obtained using Ensembl GRCh37 Variant Effect Predictor resources [11]. These lead-level results were used for the top-signal forest plot and descriptive locus labels, but they were not treated as the definitive unit of locus discovery.
2.9. All-Ancestry Genomic-Risk-Locus Reconstruction
For the primary locus-level analysis, we implemented a local FUMA-style procedure based on the locus definitions used by Kim et al. and the FUMA framework [6,7]. A merged 1000 Genomes Phase 3 reference comprising AFR, AMR, EAS, EUR and SAS superpopulations was used for LD calculations. The local merged panel contained 2,490 individuals and 1,836,406 variants. The 1000 Genomes Project provides a global reference across 26 populations and five major continental ancestry groups [8].
Variants with P<5×10⁻⁹ and valid rsIDs were intersected with the all-ancestry LD panel. Independent significant SNPs were defined by clumping at r²<0.6; lead SNPs were then defined at r²<0.1. For each independent significant SNP, LD proxies with r²≥0.6 within 10 Mb were used to define signal boundaries, and LD blocks separated by <250 kb were merged into a single genomic risk locus. This approximates the FUMA locus-definition strategy but was executed locally with PLINK rather than through the FUMA web interface [6,7].
A key coverage limitation was that only 1,076 of 5,708 stringent significant rsID variants (18.85%) were represented in the local 1000 Genomes all-ancestry reference. Therefore, the resulting genomic-risk-locus catalogue represents the subset that could be LD-defined with the available reference and should not be considered exhaustive.
2.10. Reference-Locus Comparison and Candidate Classification
To distinguish established from unresolved regions, genomic risk loci were compared with a 92-variant pre-Kim PD reference consisting of the 90 Nalls risk variants plus two East Asian risk loci from Foo et al. [1,3], and separately with the 12 potentially novel loci reported by Kim et al. [6]. A locus was classified as established/pre-Kim or Kim-published when its LD-defined interval overlapped, or lay within 250 kb of, the corresponding reference signal. Regions not meeting these criteria were classified as unresolved candidates requiring external review and replication. ‘Unresolved’ was explicitly not treated as synonymous with ‘novel’. Candidate ranks U01–U28 were assigned by increasing meta-analysis P value for visualization and tabulation.
2.11. Statistical Software and Reproducibility
Data processing and meta-analysis were implemented in R 4.5.2 using data.table together with shell/Python utilities for file validation and table handling. PLINK 1.9 was used for LD clumping and LD calculations. Ensembl GRCh37 resources were used for variant annotation. MD5 checksum validation was performed for downloaded GWAS and LD-reference files. Intermediate harmonized data, complete meta-analysis results, heterogeneity outputs, locus tables, scripts and publication figures were retained as reproducible analysis artifacts.
2.12. Ethics
This work used de-identified, aggregate GWAS summary statistics and did not involve recruitment of new participants or access to individual-level genotype/phenotype data. Ethical approvals and informed consent were obtained by the original contributing studies as described in their source publications. The authors should confirm whether their institution requires a formal exemption or determination for secondary analysis of public summary statistics before submission.
3. Results
3.1. Quality Control and Harmonization
The Nalls source contained 17,510,617 input records, of which 8,331,264 variants remained after the implemented variant-level QC. The Kim source contained 8,938,152 input records, of which 8,264,720 remained. The two sources shared 7,633,947 genomic positions. Removal of 1,155,428 palindromic variants and exclusion of 1,162 irreconcilable allele configurations produced 6,477,357 harmonized variants for meta-analysis. Among these, 6,429,008 required no effect-direction change and 48,349 required allele swapping and beta reversal.

Table 1.
Summary of quality control, harmonization and locus analysis.
| Stage | Metric | Result |
|---|---|---|
| Input/QC | Nalls records → retained | 17,510,617 → 8,331,264 |
| Input/QC | Kim records → retained | 8,938,152 → 8,264,720 |
| Harmonization | Shared genomic positions | 7,633,947 |
| Harmonization | Palindromic variants removed | 1,155,428 |
| Harmonization | Final meta-analyzed variants | 6,477,357 |
| Association | P<5×10⁻⁸ variants | 7,085 |
| EUR LD clumping | LD-independent lead SNPs | 161 |
| Stringent sensitivity | Lead SNPs with P<5×10⁻⁹ | 110 |
| All-ancestry LD | Strict significant rsID SNPs | 5,708 |
| All-ancestry LD | Represented in 1000G ALL | 1,076 (18.85%) |
| All-ancestry LD | Independent significant SNPs (r²<0.6) | 357 |
| All-ancestry LD | Lead SNPs (r²<0.1) | 128 |
| Locus definition | Genomic risk loci | 73 |
| Classification | Pre-Kim known / Kim-published / unresolved | 42 / 3 / 28 |
| Inflation | λGC, common non-MHC: Nalls / Kim / meta | 1.089 / 1.136 / 1.875 |
3.2. Genome-Wide Association Profile
A total of 7,085 variants exceeded the conventional P<5×10⁻⁸ threshold. The Manhattan plot showed the expected highly polygenic PD architecture, with the strongest peak at the SNCA region on chromosome 4 and additional prominent peaks at GBA, MCCC1, BST1, TMEM175, HLA-DQA1, HIP1R, MAPT and RIT2, among other established regions (Figure 1). The most significant pooled association was rs356220 at the SNCA locus (OR=1.270, P=6.17×10⁻⁸⁶). At GBA, rs2230288 showed a large risk effect (OR=1.989, P=4.94×10⁻⁵⁸). Other highly significant lead variants included rs10513789 near MCCC1 (OR=1.179, P=1.17×10⁻⁴⁰), rs4698412 at BST1 (OR=1.127, P=7.54×10⁻³²) and rs10847864 at HIP1R (OR=1.120, P=1.49×10⁻²⁵).
3.3. Genomic Inflation and QQ Diagnostics
The source-specific genomic-inflation factors were modest, whereas the pooled IVW statistic showed substantial genome-wide elevation. In the common-variant non-MHC diagnostic set (4,505,326 SNPs), λGC was 1.089 for Nalls, 1.136 for Kim and 1.875 for the combined meta-analysis (Figure 2). The QQ curve for the combined statistic deviated from the null over a broad portion of the distribution rather than only at the extreme tail. Given the large sample size, high polygenicity of PD and ancestry heterogeneity in one source, λGC cannot be interpreted as a direct estimate of confounding. However, the magnitude of the elevation is sufficiently large that the combined P values should be interpreted cautiously until ancestry-aware calibration can be performed [10].
3.4. LD-Independent Lead Variants and Effect Sizes
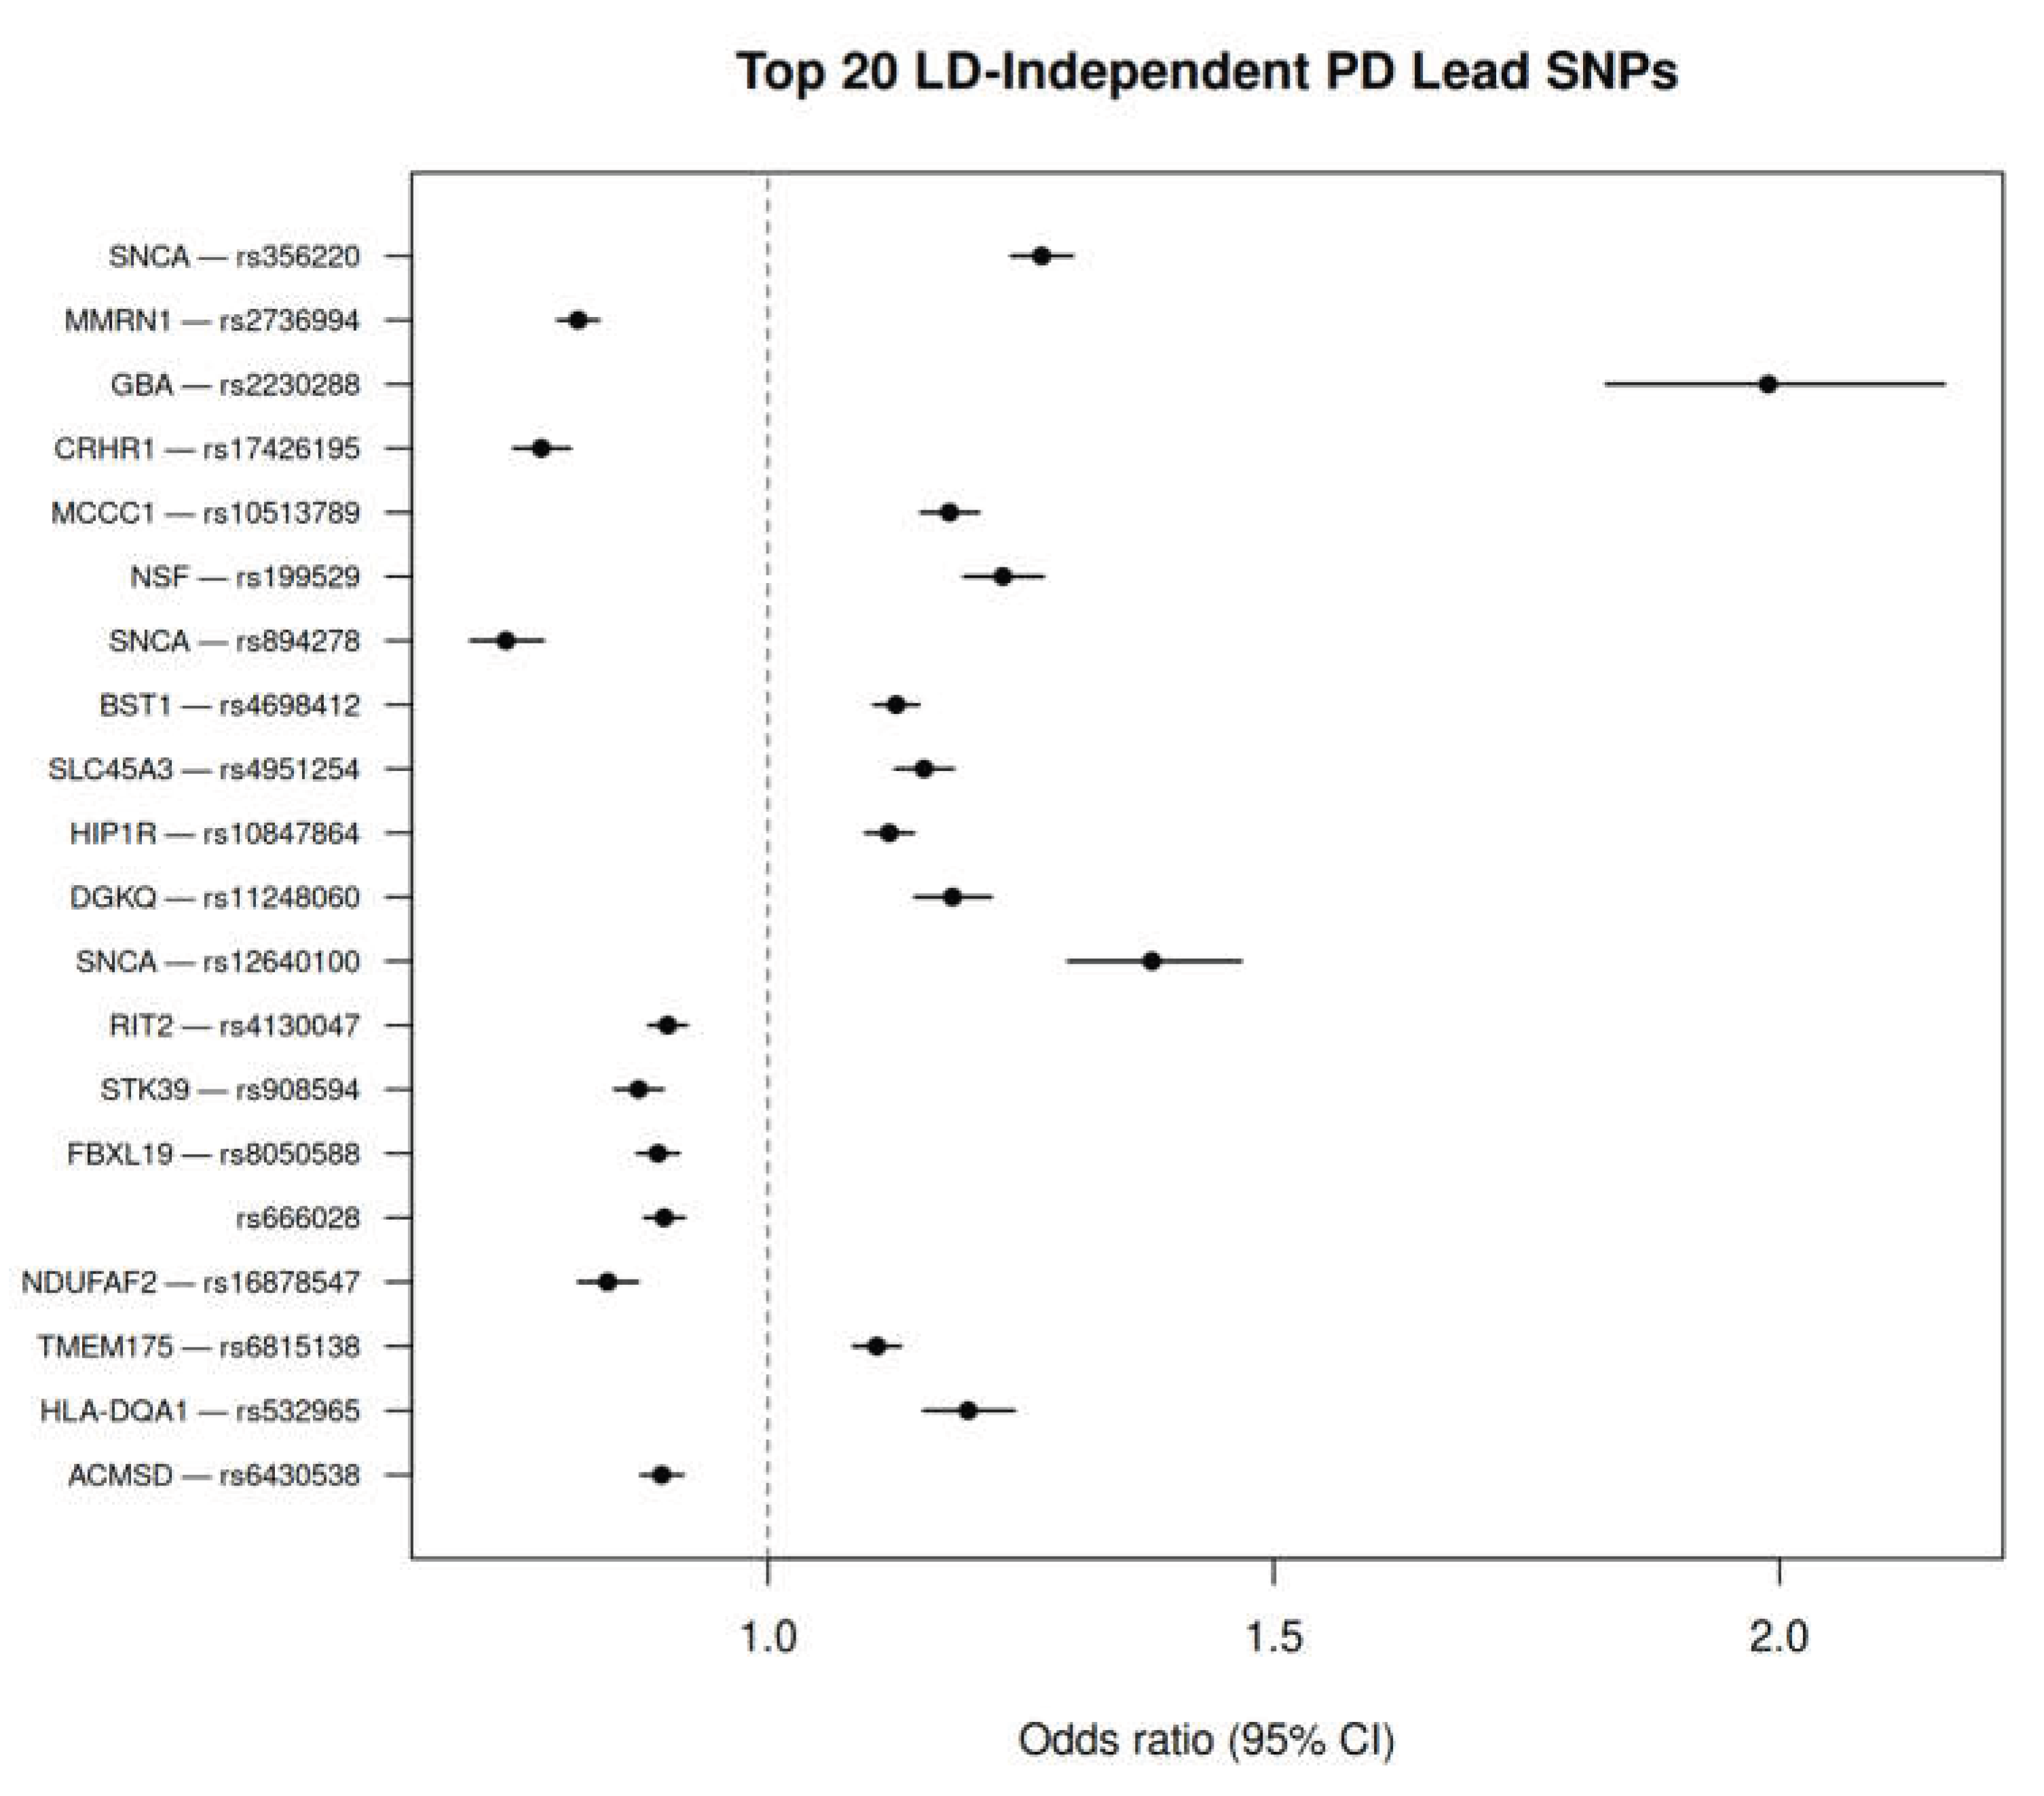
European-reference LD clumping identified 161 lead SNPs at r²<0.10, of which 110 also met the stringent P<5×10⁻⁹ threshold. The top-20 forest plot (Figure 3) demonstrates that several highly significant associations were risk increasing, whereas others were protective with respect to the harmonized effect allele. Multiple independent lead variants occurred within the broader SNCA region, illustrating why lead-SNP counts should not be equated with counts of biologically distinct loci.
3.5. Between-Source Heterogeneity
Across the full meta-analysis, 21,172 variants had nominal Phet<0.05, but none passed the Bonferroni heterogeneity threshold of 7.72×10⁻⁹. Among the 161 EUR-LD-independent lead variants, only four showed nominal Phet<0.05 and I²≥75%: rs6599389 (TMEM175 region), rs11944132 (BST1 region), rs11174631 (SLC2A13 region) and rs6851219 (FAM47E region). Because heterogeneity testing is based on only two aggregate estimates, these values are best interpreted as flags for follow-up rather than precise estimates of cross-ancestry heterogeneity.
3.6. All-Ancestry LD-Defined Genomic Risk Loci
At the stringent P<5×10⁻⁹ threshold, 5,708 significant variants had rsIDs, but only 1,076 (18.85%) were represented in the local all-ancestry 1000 Genomes LD panel. Within this analyzable subset, clumping at r²<0.6 produced 357 independent significant variants, and further clumping at r²<0.1 produced 128 lead variants. Merging LD blocks separated by <250 kb yielded 73 genomic risk loci. Of these, 42 overlapped pre-Kim PD reference loci, three corresponded to loci published by Kim et al., and 28 were unresolved and required external review/replication.
The locus-level procedure correctly consolidated complex established regions. The SNCA locus (PDL025; chr4:90,432,177–91,230,579) contained 35 independent significant SNPs and 15 r²<0.1 lead SNPs, with rs356220 as the principal index SNP. The GBA locus (PDL003; chr1:155,024,309–155,206,167) contained six independent significant SNPs and three lead SNPs, indexed by rs2230288. The MAPT locus (PDL063; chr17:43,487,968–44,863,133) contained 27 independent significant SNPs and four lead SNPs, indexed by rs17426195. These findings demonstrate the value of locus-based rather than SNP-count-based interpretation.
3.7. Unresolved Candidate Loci
Twenty-eight LD-defined regions remained unresolved after comparison with the selected pre-Kim and Kim-published PD reference sets. The candidate set was evenly split by pooled effect direction (14 OR>1 and 14 OR<1). Their main-index P values ranged from 2.25e-26 to 4.72e-9. The strongest unresolved region was PDL004 on chromosome 1 (156,030,037–156,154,860), indexed by rs35643925 (OR=1.559, P=2.25×10⁻²⁶), with three independent significant SNPs. This locus was 824,403 bp from the nearest reference signal used in the comparison. The second-ranked unresolved region was PDL017 on chromosome 3 (58,189,680–58,218,352), indexed by rs4488803 (OR=0.904, P=1.83×10⁻¹⁴). Additional candidates included rs847680 (PDL064; OR=1.141, P=3.38×10⁻¹¹), rs11941079 (PDL023; OR=0.846, P=5.12×10⁻¹¹), rs11130092 (PDL016; OR=1.079, P=5.56×10⁻¹¹), and rs117797654 (PDL039; OR=1.365, P=2.29×10⁻¹⁰).
These 28 regions should not be labeled novel at present. Several are only modestly beyond a 250-kb reference boundary—for example, PDL066 (rs116916712) lies approximately 302 kb from the Kim FASN reference signal—illustrating that novelty classification can be sensitive to arbitrary physical-distance thresholds. Comprehensive PD GWAS Catalog review, ancestry-specific LD comparison, fine-mapping and independent replication are required before any locus can be promoted to a potentially novel PD association.
Table 2.
Ten strongest unresolved candidate genomic risk loci.
| Rank | Locus | Chr | Index SNP | OR | P | Independent SNPs | Distance to reference |
|---|---|---|---|---|---|---|---|
| U01 | PDL004 | 1 | rs35643925 | 1.559 | 2.25e-26 | 3 | 824,403 bp |
| U02 | PDL017 | 3 | rs4488803 | 0.904 | 1.83e-14 | 2 | 9,440,691 bp |
| U03 | PDL064 | 17 | rs847680 | 1.141 | 3.38e-11 | 2 | 3,357,270 bp |
| U04 | PDL023 | 4 | rs11941079 | 0.846 | 5.12e-11 | 1 | 5,172,920 bp |
| U05 | PDL016 | 3 | rs11130092 | 1.079 | 5.56e-11 | 1 | 2,156,555 bp |
| U06 | PDL068 | 20 | rs2295547 | 1.074 | 9.14e-11 | 3 | 2,825,758 bp |
| U07 | PDL065 | 17 | rs8080714 | 1.080 | 1.12e-10 | 1 | 6,354,811 bp |
| U08 | PDL039 | 7 | rs117797654 | 1.365 | 2.29e-10 | 1 | 34,908,028 bp |
| U09 | PDL052 | 12 | rs61754230 | 1.299 | 3.81e-10 | 1 | 25,760,360 bp |
| U10 | PDL069 | 20 | rs1316709 | 0.931 | 4.05e-10 | 1 | 15,979,789 bp |
4. Discussion
This integrative summary-statistic meta-analysis demonstrates that combining a major European PD GWAS with a complementary publicly accessible multi-ancestry resource recovers the core architecture of PD risk while producing a prioritized set of unresolved regions for follow-up. The strongest association signals at SNCA, GBA and the MAPT region are biologically and epidemiologically consistent with established PD genetics, providing an internal validity check on the allele-harmonization and meta-analysis workflow. Importantly, LD-based locus reconstruction reduced thousands of significant variants to a more interpretable set of genomic regions, reinforcing the principle that association counts should be interpreted at the locus rather than raw-SNP level.
The study is best viewed as an integrative refinement analysis rather than a new primary multi-ancestry GWAS. Nalls et al. already represents a meta-analysis of 17 European-ancestry datasets, while Kim et al. aggregates multiple ancestry groups and applies ancestry-aware approaches in its original analysis [1,6]. Our use of the immediately accessible Kim summary statistics has a specific advantage: the source publication states that this version excludes the Nalls dataset, reducing direct duplication with our European source [6]. Nevertheless, the present analysis still operates on only two aggregate effect estimates per SNP. It cannot recover cohort-specific covariance, ancestry-specific effects or the internal heterogeneity that has already been compressed within the Kim fixed-effect statistic. Accordingly, the pooled estimate should be interpreted as a secondary cross-resource synthesis.
The association results demonstrate substantial gain in statistical precision for established regions. For example, SNCA rs356220 reached P=6.17×10⁻⁸⁶ with a pooled OR of 1.27, and the GBA-region missense variant rs2230288 showed an OR near 2.0. At the same time, the forest plot shows multiple significant signals within the same broad genomic regions. The all-ancestry locus analysis appropriately merged these into larger genomic risk intervals; the SNCA interval alone contained 35 independent significant variants and 15 r²<0.1 lead variants. This distinction is central to avoiding inflated claims based on correlated SNP counts.
The 28 unresolved loci are the most immediately actionable output for downstream research, but they should not be described as 28 novel discoveries. Their status reflects failure to match the chosen reference panel under the implemented physical/LD criteria, not absence from the entirety of the PD literature. Candidate ranking nevertheless provides a rational triage strategy. PDL004/rs35643925 is particularly notable because its pooled P value is substantially stronger than the other unresolved regions; however, its location less than 1 Mb from a reference signal means that regional LD and historical locus boundaries require careful scrutiny. Likewise, the proximity of PDL066 to the published FASN locus demonstrates that a strict 250-kb cutoff can classify biologically adjacent signals as unresolved. A formal novelty audit should therefore incorporate GWAS Catalog records, recent ancestry-specific studies, LD proxies, conditional analyses and, ideally, independent replication.
The most important statistical caution is the genomic inflation of the combined meta-analysis. Source-specific λGC values were modest on the common non-MHC subset, whereas the pooled λGC reached 1.875. In very large GWAS, λGC is expected to increase under polygenicity even without confounding because greater power shifts the genome-wide χ² distribution upward [10]. Consequently, simple genomic-control division by λGC can over-correct and remove genuine signal. Nevertheless, the broad QQ deviation is too pronounced to dismiss solely as a plotting artifact. Standard European LD-score regression would not be fully appropriate for a statistic containing an aggregated multi-ancestry component unless ancestry-matched LD scores and effective sample sizes are available. Thus, an ancestry-aware calibration strategy should precede any strong claim based on newly prioritized associations.
A second limitation is incomplete LD-reference coverage. Only 18.85% of stringent significant rsID variants were represented in the local 1000 Genomes all-ancestry panel used for PLINK-based locus reconstruction. The resulting 73 loci therefore describe the analyzable LD-covered subset, not the full set of statistically significant variants. This low intersection could reflect differences in variant density, imputation panels, allele frequency and the composition of the local 1000 Genomes PLINK resource. Future analyses should use ancestry-weighted or larger reference panels matched to the source GWAS variant set, and should evaluate whether the currently unresolved signals remain independent under those references.
Despite these limitations, the study provides several useful contributions. First, it supplies a transparent harmonized framework for combining large PD summary-statistic resources. Second, it quantifies effect consistency and flags high-heterogeneity signals. Third, it converts a dense association landscape into LD-defined loci with explicit known/published/unresolved classification. Fourth, it generates a bounded set of 28 candidate regions suitable for systematic functional follow-up. Such candidate prioritization is valuable even when no immediate novelty claim is made because it directs eQTL colocalization, chromatin interaction analyses, fine-mapping, pathway analyses and replication resources to specific intervals.
Future work should therefore proceed in three directions. First, the 28 unresolved loci should undergo a literature-wide PD association audit through the current GWAS Catalog and recent ancestry-specific studies, including African, East Asian and Latin American cohorts [3,4,5,6]. Second, candidate regions should be fine-mapped using ancestry-matched LD and, where possible, ancestry-specific summary statistics rather than the aggregated Kim fixed-effect estimate. Third, functional prioritization should integrate brain and blood eQTLs, cell-type-specific expression, chromatin accessibility and colocalization to distinguish causal genes from nearest-gene annotations. Independent replication in a cohort not contributing to either source resource will be essential before any candidate is described as a newly established PD susceptibility locus.
5. Conclusions
Integration of the Nalls European PD GWAS with the publicly accessible Kim multi-ancestry summary statistics produced a harmonized meta-analysis of 6.48 million variants and robustly recovered established PD genetic architecture. Stringent all-ancestry LD reconstruction yielded 73 genomic risk loci among variants represented in the reference panel: 42 pre-Kim established loci, three Kim-published loci and 28 unresolved candidate regions. The unresolved set constitutes a prioritized research resource rather than a set of confirmed novel discoveries. The substantial genomic inflation of the combined statistic and incomplete LD-reference coverage require cautious interpretation. With ancestry-aware calibration, comprehensive prior-locus review, functional annotation and independent replication, this framework can support rigorous refinement of PD risk architecture and identification of genuinely additional susceptibility loci.
6. Strengths and Limitations
- Strength: integrates two large, complementary PD GWAS summary-statistic resources using explicit allele harmonization and checksum-verified inputs.
- Strength: uses pooled effect estimates, heterogeneity statistics, functional annotation and LD-defined loci rather than relying only on SNP-level P values.
- Strength: the immediately accessible Kim dataset is reported to exclude Nalls, reducing direct duplication of the European source.
- Limitation: only two aggregate study-level estimates are available per SNP; internal cohort/ancestry heterogeneity cannot be recovered.
- Limitation: INFO scores were absent from the downloaded files, so a uniform post-download imputation-quality filter could not be applied.
- Limitation: combined λGC remained high (1.875 in common non-MHC variants), and ancestry-aware calibration was not available.
- Limitation: only 18.85% of stringent significant rsID variants intersected the local 1000G ALL reference used for locus reconstruction.
- Limitation: unresolved status is based on the selected reference set and locus boundary rules; it is not evidence of novelty.
- Limitation: no independent replication cohort was analyzed.
Supplementary Materials
The following supporting information can be downloaded at the website of this paper posted on Preprints.org.
Author Contributions
Author contribution details are required before submission and should follow the CRediT taxonomy.
Funding
Not applicable.
Institutional Review Board Statement
Not applicable. This study used de-identified, publicly accessible aggregate GWAS summary statistics and involved no new participant recruitment or individual-level data.
Informed Consent Statement
Not applicable. Informed consent was obtained in the original contributing studies, as described in their source publications.
Data Availability Statement
The analysis used publicly accessible summary statistics associated with GWAS Catalog accessions GCST009325 (Nalls et al. 2019) and GCST90275127 (Kim et al. 2024). The Kim publication describes the immediately accessible version as excluding Nalls et al., 23andMe post-Chang and PDWBS [6]. The manuscript analysis generated harmonized summary statistics, complete meta-analysis results, heterogeneity outputs, LD-clumping outputs, locus-level tables and figure-generation scripts. Authors should deposit the analysis scripts and non-restricted derived tables in an appropriate public repository (for example, GitHub/Zenodo) at acceptance, subject to the terms of the source datasets.
Acknowledgments
We acknowledge the investigators and participants who contributed to the original Parkinson’s disease GWAS resources, including the International Parkinson’s Disease Genomics Consortium, Global Parkinson’s Genetics Program and collaborating cohorts represented in the source publications.
Conflicts of Interest
The authors must declare any conflicts of interest or state: ‘The authors declare no conflict of interest.’.
References
- Nalls, M.A.; Blauwendraat, C.; Vallerga, C.L.; Heilbron, K.; Bandres-Ciga, S.; Chang, D.; et al. Identification of novel risk loci, causal insights, and heritable risk for Parkinson’s disease: A meta-analysis of genome-wide association studies. Lancet Neurol. 2019, 18, 1091–1102. [Google Scholar] [CrossRef]
- Blauwendraat, C.; Nalls, M.A.; Singleton, A.B. The genetic architecture of Parkinson’s disease. Lancet Neurol. 2020, 19, 170–178. [Google Scholar] [CrossRef]
- Foo, J.N.; Chew, E.G.Y.; Chung, S.J.; Peng, R.; Blauwendraat, C.; Nalls, M.A.; et al. Identification of risk loci for Parkinson disease in Asians and comparison of risk between Asians and Europeans: A genome-wide association study. JAMA Neurol. 2020, 77, 746–754. [Google Scholar] [CrossRef]
- Loesch, D.P.; Horimoto, A.R.V.R.; Heilbron, K.; Sarihan, E.I.; Inca-Martinez, M.; Mason, E.; et al. Characterizing the genetic architecture of Parkinson’s disease in Latinos. Ann. Neurol. 2021, 90, 353–365. [Google Scholar] [CrossRef]
- Rizig, M.; Bandres-Ciga, S.; Makarious, M.B.; Ojo, O.O.; Crea, P.W.; Abiodun, O.V.; et al. Identification of genetic risk loci and causal insights associated with Parkinson’s disease in African and African admixed populations: A genome-wide association study. Lancet Neurol. 2023, 22, 1015–1025. [Google Scholar] [CrossRef]
- Kim, J.J.; Vitale, D.; Otani, D.V.; Lian, M.M.; Heilbron, K.; Aslibekyan, S.; et al. Multi-ancestry genome-wide association meta-analysis of Parkinson’s disease. Nat. Genet. 2024, 56, 27–36. [Google Scholar] [CrossRef]
- Watanabe, K.; Taskesen, E.; van Bochoven, A.; Posthuma, D. Functional mapping and annotation of genetic associations with FUMA. Nat. Commun. 2017, 8, 1826. [Google Scholar] [CrossRef]
- The 1000 Genomes Project Consortium. A global reference for human genetic variation. Nature 2015, 526, 68–74. [Google Scholar] [CrossRef]
- Willer, C.J.; Li, Y.; Abecasis, G.R. METAL: Fast and efficient meta-analysis of genomewide association scans. Bioinformatics 2010, 26, 2190–2191. [Google Scholar] [CrossRef]
- Bulik-Sullivan, B.K.; Loh, P.-R.; Finucane, H.K.; Ripke, S.; Yang, J.; Patterson, N.; Daly, M.J.; Price, A.L.; Neale, B.M. Schizophrenia Working Group of the Psychiatric Genomics Consortium. LD Score regression distinguishes confounding from polygenicity in genome-wide association studies. Nat. Genet. 2015, 47, 291–295. [Google Scholar] [CrossRef]
- McLaren, W.; Gil, L.; Hunt, S.E.; Riat, H.S.; Ritchie, G.R.S.; Thormann, A.; Flicek, P.; Cunningham, F. The Ensembl Variant Effect Predictor. Genome Biol. 2016, 17, 122. [Google Scholar] [CrossRef]
Figure 1.
Manhattan plot of the fixed-effect PD meta-GWAS. Alternating chromosome colors show association statistics across autosomes. The dashed red line denotes P<5×10⁻⁸ and the dotted green line P<5×10⁻⁹. Selected established PD loci are annotated. Labels indicate association regions and do not imply causal genes.
Figure 1.
Manhattan plot of the fixed-effect PD meta-GWAS. Alternating chromosome colors show association statistics across autosomes. The dashed red line denotes P<5×10⁻⁸ and the dotted green line P<5×10⁻⁹. Selected established PD loci are annotated. Labels indicate association regions and do not imply causal genes.
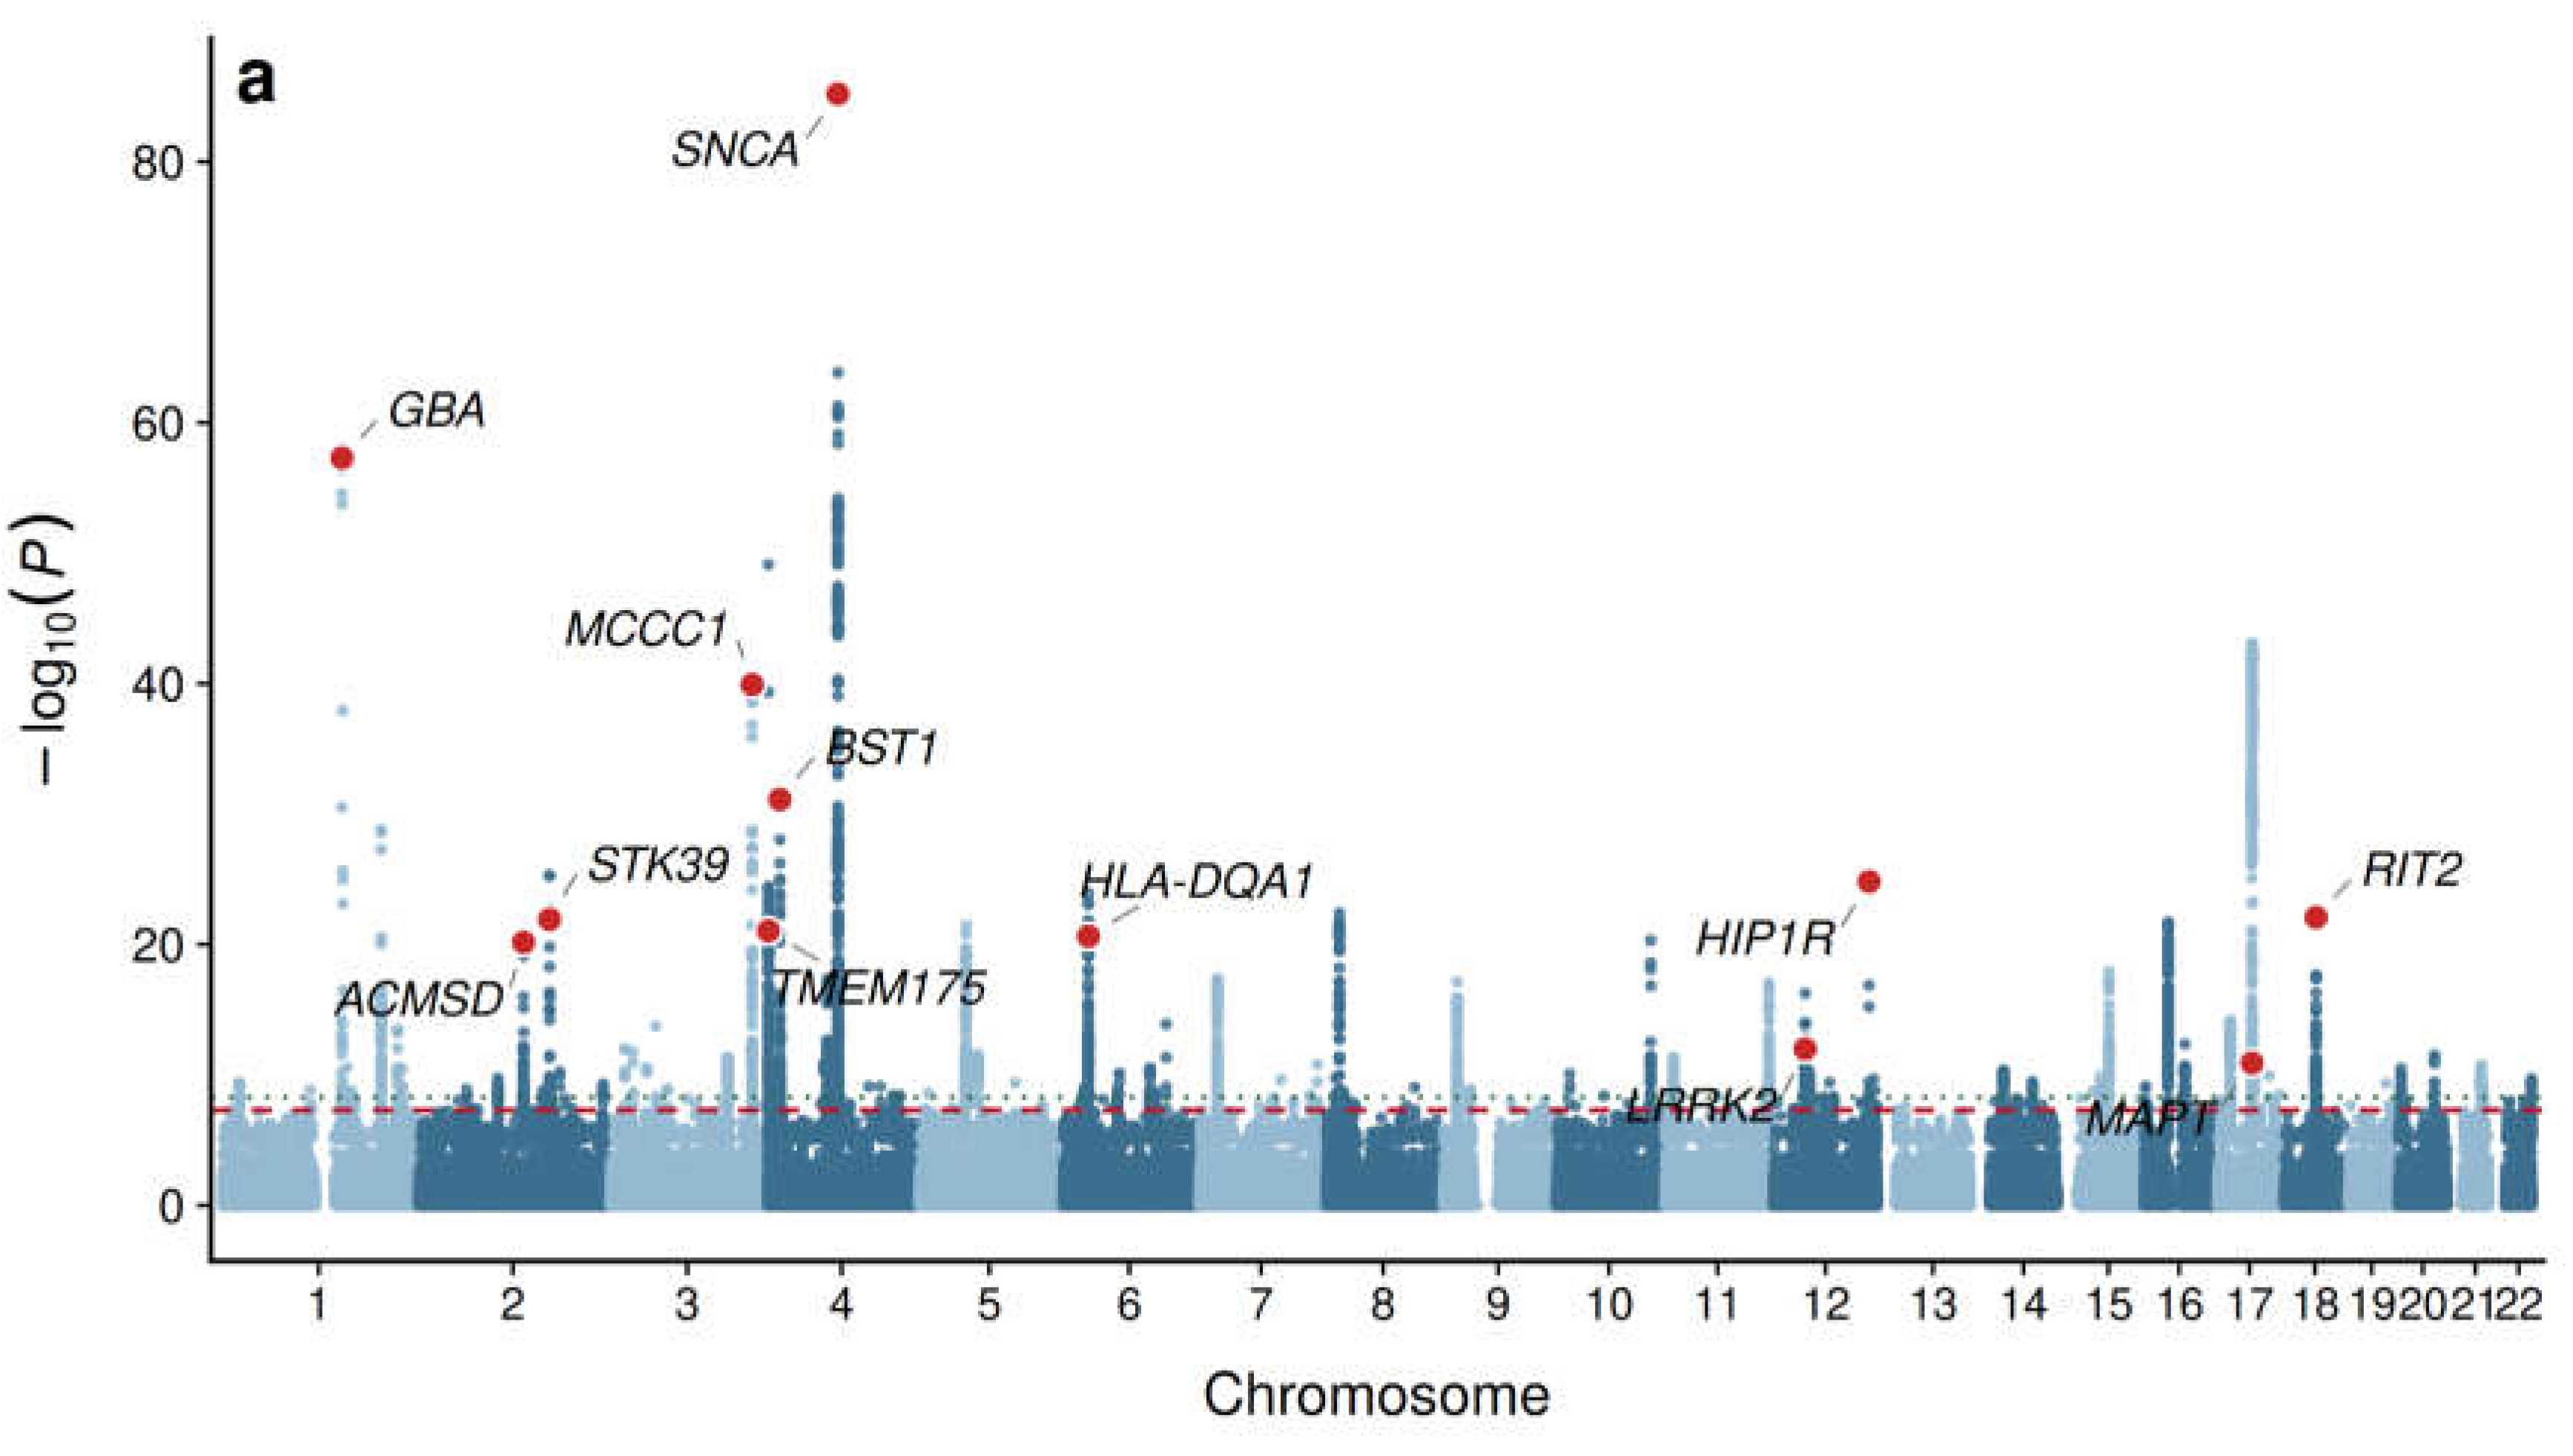
Figure 2.
QQ plot for common non-MHC variants in the PD meta-analysis. Observed and expected −log10(P) values are shown for 4,505,326 variants with MAF≥0.05 in both source datasets after exclusion of chr6:25–34 Mb. The combined λGC was 1.875. The dashed line denotes the null expectation.
Figure 2.
QQ plot for common non-MHC variants in the PD meta-analysis. Observed and expected −log10(P) values are shown for 4,505,326 variants with MAF≥0.05 in both source datasets after exclusion of chr6:25–34 Mb. The combined λGC was 1.875. The dashed line denotes the null expectation.
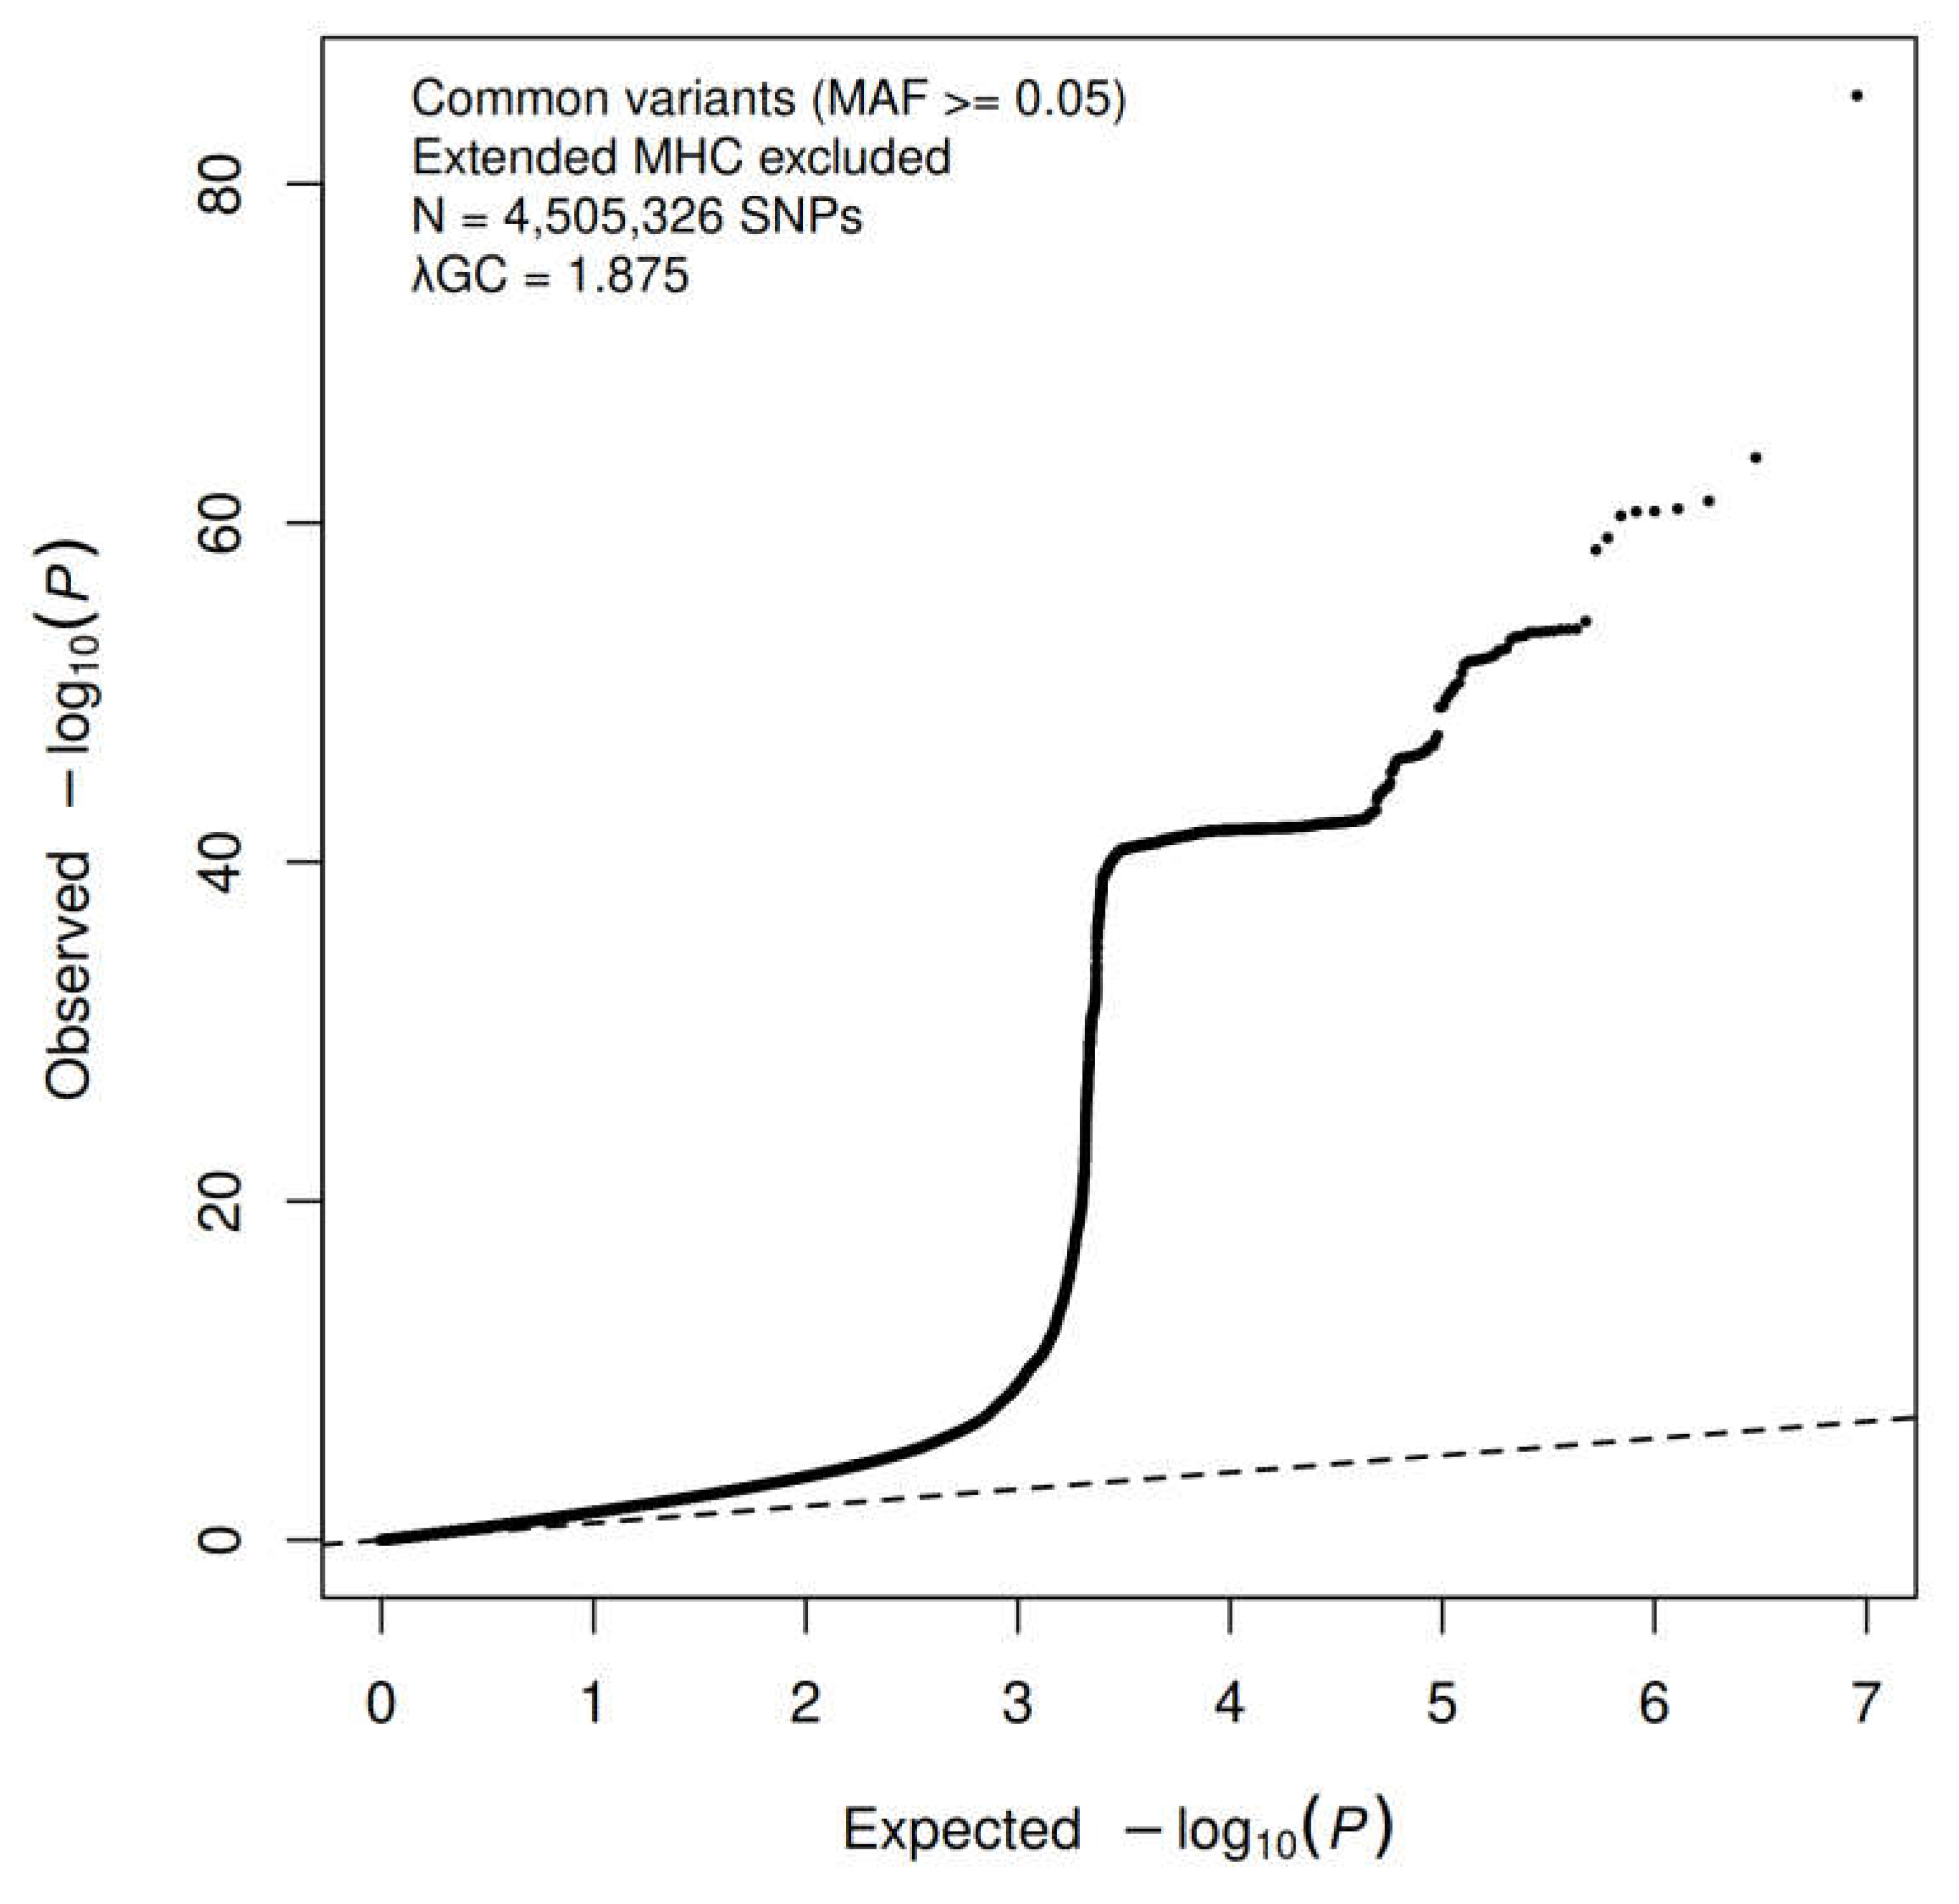
Figure 3.
Forest plot of the 20 most significant EUR-LD-independent PD lead SNPs. Points show pooled odds ratios and horizontal lines indicate 95% confidence intervals. The vertical dashed line marks OR=1. Gene labels are based on nearest-gene annotation and should not be interpreted as causal assignment.
Figure 3.
Forest plot of the 20 most significant EUR-LD-independent PD lead SNPs. Points show pooled odds ratios and horizontal lines indicate 95% confidence intervals. The vertical dashed line marks OR=1. Gene labels are based on nearest-gene annotation and should not be interpreted as causal assignment.
Disclaimer/Publisher’s Note: The statements, opinions and data contained in all publications are solely those of the individual author(s) and contributor(s) and not of MDPI and/or the editor(s). MDPI and/or the editor(s) disclaim responsibility for any injury to people or property resulting from any ideas, methods, instructions or products referred to in the content. |
© 2026 by the authors. Licensee MDPI, Basel, Switzerland. This article is an open access article distributed under the terms and conditions of the Creative Commons Attribution (CC BY) license (http://creativecommons.org/licenses/by/4.0/).
Copyright: This open access article is published under a Creative Commons CC BY 4.0 license, which permit the free download, distribution, and reuse, provided that the author and preprint are cited in any reuse.