

Submitted:
01 September 2026
Posted:
02 September 2026
You are already at the latest version
Abstract
Since 1995, the intake of individual nutrients has been evaluated using fuzzy logic, with aggregation of the resulting fuzzy sets enabling the weighing of one nutrient against another, and the evaluation and optimization of overall nutrient intake. The aggregation operator used in earlier work, defined as the product of the minimum and harmonic mean operators (MIN×H), performed well in practice but had undesirable mathematical properties: it is not associative, model extensions can shift results even when all conditions are fully satisfied, and the resulting evaluation field contains discontinuities inconsistent with biological behavior. We therefore reviewed the family of parametrized T-norms for an alternative and identified the Schweizer (3) operator, fitting its parameter to best match the existing operator using 254 real nutrition protocols from a sustainability study; strong agreement was achieved at a parameter setting of p = 6. The new operator satisfies all required mathematical properties and produces a smooth, simply structured evaluation field that reveals synergistic and substitution effects among foodstuffs, as well as the essentiality of certain foodstuffs under specific conditions. The resulting evaluation field shows a wide, high-dimensional plateau rather than a sharp peak, interpretable as stability, error tolerance, and a high degree of diversity, offering a new, mathematically robust perspective on healthy nutrition and the interactions among foodstuffs.
Keywords:
fuzzy logic
; nutrient intake
; aggregation operator
; T-norm
; Schweizer operator
; nutrition optimization
; evaluation field
; diet quality
1. Introduction
In 1995, initial steps were taken to evaluate nutrient intake using fuzzy logic [1]. Each evaluation of a nutrient is represented by a fuzzy set defined by degrees of membership that vary between 0 and 1 as the daily intake amount of a given nutrient varies. These values (pure mathematical numbers, dimensionless scalars) were translated into linguistic variables such as “potentially life-threatening” or “optimal.” Using these linguistic variables, fuzzy sets for the intake of specific nutrients were constructed under the condition that the evaluation of all other nutrients was optimal (evaluation = 1). For practical use, the linguistic variables were further translated into the colors green, yellow, and red—and the gradient between them—to provide an intuitive visual evaluation, as shown for the fuzzy set “optimal intake of potassium” in Figure 1.
Translating nutrient-level evaluations into an evaluation of actual foodstuff intake requires a form of aggregated evaluation. In earlier work, this was accomplished using the MIN×H operator [2].
This operator has since been implemented in numerous professional nutrition consulting programs. In practice, both the fuzzy sets and the implemented operator performed satisfactorily. However, several theoretical considerations suggested room for improvement in both the fuzzy sets and the aggregation method. Some of these disadvantages were discussed in [3], which also questioned whether official recommendations—intended for population-level guidance—are appropriate for evaluating individual nutrient intake. Based on the official recommendations, an interpretation incorporating a kind of probability that a nutrient requirement is met was proposed.
Accordingly, the linguistic variables were extended with statistical modifiers such as “very probably” or “possibly,” producing expressions such as “very probably well-balanced supply of nutrient a” or “possibly critical undersupply of nutrient b.” All fuzzy sets were carefully adapted to the most current DGE reference intake values [4].
• The operator is not associative. While not critical in practice, associativity would simplify the algorithms used to calculate the aggregated evaluation.
• Expanding the model—for example, by adding fuzzy sets for the evaluation of an additional nutrient relevant to a special diet—changes the aggregation result even when all conditions are fully satisfied (evaluation = 1).
• Applying this aggregation across all fuzzy sets while varying foodstuff amounts produces an evaluation field with discontinuities, since the minimum value can shift abruptly from the evaluation of one nutrient to that of another. This does not reflect the behavior of a biological, physiological system.
The aim of the present work was therefore to identify an aggregation operator that resolves these disadvantages while remaining closely aligned with the results of the operator already validated through extensive practical use, offering a new, mathematically robust perspective on healthy nutrition.
1.1. Existing Approaches to Nutrient-Level Aggregation
Several methods have been proposed over the past two decades to aggregate individual nutrient evaluations into a single diet-quality score. The most widely used are the Nutrient Adequacy Ratio (NAR) and the Mean Adequacy Ratio (MAR), in which each nutrient’s intake is expressed as a fraction of its recommended value (capped at 1.0), and the resulting ratios are averaged arithmetically [5]. A more recent development is the Probability of Adequate Nutrient Intake index (PANDiet), which aggregates adequacy probabilities for 24 nutrients into a single score using two sub-scores for under- and over-consumption [6]. The Total Nutrient Index (TNI) extends this approach by including nutrient contributions from dietary supplements alongside food intake [7]. Food-based indices—such as the Healthy Eating Index, the Alternative Healthy Eating Index, and the Global Diet Quality Score—operate at the level of food groups rather than individual nutrients, making them simpler to compute but less sensitive to specific micronutrient shortfalls [8].
All these methods share a common mathematical limitation: they aggregate individual nutrient evaluations by simple averaging, which allows a critical deficiency in one nutrient to be offset by abundance in others. A diet with zero intake of an essential nutrient will not receive a zero overall score under MAR or PANDiet, because the remaining nutrients continue to contribute positively to the mean. The fuzzy logic framework applied here addresses this directly: the T-norm aggregation operator has an absorbing element of 0, meaning that a single evaluation of 0 forces the total aggregated evaluation to 0 regardless of all other nutrient scores. Beyond this property, the resulting “evaluation field” is a continuous, differentiable surface whose topology encodes physiologically meaningful interactions among foodstuffs—synergy, substitution, and essentiality—that are invisible to averaging-based scores.
Earlier fuzzy-logic-based work in nutrition has applied fuzzy sets at the food-group level [9], optimizing recommended servings within a food pyramid rather than evaluating nutrient intakes directly. The present approach operates at the nutrient level and addresses the mathematically critical question of how nutrient-level evaluations should be combined—a question that the choice of aggregation operator answers in a formally rigorous and empirically calibrated way.
2. Materials and Methods
2.1. Selection of an Aggregation Operator from the T-Norm Family
To address the disadvantages identified above, we examined alternative approaches and reviewed operators from the T-norm family [10].
A T-norm is a generalized conjunction—specifically, a monotone (not to be confused with monotonicity in analysis), associative, and commutative [0, 1]² → [0, 1] mapping with neutral element 1 and absorbing element 0. Because of associativity, a T-norm yields a mapping from an n-dimensional space to a single number. The existence of the neutral element 1 means that, in our application, full satisfaction of one nutrient’s recommendation does not alter the aggregation of all other qualities: the original fuzzy set for a given nutrient is reproduced whenever the conditions defining that fuzzy set are met. The existence of the absorbing element 0 implies that a single evaluation of 0 forces the aggregated value to 0 as well. In terms of linguistic variables, this means that if one nutrient is evaluated as “probably life-threatening,” the aggregation of all qualities carries the same verbal interpretation, regardless of how favorable the other qualities are. The result of a T-norm is always less than or equal to the minimum of its inputs.
We systematically reviewed all T-norm family operators that appeared suited to our needs [11] (e.g., minimum, algebraic product, drastic product, Hamacher product, Einstein product, and the Yager and Dubois intersection operators). None of these proved flexible enough to yield satisfactory aggregation results. We therefore turned to operators with adjustable parameters (e.g., Yager, Schweizer (1), Schweizer (2), Schweizer (3), Hamacher, Frank, Dombi, Weber, and Dubois). All of these operators reduce to classical dual logic as a special case and behave like the classical operators when membership functions are restricted to the values 0 and 1. By using fuzzy sets and fuzzy operators, the model of human decision-making becomes more flexible: the binary categories of “black and white” or “true and false” are replaced by a continuum of intermediate possibilities.
Our analysis focused primarily on suitability for nutrition applications. This required proper behavior in high-dimensional decision spaces and a close relationship to the operator already validated through extensive past use. Consequently, the operator could not be the minimum operator, nor could it incorporate the minimum, given the “physiology” of the resulting evaluation field and its sensitivity to other fuzzy evaluations below 1.
After conducting these analyses, we selected the Schweizer (3) operator for detailed evaluation. This operator is defined by Equation (1):
(1) T(x,y) = 1 − [(1−x)p + (1−y)p − (1−x)p×(1−y)p]1/p p > 0
Associativity allows this operator to be defined through the aggregation of two elements. Writing out a full formula for this operator in a high-dimensional space is impractical, as it would contain too many terms; the computer-based calculation therefore follows a successive procedure to represent a [0, 1]ⁿ → [0, 1] mapping.
2.2. Parameter Fitting
The task was to find a value of p that satisfies the following criteria:
• Close to the results of the minimum operator at high values
• Clearly below the results of the minimum operator when several fuzzy sets have low values
• Close to the results of the MIN×H operator used previously
• A resulting evaluation field topography that is physiologically plausible
To maximize overlap with the results of the earlier operator, we drew on a set of 254 nutrition protocols from a study on the sustainability of nutrition [12] and evaluated them using both the earlier operator and the new one across a range of parameter settings for p. The linear regression of the Schweizer (3) operator against the MIN×H operator yielded the smallest residual variance at p = 6; the criteria above were correspondingly best satisfied at this value (see Figure 2).
The aggregated evaluations produced by the Schweizer (3) operator at p = 6 closely match the results obtained with the earlier operator.
2.3. Dimensionality Reduction for Illustrating the Optimum
Demonstrating the features of the aggregated results is impractical in a 140-dimensional foodstuff space (the average number of distinct foodstuffs in a 7-day nutrition protocol). We therefore reduced the dimensionality through an iterative procedure. Starting from the average diet of a 40-year-old man, 1.72 m tall and weighing 68 kg, each iteration began with the result of the preceding optimization step, removing any foodstuffs that had no effect on the optimization result. Iterations continued as long as the results kept improving.
3. Results
3.1. Reduced-Dimensionality Optimum
Ultimately, only 13 foodstuffs remained in the reduced model, yielding an aggregated evaluation of 0.972—very close to optimal intake across all nutrients. With fewer dimensions, the multidimensional structure of the resulting evaluation field becomes clearer, revealing certain interactions among foodstuffs.
It is striking that such a close approximation to the official recommendations can be achieved with only 13 food items. Classical (crisp) mathematics would suggest that solving a system with 40 unknowns requires at least 40 items; this is not the case in fuzzy logic. There also appears to be a physiological explanation: foodstuffs such as vegetables contain a wide range of nutrients in close to the correct proportions, without adverse effects.
Ranked by total energy contribution—here, 2,280 kcal/day overall—the food items are (in kcal/day): rice (718.6), bread (664.3), potatoes (261.4), milk (194.3), nuts (164.3), rutabaga (90.3), herring (75.1), egg (35.1), yogurt (29.6), lettuce (26.4), tomatoes (13.9), garlic (0.8), and water (0).
To avoid misunderstanding: this example is a theoretical model of nutrition intended to illustrate interactions among foodstuffs. While it represents a very good supply of all nutrients, many other combinations—particularly those including a larger number of foodstuffs—can achieve similarly good or even better results.
3.2. Contribution of Individual Foodstuffs to the Total Result
Varying the intake of a single foodstuff while holding all others at their optimal amount reveals several distinct behaviors.
Lettuce and bread showed a particularly strong influence in our example: removing either foodstuff caused a marked deterioration in the aggregated result. Near the optimum, both foodstuffs maintain an extended region of favorable evaluation.
In other cases, we observed that the aggregated result drops to 0 when intake of a particular foodstuff is reduced to 0. This indicates that, within a certain low-dimensional space of foodstuffs, a single foodstuff can become essential: without it, one or more essential nutrients are missing entirely.
Fish, in our example, has two faces. On one hand, it is nearly essential as a source of vitamin D, n-3 and n-6 fatty acids, and iodine. On the other hand, intake only slightly above the optimum leads to excessive intake of these same nutrients.
Sausage was not part of the foodstuffs comprising the optimum. However, as shown in Figure 3, small amounts of sausage do not substantially worsen the aggregated result.
3.3. Evaluation Field: Synergy and Substitution
To illustrate synergistic effects between foodstuffs, we used bread and lettuce as an example. The structure of the level curves and the corresponding 3-D plot forms a hill. Together, these two foodstuffs raise the evaluation of overall nutrition to 0.972, as shown in Figure 4. The maximum evaluation that either foodstuff can reach alone is considerably lower—0.742 and 0.567, respectively. This indicates that each foodstuff supplies nutrients that the other does not provide in sufficient amounts. The isolines (bottom in Figure 4) show equal levels of evaluation; thus, diverse combinations of the two foodstuffs yield the same evaluation.
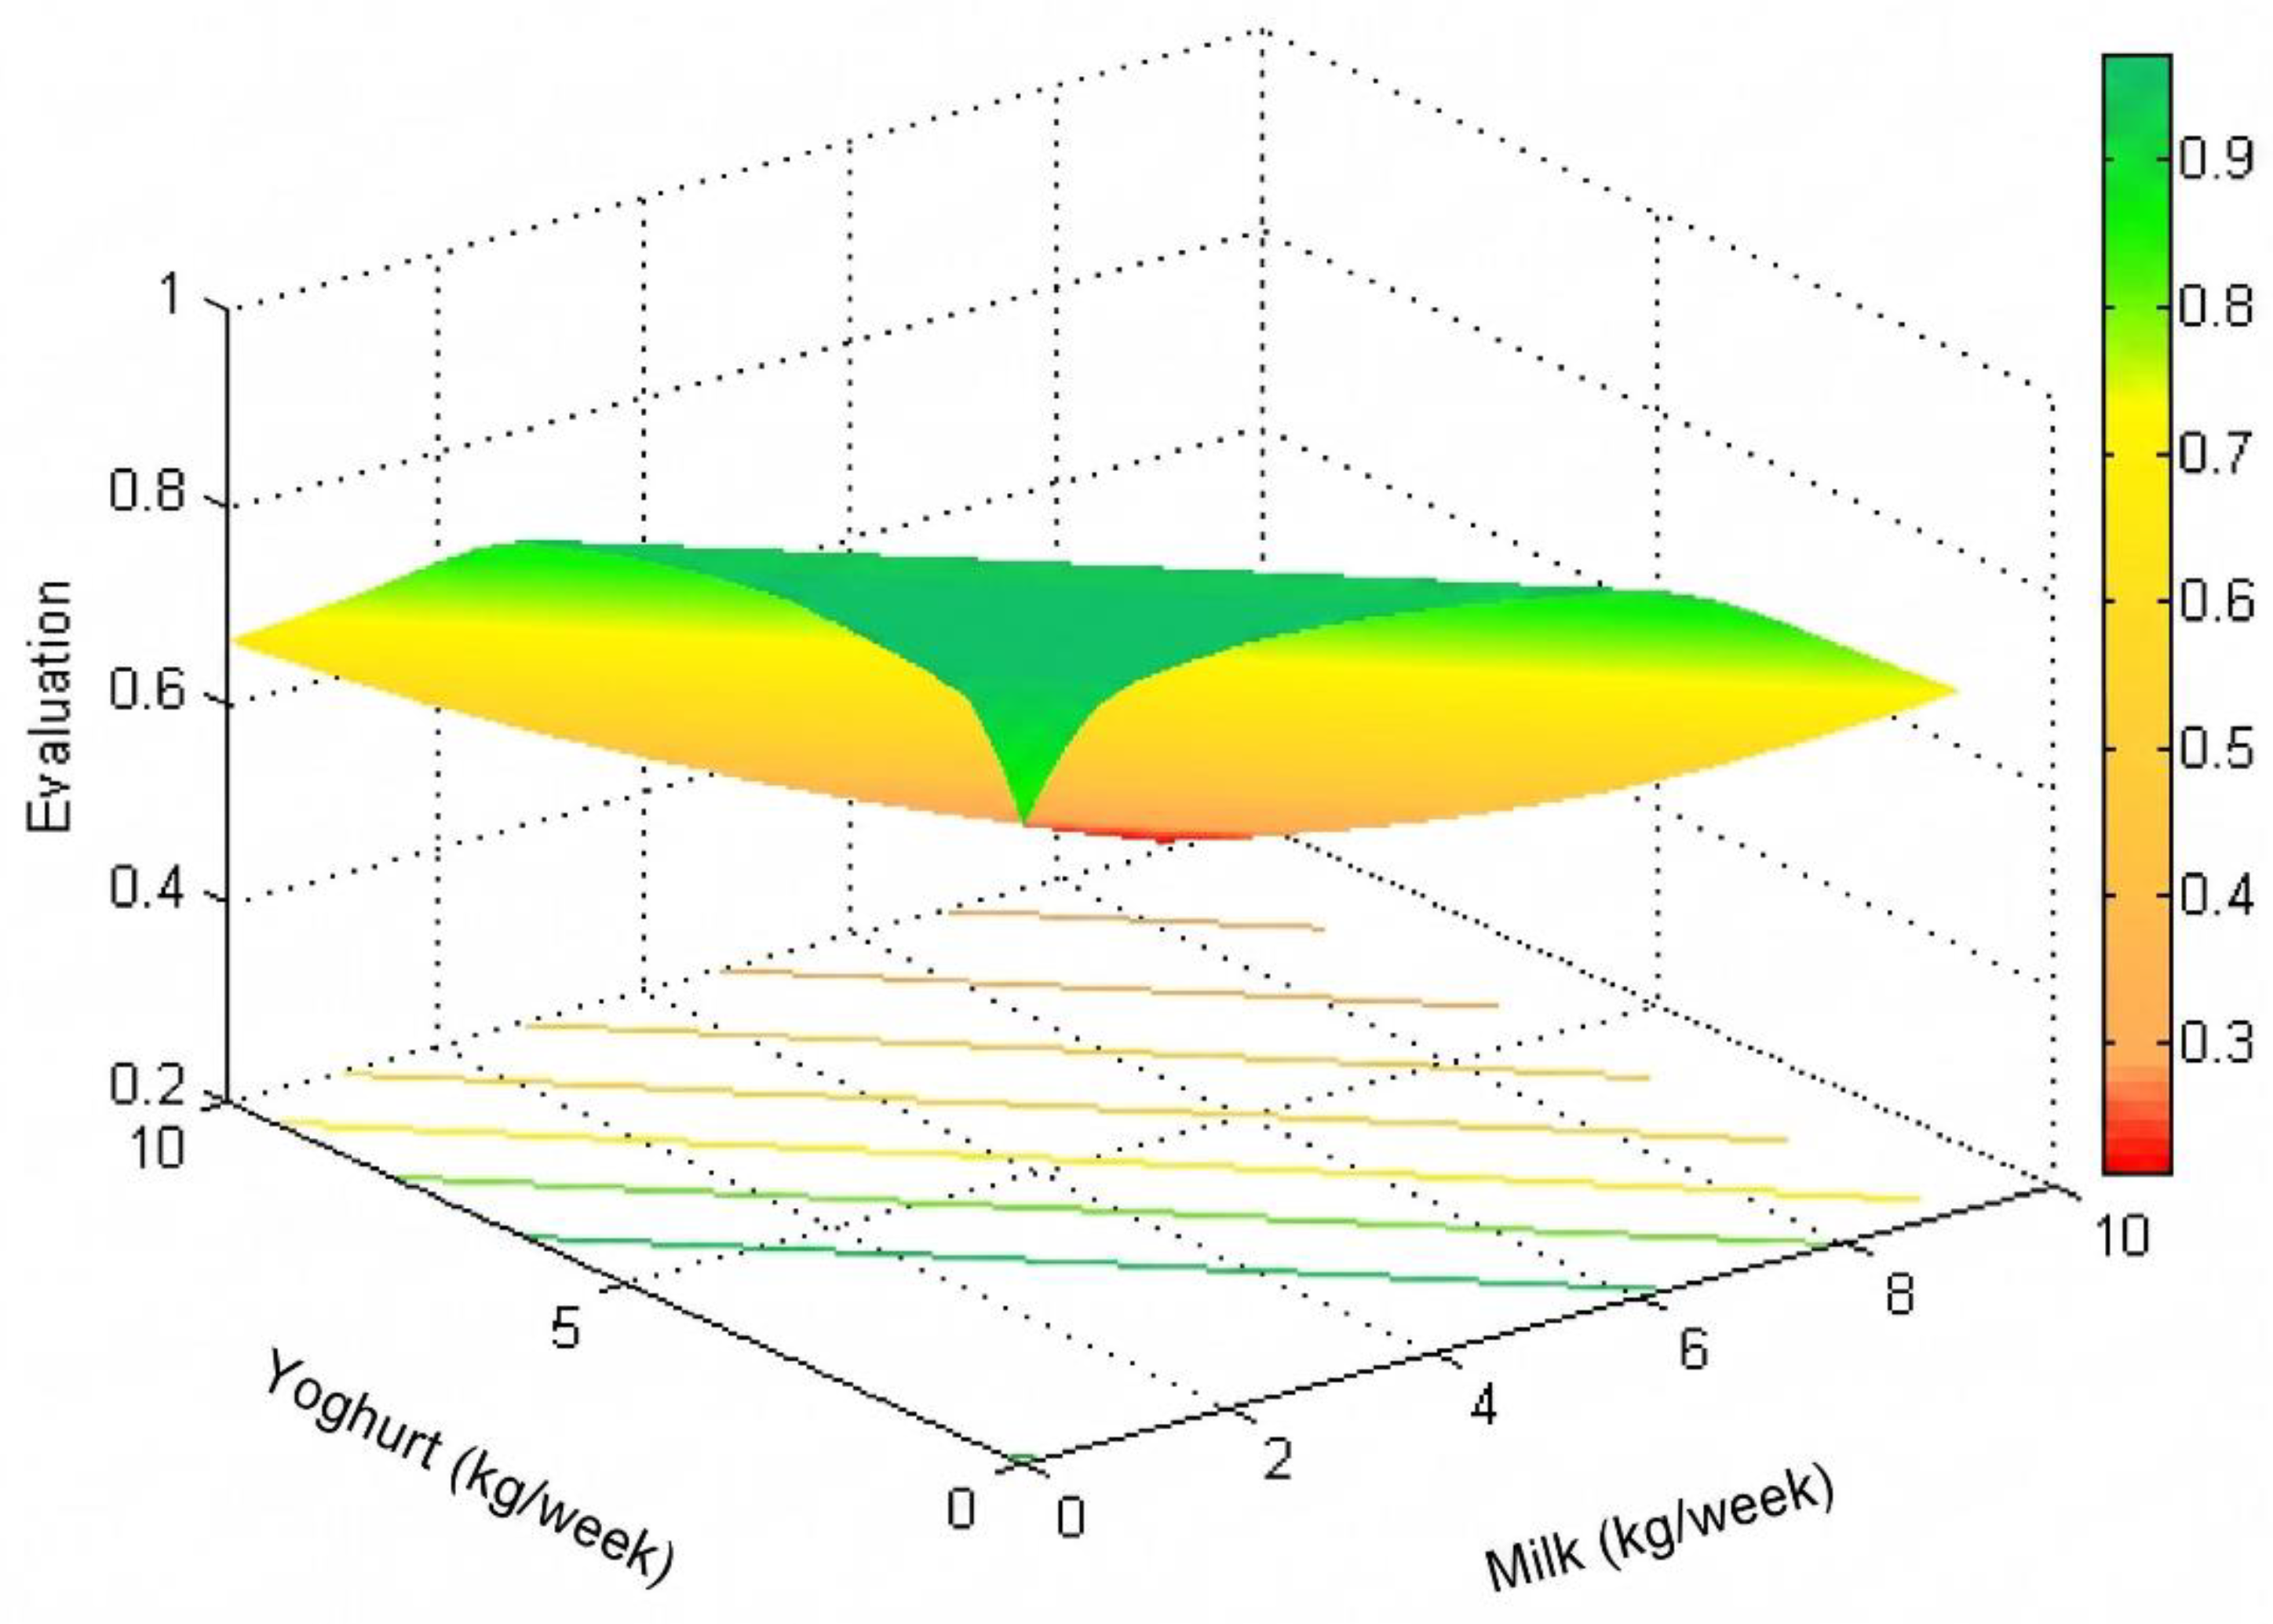
Among the foodstuffs forming the optimum, two—milk and yogurt—have nearly identical nutrient compositions. The level curves form diagonal straight isolines, and the 3-D plot shows an evaluation field with a ridge (Figure 5). This indicates that yogurt cannot improve the evaluation beyond what milk achieves, and vice versa: these two foodstuffs can substitute for one another without producing a synergistic effect.
4. Discussion
The Schweizer (3) operator with the parameter setting p = 6 reproduces the results of the previously used MIN×H operator with strong fidelity while resolving its principal mathematical shortcomings: it is associative, it leaves the aggregated evaluation unchanged under model extensions when all conditions are fully satisfied, and it yields a continuous evaluation field free of the abrupt discontinuities produced by a minimum-based operator.
The key advantage of the present approach over arithmetic averaging methods such as MAR [5], PANDiet [6], or the TNI [7] lies in the mathematical properties of T-norm aggregation. Food-based indices such as the Global Diet Quality Score [8] and fuzzy-logic approaches at the food-group level [9] likewise do not address the aggregation of nutrient-level evaluations in a mathematically rigorous way. Arithmetic mean-based scores allow a severe deficiency in one nutrient to be masked by adequate intake of others. The Schweizer (3) operator, as a T-norm, has an absorbing element of 0: a single nutrient evaluation of 0 forces the total to 0, ensuring that critical deficiencies cannot be averaged away. At the same time, the parametrized structure allows a smooth and calibrated transition between the strict minimum operator and more permissive aggregations, tuned here to match the behavior of the empirically validated MIN×H operator.
Beyond these formal improvements, the operator offers a substantive, biologically interpretable account of how foodstuffs interact. Optimization, in this sense, means moving from an existing real-world diet up the hill of the evaluation field—either by taking a small step in the right direction (following the gradient), which is the approach used in nutrition education, or by attempting the longer path to the top of the hill.
This top is not a sharp peak but a wide, high-dimensional plateau. It remains stable under small variations in the amounts of the foodstuffs needed to reach the optimum, making it error-tolerant and even allowing small amounts of less healthy foodstuffs that are not required to form the optimum. This high-dimensional plateau contains many different solutions with nearly the same optimal result—leaving considerable room for different approaches to healthy nutrition. This diversity may help to explain why different dietary patterns observed across populations and cultures can all be compatible with good nutritional status.
The synergy, substitution, and essentiality effects identified here (Section 3.2 and Section 3.3) illustrate that the aggregation operator is not merely a computational convenience but a lens through which physiologically meaningful relationships among foodstuffs become visible. These findings are consistent with established nutritional knowledge—for example, the ability of milk and yogurt to substitute for one another, or the near-essential but dose-sensitive role of fish as a source of vitamin D, n-3/n-6 fatty acids, and iodine—while providing a quantitative, model-based account of these relationships.
5. Conclusions
The Schweizer (3) operator, calibrated at a parameter setting of p = 6, provides a mathematically sound alternative to the previously used MIN×H operator for aggregating fuzzy nutrient-level evaluations into an overall nutrition-level evaluation. It satisfies the formal properties required of a well-behaved aggregation operator while closely reproducing the results of the earlier operator on real nutrition protocol data. The topology of the resulting nutrition landscape shows a plateau structure that can be interpreted as stability, error tolerance, and a high degree of diversity, offering a new and mathematically robust perspective on healthy nutrition and the interactions among foodstuffs.
Author Contributions
Conceptualization, B.W. and C.L.; methodology, B.W. and J.W.; software, J.W.; validation, B.W. and J.W.; formal analysis, J.W.; writing—original draft preparation, B.W.; writing—review and editing, J.W. and C.L.; supervision, C.L. All authors have read and agreed to the published version of the manuscript.
Funding
This research received no external funding.
Institutional Review Board Statement
Not applicable. This study did not involve new data collection from human or animal subjects; analyses were based on previously collected, anonymized nutrition protocol data.
Informed Consent Statement
Not applicable.
Data Availability Statement
The data and software code supporting the findings of this study are available from the corresponding author upon reasonable request.
Acknowledgments
The authors thank Michael Leitzmann for reading and commenting on the manuscript.
Conflicts of Interest
The authors declare no conflicts of interest.
References
- Wirsam, B.; Uthus, E.O. The use of fuzzy logic in nutrition. J. Nutr. 1996, 126, 2337S–2341S. [Google Scholar] [CrossRef] [PubMed]
- Wirsam, B.; Hahn, A.; Uthus, E.O.; Leitzmann, C. Fuzzy sets and fuzzy decision making in nutrition. Eur. J. Clin. Nutr. 1997, 51, 286–296. [Google Scholar] [CrossRef] [PubMed]
- Gedrich, K.; Hensel, A.; Binder, I.; Karg, G. How optimal are computer-calculated optimal diets? Eur. J. Clin. Nutr. 1999, 53, 309–318. [Google Scholar] [CrossRef] [PubMed]
- DGE. Reference Values for Nutrient Intake; German Nutrition Society: Neustadt, Germany; Umschau Verlag, 2015. [Google Scholar]
- Madden, J.P.; Yoder, M. Program Evaluation: Food Stamps and Commodity Distribution in Rural Areas of Central Pennsylvania; Pennsylvania State University, Department of Agricultural Economics and Rural Sociology: University Park, PA, USA, 1972. [Google Scholar]
- Verger, E.O.; Mariotti, F.; Holmes, B.A.; Paineau, D.; Huneau, J.F. Evaluation of a diet quality index based on the probability of adequate nutrient intake (PANDiet) using national French and US dietary surveys. PLoS ONE 2012, 7, e42155. [Google Scholar] [CrossRef] [PubMed]
- Cowan, A.E.; Jun, S.; Tooze, J.A.; Dodd, K.W.; Gahche, J.J.; Wehler, C.A.; Potischman, N.; Bailey, R.L. A narrative review of nutrient based indexes to assess diet quality and the proposed Total Nutrient Index that reflects total dietary exposures. Crit. Rev. Food Sci. Nutr. 2022, 62, 7846–7860. [Google Scholar] [CrossRef] [PubMed]
- Bromage, S.; Bhupathiraju, S.N.; Lichtenstein, A.H.; et al. Development and validation of the Global Diet Quality Score. Am. J. Clin. Nutr. 2021, 114, 622–633. [Google Scholar]
- Ghassemi, A.; Moghimian, M. Designing fuzzy algorithms to develop healthy dietary patterns. Iran. J. Nurs. Midwifery Res. 2013, 18, 466–471. [Google Scholar]
- Schweizer, B.; Sklar, A. Associative functions and abstract semigroups. Publ. Math. Debr. 1963, 10, 69–81. [Google Scholar]
- Mayer, A.; Mechler, B.; Schlindwein, A.; Wolke, R. Fuzzy Logic; Addison-Wesley: Bonn, Germany, 1993. [Google Scholar]
- Wirsam, B.; Leitzmann, C. Klimaeffiziente Ernährung. Ernährungs Umsch. 2011, 58, 26–29. [Google Scholar]
Figure 1.
The fuzzy set for daily potassium intake, with color-coded interpretation.
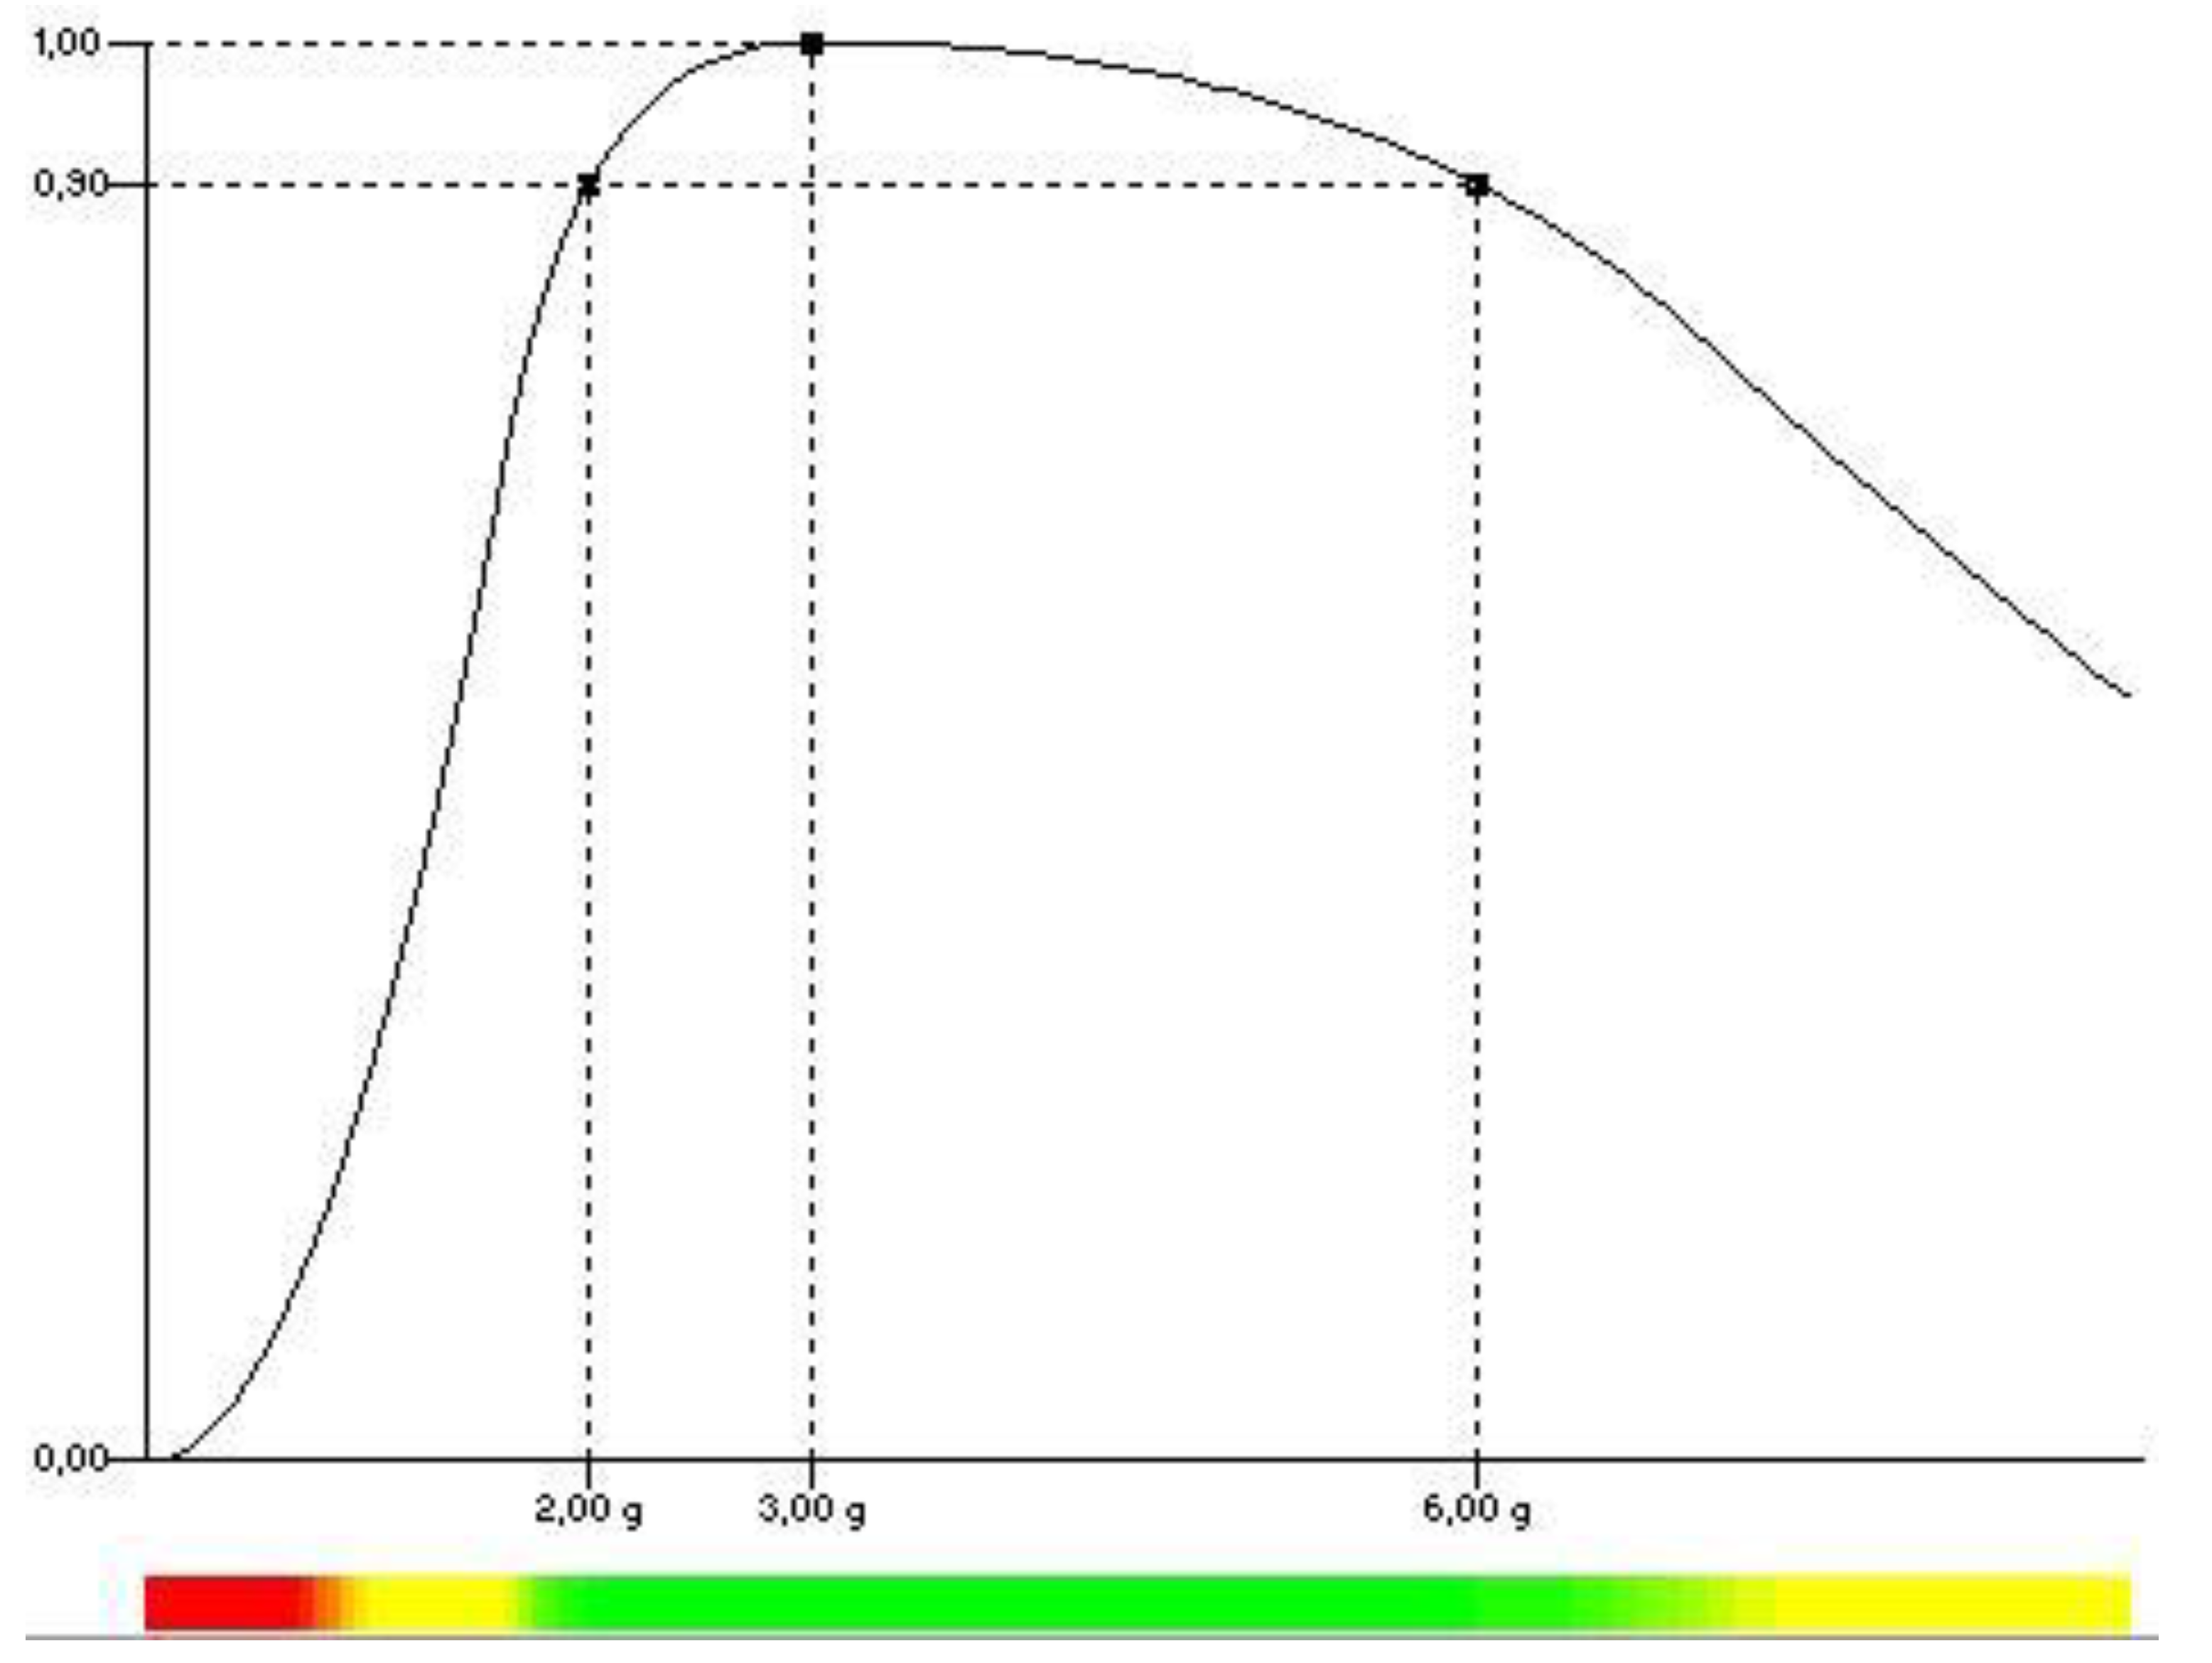
Figure 2.
Relationship between the MIN×H operator and the Schweizer (3) operator with parameter p = 6, based on 254 nutrition protocols.
Figure 2.
Relationship between the MIN×H operator and the Schweizer (3) operator with parameter p = 6, based on 254 nutrition protocols.
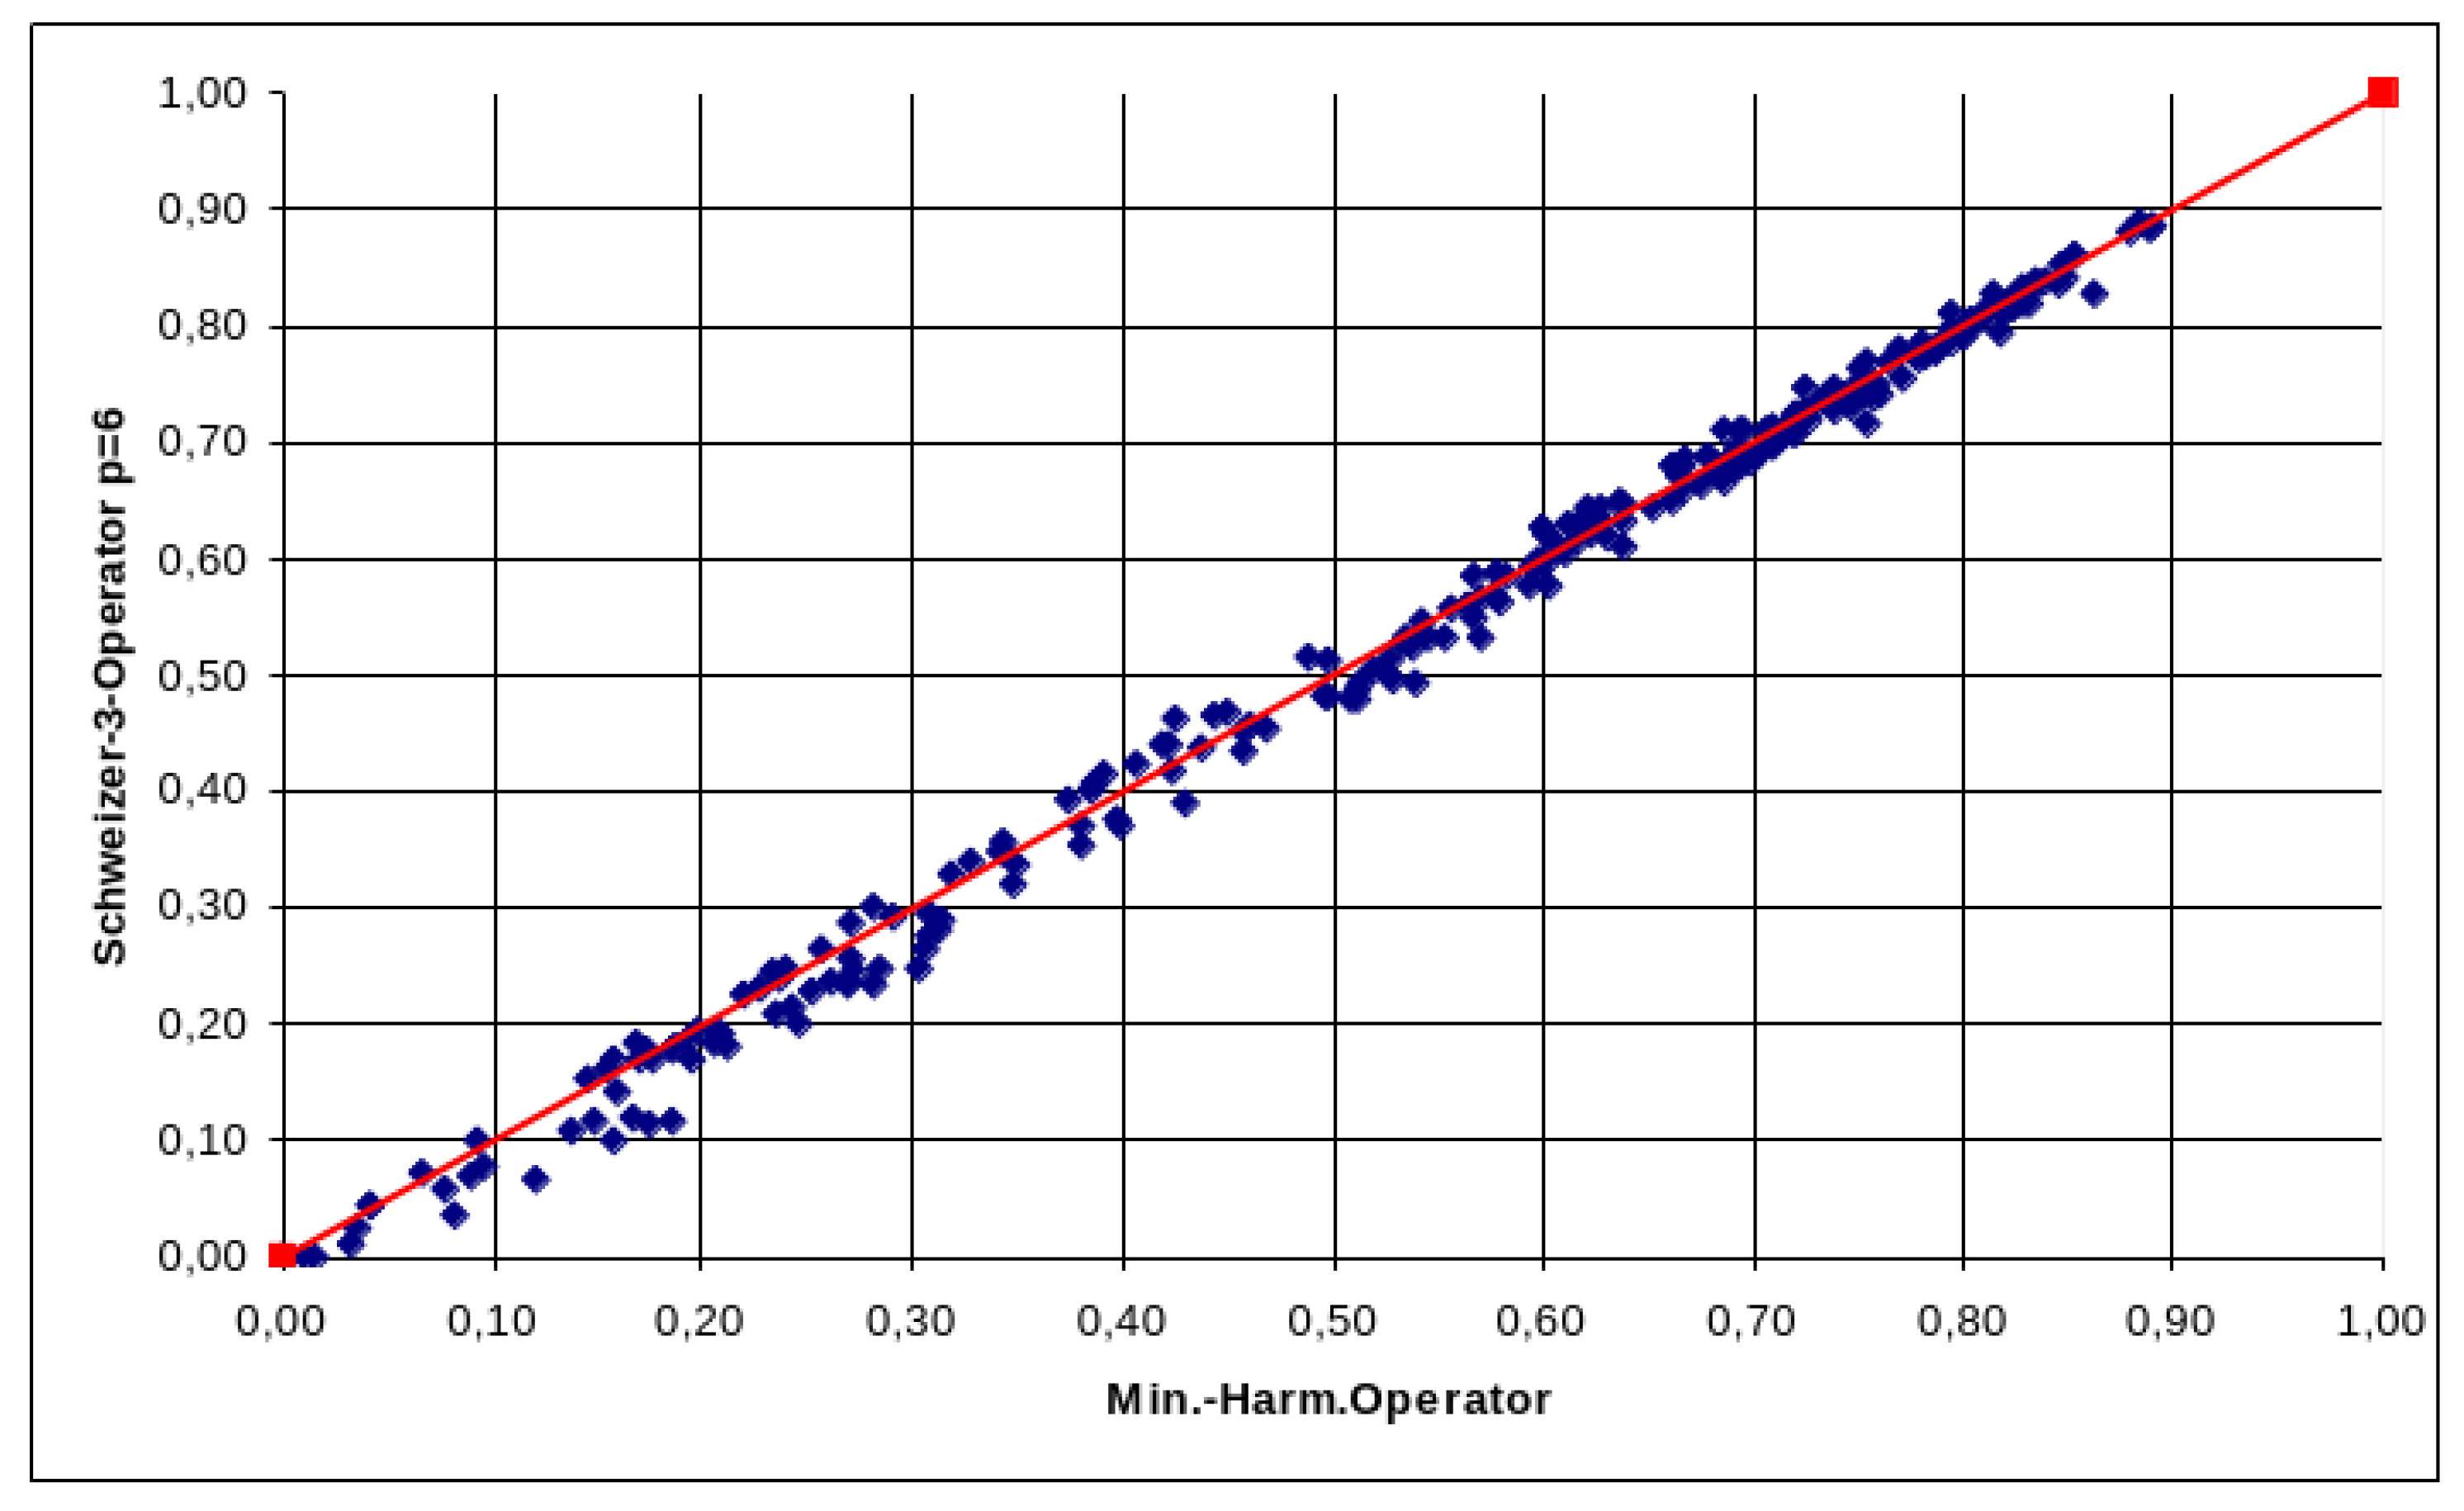
Figure 3.
Influence of selected foodstuffs on the aggregated result.
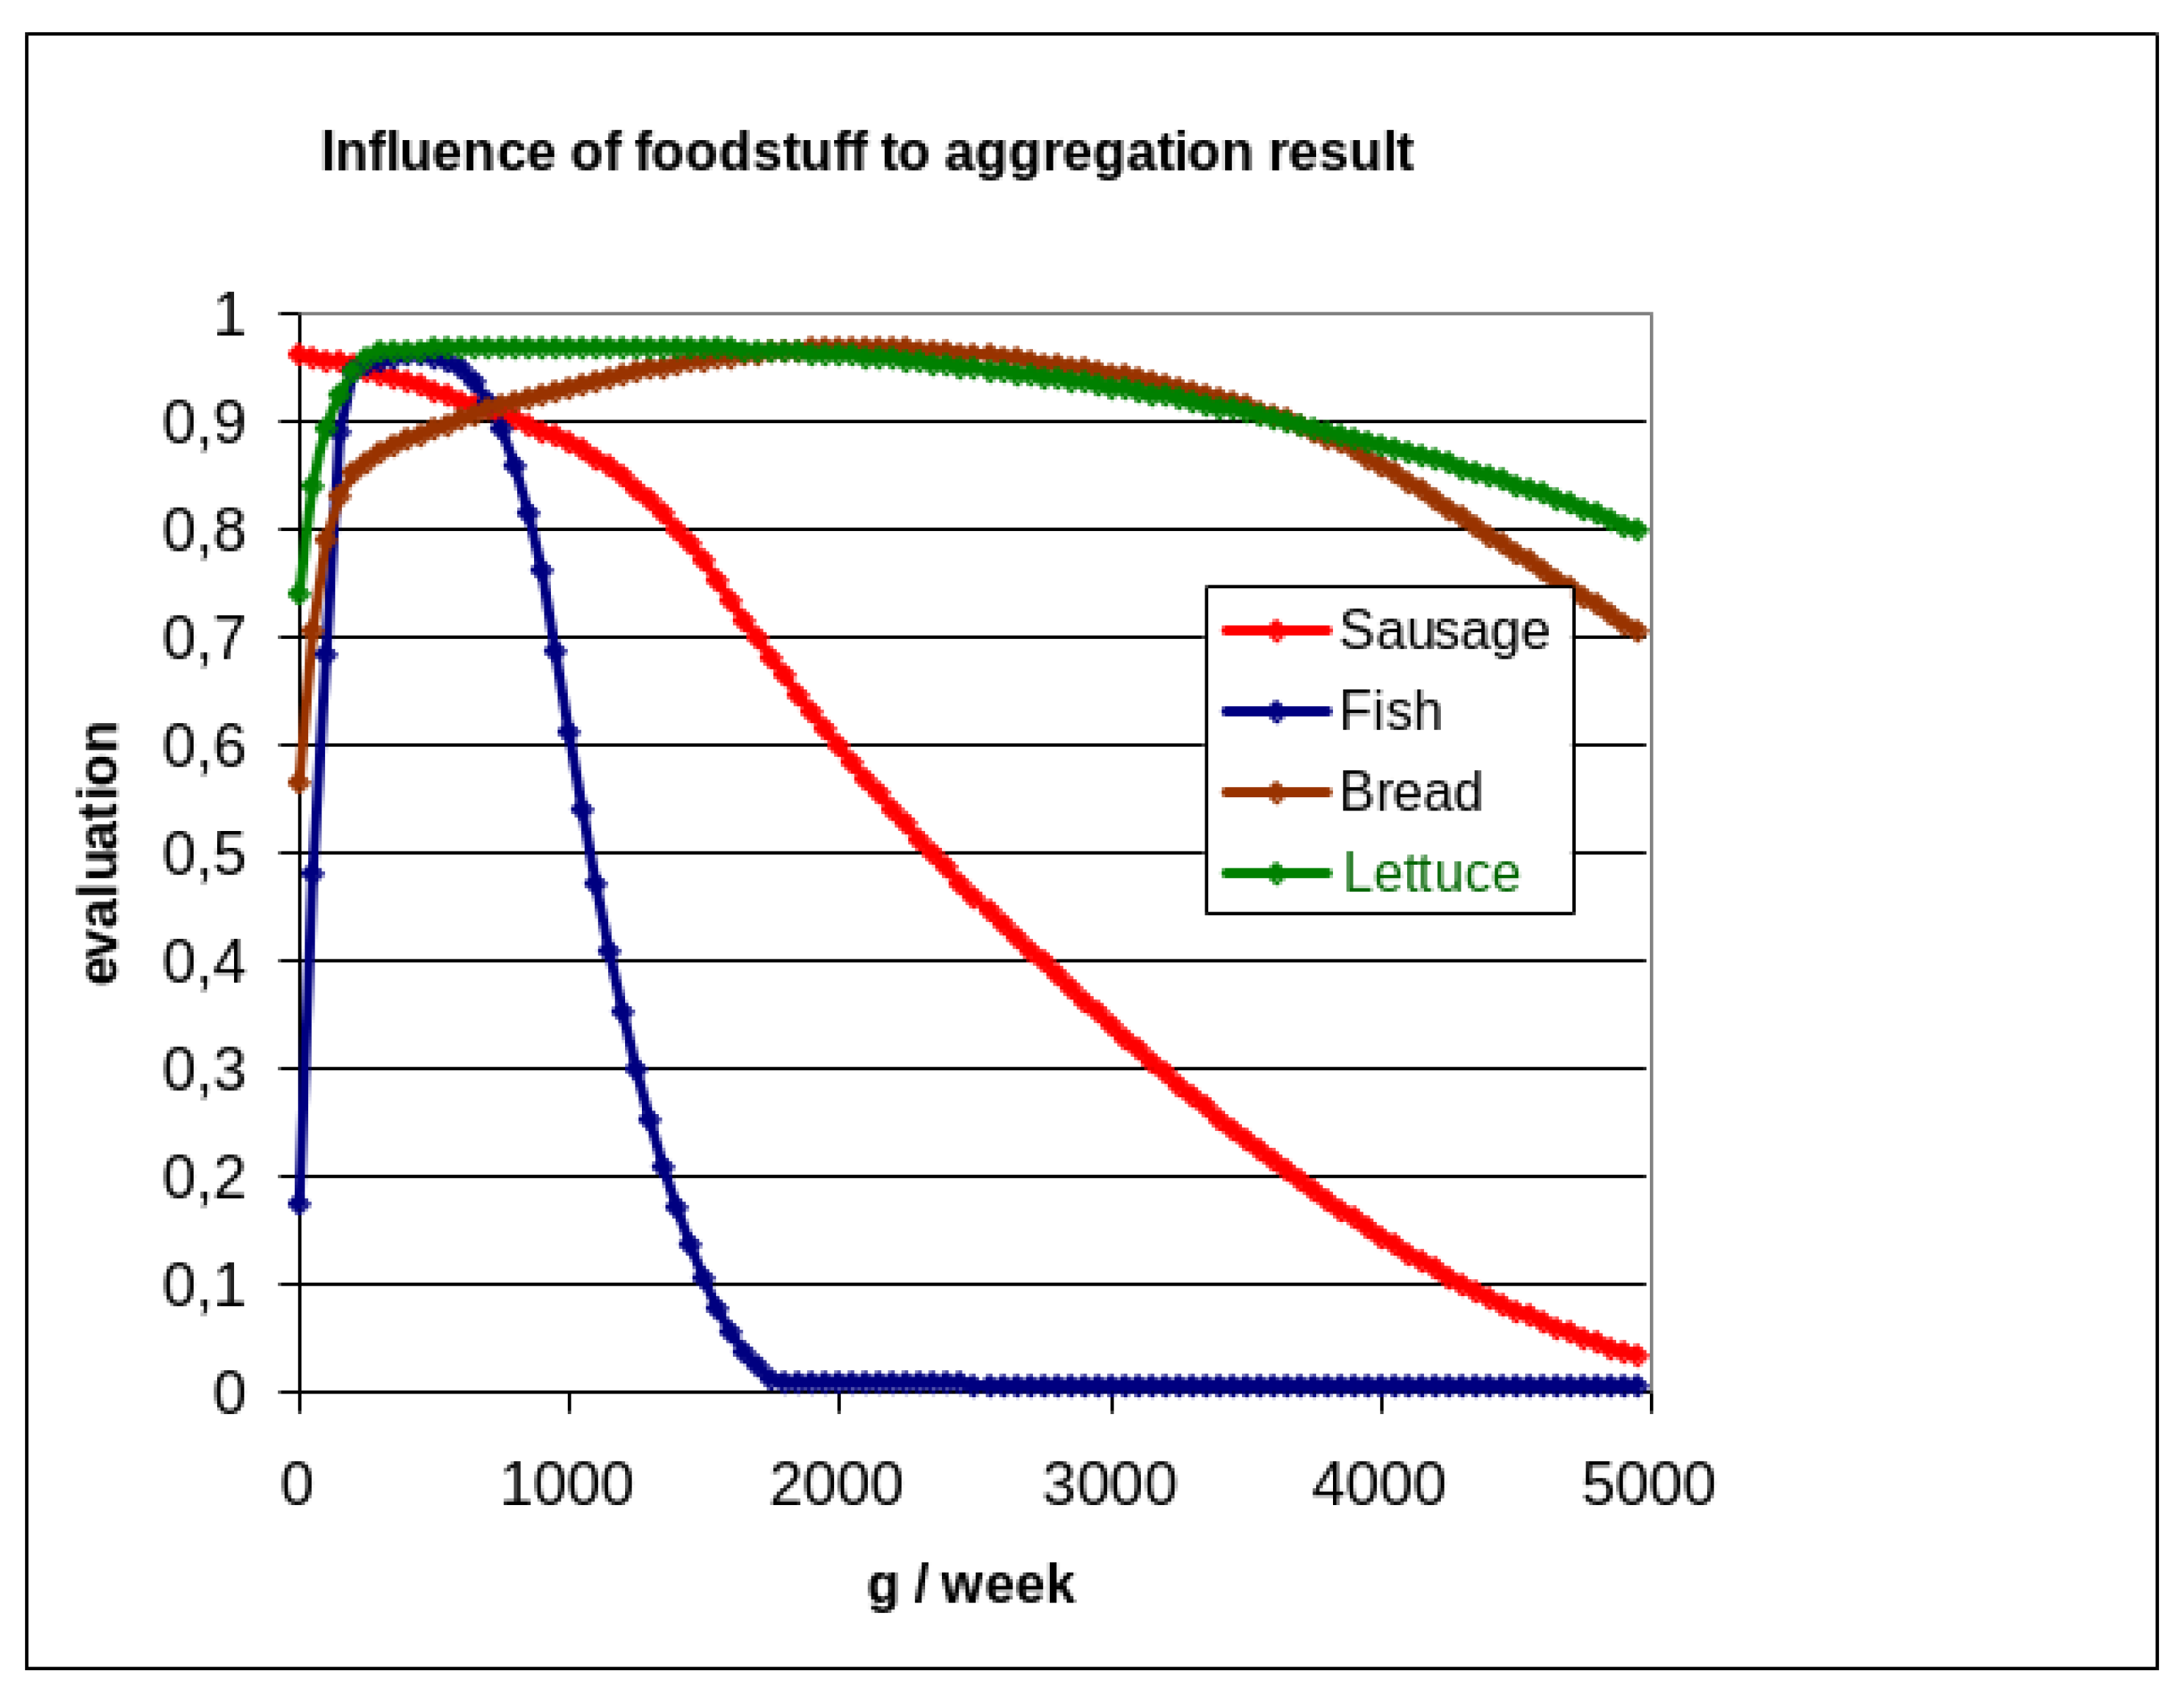
Figure 4.
Synergistic interaction between bread and lettuce, illustrating the plateau structure of nutrition.
Figure 4.
Synergistic interaction between bread and lettuce, illustrating the plateau structure of nutrition.
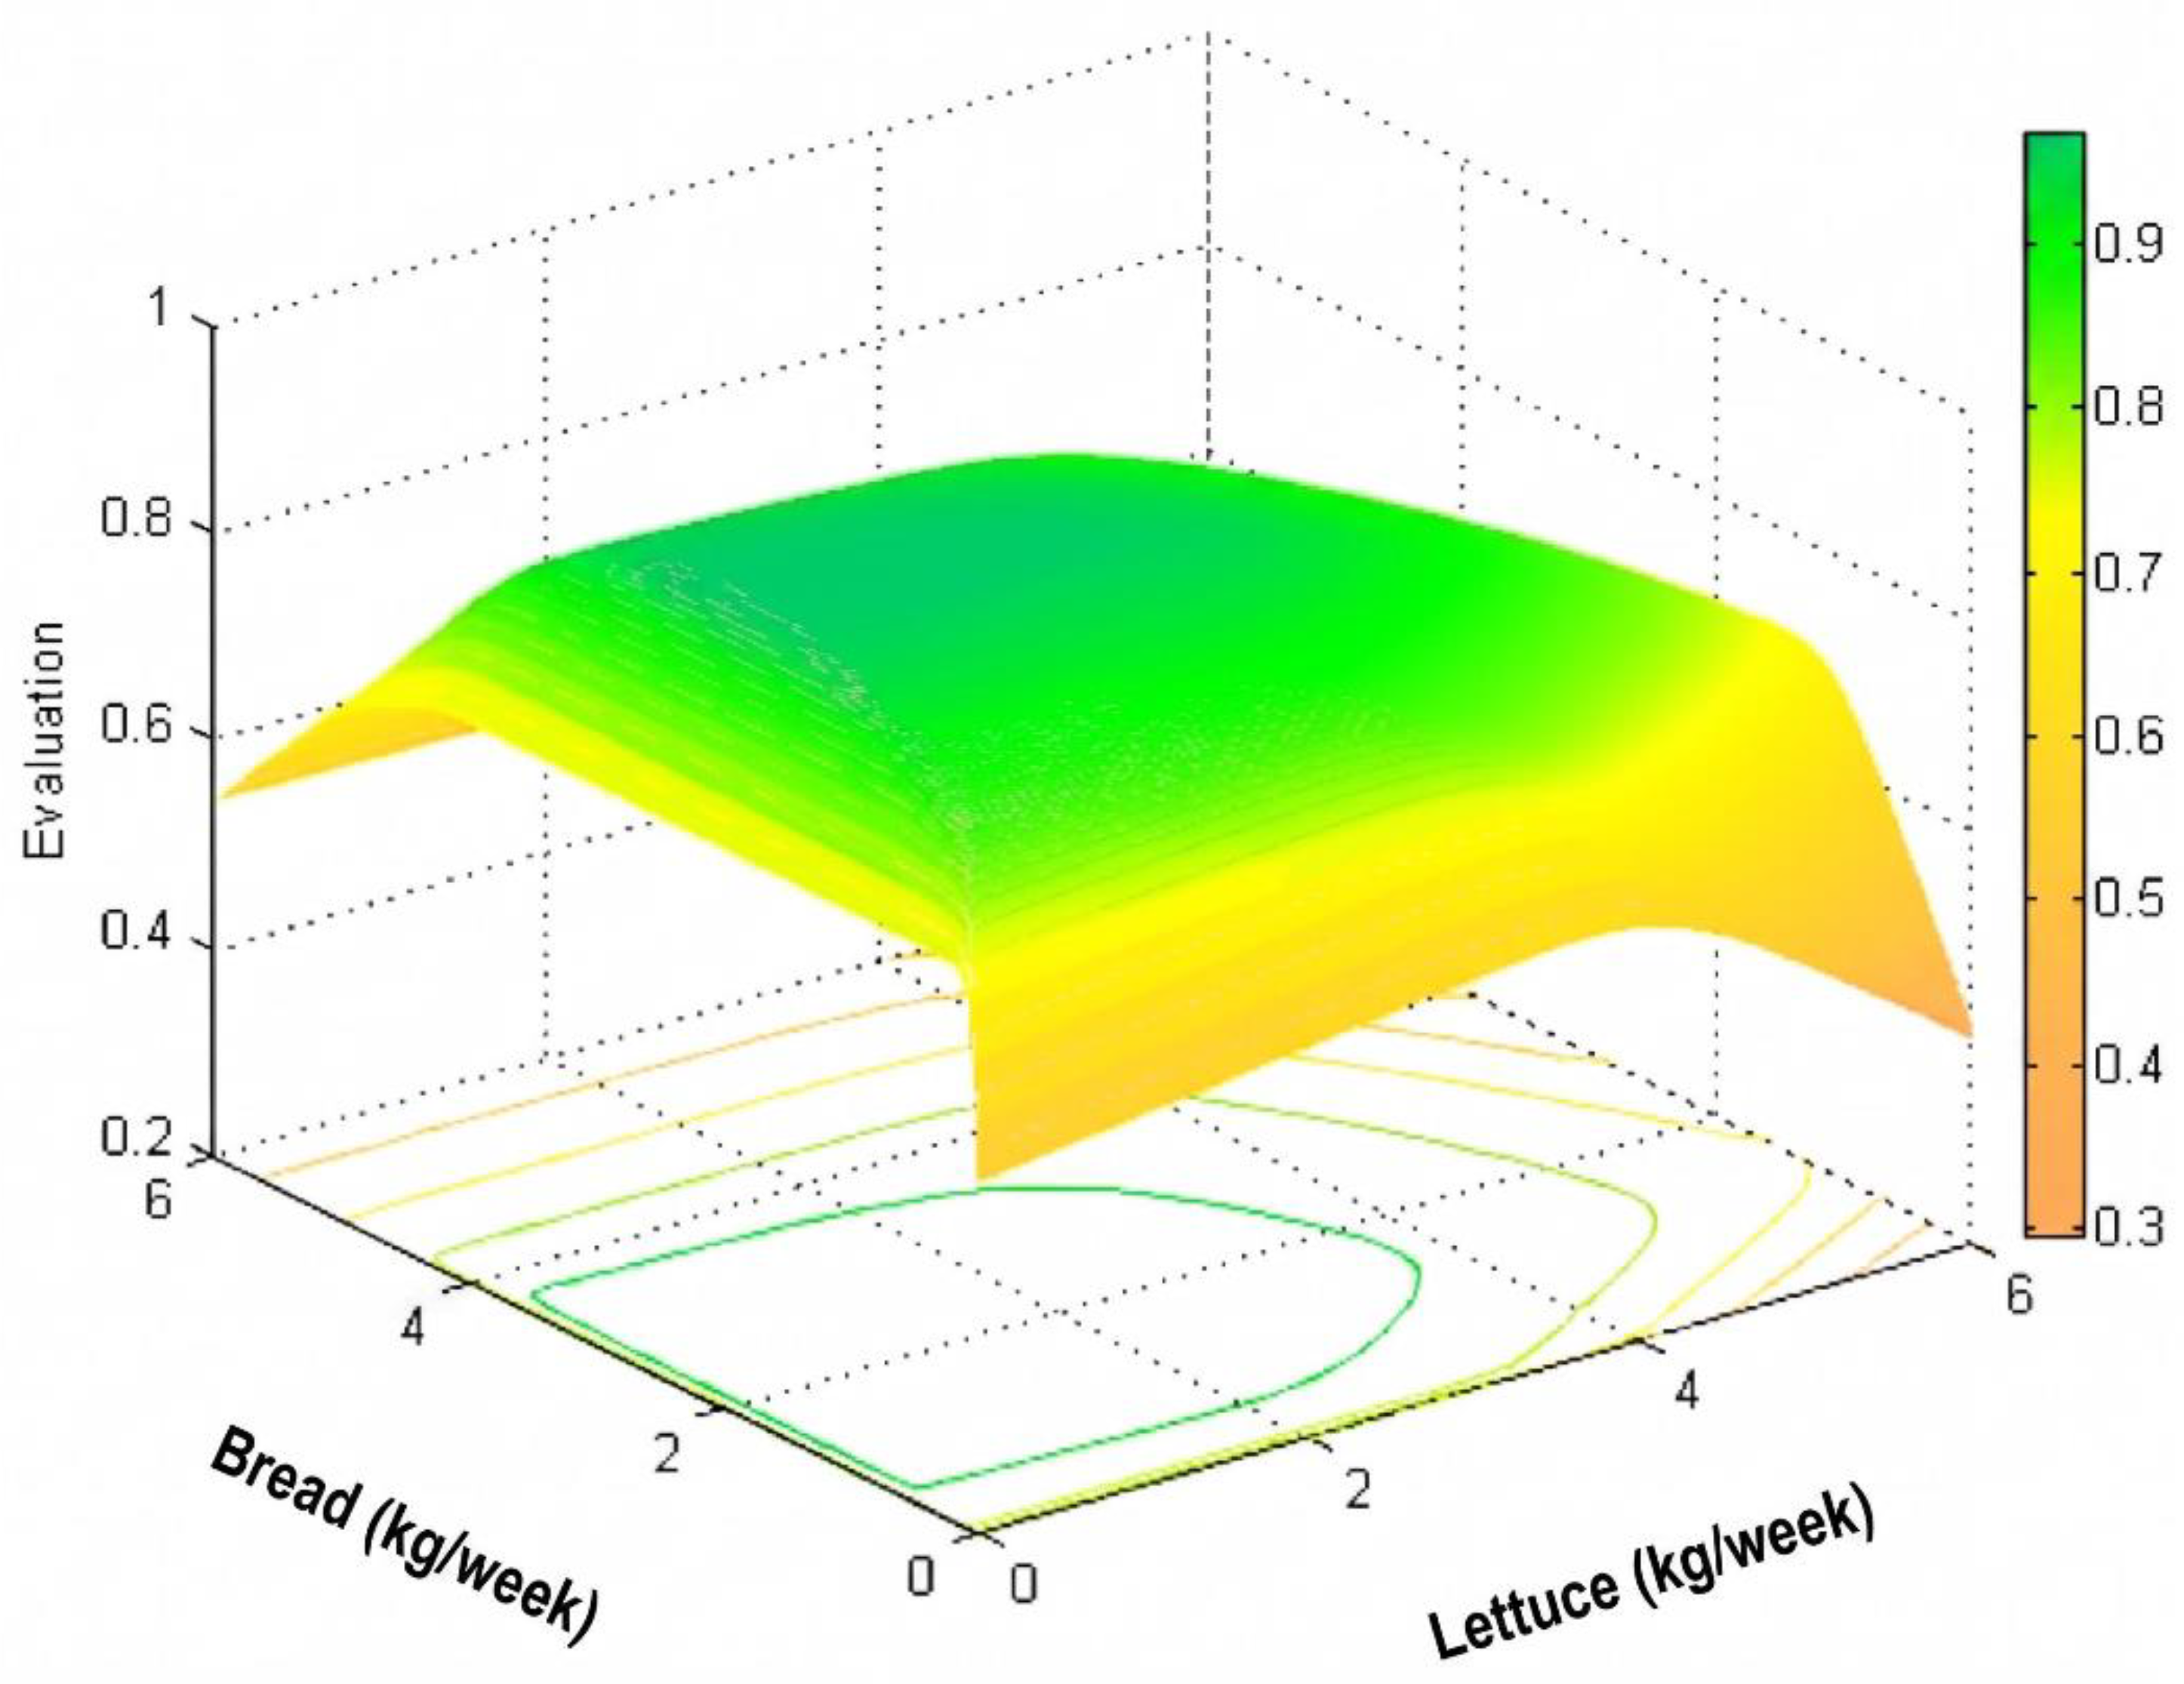
Figure 5.
Substitution effect between two foodstuffs with similar nutrient composition.
Disclaimer/Publisher’s Note: The statements, opinions and data contained in all publications are solely those of the individual author(s) and contributor(s) and not of MDPI and/or the editor(s). MDPI and/or the editor(s) disclaim responsibility for any injury to people or property resulting from any ideas, methods, instructions or products referred to in the content. |
© 2026 by the authors. Licensee MDPI, Basel, Switzerland. This article is an open access article distributed under the terms and conditions of the Creative Commons Attribution (CC BY) license (http://creativecommons.org/licenses/by/4.0/).
Copyright: This open access article is published under a Creative Commons CC BY 4.0 license, which permit the free download, distribution, and reuse, provided that the author and preprint are cited in any reuse.