

Submitted:
01 September 2026
Posted:
02 September 2026
You are already at the latest version
Abstract
Research on urban heat adaptation remains concentrated on metropolitan contexts, addressing only marginally the other settlement forms that characterise an intermediate Italy, whose extent reaches 69.4% of the national territory. For these settlements, still scarcely investigated by urban climate research, developing a survey methodology able to correlate temperature and morphology in detail takes on a specific scientific value: the possibility of reading a limited number of morphologically representative situations in depth and, by typological analogy, referring the results to portions of the city not directly surveyed but morphologically similar. This study proposes and tests such an approach in Crema (Lombardy, Italy), through five UAV-based thermal transects (approximately 400×50 m each) surveyed on 26 June 2025, sampling as many representative morphological conditions of the city: historic fabric, commercial strip, residential settlement along the Serio river, and production areas. The results show that apparent surface temperature follows the morphological and material configuration of the fabric more than its functional land use. An exploratory comparison with Landsat 8 satellite data, conducted to empirically test the logic of typological-analogy extension, shows a weak direct correspondence between the two sources, attributable to the well-known distinction between surface and canopy-layer urban heat island; typological classification instead proves internally consistent when tested on satellite data alone extended to multiple points across the city, a finding that makes plausible, without demonstrating it, the extension of the method to the scale of UAV survey. The study therefore proposes the thermal transect as a diagnostic tool proportionate to the scale of intermediate cities, and identifies systematic multiscale verification as the research direction needed to consolidate these preliminary results.
Keywords:
urban heat island
; surface temperature
; urban morphology
; thermal transect
; intermediate cities
; type-morphological analogy inference
1. Introduction
1.1. The Morphological Problem of Temperature in Intermediate Cities
Thermal differentials recorded in open urban space are not, in most cases, meteoclimatic variables independent of the built environment, but direct effects of the morphological configuration that produces them. That the surface temperature of a street canyon can exceed the surrounding air temperature by more than twenty degrees, or that two adjacent but differently configured blocks can show thermal differentials measurable in whole degrees rather than fractions of a degree, are observations that urban climatology has long traced back to the geometry of street fronts, the nature of surface materials, the presence or absence of vegetation, and the continuity or fragmentation of the built fabric [1,2,3]. Assuming urban heat as a diagnostic indicator of urban form, rather than as a climatic phenomenon, shifts the object of analysis from temperature as such to the material structure of the city that this temperature renders visible and measurable.
This approach has, however, found application almost exclusively in metropolitan contexts, where the intensity and extent of heat island phenomena justify the analytical and computational apparatus developed by international research [4]. A systematic review of a corpus of 146 studies confirmed this imbalance, showing that the morphological dimension receives comparatively less attention than the demographic, health, and climatic dimensions, despite recognition of its centrality in the spatial modulation of heat exposure [5]. Some recent studies have begun to partially fill this gap, applying Local Climate Zone classification to medium-sized cities in Europe [6,7], but these remain isolated cases relative to the scale of the problem: intermediate-sized cities, which nonetheless constitute the prevailing settlement condition in many European contexts, remain largely at the margins of this scientific production.
1.2. Crema and Italia di Mezzo as a Theoretical Gap
In Italy this gap takes on particular significance. The settlement belt that research on the repositioning of the Italian province has defined as Italia di mezzo (‘middle Italy’) occupies 69.4% of the national surface area, is home to 61.7% of the population, and comprises 5,979 municipalities, remaining largely absent from established climate adaptation models [8]. Crema, a city of approximately 34,000 inhabitants in the Lombard lowland, belongs in the settlement taxonomy developed by GRINS research to the category of lowland urban-rural continuum with medium population density [9]: a condition in which the built environment does not separate sharply from the surrounding agricultural space but interfaces with it through diffuse edges, production strips, mid-to-late-twentieth-century residential subdivisions, and commercial strips along the radial access routes. The hydrogeomorphological succession of the lowland, from the gravelly upper plain to the spring line down to the clayey lower plain, with the Serio to the east and the Adda to the west as the main hydrographic references, further introduces variables that directly condition the thermal behaviour of the soil, from the differentiated thermal capacity of agricultural soils to the regulating function of minor watercourses.
In a context of this kind, heat island phenomena do not behave as events confined to a compact urban mass, but are distributed discontinuously, following the logic of settlement dispersion rather than metropolitan density; research conducted on the Milan area has already documented how the Po plain generates a regional heat island that exceeds the administrative boundaries of individual cities, also involving peri-urban agricultural areas [10]. The practical relevance of these phenomena, moreover, is not only environmental: heat-related mortality in Europe in summer 2022 reached unprecedented levels in the recent historical series [11], making climate adaptation in intermediate cities a matter of public health as well as of urban design. Crema is positioned in this scenario as a useful limit case precisely because of its hybrid nature: compact enough to generate its own urban heat island, yet permeable enough to the agricultural landscape that it cannot be described with the tools developed for the metropolitan context. The typological framework of Local Climate Zones [12] offers a first descriptive language for these conditions; a recent application calculated morphometric parameters via GIS, such as mean building height, aspect ratio, and sky view factor, for five Italian cities including Milan [13], but its systematic application to intermediate Italian settlement realities, and to Crema in particular, remains a field largely still to be built.
1.3. Scale, Anthroposphere, and Scalar Continuity
Urban heat is by its nature a multiscalar phenomenon, whose effects accumulate and are modulated along a continuum running from territorial composition to the geometry of the single open space: none of these scales, considered in isolation, is sufficient to explain the conditions a body experiences while walking along a street on a summer day. The relationship between urban form and climatic behaviour is never reducible to a single variable, but emerges from the interaction between geometry, materials, and external climatic conditions [14,15]. The most recent composite metrics, such as the UTCI index, Physiological Equivalent Temperature, and Mean Radiant Temperature, have proven more sensitive than air temperature alone in capturing the physiological experience of open space [5], evidence that shifts attention from instrumental measurement to the body as the ultimate frame of reference for analysis.
This bodily reference is captured by the category of anthroposphere, the microclimatic layer of about two metres above ground level in which thermodynamic exchanges between the human body and its immediate environment take place [16]. Assuming this scale as relevant is not a purely technical choice but an epistemological commitment: it means bringing the entire analytical chain, from territorial data to point measurement, back to a design question rather than a descriptive exercise. It is within this framework that the scalar continuity approach adopted here is situated, an analytical trajectory linking data acquired from an aerial platform to the reading of thermal behaviour at pedestrian scale, maintaining interpretive coherence along the entire path. The analytical tool through which this continuity is operationalised in this study is the thermal transect, a linear sample of urban fabric whose representativeness does not derive from the repetition of conditions along the survey axis, but from their extension within a homogeneous morphological family, within the methodological tradition that reads the city starting from chosen interpretive sections [17,18,19], a line that also engages with the climatological tradition of the mobile transect, developed for the direct measurement of the heat island along predefined urban routes [20]. The specific sampling logic adopted in this study, and its limits, are discussed in detail in the Materials and Methods section.
1.4. Objectives and Structure of the Article
Building on these premises, the article addresses a circumscribed but not secondary question for the climate planning of intermediate cities: whether the thermal behaviour of an urban fabric depends predominantly on its morphological and material configuration rather than on the functional land use it hosts, and whether a sampling method based on thermal transects, generalised through type-morphological analogy inference, can constitute an efficient analytical tool where systematic monitoring of the entire urban fabric is unavailable, a recurring condition in most Italian medium-sized cities. To address this question, the study presents a comparative design based on five multispectral UAV surveys conducted in Crema, each sampling a distinct morphological and functional condition: the historic fabric near the urban park, the southern commercial strip, the discontinuous residential settlement near the Serio River, and two production areas in the northern part of the city.
The article is organised as follows. Section 2 describes the study area, the UAV acquisition protocol, and the sampling design of the five transects, including the explicit justification of the type-morphological analogy inference logic. Section 3 presents the comparative results, with particular attention to the relationship between vegetation cover, morphological configuration, and the distribution of surface temperature. Section 4 discusses these results considering the scalar continuity framework and the anthroposphere concept, comparing them with the literature on metropolitan heat islands and explicitly reflecting on the limits of the adopted method. Section 5 concludes by summarising the implications for climate adaptation planning in intermediate cities and outlining a future research agenda.
2. Materials and Methods
2.1. UAV Platform and Sensors
The UAV system combines a DJI Matrice 300 RTK multirotor with a first-generation MicaSense Altum camera, a DLS 2 downwelling light sensor, and a calibrated reflectance panel (Figure 1). Network RTK corrections were received through NTRIP over the cellular network. Corrected aircraft positions were transferred to the camera through SkyPort and stored in the image metadata with centimetre-level coordinate accuracies. The DJI advanced cellular transmission system provided a redundant link between the aircraft and remote controller. This configuration integrated the platform, payload, positioning, radiometric calibration, mission planning, and acquisition within a single mapping system [21,22,23,24]. The Altum includes five 3.2 MP multispectral imagers and a 160 × 120 pixel long-wave infrared sensor. Synchronized blue, green, red, red-edge, and near-infrared images were acquired at approximately 475, 560, 668, 717, and 842 nm, with six single-band TIFF files generated for each capture event (Figure 2). Simultaneous acquisition avoided temporal offsets between the spectral and thermal observations. The visible bands supported true-colour composites, while the red, red-edge, and near-infrared bands supplied the inputs for NDVI and NDRE. NDVI was used as the principal vegetation layer and NDRE as a complementary representation of red-edge response. Both indices were interpreted with reference to land cover, crown geometry, shadow, and field observations because heterogeneous urban materials and mixed pixels can affect spectral values [25,26,27].
The LWIR channel records radiance near 10.5 micrometres and stores radiometric values in centikelvin. Although its spatial resolution is lower than that of the multispectral channels, it provides continuous coverage of roofs, roads, paved areas, soil, lawns, and tree crowns. The thermal products were therefore used to map apparent surface temperature and relative spatial gradients rather than metrologically validated absolute temperatures [28,29,30,31]. The DLS 2 was mounted above the aircraft with an unobstructed view of the sky and recorded incident irradiance and solar angle for the five reflectance bands. Image georeferencing relied on the RTK positions supplied through SkyPort, while the calibrated panel provided field reference values for radiometric correction. Ground instruments included a FLIR T1020 handheld thermal camera, operated with emissivity set to 1.0, and shielded HOBO data loggers for air temperature and relative humidity. The FLIR observations on selected horizontal surfaces and beneath tree canopies served as a qualitative consistency check. Neither the handheld camera nor the data loggers were used to recalibrate the UAV thermal imagery [25,28,29,32,33,34].
2.2. Flight Protocol and Technical and Environmental Conditions during Data Acquisition
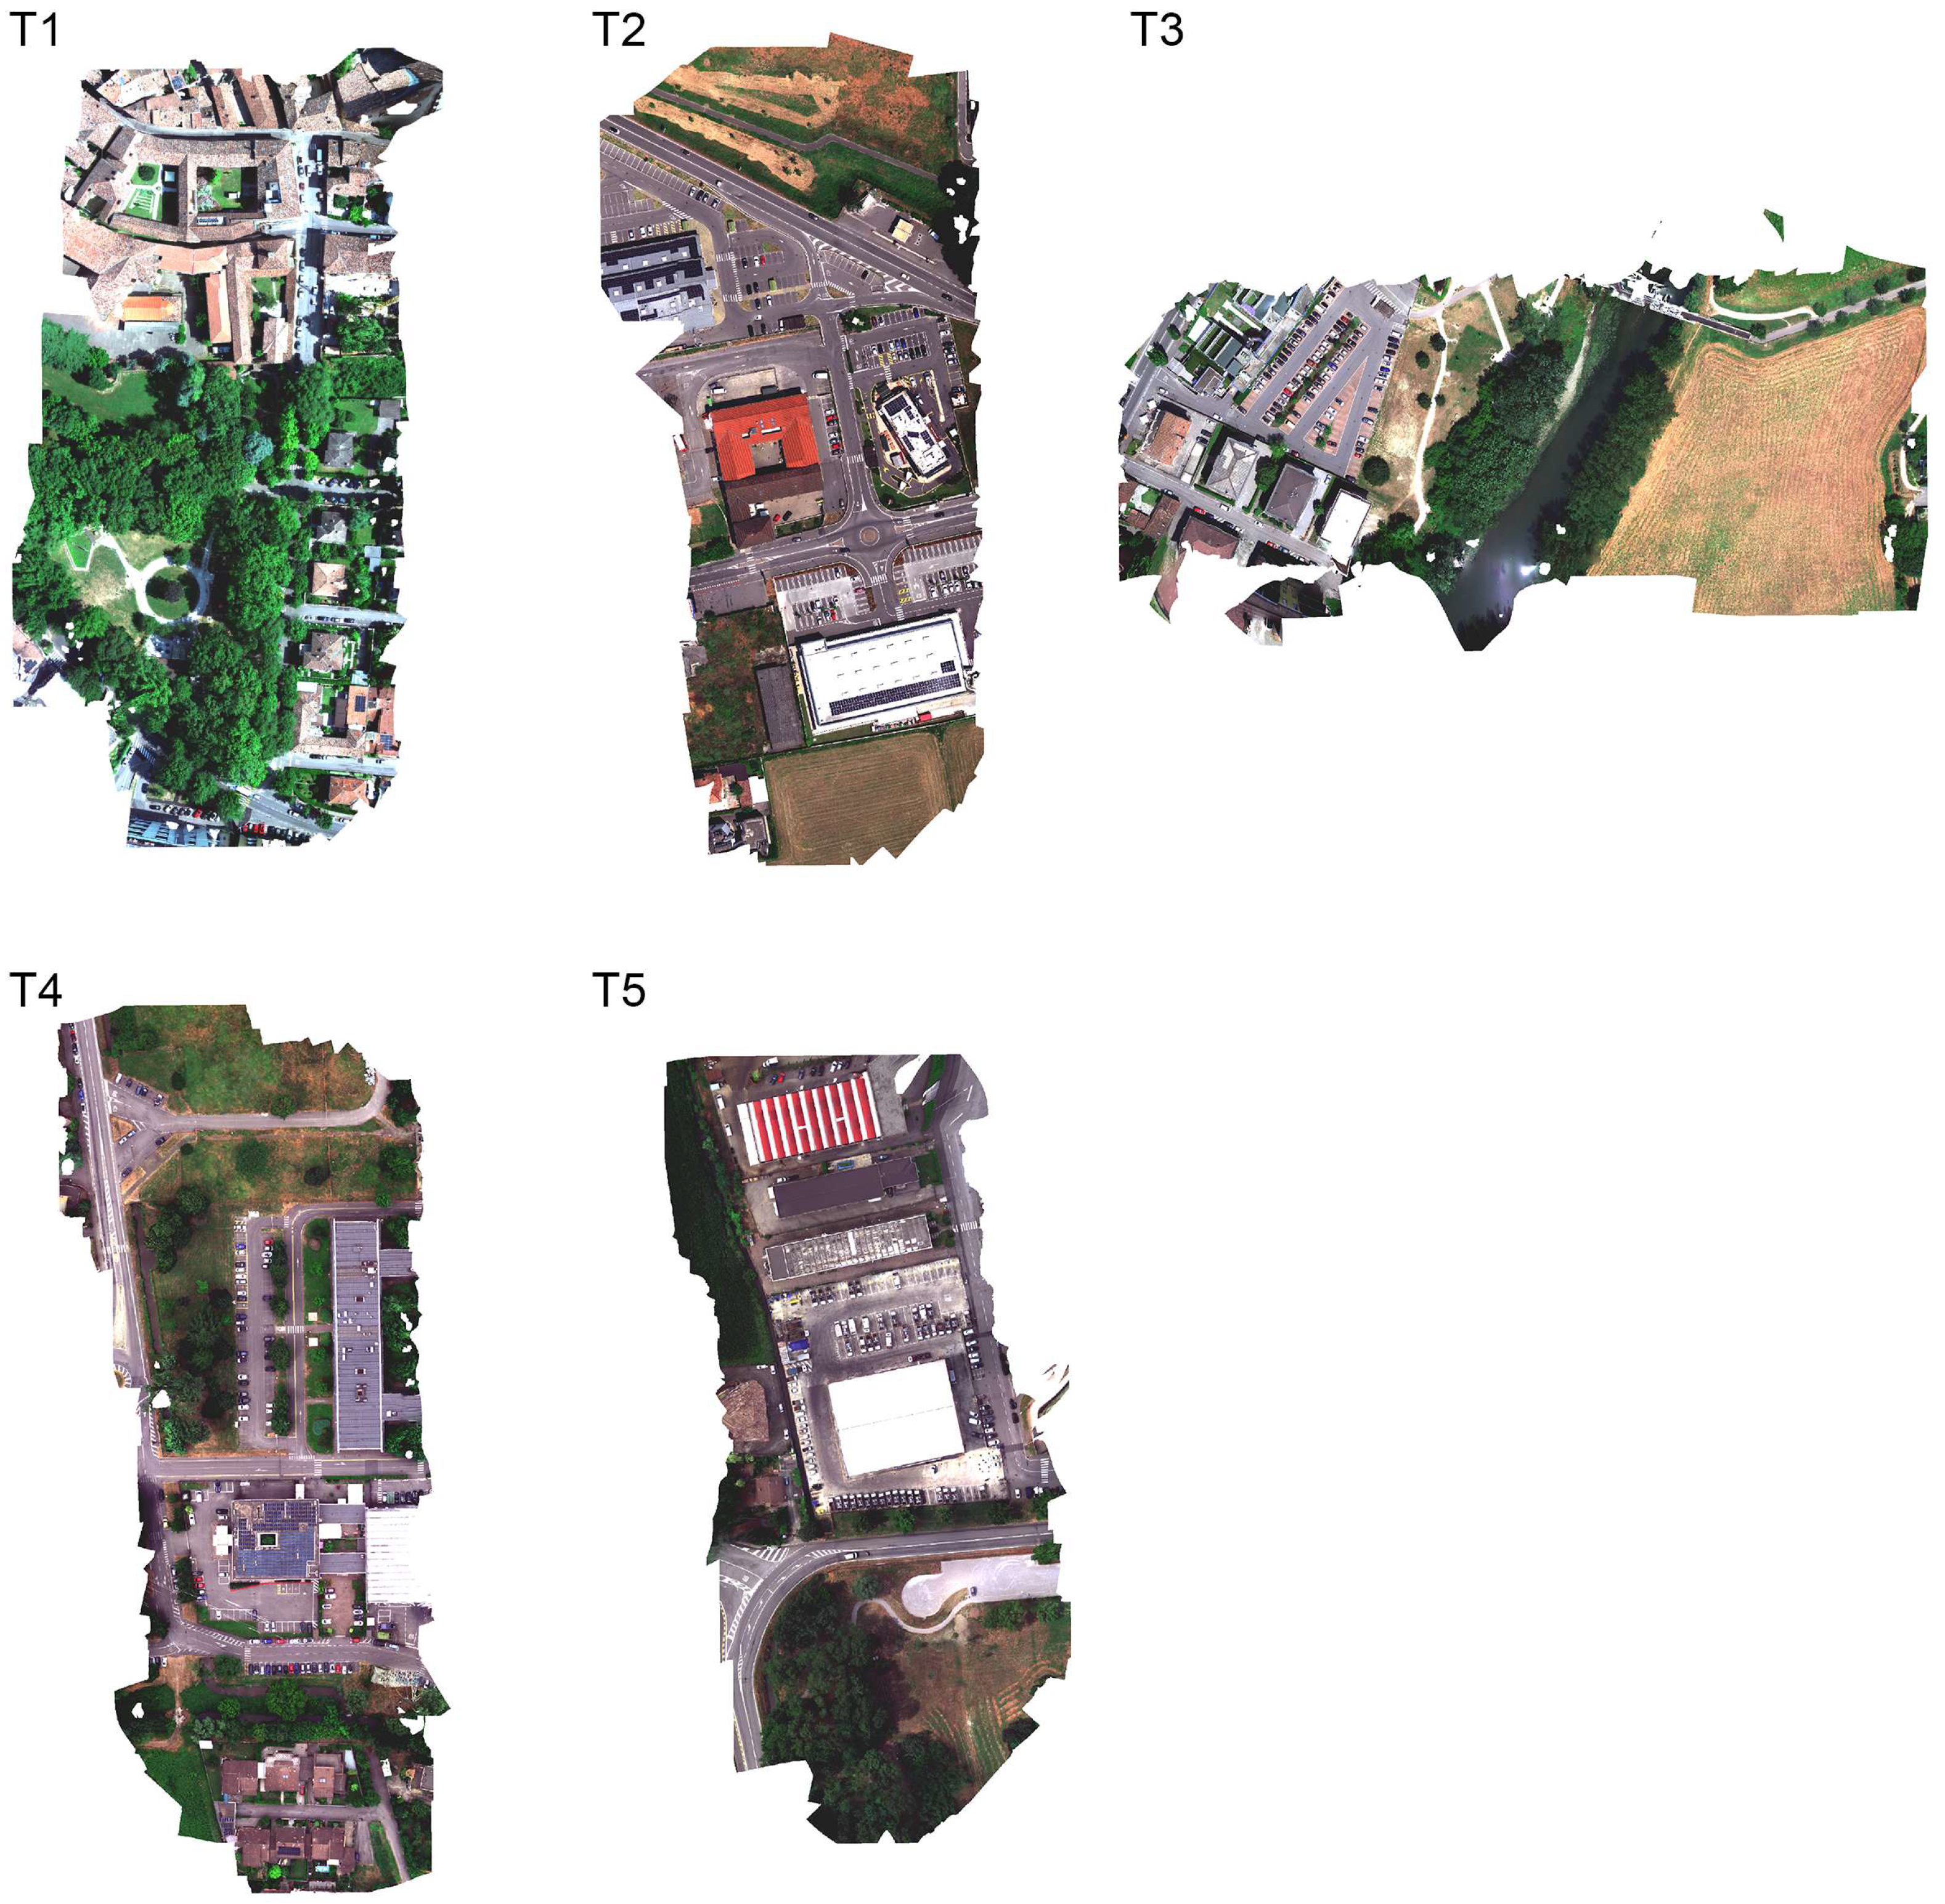
The acquisition protocol maintained consistent mission geometry, sensor configuration, and operating procedures across the five study areas. Planning covered airspace verification, flight parameters, authorisation, ground safety, and meteorological monitoring. The five elongated transects were selected to represent contrasting urban morphologies and land uses in Crema (Figure 3). They included Campo di Marte Park and part of the central fabric, a commercial and service-sector area with extensive paved surfaces, a corridor along the Serio River containing asphalted, vegetated, and agricultural land, and two industrial areas. Each transect measured approximately 400 × 50 m, corresponding to about 20,000 m² or 2 ha, and crossed buildings, roofs, pavements, vegetation, and open spaces within the same flight.
The survey was conducted on 26 June 2025 between 10:30 and 16:00, with approximately 30 min required for each area. The acquisition time of each transect was retained because apparent surface temperature responds to solar irradiance, shading, and surface-energy exchanges. Conditions were predominantly sunny, although thin and rapidly moving clouds intermittently affected illumination. Mean air temperature was 28.8 °C, the daily maximum was 35.0 °C, and mean relative humidity was 61%. At the asphalted sites, shielded loggers positioned approximately 50 cm above ground recorded local air temperatures up to 38.5 °C. During each flight, the HOBO loggers continuously recorded air temperature and relative humidity. The FLIR T1020 measured selected ground surfaces and locations beneath tree canopies that were not visible from the nadir UAV view. These observations documented the local environmental context and provided an independent qualitative comparison with the aerial thermal patterns. Images of the calibrated reflectance panel were acquired immediately before and after each transect, while the DLS 2 recorded irradiance and sun-angle data throughout the flight. Both sources were retained to account for the observed short-term changes in illumination. This procedure supported calibration of the five reflectance bands but did not apply to the LWIR channel, which records emitted thermal radiation.
Automated nadir missions were programmed, and image capture was controlled through the Altum automatic overlap mode. Flights were conducted under visual line of sight in accordance with the IT-STS-01 operational scenario. Altitude was set at 45 m above ground level, speed at 2 m/s, and longitudinal and lateral overlap at 75%. These parameters provided continuous coverage and sufficient redundancy for image-based reconstruction. At 45 m altitude, the multispectral bands produced a ground sampling distance of approximately 1.94 cm/pixel, whereas the LWIR channel produced an indicative GSD of approximately 0.30–0.31 m/pixel. Thermal pixels therefore represented substantially larger ground footprints and were interpreted as spatially averaged surface responses rather than at the geometric detail of the multispectral orthomosaics. D-Flight verification indicated an applicable altitude of 120 m over the study areas. The 45 m missions therefore remained well below this limit, and the required local authorisation was obtained from the Prefecture of Cremona. Before and during each flight, ground activity and access by uninvolved persons were monitored. Transect geometry, platform, nadir orientation, altitude, speed, and overlap were kept constant across the five areas to limit methodological variability.
2.3. Multispectral and Thermal Data Processing Workflow
The five datasets were processed in Agisoft Metashape Professional using an image-based Structure from Motion and multi-view stereo workflow [23,35,36]. A separate block was created for each study area. Each block contained approximately 2,000-2,500 single-band images, corresponding to about 330-415 synchronised captures across the five reflectance bands and the LWIR channel. Images were imported as a multicamera system so that the six channels from each capture remained within a common rig. Processing was performed in WGS 84 / UTM zone 32N. RTK-corrected image coordinates transferred through SkyPort were used as camera-position priors. No ground control points or independent checkpoints were introduced, so the workflow used RTK-assisted direct georeferencing and the absolute accuracy of the final products was not independently validated [24,37]. Panel images acquired before and after each transect were assigned their calibrated reflectance values, and DLS 2 irradiance and sun-angle metadata were used to compensate for within-flight illumination changes. Two representative blocks were also processed using the panel observations alone and produced closely comparable reflectance products. The LWIR channel was excluded because it records emitted rather than reflected radiation. Images were aligned at High accuracy with generic preselection enabled. The red-edge band was selected as the primary channel for feature matching and bundle adjustment, while the remaining channels retained the multicamera relationship. Camera parameters were optimised after alignment [25,32,33,34,35].
Figure 4.
True-colour (RGB) orthomosaics of the five thermal transects (T1–T5), 26 June 2025.
High-quality depth maps were generated from the aligned images and used to create a dense point cloud for each block. All reconstructed points were retained when generating the elevation surface. The resulting product was a digital surface model (DSM) because buildings, tree crowns, and other above-ground elements were not removed by ground classification. Orthomosaics were generated on the DSM using Mosaic blending at the maximum available resolution for each sensor component [23,35,36]. Thermal values were converted from centikelvin to degrees Celsius. No scene-wide correction was applied for emissivity, reflected apparent temperature, or atmospheric attenuation. The orthomosaics contained vegetation, soil, roads, roofs, and shaded surfaces with different emissivities, so a single coefficient would not represent the heterogeneous urban scene. The resulting raster was treated as apparent surface temperature. Interpretation focused on relative gradients between sunlit and shaded surfaces, vegetated and mineral areas, and materials with contrasting thermal responses. FLIR T1020 measurements remained a qualitative field consistency check and did not supply correction coefficients [28,29,30,31,38].
NDVI and NDRE were calculated from the calibrated reflectance orthomosaics, with NDVI used as the principal vegetation product (Figure 5) and NDRE retained as a complementary red-edge layer. A true-colour composite was generated from blue, green, and red bands. The GIS package for each transects comprised the calibrated multispectral orthomosaics, RGB composite, NDVI, thermal orthomosaic, and DSM, linking spectral response, apparent surface temperature, and urban morphology within the same georeferenced framework [25,26,27]. The RGB composite, NDVI, and DSM were exported at a cell size of 0.05 m to improve display speed and data handling. The thermal orthomosaic was retained at its native resolution for analysis (Figure 6), while a second version was resampled to a nominal 0.05 m cell size for overlay and visualisation with the other layers. This resampling did not increase the effective thermal resolution, which remained approximately 0.30 m. All products were exported in WGS 84 / UTM zone 32N and analysed in a GIS environment.
2.4. Sampling Logic of the Transects and Verification of the Type-Morphological Analogy Inference
The five transects are not proposed here as a statistically representative sample extendable to the entire urban fabric of Crema, but as diagnostic probes at the native resolution of the survey, in line with studies that have documented high variability in drone-detectable surface temperature even within urban spaces of limited extent [39], each referring to a representative morphological and functional condition: the historic fabric near the urban park, the southern commercial strip, the discontinuous residential settlement along the Serio river, and two production areas in the northern part of the city. The comparative reading presented in Section 3 is valid within the areas actually surveyed; any claim about how far these conditions extend to portions of the city that are typologically similar but not directly surveyed rests on an assumption, the type-morphological analogy inference, which requires explicit examination rather than tacit acceptance, within the methodological tradition that treats the transect or interpretive section as a tool for reading the city, not as a statistically randomised sample [17,18,19].
To subject this assumption to empirical scrutiny, the five transects were compared with the Landsat 8 OLI/TIRS Collection 2 Level 2 surface temperature product, a radiometrically calibrated dataset following the official USGS algorithm, acquired on 24 June 2025, two days apart from the UAV survey, with cloud cover verified as negligible over the Crema area. The comparison was conducted on the exact footprint of each transect, reprojected into the reference system of the satellite data. Four indicators were calculated and compared, the mean, maximum, minimum, and interquartile range, with Spearman’s rank correlation between the ordering of the transects in the drone data and in the satellite data.
None of the four indicators shows a consistent correspondence. The coefficients range from a moderate positive value for the minimum (ρ ≈ +0.5) to a weak negative value for the maximum (ρ ≈ -0.4), with the mean and the interquartile range falling in between (ρ ≈ +0.3 and ρ ≈ -0.1, respectively) and no recognizable common direction across the four. It should also be noted that, with a sample of five transects, none of these coefficients could reach conventional statistical significance regardless of their absolute value: the test should therefore be read as exploratory, not as a strict inferential verification.
To test whether the lack of correspondence found at whole-transect scale depended on the internal morphological heterogeneity of each sampled area, particularly marked in transect 1, which includes both historic fabric and park, the comparison was repeated with a more targeted design. Twenty-five patches of approximately 50 m in diameter, each internally homogeneous, were identified through photointerpretation across five morphological families (commercial axis, mineral historic core, large parks, discontinuous residential fabric, production site): seven of them located within the footprint of a transect, with matching drone data, the remaining eighteen at other points in the city recognised by morphological analogy, with satellite data only. Two distinct tests were conducted on this design, whose results are reported in detail in § 3.6.
The first test, the correlation between drone and satellite data on the seven internal patches, yields an outcome substantially coincident with that obtained at whole-transect scale (Spearman’s ρ = 0.29, not significant): the decomposition into more homogeneous units does not resolve the discrepancy between the two sources, which therefore remains attributable to differences in spatial resolution, radiometric treatment, acquisition timing, and surface aggregation., rather than to the internal heterogeneity of the transects.
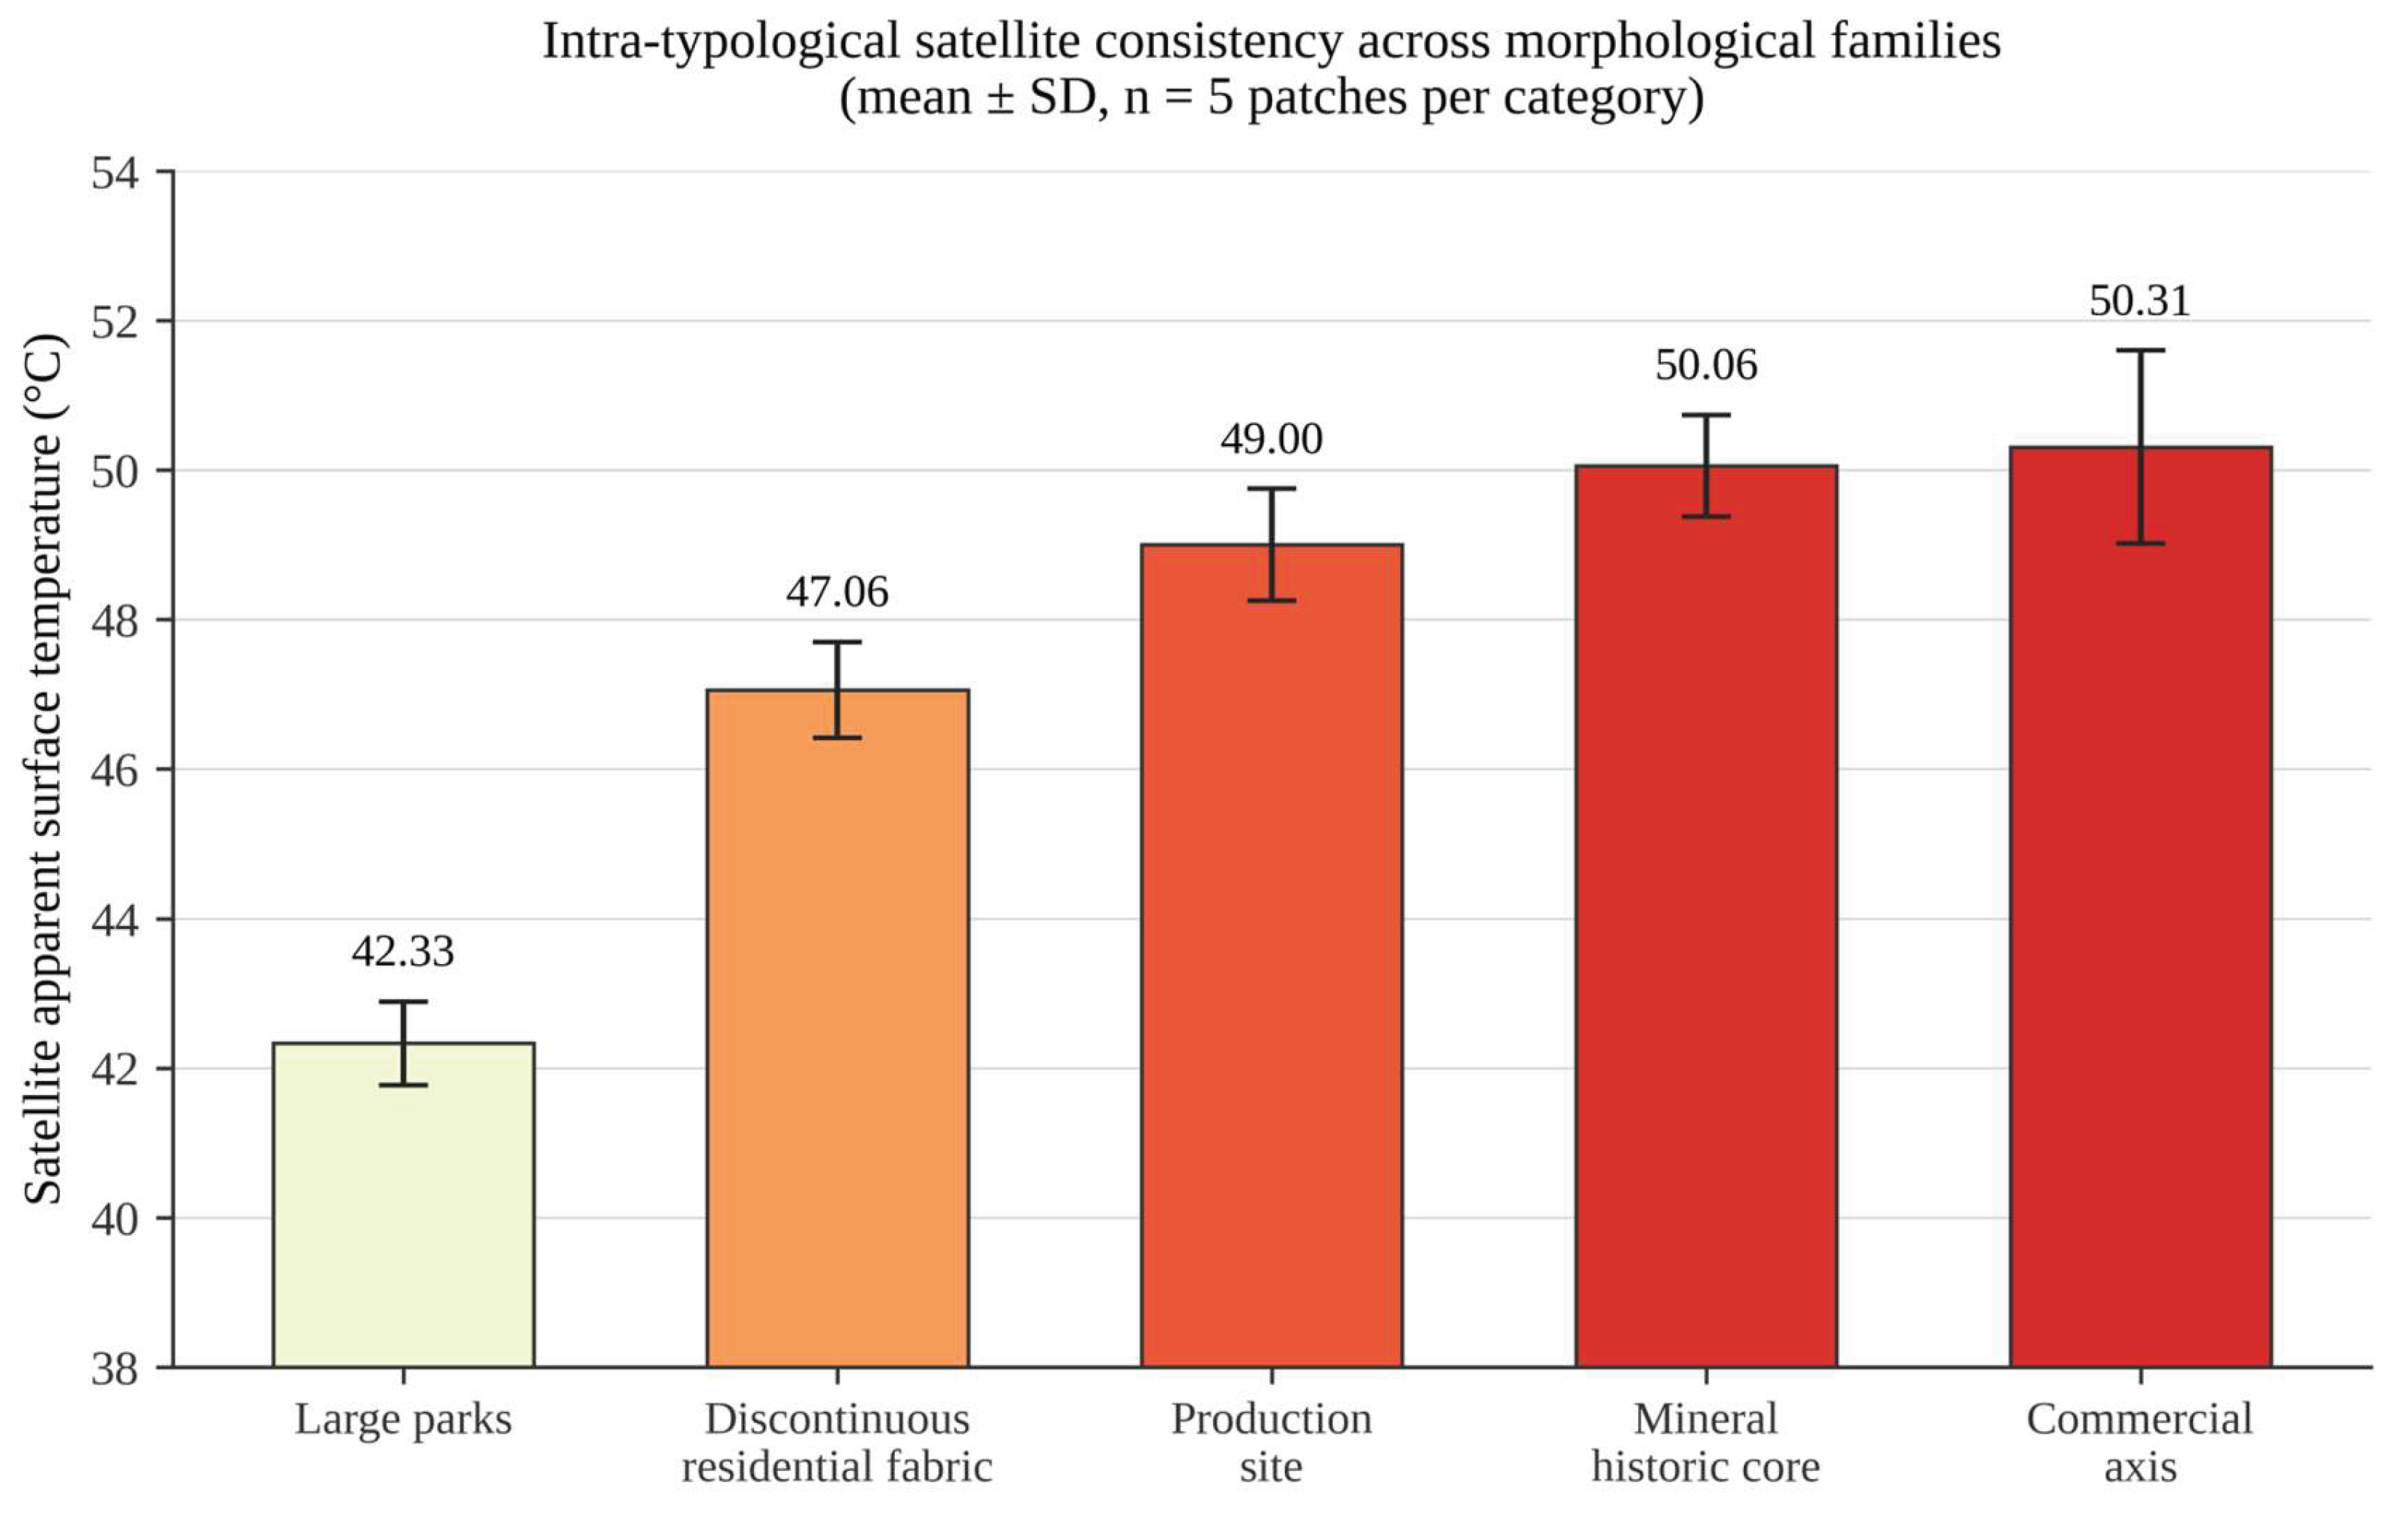
The second test, however, takes on a different and more robust significance. Comparing satellite data across all patches of the same morphological family, including those never overflown by the drone, the variance within each category proves minimal relative to the variance between different categories (one-way analysis of variance, F = 79.65, p < 0.000001, n = 25). This result should be read for exactly what it rigorously demonstrates, no more: classification by morphological family is a consistent and statistically robust predictor of thermal behaviour observable from satellite, independent of the patch’s location within the city. It does not demonstrate, because the available data do not allow it, that the same consistency would be reproduced at drone resolution at points never surveyed: it is evidence supporting the plausibility of the typological classification principle underlying the transect method, not a direct validation at the fine-grained scale.
Considering these three results, complementary and not equivalent, the most accurate reading is as follows. The principle of classification by type-morphological analogy finds solid empirical support in the intra-category satellite consistency, which makes its validity at the fine-grained scale plausible. The systematic discrepancies between drone and satellite, documented both at transect scale and at single-patch scale, do not contradict this principle but rather circumscribe the instrument used to verify it. Satellite data can confirm the existence and spatial consistency of morphological categories but cannot reproduce the fine-grained surface thermal patterns resolved by UAV imagery at the scale of individual surfaces and land-cover transitions. The direct extension of drone-measured values to unsurveyed points in the city therefore remains, on this basis, a hypothesis with an initial favourable but unproven indication at the scale that truly matters for design, the pedestrian scale: definitive verification requires a dedicated UAV campaign on the eighteen patches identified here only by satellite, or a fixed sensor infrastructure at canopy height.
3. Results
3.1. Comparative Overview of the Five Transects
Values reported here are expressed as apparent surface temperature, as defined in Materials and Methods (§ 2.3): the data is not corrected for emissivity, reflected apparent temperature, or atmospheric attenuation, and should therefore be interpreted as indicators of relative thermal gradients among surfaces and transects rather than as metrologically traceable absolute measurements. The comparison between the five transects shows an overall wide range of variation, with mean values between 34.08 °C and 44.99 °C and an absolute range extending from a minimum of 16.51 °C to a maximum of 79.28 °C (Table 1). This excursion, nearly 63 degrees between the lowest and highest values recorded across the entire sample, is not matched by an equally marked differentiation in internal standard deviations, which range over a narrower interval, between 6.76 and 10.29. The preliminary pattern suggests that thermal variability is associated more closely with local land cover and building configuration than with spatial proximity among transects, a relationship examined in the following comparisons.
Figure 7.
Distribution of apparent surface temperature by transect (whiskers: min–max; box: 25th–75th percentile; diamond: mean). See Table 1.
Figure 7.
Distribution of apparent surface temperature by transect (whiskers: min–max; box: 25th–75th percentile; diamond: mean). See Table 1.
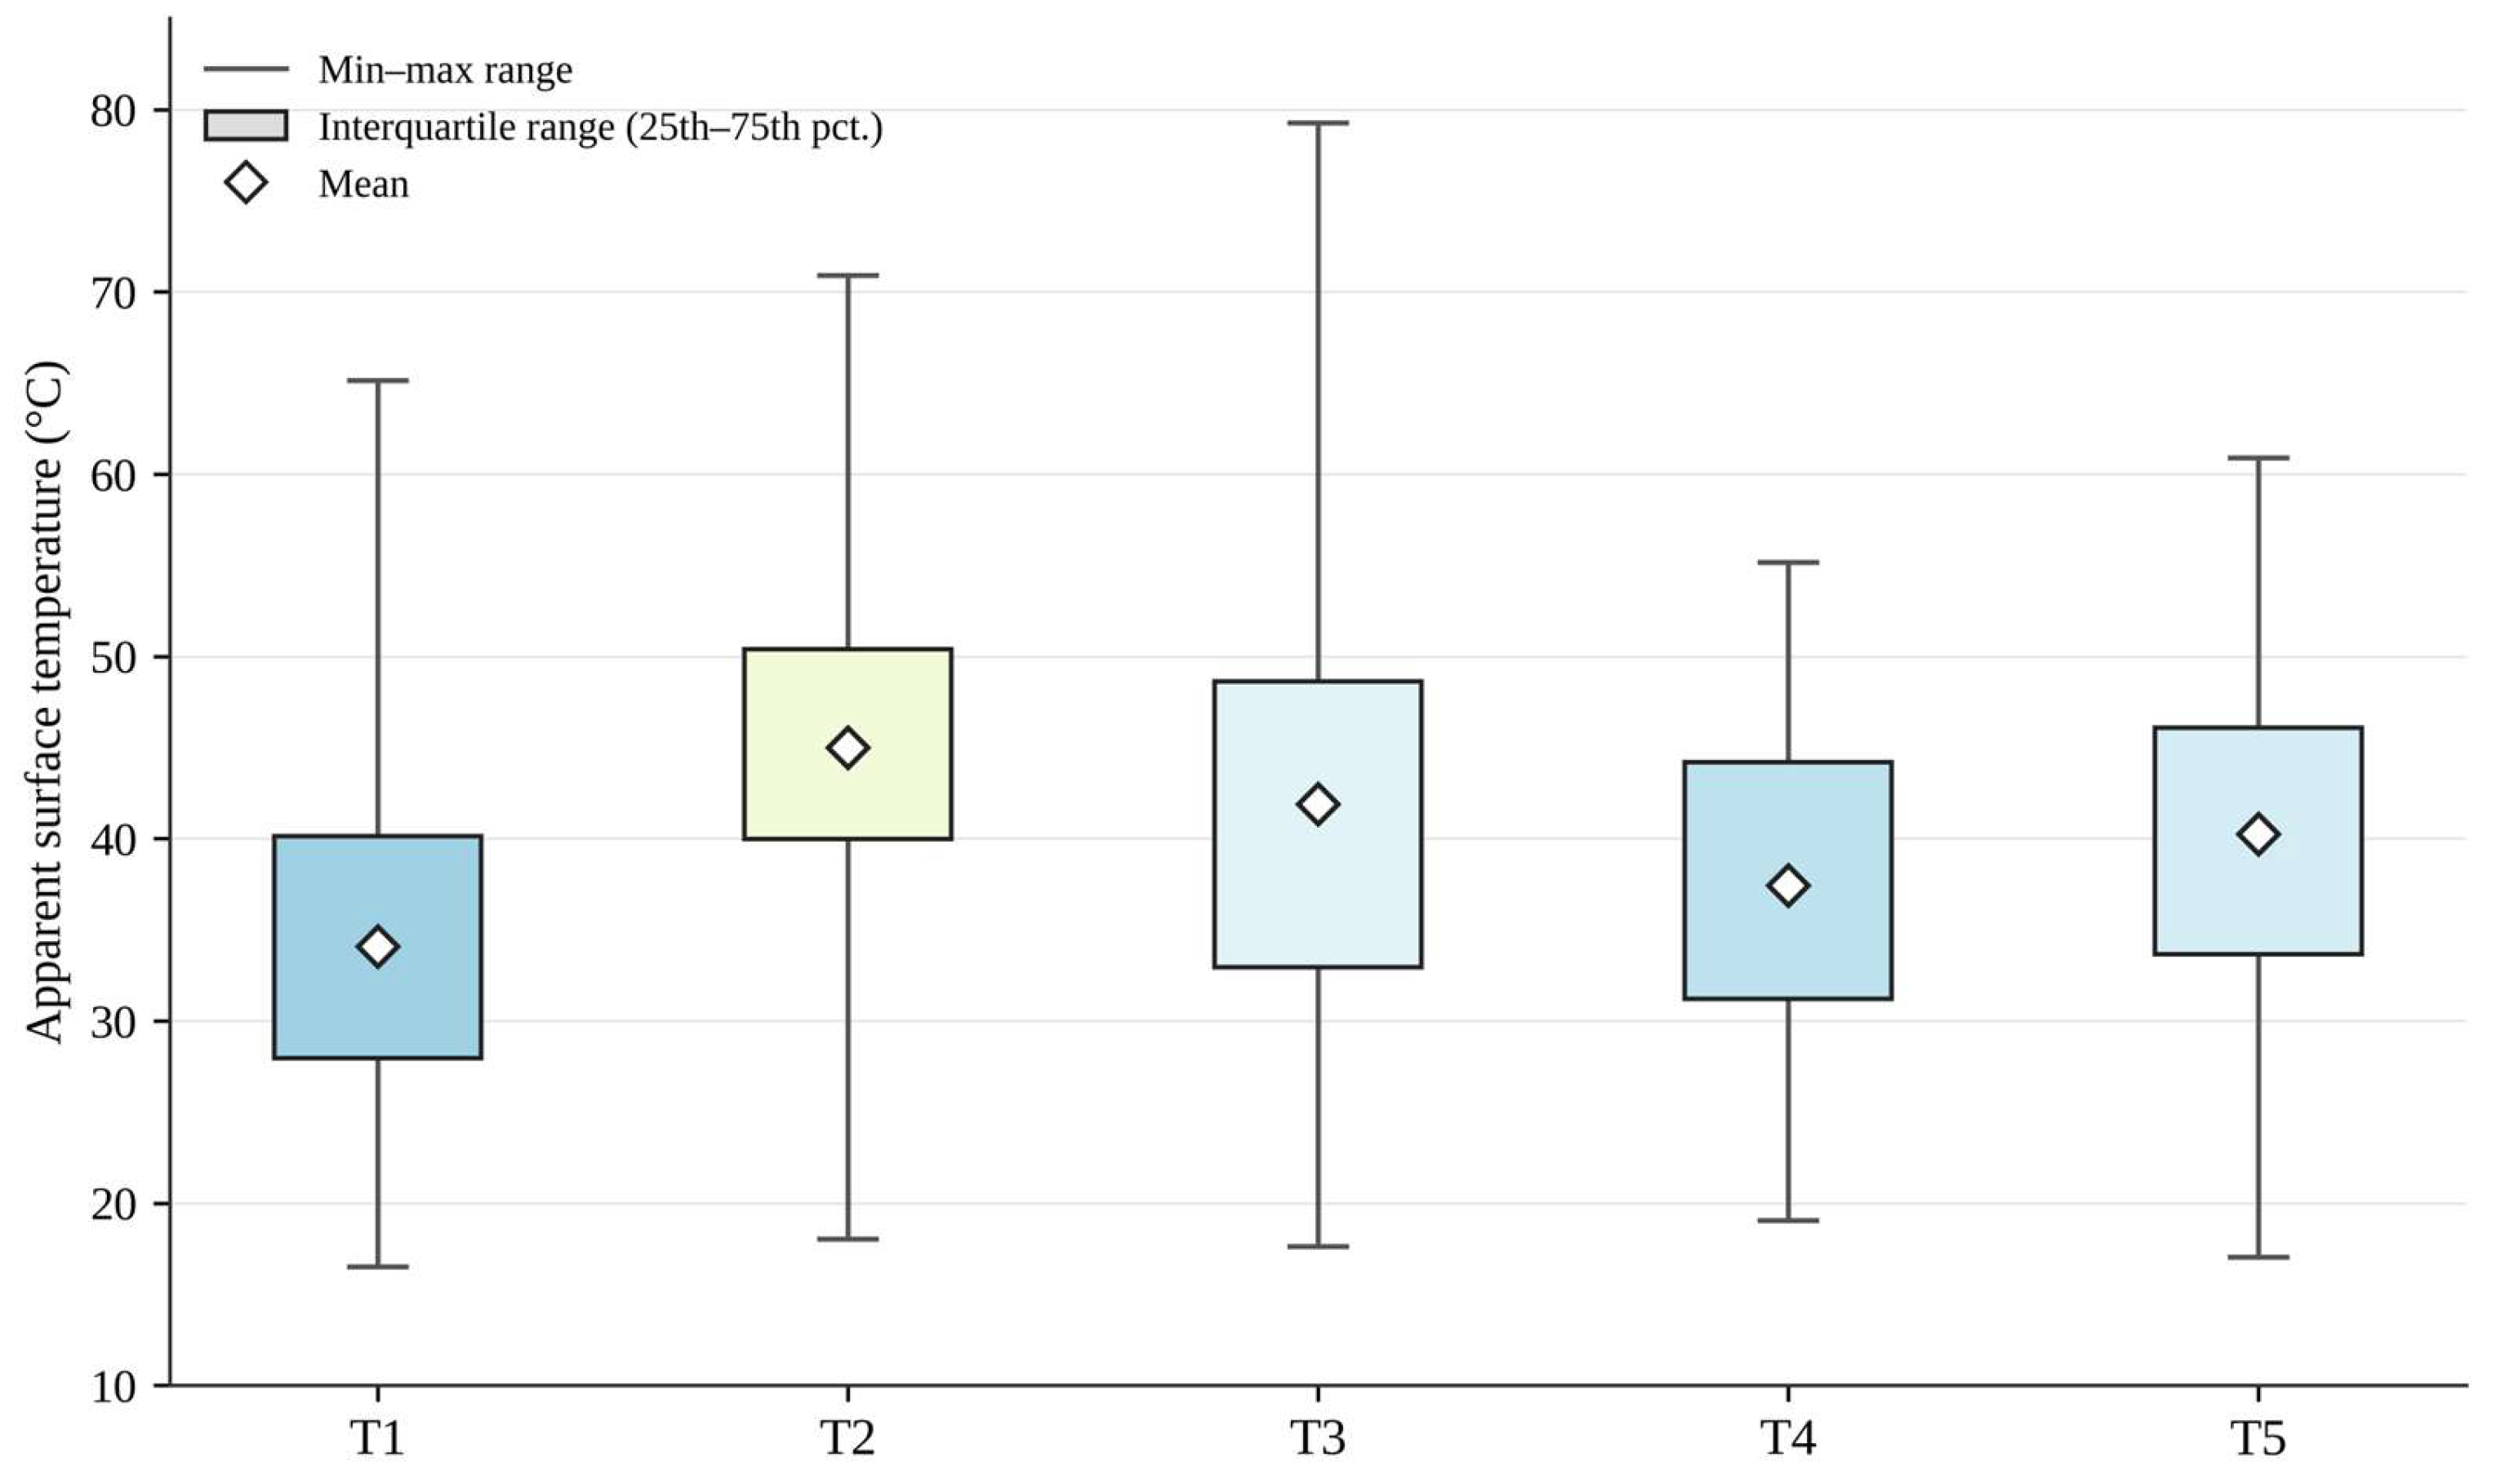
Figure 8.
Drone versus satellite mean apparent surface temperature, footprint-on-footprint (see Table 2 and Table 4). Points above the dashed 1:1 line indicate systematic satellite overestimation; the arrow highlights the rank swap between T1 and T3.
Figure 8.
Drone versus satellite mean apparent surface temperature, footprint-on-footprint (see Table 2 and Table 4). Points above the dashed 1:1 line indicate systematic satellite overestimation; the arrow highlights the rank swap between T1 and T3.
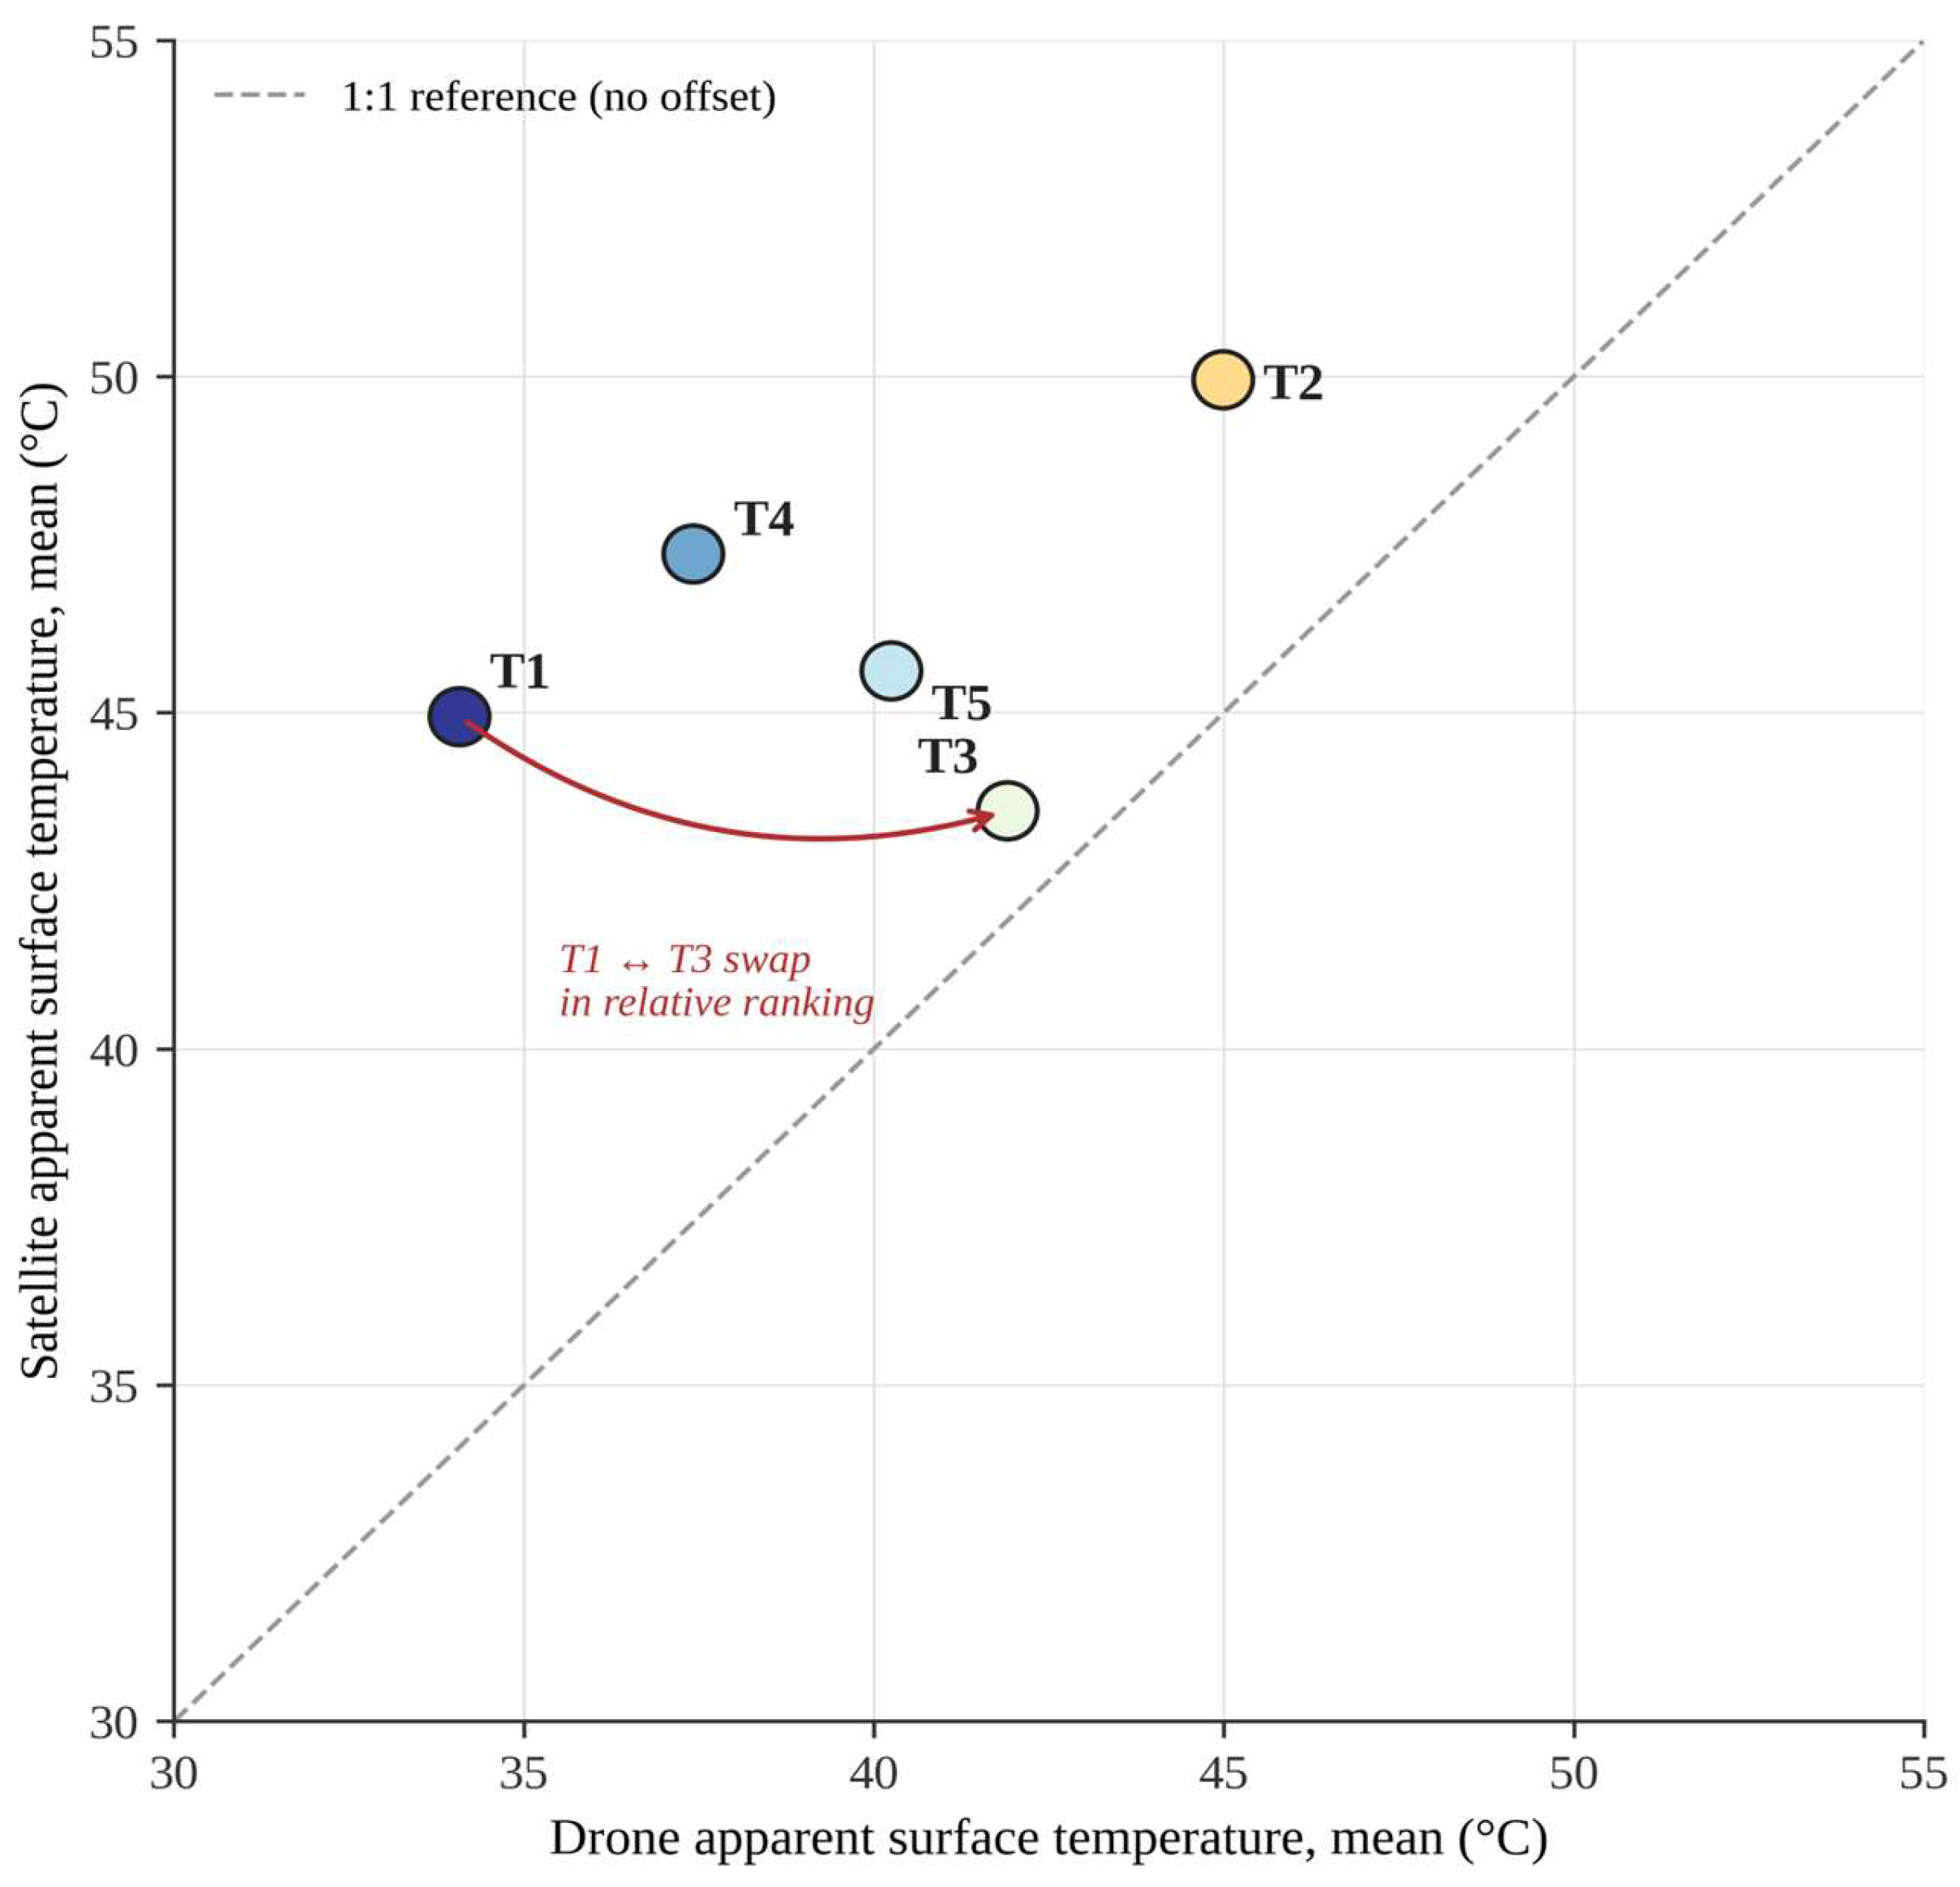
Figure 9.
Drone versus satellite minimum apparent surface temperature, footprint-on-footprint (ρ ≈ +0.50; see Table 4).
Figure 9.
Drone versus satellite minimum apparent surface temperature, footprint-on-footprint (ρ ≈ +0.50; see Table 4).
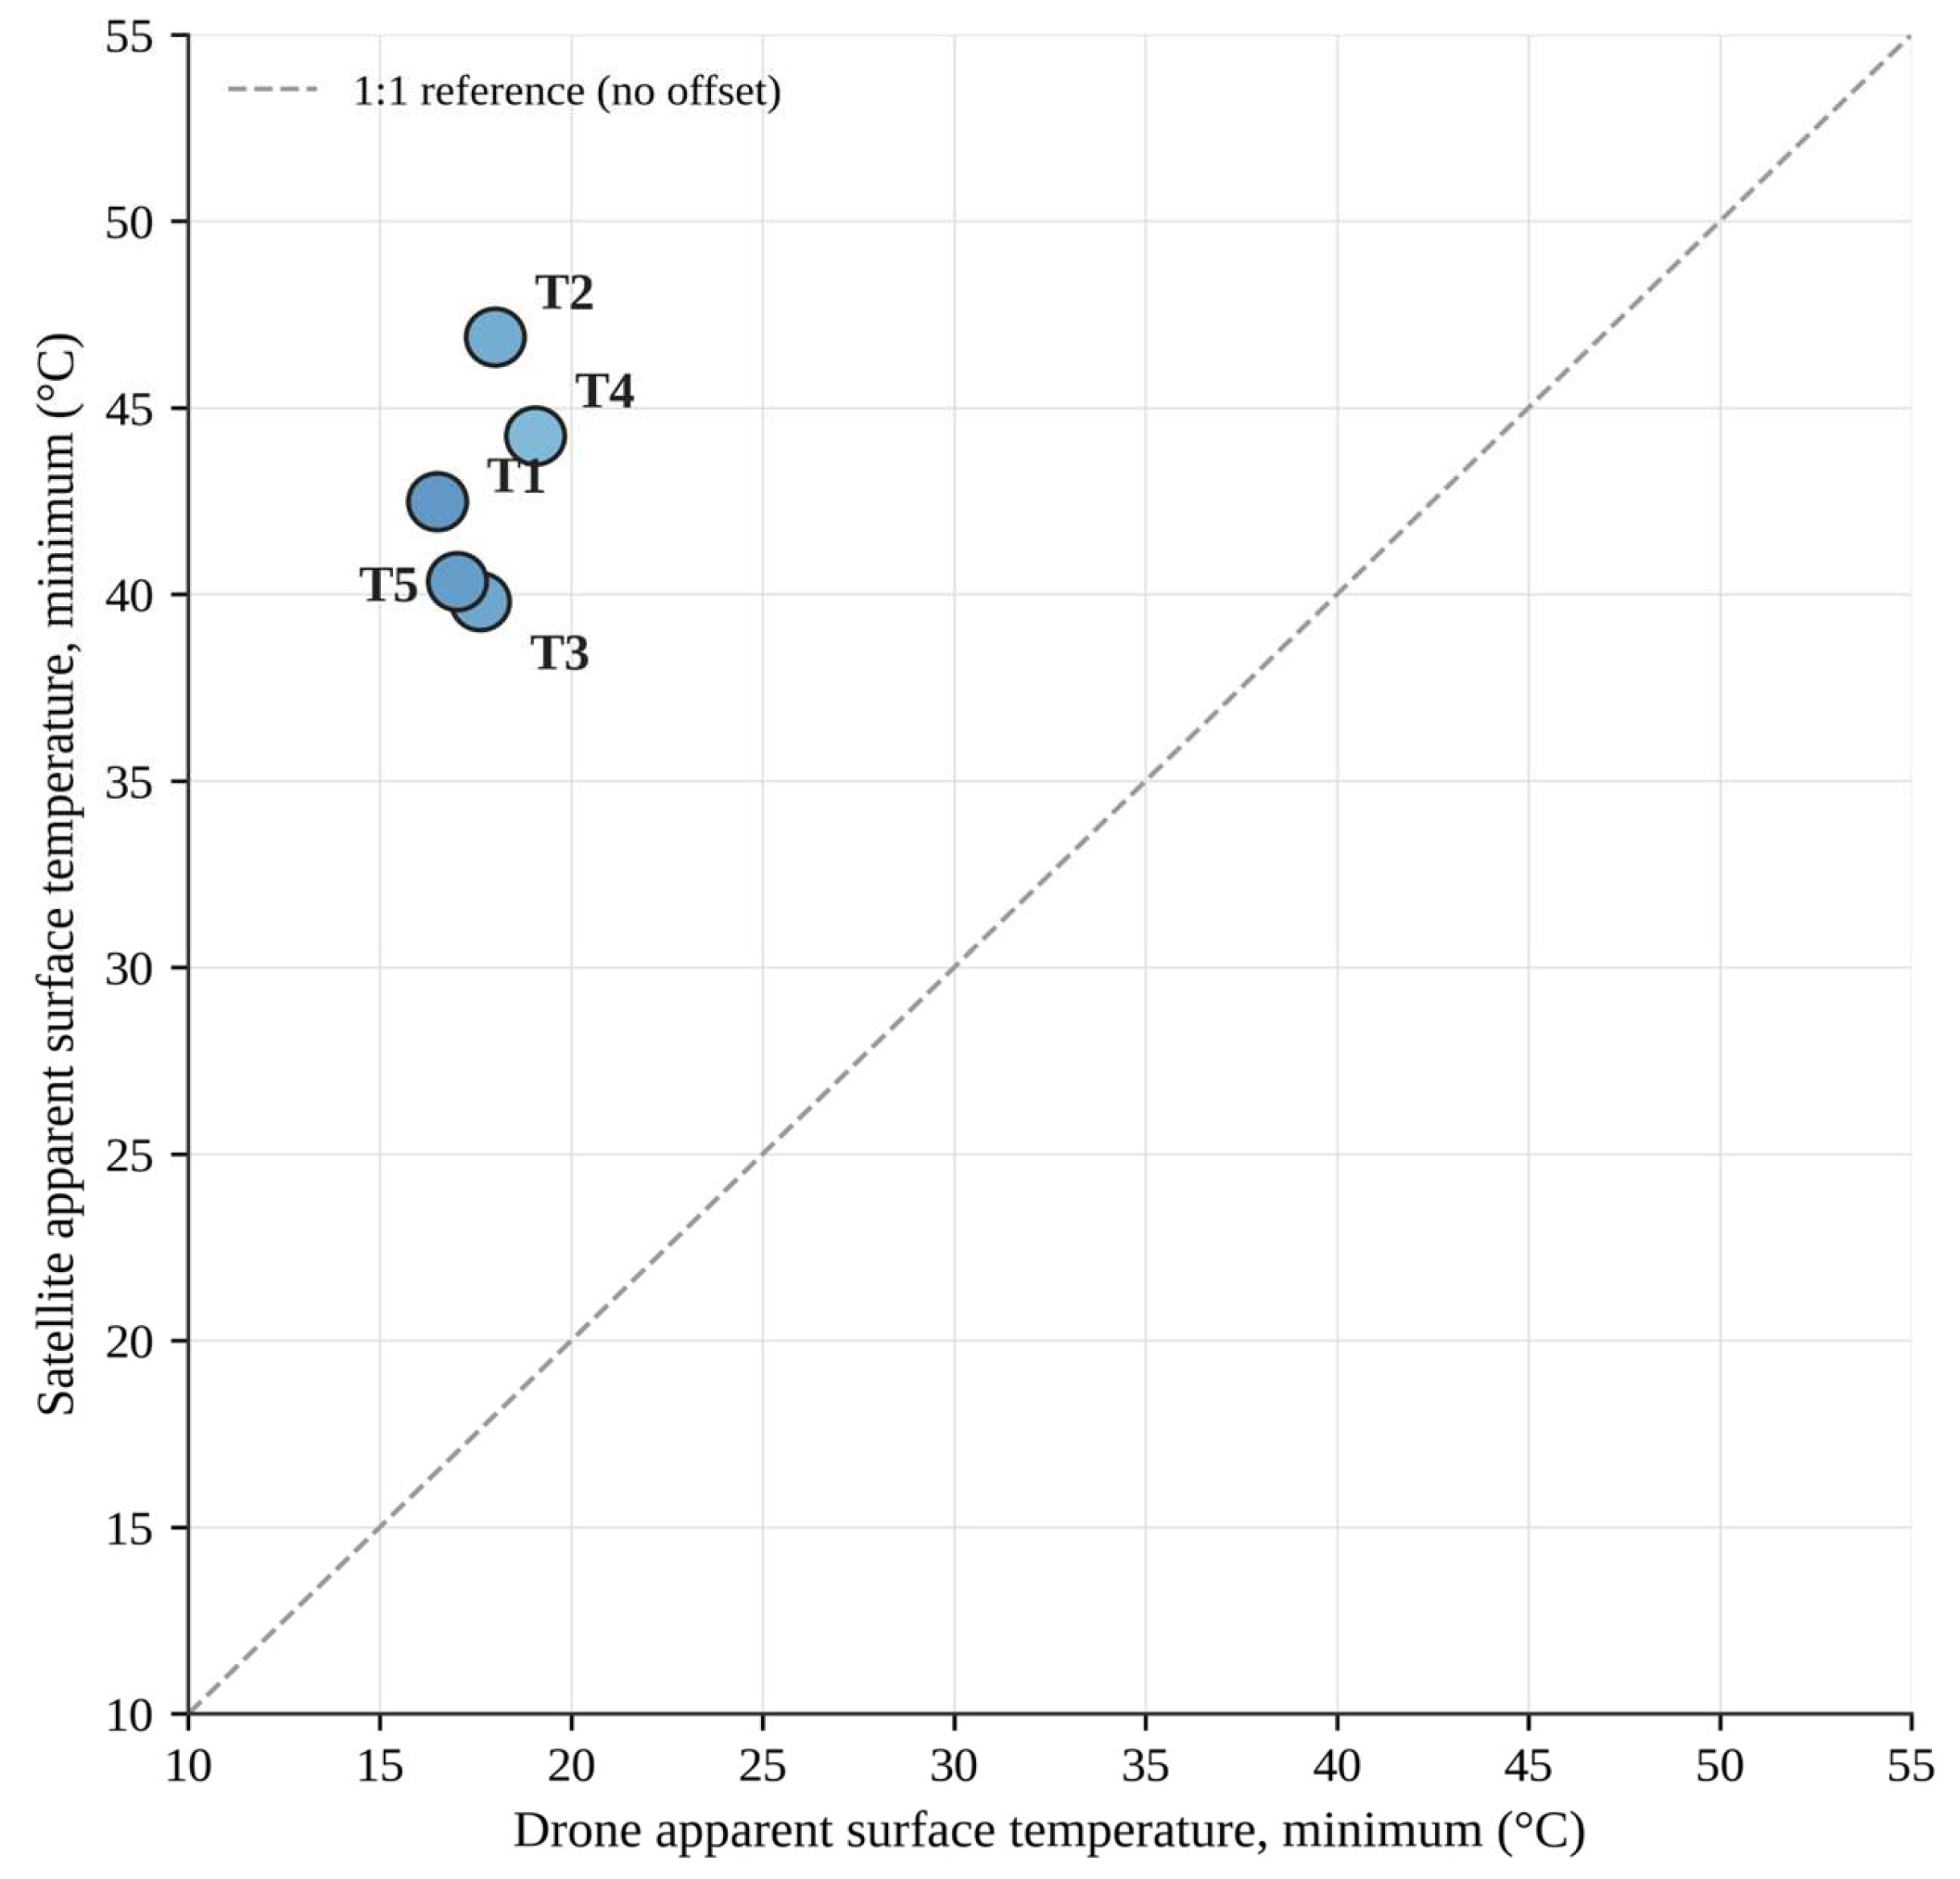
Figure 10.
Mean satellite apparent surface temperature by morphological family, with standard deviation (n = 5 patches per category; see Table 6). Categories are ordered by increasing mean temperature.
Figure 10.
Mean satellite apparent surface temperature by morphological family, with standard deviation (n = 5 patches per category; see Table 6). Categories are ordered by increasing mean temperature.
3.2. Vegetation Cover and Thermal Discontinuity
Transect 1, which crosses the urban park up to the edge of the historic core, and transect 3, which intercepts the riparian strip of the Serio, share a significant vegetation component, with a mean NDVI of 0.547 and 0.373 respectively. In both cases the tree canopy produces a local lowering of surface temperature clearly visible in the orthomosaic, with a sharp discontinuity relative to the adjacent mineral fabric. In transect 3, however, the highest standard deviation in the entire sample (10.29) indicates that this discontinuity does not produce a uniform cooling effect, but coexists with very high local peaks, attributable to the compact residential fabric on the opposite side of the transect. The maximum value recorded in this transect, 79.28 °C, appears isolated relative to the overall data distribution; at the effective resolution of the thermal sensor, about 30 cm on the ground (§ 2.2), a value of this kind is compatible with a small real object in full sunlight, for example a metal surface, rather than with a sub-pixel noise artefact. A direct visual check on the orthomosaic at native resolution nevertheless remains advisable before publication, to rule out mosaicking errors at that specific point.
3.3. Morphology and Materials Beyond Land Use
The most significant comparison for the central argument of the research emerges between transects 4 and 5, both located within the same northern production area and therefore nominally equivalent in terms of functional land use. The two transects instead show markedly different values both in mean temperature (37.42 °C versus 40.25 °C) and in the vegetation index (0.514 versus 0.405), with a gap approaching that observable between distinct functional typologies, as the comparison between the production area and the southern commercial strip (mean 44.99 °C) makes evident. This divergence within a single land-use category constitutes the most direct evidence in support of the thesis that the thermal behaviour of an urban fabric depends on its morphological and material configuration, on the porosity of open spaces, on the presence of reflective or vegetated surfaces, on the orientation and density of built volumes, rather than on the settlement function it hosts. The literature on urban morphology applied to thermal behaviour has long shown that the geometric and material properties of the fabric, more than its functional classification, constitute the main explanatory variable in the formation of local microclimatic regimes [4], an approach taken up and systematised in the Local Climate Zone classification, itself based on morphological and land-cover properties rather than functional categories [12]. The data presented here offer empirical support consistent with this approach, applied to an Italian intermediate-city context.
3.4. Comparative Summary
Overall, transect 2 (commercial strip) and transect 3 (residential and river) record the highest mean temperatures in the entire sample, but for morphologically distinct reasons: the former due to the extent and continuity of sealed mineral surfaces, the latter due to the juxtaposition between compact fabric and a water and vegetation component that introduces strong internal variability rather than a uniform mean lowering. Transect 1 is confirmed as the mildest in the entire sample, consistent with the dominance of the park’s tree cover. Transects 4 and 5, while sharing the same production function, occupy intermediate and distinct positions from one another, confirming that the functional variable alone is not sufficient to predict the thermal behaviour observed. This set of results, referring to the five areas actually sampled, provides the empirical basis on which the following discussion argues the primacy of morphology over function in reading urban thermal behaviour, leaving to Section 2.4 and to the Discussion the distinct question of how far these conditions extend to portions of the city not directly surveyed.
3.5. Satellite Verification of the Type-Morphological Inference
The results of the comparison between drone and Landsat satellite data, described in the method in § 2.4, are reported in Table 2, Table 3, Table 4 and Table 5. The footprint-on-footprint comparison (Table 2) shows a systematic upward shift in satellite values relative to drone values across all five transects, with mean differences ranging between 1.63 °C (T3) and 10.86 °C (T1). The relative ranking of the transects is not stable between the two sources: transect 2 remains the hottest in both datasets, but the position of the other four transects varies, particularly between T1 and T3, which swap position between the drone and satellite scales.
The interquartile range (Table 3) confirms the compression of internal variability in the shift from drone to satellite resolution, ranging from approximately 2.5 to 5.4 across the five transects.
The summary of rank correlations calculated on the four indicators (Table 4) shows no consistent correspondence between the ranking of the transects in the drone data and in the satellite data, on any of the four metrics tested.
The interpretation of these results, and their implications for the type-morphological inference logic, is discussed in § 2.4 and taken up again in the Discussion (§ 4.3).
3.6. Intra-Typological Satellite Consistency on Homogeneous Patches
To test whether the internal heterogeneity of the transects affected the weakness of the drone-satellite correspondence already documented in § 3.5, the comparison was repeated on twenty-five homogeneous patches approximately 50 m in diameter, distributed across five morphological families (Table 5).
The rank correlation between drone and satellite data on the seven internal patches remains weak (ρ = 0.29, p = 0.54, n = 7), confirming what was already observed at whole-transect scale. The consistency of satellite data alone across patches of the same morphological family, including those external to the transect footprints, is instead marked (Table 6): the internal standard deviation of each category never exceeds 1.3 °C, against a range of nearly 8 °C between the means of the five categories (F = 79.65, p < 0.000001).
The interpretation of these results is taken up again in § 4.3.
4. Discussion
4.1. The Primacy of Morphology over Settlement Function
The most robust result this study returns is that two portions of the city classified under the same functional category, the northern production area sampled by transects 4 and 5, can show thermal behaviour more divergent from one another than is, in some cases, the comparison between explicitly different functional categories. This finding is not an isolated anomaly to be explained away, but the empirical confirmation, in the specific context of an Italian intermediate city, of an intuition that urban climatology has long held: the explanatory variable of a fabric’s thermal behaviour is not the function it hosts, but its geometric and material configuration, the density of built volumes, the porosity of open spaces, the presence of reflective or vegetated surfaces [4]. The Local Climate Zone classification [12], which for over a decade has proposed replacing functional planning categories with morphological types as the basis for the climatic reading of the city, here finds empirical support that extends its validity to a settlement context, that of the intermediate city of the lower Po plain, in which it had not previously been verified.
This result carries an implication that exceeds the strictly climatic domain. Italian planning instruments, starting with the Piano di Governo del Territorio that also governs the case of Crema, classify urban land predominantly by land use, residential, productive, commercial, not by morphological configuration. If thermal behaviour follows morphology more than function, a planning instrument organised by function risks systematically treating as equivalent portions of the city that behave very differently thermally and failing to treat as equivalent portions of the city that instead behave similarly despite belonging to distinct functional categories.
4.2. Scalar Continuity and Anthroposphere in Reading the Results
The scalar continuity framework introduced at the outset (§ 1.3) finds in the results a second, less immediate but equally relevant order of confirmation. Transect 3, the one that crosses both the discontinuous residential fabric and the riparian strip of the Serio, shows the highest internal standard deviation in the entire sample: not a disturbance in the data, but the direct recording of what happens when two very different morphological conditions coexist within a distance of a few dozen metres. At satellite scale, or even at the scale of the transect mean alone, this transition would be lost, drowned in an aggregate value; at the scale of the anthroposphere, the layer of about two metres in which the human body actually exchanges heat with its environment [16], that transition is instead the most relevant information, because it corresponds to the real experience of someone crossing that space on foot, moving in a few steps from a compact, sun-exposed building front to a cool sub-canopy space along the river. The isolated maximum value recorded in the same transect, plausibly attributable to a single object in full sunlight (§ 3.2), is a further example of the same principle: irrelevant at aggregate scale, potentially significant for whoever occupies that specific square metre of public space on a summer afternoon. Pedestrian comfort analysis tools already developed in other Italian urban contexts [40,41] move from the same methodological premise, namely that the climatic experience of open space is not reducible to a single areal mean value, and the results presented here offer a further empirical confirmation of this, applied to the case of intermediate cities.
4.3. Limits of the Method and Open Questions
The satellite comparison, taken up and refined in § 2.4 and § 3.6, returns a picture more nuanced than an initial finding might suggest. On one hand, the direct correspondence between drone and satellite data remains weak to moderate at best and inconsistent in direction across every indicator and at every level of spatial decomposition tested, showing that the two products are not directly interchangeable because they differ in spatial resolution, radiometric processing, acquisition timing, and surface aggregation [1,3,28]. Comparable scale-dependent discrepancies have also been reported in smaller settlement contexts [42]. On the other hand, the statistically robust consistency of satellite data across patches of the same morphological family scattered at different points in the city (F = 79.65, p < 0.000001) offers solid empirical support, albeit confined to the satellite scale, for the typological classification principle underlying the entire methodological framework of this study. This result makes plausible, without demonstrating it conclusively, the hypothesis that the same consistency is reproduced also at UAV resolution at points of the city not directly surveyed and shifts the burden of proof from a general question, whether type-morphological analogy inference is well founded, to a more circumscribed and operationally defined one, whether the consistency already demonstrated at satellite scale is maintained also at the finer UAV scale. The systematic discrepancies between the two sources should therefore not be read as an objection to the classification principle, but as the reason why a fine-grained survey remains necessary even at the sampling stage, since the satellite can confirm the consistent existence of morphological categories without being able to measure their actual thermal behaviour at pedestrian scale.
A second limitation concerns the nature of the case study. Crema is treated here as a single case, chosen for its settlement condition representative of Italia di mezzo (§ 1.2), but a study of a single city does not allow distinguishing how much of the observed patterns is generalisable to the Italian intermediate settlement belt as a whole and how much is instead specific to Crema’s hydrogeomorphological and settlement configuration. A third, instrumental limitation concerns the lack of absolute radiometric calibration of the UAV thermal data (§ 2.3), which requires treating all values discussed here as apparent surface temperature, suitable for comparing relative gradients but not for strict metrological use.
4.4. Implications for the Design of Intermediate Cities
Despite these limitations, the overall set of results converges on an operational indication that we consider robust. Urban climate adaptation policies, whose urgency is now recognised at the global scale [43], cannot be based solely on continuous territorial-coverage cartography, whether satellite-derived or from regional climate models, when the goal is an intervention calibrated on the specific morphological configuration of an urban fabric. For cities in the Italian intermediate settlement belt, which typically lack the technical and financial resources for systematic thermal monitoring of the entire municipal territory, a targeted survey protocol such as the one described here, applied to a limited number of transects representative of the main morphological conditions present, constitutes a diagnostic tool proportionate to the scale and resources typical of these administrative contexts.
The result on the production transects deserves specific attention in this respect. Urban forestation and heat mitigation policies tend to concentrate on residential and central public spaces, leaving production areas at the margins of design attention. The results presented here suggest that precisely in these areas, where internal variability can be as wide as that between different functional typologies, targeted interventions on material configuration, permeable surfaces, reflective coverings, and interstitial vegetation could produce significant thermal benefits, with a knock-on effect also on environmental equity: production areas are daily workplaces for a share of the population often given little consideration in climate adaptation policies centred on residential public space, and their heat exposure remains largely under-documented [44].
5. Conclusions
The results presented here support, within the limits of the five areas sampled, the hypothesis from which the article moves: the thermal behaviour of intermediate urban fabric depends predominantly on its morphological and material configuration, rather than on the functional land use it hosts. The most direct evidence in this sense emerges from the comparison between the two production transects, which, despite sharing the same land-use category, show internal variability close to that observable between distinct functional typologies, empirical support consistent with the approach already proposed by the Local Climate Zone classification [12] and here verified in an Italian intermediate-city context.
The thermal transect method, understood as a high-resolution diagnostic probe of a representative morphological condition, is proposed as a tool capable of returning the material and formal detail that continuous territorial-coverage sources, by their nature, cannot capture. The logic that motivated the choice of this sampling design, reading a limited number of typical situations in depth and then referring, by morphological analogy, the conditions of portions of the city not directly surveyed back to them, finds in this study an initial favourable indication: the attempt at cross-verification with satellite data, described in § 2.4, did not return a consistent direct correspondence between the ranking of transects at drone scale and at satellite scale, but the internal consistency of satellite data across patches of the same morphological family scattered across the city (§ 3.6) offers solid evidence, albeit confined to the satellite scale, in support of the typological classification principle on which the method is based.
The satellite comparison offers a useful interpretive contribution on two distinct levels precisely because of this. On one hand it confirms that Landsat data, while not allowing an assessment of the thermal condition experienced by a body at pedestrian scale, returns an order of magnitude of the phenomenon at urban scale and a consistent typological classification. On the other hand, it shows why fine-grained survey nonetheless remains necessary: the satellite can confirm that morphological categories exist and behave differently from one another but cannot measure their actual thermal behaviour at the scale of the body. This suggests a complementarity between the two sources rather than their interchangeability: the satellite as a preliminary identification tool, at regional or city scale, of the areas and morphological families worth investigating further, and UAV survey as the only tool able to return the resolution needed for a climate adaptation intervention genuinely calibrated on local morphological configuration.
For cities in the Italian intermediate settlement belt, which remain at the margins of scientific production on urban climate adaptation despite constituting the prevailing settlement condition [8], these results suggest that heat mitigation policies cannot be based solely on satellite-resolution cartography, but require a level of morphological detail achievable only through targeted surveys, even if conducted on a limited number of carefully selected representative situations subjected to a first consistency check such as the one proposed here.
Three research directions remain open following this work. The first concerns direct verification, through new UAV campaigns on the eighteen patches identified here only by satellite or through fixed sensor networks at canopy height, of whether the intra-typological consistency already demonstrated at satellite scale (§ 3.6) is reproduced at drone resolution: a systematic experimental design on a large sample would allow direct empirical testing of the type-morphological analogy extension hypothesis that found an initial, partial favourable indication in this study. The second concerns extending the multiscale comparison to a larger number of intermediate cities, to verify whether the picture outlined here for Crema is generalisable beyond the single case. The third concerns the construction of a systematic typological zoning of the entire municipal territory, exportable to other settlement systems, that explicitly maps the sampled morphological families onto their actual distribution within the urban fabric: a cartographic tool that, currently absent, would constitute the indispensable basis for systematically extending type-morphological analogy inference to the urban scale, as it is only asserted here, and for subjecting it to systematic rather than sporadic empirical verification.
Author Contributions
Conceptualization, E.D.; methodology, E.D. and A.G.; formal analysis, E.D., A.G., C.D.R. and L.V.; investigation, C.D.R. and L.V.; data curation, C.D.R. and L.V.; Visualization, A.G.; writing—original draft preparation, E.D. (all sections except Section 2.1, Section 2.2 and Section 2.3), A.G., C.D.R. and L.V. (Section 2.1, Section 2.2 and Section 2.3); writing—review and editing, E.D. All authors have read and agreed to the published version of the manuscript.
Funding
This research received no external funding.
Data Availability Statement
The original data presented in this study are openly available in Zenodo at https://doi.org/10.5281/zenodo.22057512.
Acknowledgments
The authors thank the participants of the HOT (Healing Our Towns) summer school, held within the IDEA League and GRINS PNRR research group, for the collaborative context in which the fieldwork underlying this study was developed.
Conflicts of Interest
The authors declare no conflicts of interest.
References
- Oke, T.R. The energetic basis of the urban heat island. Q. J. R. Meteorol. Soc. 1982, 108, 1–24. [Google Scholar] [CrossRef]
- Oke, T.R. Boundary Layer Climates, 2nd ed.; Routledge: London, UK, 1987. [Google Scholar]
- Oke, T.R.; Mills, G.; Christen, A.; Voogt, J.A. Urban Climates; Cambridge University Press: Cambridge, UK, 2017. [Google Scholar]
- Arnfield, A.J. Two decades of urban climate research: a review of turbulence, exchanges of energy and water, and the urban heat island. Int. J. Climatol. 2003, 23, 1–26. [Google Scholar] [CrossRef]
- Zendeli, D.; Colaninno, N.; van Esch, M.; Eldesoky, A.H.; Morello, E.; van Timmeren, A. Urban heat stress and health: a systematic literature review of dimensions and indicators for planning and design. Health Place 2026, 99, 103643. [Google Scholar] [CrossRef] [PubMed]
- Zwolska, A.; Półrolniczak, M.; Kolendowicz, L. Urban growth’s implications on land surface temperature in a medium-sized European city based on LCZ classification. Sci. Rep. 2024, 14, 1–14. [Google Scholar] [CrossRef] [PubMed]
- Kalogeropoulos, G.; Dimoudi, A.; Toumboulidis, P.; Zoras, S. Urban Heat Island and Thermal Comfort Assessment in a Medium-Sized Mediterranean City. Atmosphere 2022, 13, 1102. [Google Scholar] [CrossRef]
- Lanzani, A. (Ed.) Italia di Mezzo. Prospettive per la Provincia in Transizione; Donzelli: Roma, Italy, 2024. [Google Scholar]
- Curci, F.; Ricchiuto, G. Esercizi di approssimazione all’Italia di mezzo. In Italia di Mezzo. Prospettive per la Provincia in Transizione; Lanzani, A., Ed.; Donzelli: Roma, Italy, 2024; pp. 41–56. [Google Scholar]
- Colaninno, N. A multiscale outlook of the heat islands phenomenon in the Milan area. Territorio 2024, 108–109, 261–272. [Google Scholar] [CrossRef]
- Ballester, J.; Quijal-Zamorano, M.; Méndez Turrubiates, R.F.; Pegenaute, F.; Herrmann, F.R.; Robine, J.M.; Basagaña, X.; Tonne, C.; Antó, J.M.; Achebak, H. Heat-related mortality in Europe during the summer of. Nat. Med. 2023, 29, 1857–1866. [Google Scholar] [CrossRef] [PubMed]
- Stewart, I.D.; Oke, T.R. Local Climate Zones for urban temperature studies. Bull. Am. Meteorol. Soc. 2012, 93, 1879–1900. [Google Scholar] [CrossRef]
- Esposito, A.; Grulois, M.; Pappaccogli, G.; Palusci, O.; Donateo, A.; Salizzoni, P.; Santiago, J.L.; Martilli, A.; Maffeis, G.; Buccolieri, R. On the Calculation of Urban Morphological Parameters Using GIS: An Application to Italian Cities. Atmosphere 2023, 14, 329. [Google Scholar] [CrossRef]
- Ratti, C.; Baker, N.; Steemers, K. Energy consumption and urban texture. Energy Build. 2005, 37, 762–776. [Google Scholar] [CrossRef]
- Givoni, B. Climate Considerations in Building and Urban Design; Van Nostrand Reinhold: New York, NY, USA, 1998. [Google Scholar]
- Fleming, J.R.; Jankovic, V. Revisiting Klima. Osiris 2011, 26, 1–15. [Google Scholar] [CrossRef] [PubMed]
- Secchi, B. Prima Lezione di Urbanistica; Laterza: Roma-Bari, Italy, 2000. [Google Scholar]
- Caniggia, G.; Maffei, G.L. Composizione Architettonica e Tipologia Edilizia. Lettura dell’Edilizia di Base; Marsilio: Venezia, Italy, 1979. [Google Scholar]
- Moudon, A.V. Urban morphology as an emerging interdisciplinary field. Urban Morphol. 1997, 1, 3–10. [Google Scholar] [CrossRef]
- Martinez-Soto, A.; Vera-Fonseca, M.; Valenzuela-Toledo, P.; Melillan-Raguileo, A. Heat on the Move: Contrasting Mobile and Fixed Insights into Temuco’s Urban Heat Islands. Sensors 2025, 25, 1251. [Google Scholar] [CrossRef] [PubMed]
- Nex, F.; et al. UAV in the advent of the twenties: Where we stand and what is next. ISPRS J. Photogramm. Remote Sens. 2022, 184, 215–242. [Google Scholar] [CrossRef]
- Manfreda, S.; et al. On the Use of Unmanned Aerial Systems for Environmental Monitoring. Remote Sens. 2018, 10, 641. [Google Scholar] [CrossRef]
- Tmušić, G.; et al. Current Practices in UAS-Based Environmental Monitoring. Remote Sens. 2020, 12, 1001. [Google Scholar] [CrossRef]
- Štroner, M.; et al. Photogrammetry Using UAV-Mounted GNSS RTK: Georeferencing Strategies without GCPs. Remote Sens. 2021, 13, 1336. [Google Scholar] [CrossRef]
- Aasen, H.; et al. Quantitative Remote Sensing at Ultra-High Resolution with UAV Spectroscopy. Remote Sens. 2018, 10, 1091. [Google Scholar] [CrossRef]
- de Castro, A.I.; et al. UAVs for Vegetation Monitoring: Overview and Recent Scientific Contributions. Remote Sens. 2021, 13, 2139. [Google Scholar] [CrossRef]
- Hartling, S.; et al. Urban Tree Species Classification Using UAV-Based Multi-Sensor Data Fusion and Machine Learning. GISci. Remote Sens. 2021, 58, 1250–1275. [Google Scholar] [CrossRef]
- Kim, D.; Yu, J.; Yoon, J.; Jeon, S.; Son, S. Comparison of Accuracy of Surface Temperature Images from Unmanned Aerial Vehicle and Satellite for Precise Thermal Environment Monitoring of Urban Parks Using in Situ Data. Remote Sens. 2021, 13, 1977. [Google Scholar] [CrossRef]
- Henn, K.A.; Peduzzi, A. Surface Heat Monitoring with High-Resolution UAV Thermal Imaging. Remote Sens. 2024, 16, 930. [Google Scholar] [CrossRef]
- Messina, G.; Modica, G. Applications of UAV Thermal Imagery in Precision Agriculture. Remote Sens. 2020, 12, 1491. [Google Scholar] [CrossRef]
- Li, S.; et al. Effectiveness of Potential Strategies to Mitigate Surface Urban Heat Island. Sustain. Cities Soc. 2024, 113, 105716. [Google Scholar] [CrossRef]
- Cao, S.; et al. Radiometric Calibration Assessments for UAS-Borne Multispectral Cameras. ISPRS J. Photogramm. Remote Sens. 2019, 149, 132–145. [Google Scholar] [CrossRef]
- Daniels, L.; et al. Identifying the Optimal Radiometric Calibration Method for UAV-Based Multispectral Imaging. Remote Sens. 2023, 15, 2909. [Google Scholar] [CrossRef]
- Zhu, H.; et al. Assessing Radiometric Calibration Methods for Multispectral UAV Imagery. Comput. Electron. Agric. 2024, 219, 108821. [Google Scholar] [CrossRef]
- Jiang, S.; et al. Efficient structure from motion for large-scale UAV images. ISPRS J. Photogramm. Remote Sens. 2020, 167, 230–251. [Google Scholar] [CrossRef]
- Stöcker, C.; et al. High-Quality UAV-Based Orthophotos for Cadastral Mapping. Remote Sens. 2020, 12, 3625. [Google Scholar] [CrossRef]
- Kalacska, M.; et al. Accuracy of 3D Landscape Reconstruction without Ground Control Points Using Different UAS Platforms. Drones 2020, 4, 13. [Google Scholar] [CrossRef]
- Wang, Z.; et al. Removing Temperature Drift and Temporal Variation in Thermal Infrared Images of a UAV Uncooled Thermal Infrared Imager. ISPRS J. Photogramm. Remote Sens. 2023, 203, 392–411. [Google Scholar] [CrossRef]
- Naughton, J.; McDonald, W. Evaluating the Variability of Urban Land Surface Temperatures Using Drone Observations. Remote Sens. 2019, 11, 1722. [Google Scholar] [CrossRef]
- Santucci, D. Urban Microclimate Spatiotemporal Mapping: A Method to Evaluate Thermal Comfort Availability in Urban Ecosystems. In Informed Urban Environments; Chokhachian, A., Hensel, M.U., Perini, K., Eds.; The Urban Book Series: Cham, Switzerland; Springer, 2022. [Google Scholar]
- Basu, R.; Colaninno, N.; Alhassan, A.; Sevtsuk, A. Hot and bothered: exploring the effect of heat on pedestrian route choice behaviour and accessibility. Cities 2024, 105435. [Google Scholar] [CrossRef]
- Ichim, P.; Miron, R.; Corocăescu, A.-C.; Crețu, C.-Ș.; Sfîcă, L. Land use as key element for urban heat island inception in small cities. Case study: Bârlad City, Romania. Present Environ. Sustain. Dev. 2024, 18, 79–94. [Google Scholar] [CrossRef]
- IPCC. Climate Change 2022: Impacts, Adaptation and Vulnerability; Contribution of Working Group II to the Sixth Assessment Report of the Intergovernmental Panel on Climate Change; Cambridge University Press: Cambridge, UK; New York, NY, USA, 2022. [Google Scholar]
- Hatvani-Kovacs, G.; Belusko, M.; Pockett, J.; Boland, J. Can the Excess Heat Factor indicate heatwave-related morbidity? A case study in Adelaide, South Australia. EcoHealth 2016, 13, 100–110. [Google Scholar] [CrossRef] [PubMed]
Figure 1.
DJI Matrice 300 RTK multirotor and a first-generation MicaSense Altum camera.
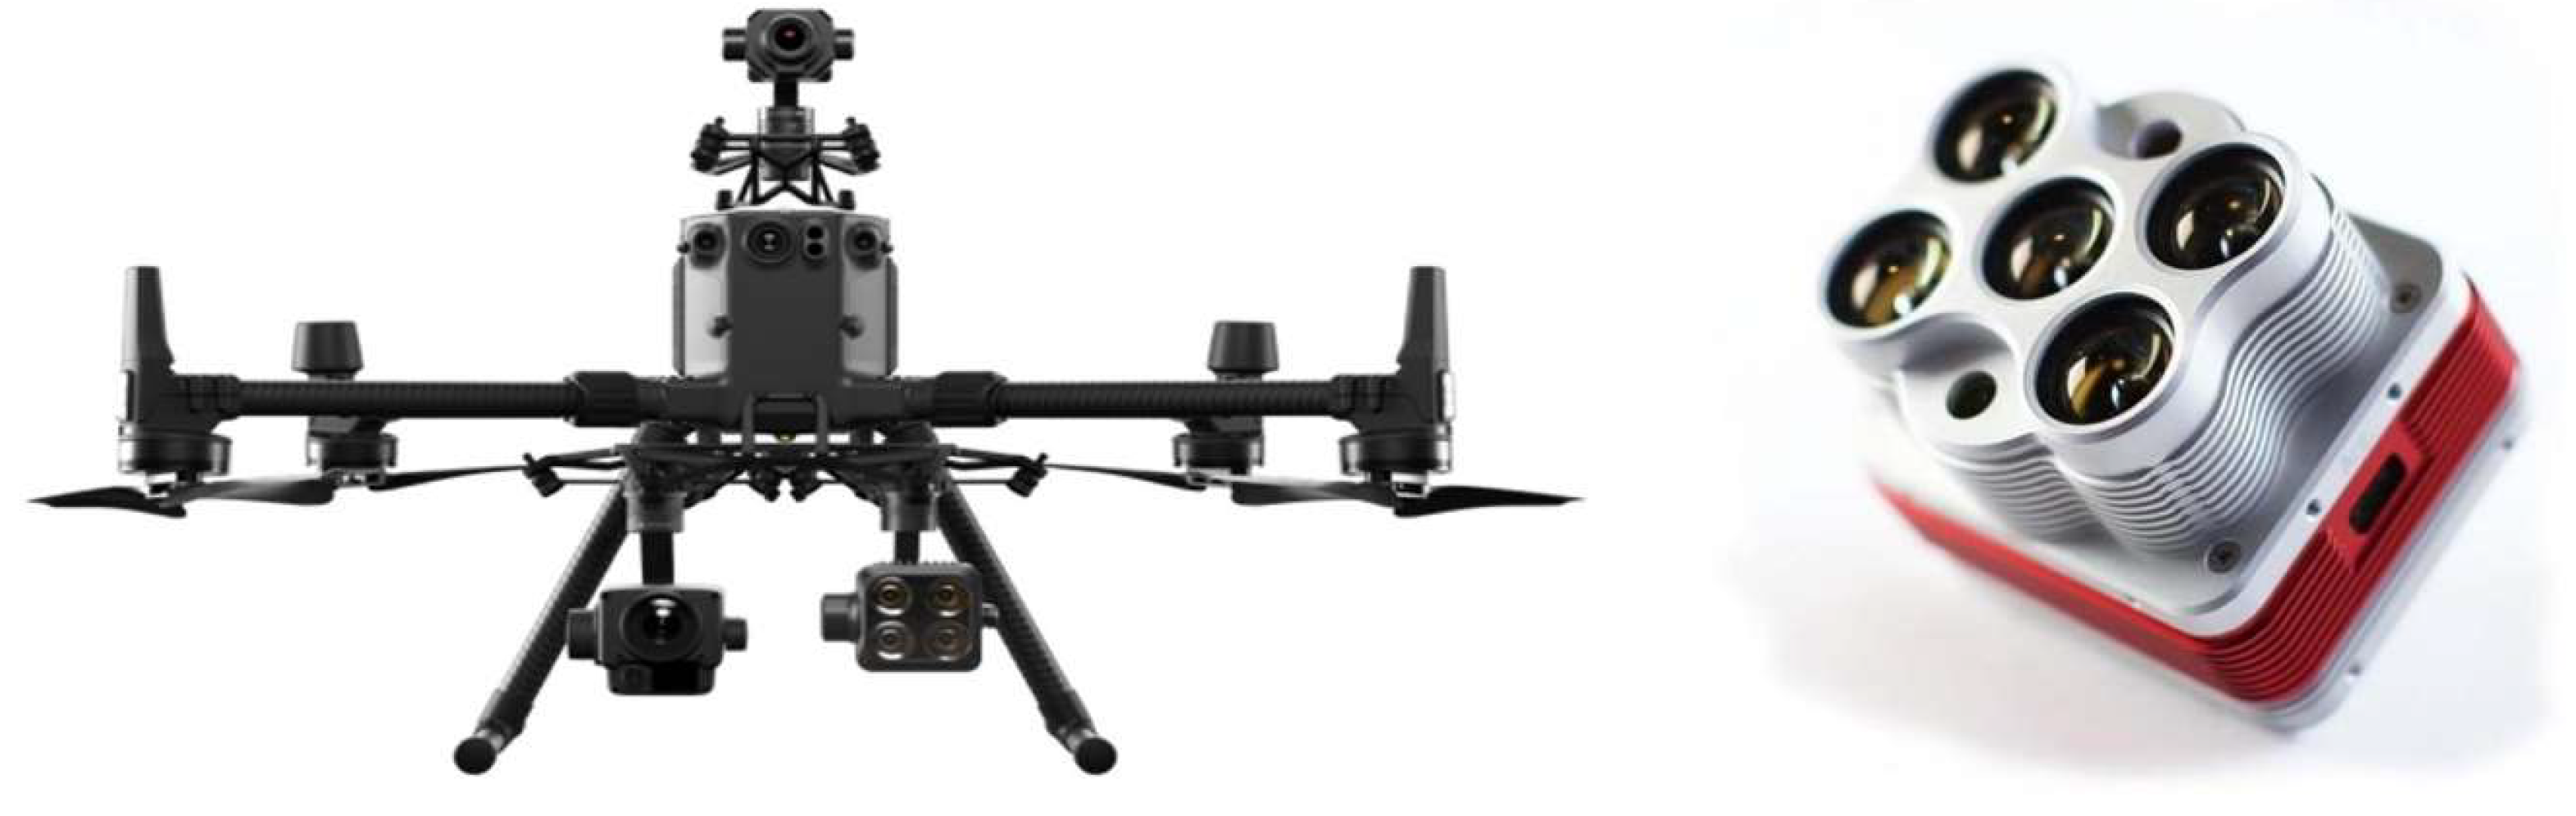
Figure 2.
Multispectral channels acquired by the Altum sensor].
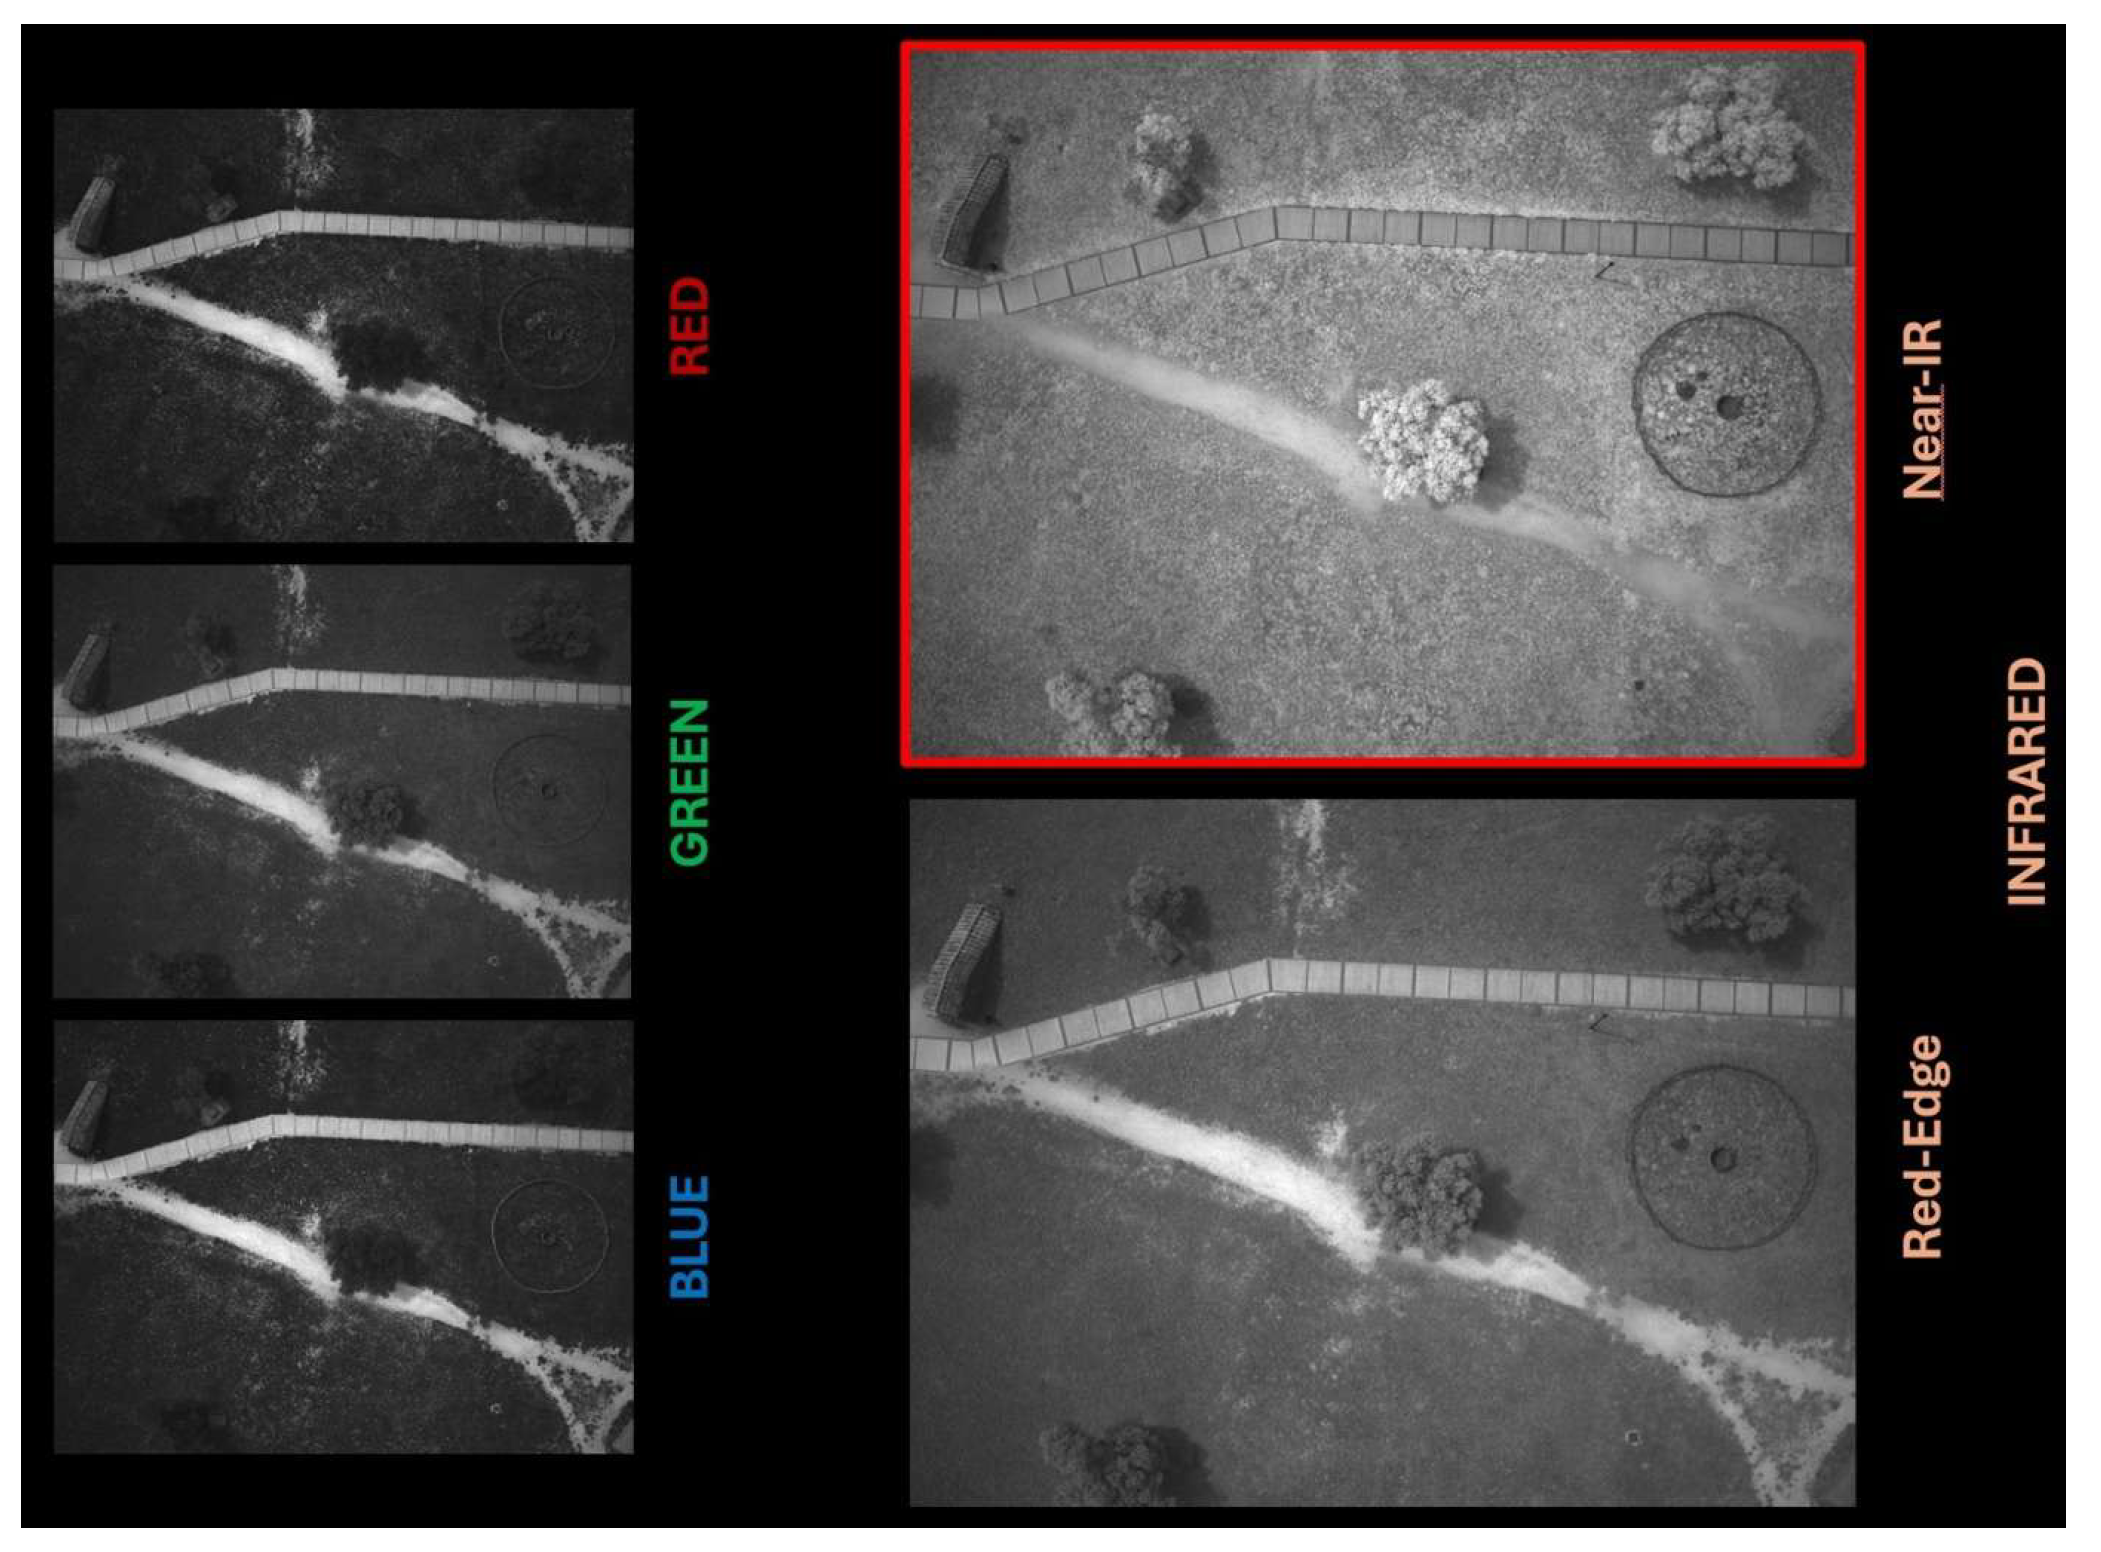
Figure 3.
Location of the five thermal transects in Crema (T1–T5) and of the twenty-five morphological verification patches used in §2.4 and §3.6, colour-coded by transect and by patch typology (see legend).
Figure 3.
Location of the five thermal transects in Crema (T1–T5) and of the twenty-five morphological verification patches used in §2.4 and §3.6, colour-coded by transect and by patch typology (see legend).
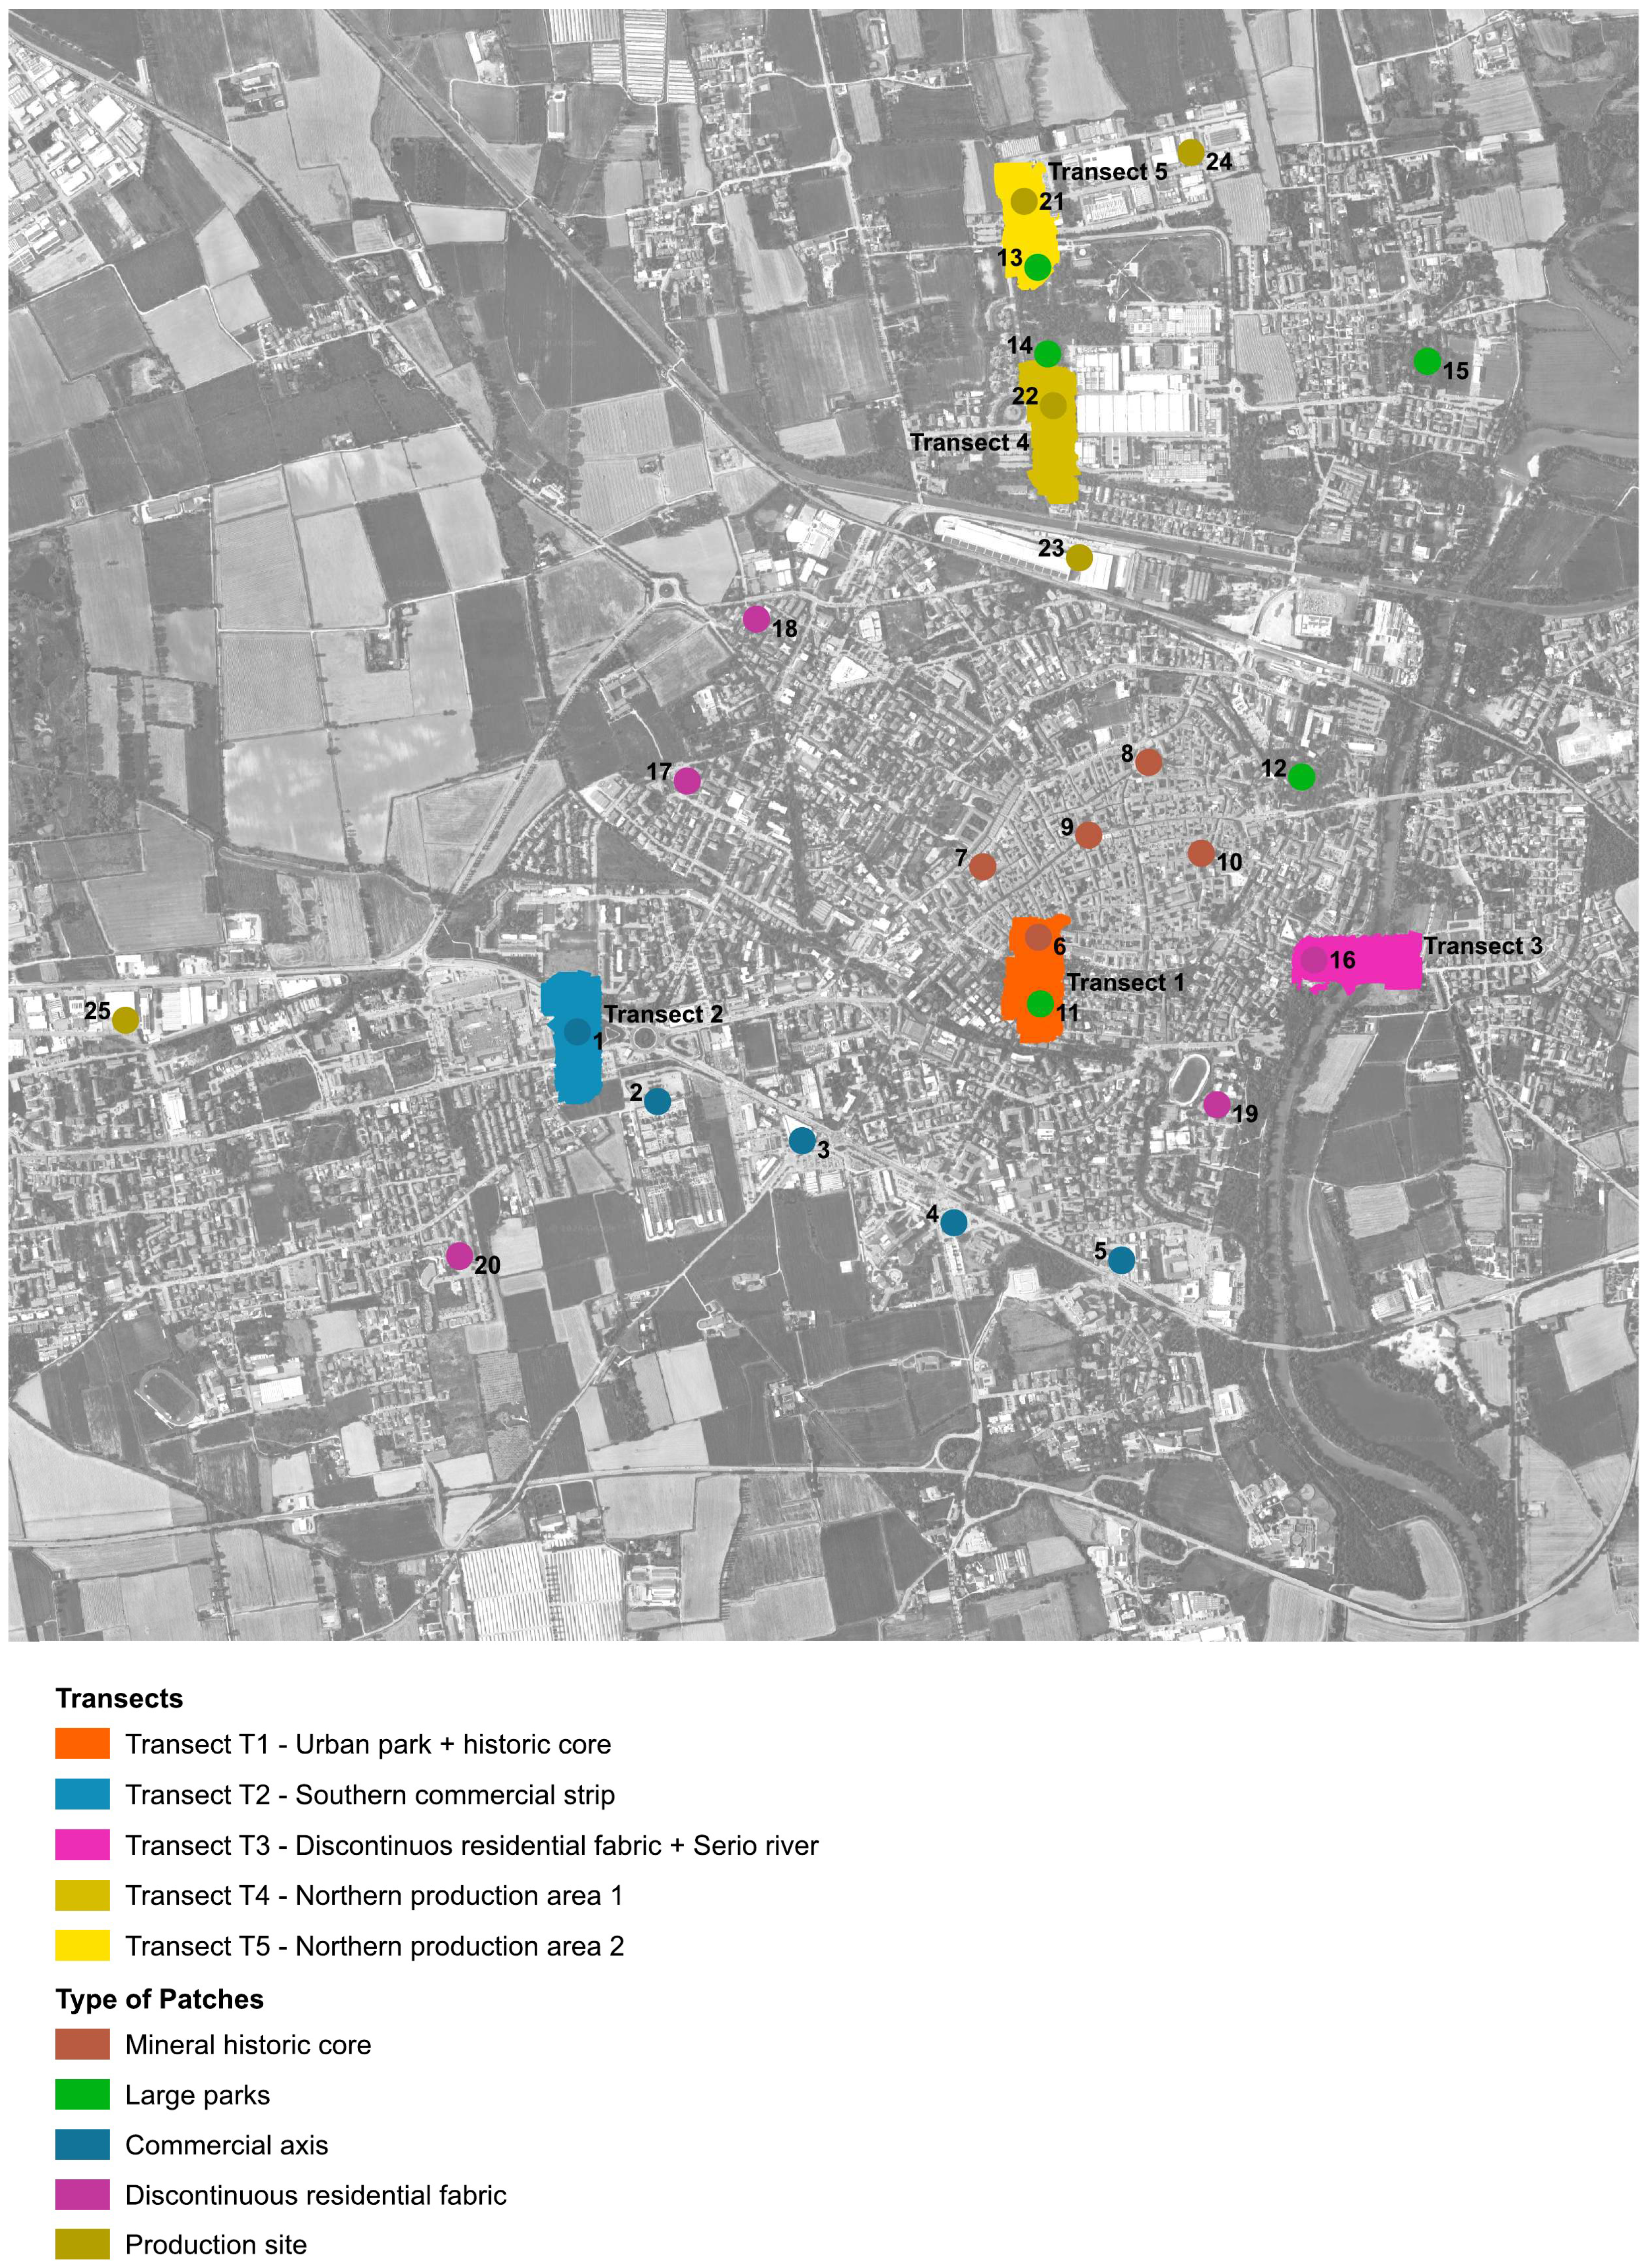
Figure 5.
NDVI orthomosaics of the five thermal transects (T1–T5), 26 June 2025.
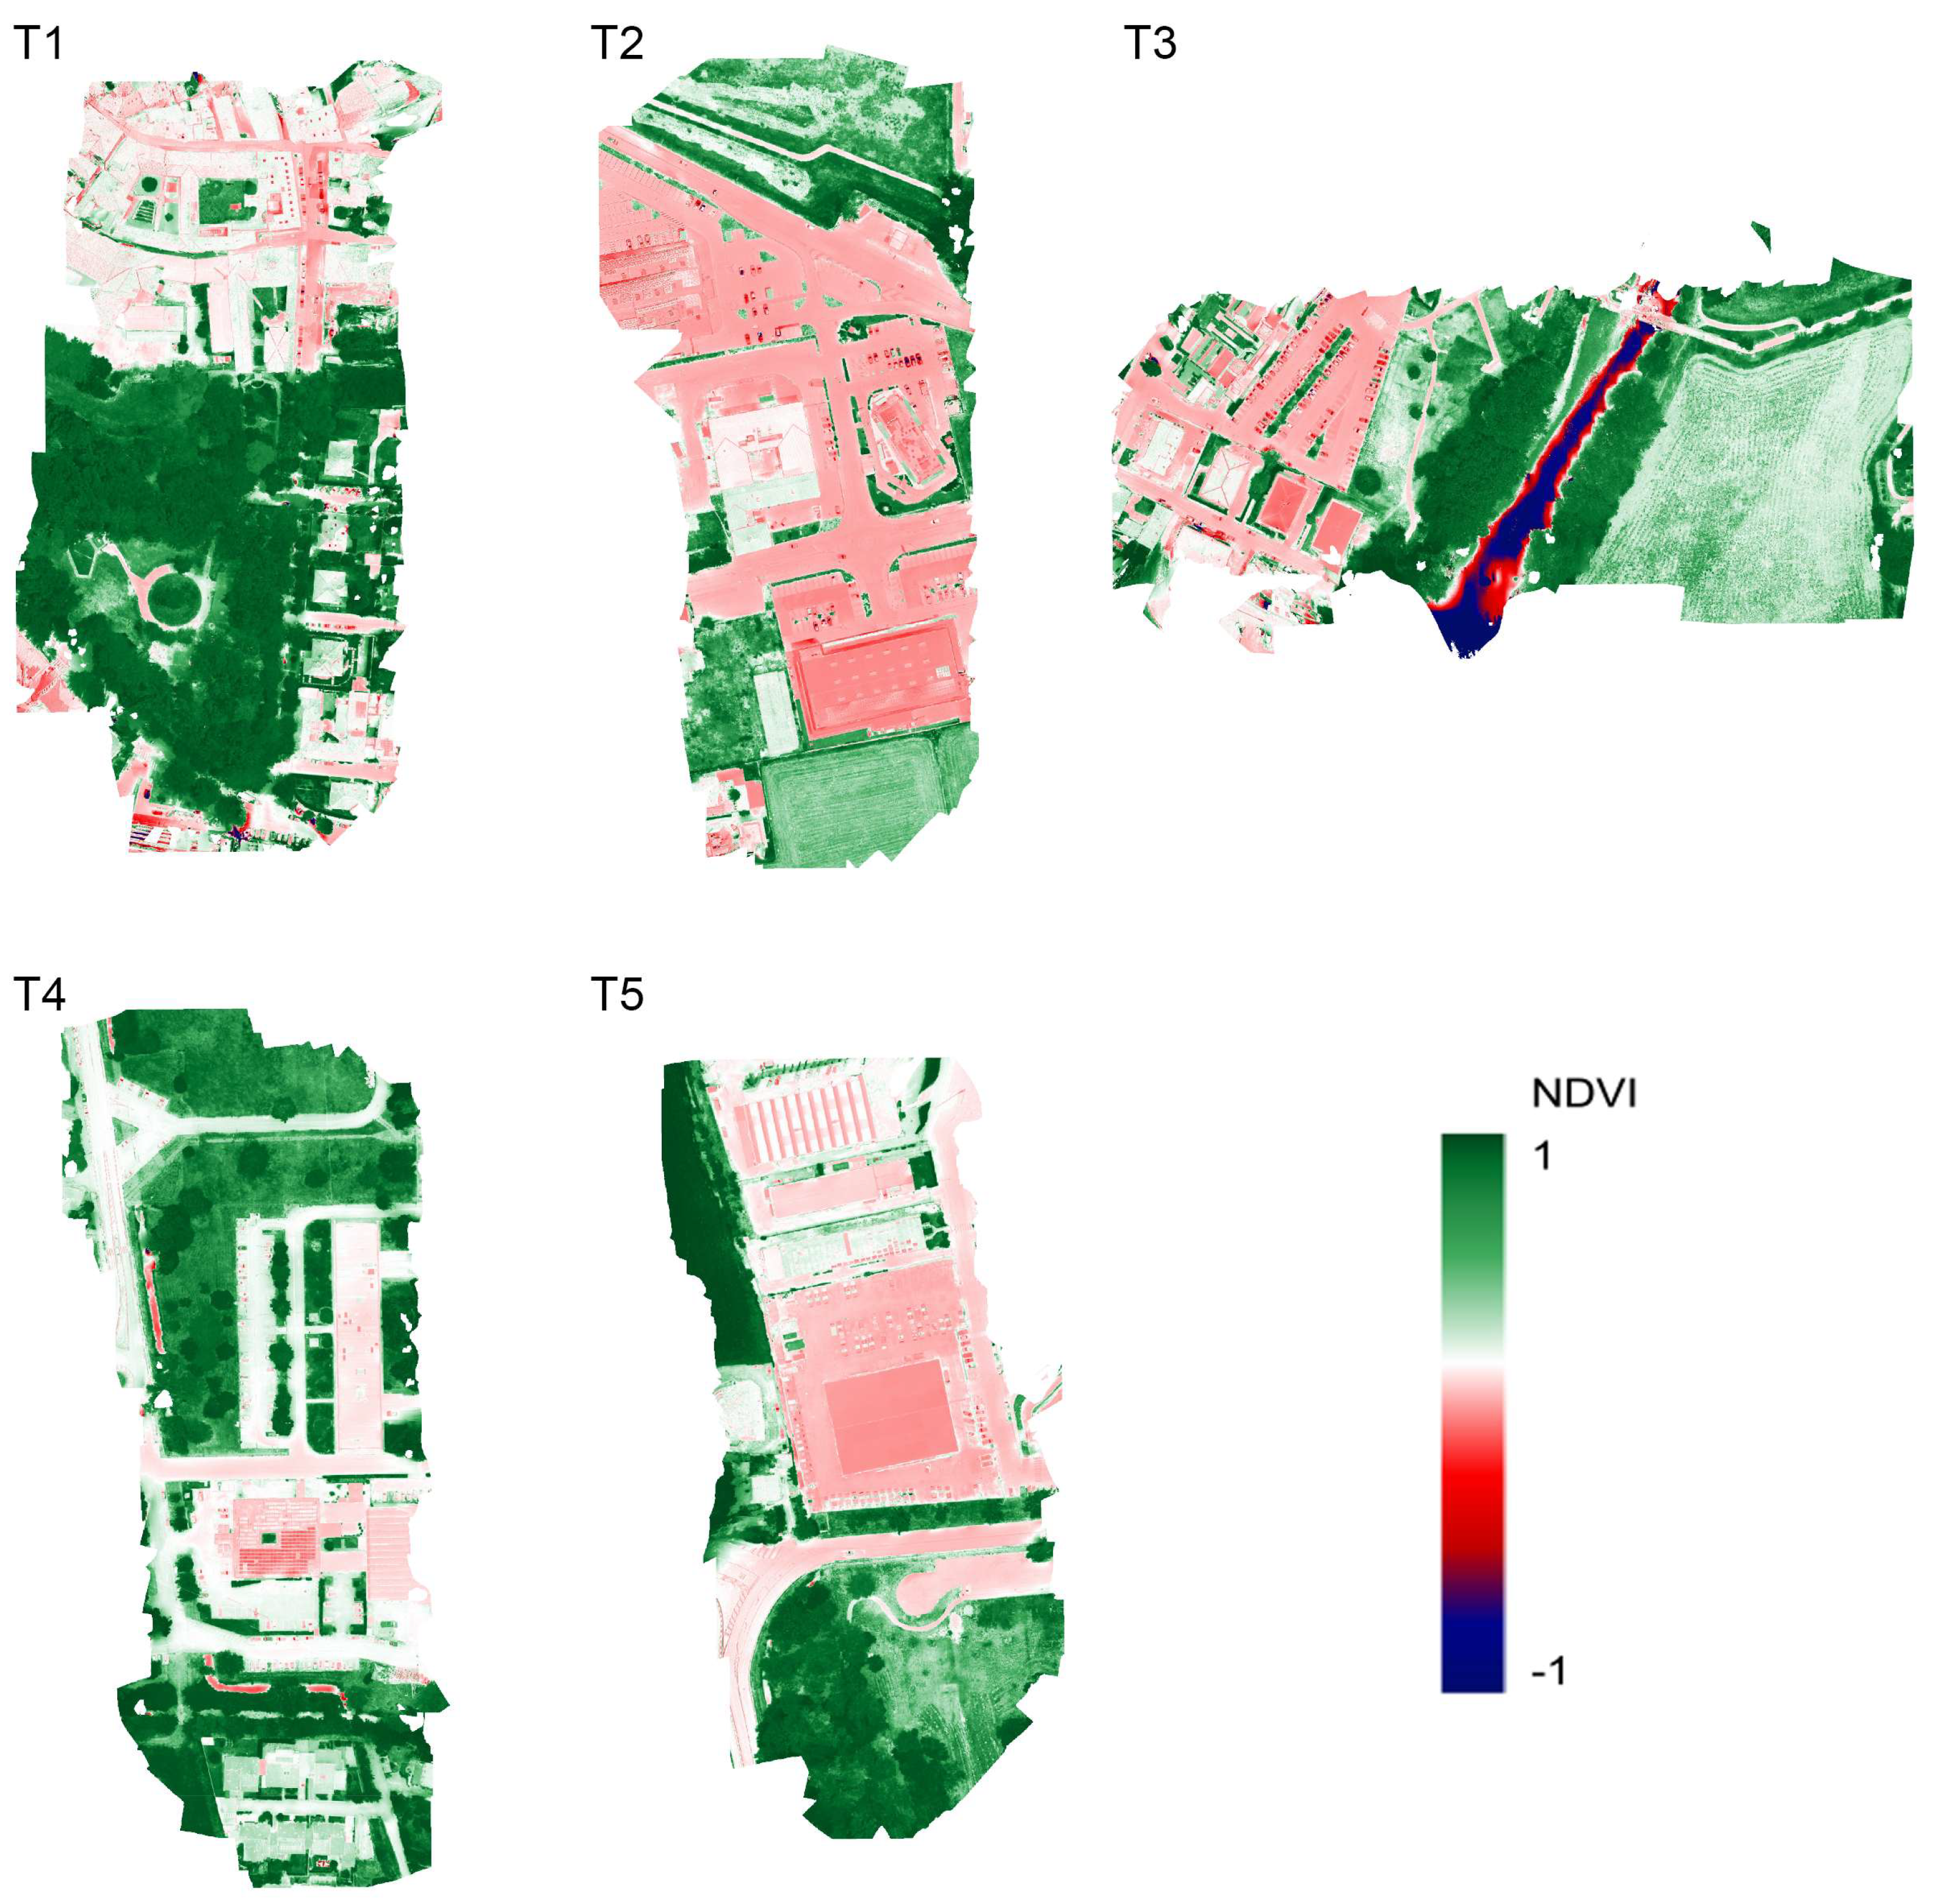
Figure 6.
UAV-derived apparent surface temperature orthomosaics of the five thermal transects (T1–T5), 26 June 2025. Native sensor resolution ≈0.30–0.31 m/pixel. Maps are displayed on a common 20–70 °C colour scale; values outside this range are clipped for visualisation.
Figure 6.
UAV-derived apparent surface temperature orthomosaics of the five thermal transects (T1–T5), 26 June 2025. Native sensor resolution ≈0.30–0.31 m/pixel. Maps are displayed on a common 20–70 °C colour scale; values outside this range are clipped for visualisation.
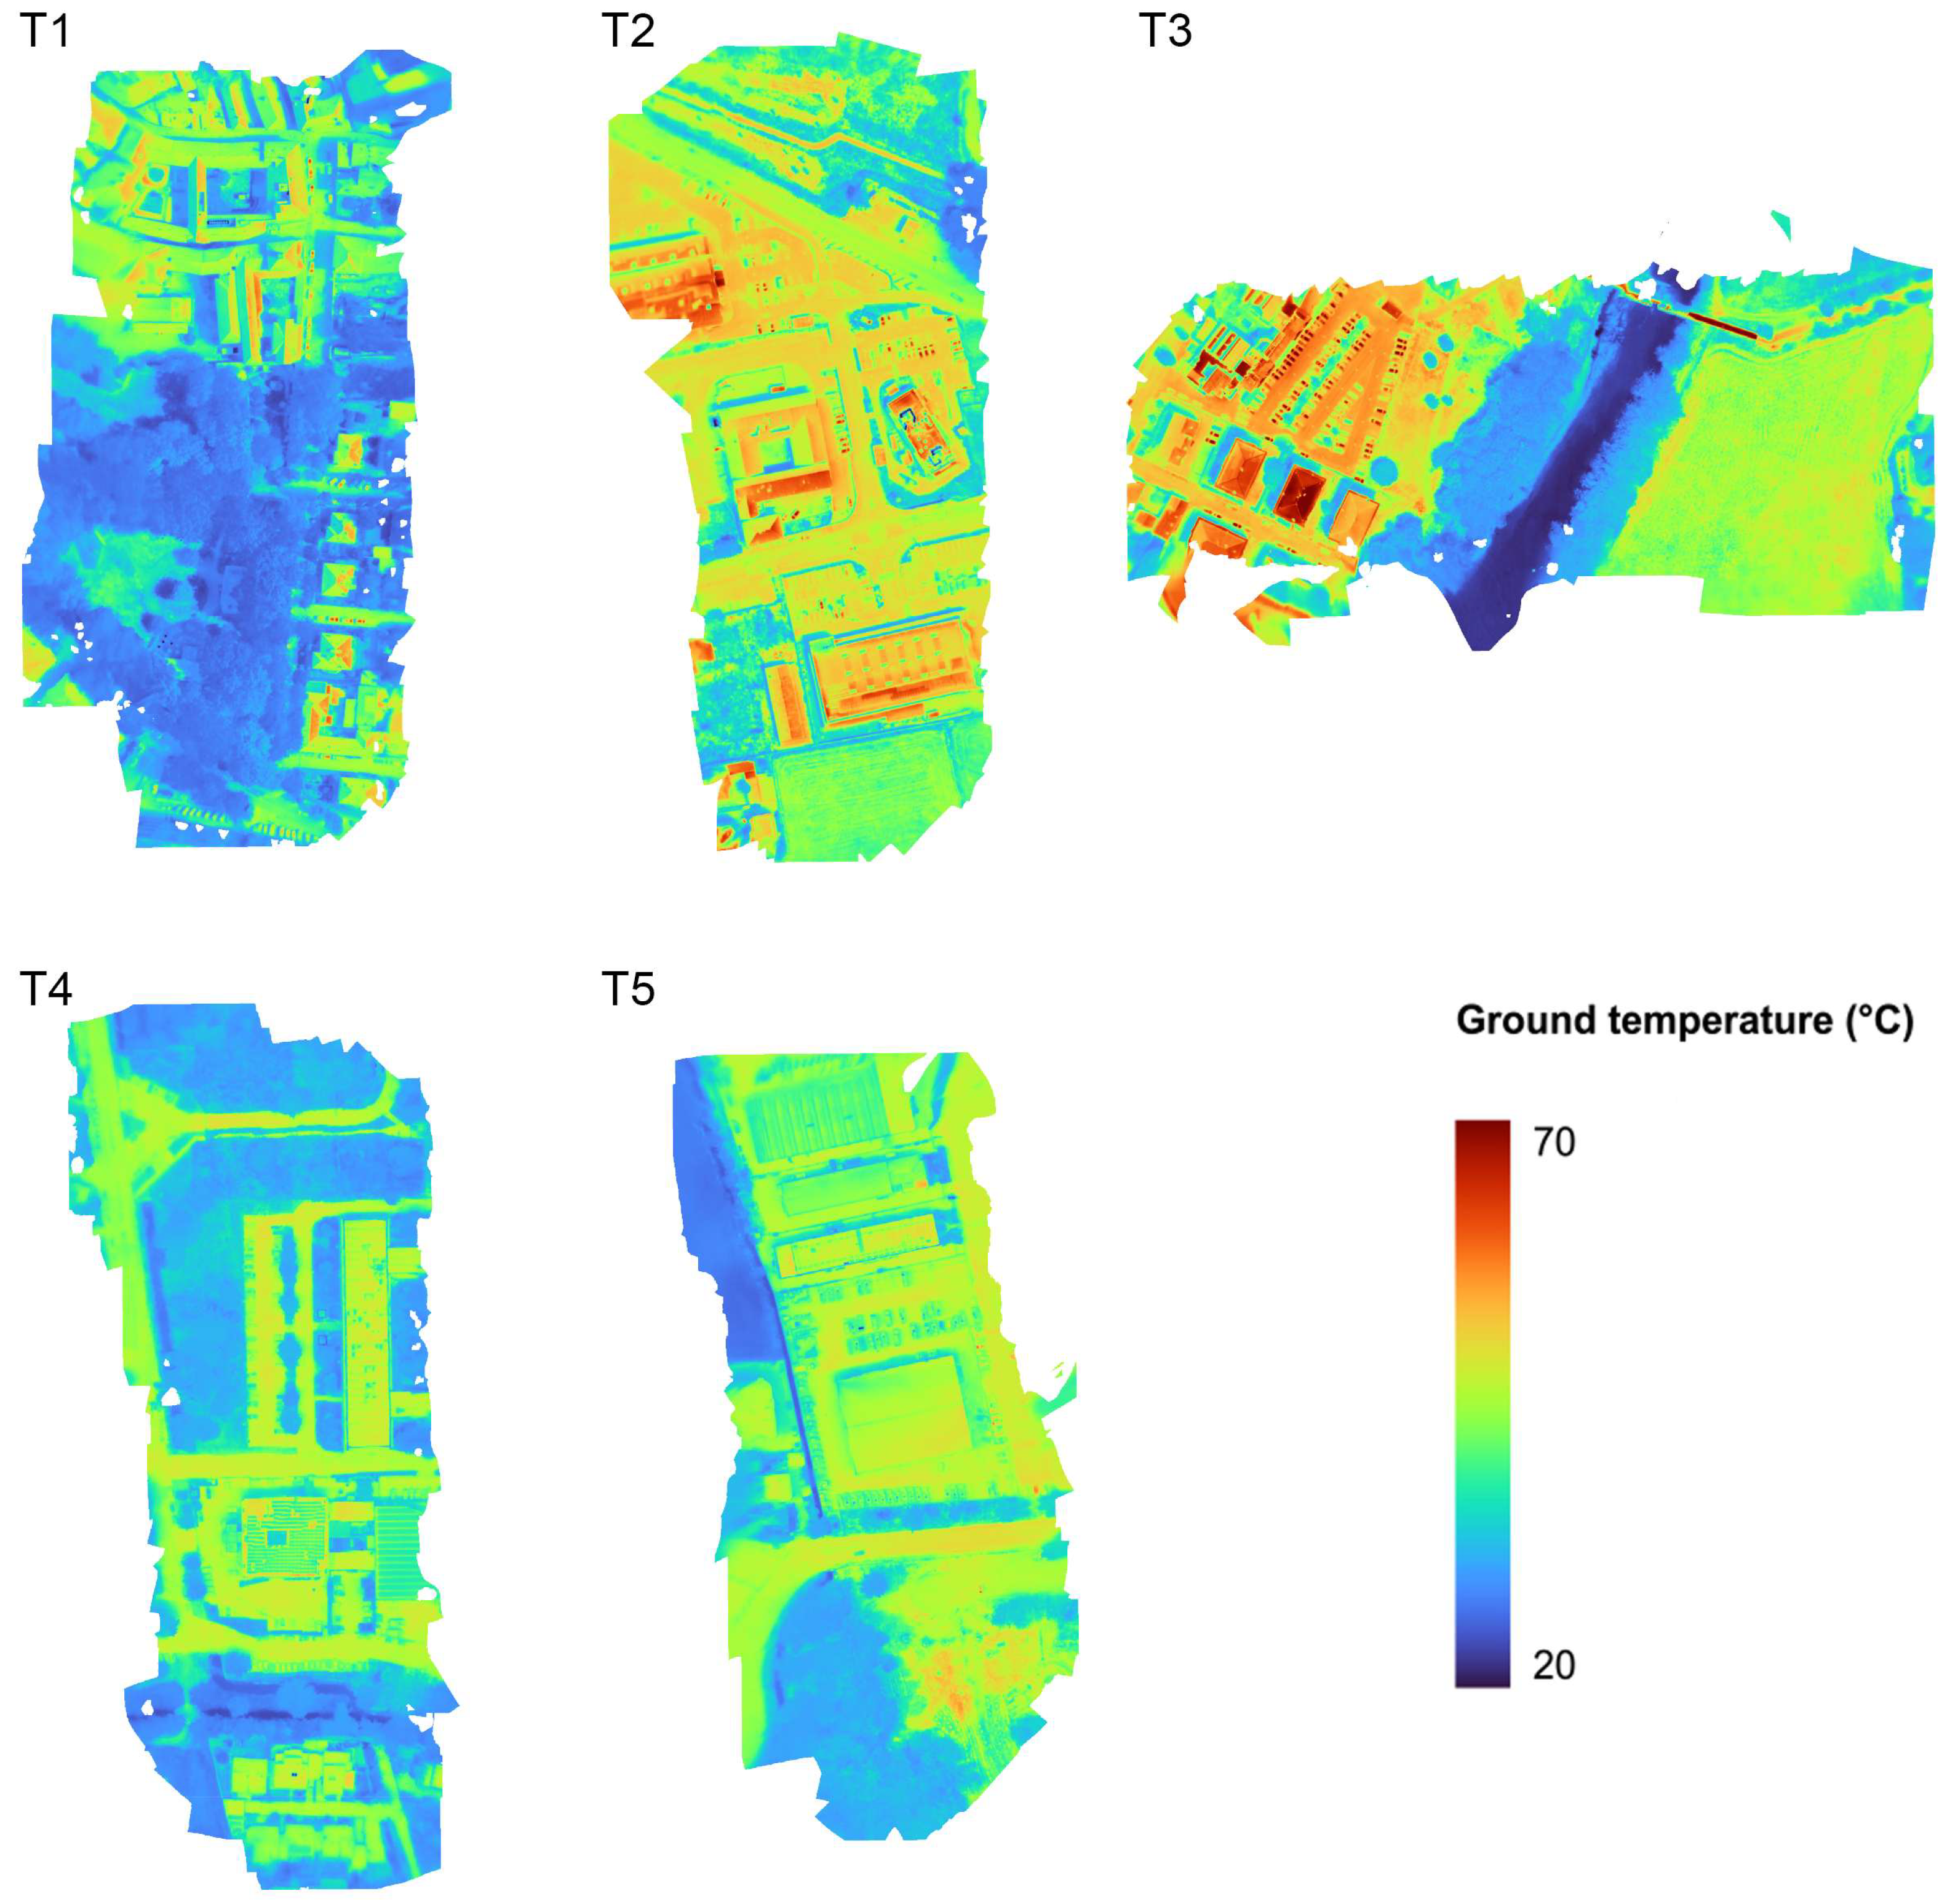

Table 1.
Comparative statistics of drone-derived apparent surface temperature (T) and the vegetation index (NDVI) for the five thermal transects surveyed in Crema.
Table 1.
Comparative statistics of drone-derived apparent surface temperature (T) and the vegetation index (NDVI) for the five thermal transects surveyed in Crema.
| Transect | Morphological typology | T min (°C) | T max (°C) | T mean (°C) | Std. dev. | Mean NDVI |
| T1 | Urban Park + historic core | 16.51 | 65.15 | 34.08 | 7.36 | 0.547 |
| T2 | Southern commercial strip | 18.02 | 70.91 | 44.99 | 7.06 | 0.269 |
| T3 | Discontinuous residential + Serio River | 17.63 | 79.28 | 41.91 | 10.29 | 0.373 |
| T4 | Northern production area 1 | 19.07 | 55.17 | 37.42 | 6.79 | 0.514 |
| T5 | Northern production area 2 | 17.03 | 60.89 | 40.25 | 6.76 | 0.405 |
Table 2.
Direct footprint-on-footprint comparison between drone data (native resolution) and satellite data, on the exact footprint of each transect.
Table 2.
Direct footprint-on-footprint comparison between drone data (native resolution) and satellite data, on the exact footprint of each transect.
| Transect | T min drone | LST min satellite | T max drone | LST max satellite | T mean drone | LST mean satellite |
| T1 | 16.51 | 42.48 | 65.15 | 49.75 | 34.08 | 44.94 |
| T2 | 18.02 | 46.89 | 70.91 | 53.55 | 44.99 | 49.95 |
| T3 | 17.63 | 39.80 | 79.28 | 48.73 | 41.91 | 43.54 |
| T4 | 19.07 | 44.24 | 55.17 | 50.94 | 37.42 | 47.36 |
| T5 | 17.03 | 40.34 | 60.89 | 45.62 | 40.25 | 45.62 |
Table 3.
Interquartile range (25th–75th percentile) drone vs. satellite, footprint on footprint.
| Transect | IQR drone | IQR satellite |
| T1 | 12.19 | 3.13 |
| T2 | 10.42 | 2.56 |
| T3 | 15.69 | 2.95 |
| T4 | 12.97 | 2.39 |
| T5 | 12.43 | 4.19 |
Table 4.
Spearman’s rank correlation between drone ranking and satellite ranking, footprint-on-footprint comparison.
Table 4.
Spearman’s rank correlation between drone ranking and satellite ranking, footprint-on-footprint comparison.
| Indicator | Spearman’s ρ | Direction |
| Mean | ≈ +0.30 | weak positive |
| Maximum | ≈ -0.40 | weak negative |
| Minimum | ≈ +0.50 | moderate positive |
| Interquartile range | ≈ -0.10 | essentially null |
Table 5.
Verification patches by morphological family: transect of origin (if internal), mean apparent surface temperature from drone (where available) and from satellite.
Table 5.
Verification patches by morphological family: transect of origin (if internal), mean apparent surface temperature from drone (where available) and from satellite.
| N° | Typology | Internal transect | T drone mean (°C) | LST satellite mean (°C) |
| 1 | Commercial axis | T2 | 48.05 | 51.05 |
| 2 | Commercial axis | external | — | 48.26 |
| 3 | Commercial axis | external | — | 51.44 |
| 4 | Commercial axis | external | — | 50.94 |
| 5 | Commercial axis | external | — | 49.89 |
| 6 | Mineral historic core | T1 | 39.49 | 48.93 |
| 7 | Mineral historic core | external | — | 50.48 |
| 8 | Mineral historic core | external | — | 50.63 |
| 9 | Mineral historic core | external | — | 49.94 |
| 10 | Mineral historic core | external | — | 50.29 |
| 11 | Large parks | T1 | 29.25 | 42.67 |
| 12 | Large parks | T5 | 40.89 | 41.39 |
| 13 | Large parks | external | — | 42.56 |
| 14 | Large parks | external | — | 42.27 |
| 15 | Large parks | external | — | 42.76 |
| 16 | Discontinuous residential fabric | T3 | 50.82 | 46.45 |
| 17 | Discontinuous residential fabric | external | — | 47.18 |
| 18 | Discontinuous residential fabric | external | — | 47.13 |
| 19 | Discontinuous residential fabric | external | — | 46.51 |
| 20 | Discontinuous residential fabric | external | — | 48.03 |
| 21 | Production site | T5 | 43.58 | 48.63 |
| 22 | Production site | T4 | 39.08 | 48.50 |
| 23 | Production site | external | — | 50.03 |
| 24 | Production site | external | — | 49.57 |
| 25 | Production site | external | — | 48.29 |
Table 6.
Aggregated satellite statistics by morphological family (internal and external patches combined, n = 5 per category).
Table 6.
Aggregated satellite statistics by morphological family (internal and external patches combined, n = 5 per category).
| Typology | Satellite mean (°C) | Std. dev. | Min | Max |
| Commercial axis | 50.31 | 1.29 | 48.26 | 51.44 |
| Mineral historic core | 50.06 | 0.68 | 48.93 | 50.63 |
| Production site | 49.00 | 0.75 | 48.29 | 50.03 |
| Discontinuous residential fabric | 47.06 | 0.64 | 46.45 | 48.03 |
| Large parks | 42.33 | 0.56 | 41.39 | 42.76 |
Disclaimer/Publisher’s Note: The statements, opinions and data contained in all publications are solely those of the individual author(s) and contributor(s) and not of MDPI and/or the editor(s). MDPI and/or the editor(s) disclaim responsibility for any injury to people or property resulting from any ideas, methods, instructions or products referred to in the content. |
© 2026 by the authors. Licensee MDPI, Basel, Switzerland. This article is an open access article distributed under the terms and conditions of the Creative Commons Attribution (CC BY) license (http://creativecommons.org/licenses/by/4.0/).
Copyright: This open access article is published under a Creative Commons CC BY 4.0 license, which permit the free download, distribution, and reuse, provided that the author and preprint are cited in any reuse.