

Submitted:
01 September 2026
Posted:
02 September 2026
You are already at the latest version
Abstract
Background/Objectives: Ultraviolet C (UVC) disinfection devices have been widely adopted since the COVID-19 pandemic. Short UVC exposure reportedly exerts greater cytotoxicity against cancer cells than normal cells. This study examined whether this differential sensitivity is associated with rapid, cancer-cell-specific changes in intracellular metabolites. Methods: Two malignant/non-malignant cell pairs were examined: COLO 679 melanoma cells and human dermal fibroblasts (HDFa), and Ca9-22 gingival carcinoma cells and human gingival fibroblasts (HGF). Viability was assessed using the MTT assay, and metabolites extracted immediately after irradiation were quantified by capillary electrophoresis–time-of-flight mass spectrometry. Results: UVC caused a time-dependent reduction in viability that reached a plateau after 48 h. Sensitivity decreased in the following order: cancer cells, young normal cells, and normal cells at advanced population doubling levels. Baseline metabolic profiles differed markedly between malignant and non-malignant cells. UVC significantly altered 27 of 139 metabolites in Ca9-22 cells, 56 of 142 in HGF, 7 of 136 in COLO 679, and 18 of 129 in HDFa. All four cell types accumulated the pentose phosphate pathway intermediates 6-phosphogluconate and ribulose 5-phosphate, whereas the glycolytic intermediates fructose 6-phosphate, 3-phosphoglycerate, and phosphoenolpyruvate decreased. Succinate decreased in both gingiva-derived cell types. Glutathione, NAD-related metabolites, and ATP showed no marked immediate changes. Conclusions: No cancer-cell-specific metabolic response was identified. Instead, UVC induced a common pattern characterized by the accumulation of pentose phosphate pathway intermediates and the depletion of glycolytic intermediates. This pattern may reflect an early response supporting nucleotide synthesis for DNA repair that is subsequently disrupted, potentially in association with mitochondrial dysfunction.
Keywords:
UVC irradiation
; human malignant cells
; non-malignant cells
; metabolomics analysis
; pentose phosphate pathway
; glycolysis
1. Introduction
Ultraviolet (UV) radiation is classified according to wavelength as UVA (315–400 nm), UVB (280–315 nm), or UVC (100–280 nm) 1. UVA accounts for most of the UV radiation reaching the Earth’s surface because it is only weakly attenuated by Rayleigh scattering, with a ground-level irradiance of approximately 20–50 W/m². In contrast, UVB is strongly absorbed by the ozone layer, and its irradiance at the Earth’s surface is approximately 3% that of UVA (0.3–1.5 W/m²). UVC is completely absorbed by atmospheric oxygen and the ozone layer and therefore does not naturally reach Earth’s surface [1].
The biological effects of UV radiation are strongly wavelength-dependent. In bacterial systems, UVC exhibits particularly potent genotoxicity, especially in DNA-repair-deficient strains. UVB at a dose corresponding to approximately 20 min of sunlight exposure also produces detectable cellular effects, whereas UVA elicits a significant response only at relatively high doses [2]. A similar order of cytotoxic potency—UVC > UVB > UVA—has been observed in cultured mammalian cells. In human keratinocytes (HaCaT), UVA1 irradiation alone has little effect on cell survival; however, UVA1 pre-irradiation markedly enhances UVB-induced cell death. This enhancement has been attributed to suppression of Akt phosphorylation, delayed nucleotide excision repair, and the consequent accumulation of unrepaired DNA damage [3].
Since the COVID-19 pandemic, UVC disinfection devices have been increasingly introduced into public and healthcare facilities because of their potent bactericidal and virucidal effects and their potential to reduce the indoor transmission of airborne pathogens [4]. Portable UVC devices also provide a convenient and user-friendly means of environmental disinfection [5]. Nevertheless, accidental or inappropriate exposure to UVC may pose health risks, including DNA damage associated with carcinogenesis [6] and ocular injury such as cataract formation [7]. Therefore, developing effective strategies to minimize the adverse effects of UVC exposure is important.
To address this need, we have investigated naturally occurring compounds with protective activity against UVC-induced cellular damage. Among the compounds examined, phenylpropanoids derived from lignin degradation and vanilloid compounds showed particularly strong protective effects that persisted longer than those of vitamin C [8]. During these studies, we also observed that UVC irradiation exerted greater cytotoxicity against malignant cells than against non-malignant cells derived from the same tissue [9] This finding raises the possibility that UVC could be exploited as a localized anticancer modality if irradiation could be selectively confined to tumor tissue.
UVC irradiation has also been reported to induce dose-dependent alterations in mRNA and long non-coding RNA expression profiles in human CD4⁺ T cells [10]. Subsequent analyses identified NOP14 and NOP14-AS1 as potential biomarkers of UVC-induced immune dysfunction [11]. However, these studies did not directly compare the responses of malignant and non-malignant cells. It therefore remains unclear whether the greater UVC sensitivity of cancer cells is associated with a distinct early metabolic response.
In the present study, we compared the immediate effects of UVC irradiation on intracellular metabolite profiles in two pairs of malignant and non-malignant human cells derived from gingival and skin tissues. We investigated whether the differential sensitivity of cancer and normal cells to UVC irradiation could be explained by rapid, cancer-cell-specific changes in intracellular metabolite concentrations.
2. Materials and Methods
2.1. Materials
Dulbecco’s modified Eagle’s medium (DMEM), fetal bovine serum (FBS), and 3-(4,5-dimethylthiazol-2-yl)-2,5-diphenyltetrazolium bromide (MTT) were purchased from Sigma-Aldrich (St. Louis, MO, USA). Phosphate-buffered saline without calcium and magnesium (PBS) was obtained from Nissui Pharmaceutical Co. (Tokyo, Japan). Dimethyl sulfoxide (DMSO) was obtained from Wako Pure Chemical Ind. (Osaka, Japan).
2.2. Cell Cultures
Human gingival fibroblast HGF [established from the gingival tissue attached to the extracted tooth of a twelve-year-old girl, according to the guideline of intramural Ethic Committee (No. A0808)] [12], human periodontal ligament fibroblasts (HPLFs) (purchased from SCR ScienCell Research Laboratories, Carlsbad, CA, USA), human dermal fibroblasts (HDFa) (catalog number: C0135C; Thermo Fisher Scientific, Waltham, MA, USA), human oral squamous cell carcinoma from gingiva (Ca9-22) (RCB1976, Riken Cell Bank, Tsukuba, Japan) and human melanoma cells (COLO 679) (R21-0267; RCB) were cultured at 37 °C in regular culture medium [DMEM supplemented with 10% heat inactivated FBS, 100 U/mL penicillin G, and 100 μg/mL streptomycin sulfate] in a 5% CO2 humidified atmosphere as described previously [9]. For subculture, HGF and HPLF cells were harvested by trypsinization and seeded at a 1:3 split ratio twice a week (for HGF and HPLF cells) (Figure 1A, B), given their rapid growth. In contrast, HDFa cells were seeded at a 1:4 ratio once a week, with a medium change after 4 days (Figure 1C). With continued passage in this manner, the cell density gradually decreased, and proliferation ceased after 54, 93 or 53 divisions.
2.3. UVC Protection Assay
Cells were inoculated at the density of 2 × 10³ cells/0.1 mL in the inner 60 wells of a 96-well plate (Figure 2A), while the surrounding 36 exterior wells were filled with sterile distilled water (275 µL) to prevent water evaporation from the culture medium. After 48 h of incubation to allow complete cell attachment, the 96-well plates were placed 550 mm from the center of a UVC lamp (254 nm, germicidal lamp GL15; Toshiba Co., Tokyo, Japan) in a clean bench (Figure 2B). The lower half of the culture dish was covered with aluminum foil that blocks UVC (control), and the cells were exposed to UVC for the indicated durations. The radiation intensity in the center below the UVC lamp was 1.193 W/m2 (Figure 2). Cells were then incubated for 48 h, and their viability was determined using the MTT method. Briefly, the treated cells were incubated for another 2 h in fresh culture medium containing 0.2 mg/ml MTT. Cells were then lysed with 0.1 ml DMSO and the absorbance at 560 nm (A560) of the cell lysate was determined as described previously9.
2.4. Processing for Metabolomic Analysis
Near-confluent cells in a 10 cm dish were exposed to UVC irradiation for 3 min or not (Table 1). A portion of the cells from each dish was harvested by trypsinization, and viable cells were counted using a hemocytometer and the trypan blue exclusion method. The remaining cells were washed twice with 5 mL of ice-cold 5% D-mannitol and then immersed for 10 min in 1 mL of methanol containing internal standards [25 μM each of methionine sulfone, 2-(N-morpholino)-ethanesulfonic acid (MES) and D-camphor-10-sulfonic acid (CSA)]. Four hundred microliters of the methanol extract, 400 μL of chloroform, and 200 μL of Milli--Q water were mixed thoroughly and centrifuged at 10,000 g for 3 min at 4 °C. The aqueous layer was filtered to remove large molecules by centrifugation through a 5 kDa cut-off filter (Millipore, Billerica, MA, USA) at 9100× g for 2.5 h at 4 °C. The 320 μL of the filtrate was concentrated by centrifugation and dissolved in 50 μL of Milli-Q water containing reference compounds (200 μM each of 3-aminopyrrolidine and trimesate) immediately before capillary electrophoresis-time-of-flight-mass spectrometry (CE-TOF-MS) analysis. The instrumental conditions and data-processing procedures have been described previously [13]. The concentrations of intracellular metabolites were expressed as amol/cell, as described previously [13].
2.5. Statistical Analysis
Data from the MTT assays and metabolomic analyses are presented as the mean ± SD. Differences between the UVC(−) and UVC(+) groups were evaluated using an unpaired two-tailed Student’s t-test. Statistical significance was set at p < 0.05.
3. Results
3.1. Differential Sensitivity of Malignant and Non-Malignant Cells to UVC Irradiation
We first confirmed our previous observation that Ca9-22 gingival carcinoma cells and COLO 679 melanoma cells were more sensitive to UVC irradiation than non-malignant fibroblasts derived from the corresponding tissues, namely HGF and HDFa cells, respectively (Figure 3A). A time-course analysis showed that the MTT signal in both cancer cell lines decreased significantly as early as 1 h after UVC irradiation. The cytotoxic effect became progressively more pronounced during subsequent incubation, with relative cell viability reaching a minimum of 1.7–6.3% after 48 h. In contrast, 33–42% of the non-malignant cells remained viable at 72 h after irradiation.
We next examined whether replicative aging affected UVC sensitivity in normal fibroblasts. HGF, HDFa, and HPLF cells became progressively more resistant to UVC irradiation with increasing population doubling level (PDL) (Figure 3B). These results indicate that UVC sensitivity is closely associated with cellular proliferative capacity, with rapidly proliferating cancer cells being the most sensitive and normal fibroblasts at advanced PDLs being the most resistant.
3.2. Immediate Effects of UVC Irradiation on Intracellular Metabolite Profiles
Comprehensive metabolomic profiling was performed to characterize the immediate effects of UVC irradiation on intracellular metabolites in gingiva-derived Ca9-22 and HGF cells and skin-derived COLO 679 and HDFa cells (Figure 4). CE-TOF-MS identified 139 metabolites in Ca9-22 cells, 142 in HGF cells, 136 in COLO 679 cells, and 129 in HDFa cells.
The heatmaps revealed marked differences in baseline metabolite profiles between malignant and non-malignant cells derived from the same tissue. These cell-type-dependent differences were more pronounced than the differences between UVC-irradiated and non-irradiated samples within each cell type. Thus, cell type primarily determined the overall intracellular metabolite profile, whereas UVC irradiation induced more selective changes in a limited subset of metabolites.
3.3. Identification of Metabolites Altered by UVC Irradiation
Volcano plots were generated to visualize both the magnitude and statistical significance of UVC-induced changes in intracellular metabolites in each cell type (Figure 5). For each metabolite, fold change was calculated as the ratio of the mean concentration in UVC-irradiated cells to that in non-irradiated cells [mean UVC(+)/mean UVC(−)] and expressed as log₂ fold change. Positive values therefore indicate an increase following UVC irradiation, whereas negative values indicate a decrease.
The number of metabolites significantly affected by UVC irradiation varied markedly among the four cell types, ranging from 7 in COLO 679 cells to 56 in HGF cells. Nevertheless, several major metabolic changes showed the same direction and relative magnitude in malignant and non-malignant cells (Figure 6). Figure 7 shows the significantly altered metabolites in each cell type, arranged by the magnitude of their changes following UVC irradiation.
Across all four cell types, the most prominent increases were observed in metabolites associated with the pentose phosphate pathway (PPP), particularly 6-phosphogluconate (6PG), ribulose 5-phosphate (Ru5P), and sedoheptulose 7-phosphate (S7P) (Figure 7 and 8A). In contrast, several glycolytic intermediates, including fructose 6-phosphate (F6P), fructose 1,6-bisphosphate (F1,6BP), 3-phosphoglycerate (3PG), and phosphoenolpyruvate (PEP), decreased following UVC irradiation (Figure 7 and 8B). Succinate, a tricarboxylic acid (TCA) cycle intermediate, also decreased significantly in both gingiva-derived cell types, Ca9-22 and HGF (Figure 7 and 8C).
No marked immediate changes were observed in reduced and oxidized glutathione or in the measured nicotinamide-related metabolites, including NAD⁺, NADP⁺, and NADPH (Figure 8D,E). Mapping the log₂ fold changes onto major metabolic pathways showed a common pattern: accumulation of PPP intermediates and depletion of glycolytic intermediates following UVC irradiation (Figure 9).
4. Discussion
The present study confirmed our previous finding that Ca9-22 gingival carcinoma cells and COLO 679 melanoma cells were more sensitive to UVC irradiation than non-malignant fibroblasts derived from the corresponding tissues [9]. We also found that normal fibroblasts became progressively more resistant to UVC irradiation with increasing population doubling level (Figure 3B). Taken together, these observations suggest that UVC sensitivity is associated with cellular proliferative capacity: rapidly proliferating cancer cells were the most sensitive, whereas replicatively senescent normal cells were the most resistant. This association does not, however, establish proliferative capacity as the sole determinant of UVC sensitivity, because malignant transformation is accompanied by numerous changes in DNA repair, stress responses, and cellular metabolism.
Several natural products have been reported to enhance UVC-induced, tumor-cell-selective growth inhibition or apoptosis in vitro, including an ethyl acetate extract of Nepenthes [14], sinularin, a cembranolide derived from the soft coral Sinularia flexibilis [15], fucoidan [16], and riboflavin [17]. Activation of p53 and STAT signaling pathways after lethal UVC irradiation has been reported in a living organism such as zebrafish embryos [18]. However, to our knowledge, the tumor selectivity of UVC has not been systematically evaluated in whole-animal models. Before UVC can be considered for therapeutic application, it will therefore be necessary to determine its safety margin by comparing the dose–response relationships for its potential antitumor effects with those for adverse outcomes, including damage to normal tissues and UVC-induced carcinogenesis. Methods for restricting UVC exposure to tumor tissue would also be essential.
We initially hypothesized that UVC irradiation would rapidly induce one or more cancer-cell-specific metabolites that might contribute to the greater sensitivity of malignant cells. Contrary to this hypothesis, no metabolic response specific to the two cancer cell lines was identified. Instead, UVC irradiation produced a broadly shared metabolic pattern in all four cell types. The most prominent changes were the accumulation of the pentose phosphate pathway (PPP) intermediates 6-phosphogluconate (6PG), ribulose 5-phosphate (Ru5P), and sedoheptulose 7-phosphate (S7P), together with decreases in the glycolytic intermediates fructose 6-phosphate (F6P), fructose 1,6-bisphosphate (F1,6BP), 3-phosphoglycerate (3PG), and phosphoenolpyruvate (PEP) (Figure 8 and Figure 9). Succinate also decreased in both gingiva-derived cell types. These findings indicate that the immediate metabolic response to UVC is characterized by coordinated changes in the PPP and glycolysis rather than by the appearance of a cancer-cell-specific metabolite.
The PPP and glycolysis are closely interconnected through shared sugar-phosphate intermediates (Figure 9). The PPP consists of oxidative and non-oxidative branches that together provide reducing equivalents and biosynthetic precursors. The oxidative branch converts glucose 6-phosphate (G6P) to Ru5P while generating NADPH. G6P is initially oxidized by glucose-6-phosphate dehydrogenase (G6PD) to produce 6-phosphogluconolactone, which is subsequently converted to 6PG and then to Ru5P by 6-phosphogluconate dehydrogenase (6PGD). The non-oxidative branch reversibly interconverts pentose phosphates and glycolytic intermediates through reactions catalyzed principally by transketolase and transaldolase. It thereby generates ribose 5-phosphate for nucleotide synthesis and supplies sugar-phosphate precursors for other biosynthetic reactions [19]. In cancer cells, increased glucose utilization through the PPP can support anabolic metabolism by supplying ribose phosphates for nucleotide synthesis and NADPH for reductive biosynthesis and antioxidant defense [20].
The marked accumulation of 6PG following UVC irradiation suggests a metabolic bottleneck in the oxidative branch of the PPP. Inhibition of 6PGD has been reported to cause 6PG accumulation, impair NADPH production, increase intracellular reactive oxygen species, and suppress cell proliferation and tumor growth [20,21,22]. Nevertheless, the present results do not demonstrate inhibition of 6PGD. Ru5P also accumulated after irradiation, and neither NADPH nor reduced glutathione showed a marked immediate change. The observed metabolite concentrations may therefore reflect altered substrate utilization, changes in multiple enzymatic reactions, or a transient imbalance between metabolite production and consumption. Measurements of enzyme activity and metabolic flux will be required to distinguish between these possibilities.
One possible interpretation is that UVC-induced DNA damage rapidly increases the cellular demand for pentose phosphates required for nucleotide synthesis and DNA repair. However, the accumulation of PPP intermediates, rather than their depletion, suggests that their subsequent utilization may have been restricted. Simultaneous decreases in glycolytic intermediates and, in some cells, succinate may indicate an acute disruption of central carbon metabolism. Such disruption could interfere with the energy and biosynthetic requirements of DNA repair and might be associated with mitochondrial dysfunction. This interpretation remains hypothetical because DNA damage, nucleotide synthesis, mitochondrial function, and the activities of PPP- and glycolysis-related enzymes were not directly measured in the present study.
The lack of marked immediate changes in NAD-related metabolites, glutathione, and ATP also requires careful interpretation. Intracellular metabolite concentrations represent static pool sizes and do not necessarily reflect metabolic flux. Increased production and consumption can occur simultaneously without producing a detectable change in the total intracellular concentration. Moreover, antioxidant and energy-related responses may develop at later time points than those examined here. Time-resolved metabolomic analyses, together with isotope-tracing experiments, would help determine whether UVC increases glucose flux through the PPP or instead causes the accumulation of PPP intermediates through downstream inhibition.
This study has several limitations. Only two malignant cell lines and two corresponding non-malignant cell types were examined, and each experimental group consisted of four biological replicates. The metabolomic analysis was performed at a single UVC dose and at a single immediate post-irradiation time point. Furthermore, the study measured metabolite concentrations but not pathway flux, enzyme expression or activity, DNA damage, DNA repair capacity, reactive oxygen species production, or mitochondrial function. These limitations preclude definitive conclusions regarding the mechanisms underlying either the observed metabolic changes or the greater UVC sensitivity of malignant cells.
In summary, UVC irradiation induced a common early metabolic response in malignant and non-malignant cells, characterized by the accumulation of PPP intermediates and the depletion of several glycolytic intermediates. Although these changes did not explain the selective sensitivity of cancer cells, they identify central carbon metabolism as an important component of the acute cellular response to UVC. Further studies comparing DNA damage and repair, PPP and glycolytic enzyme activities, mitochondrial function, and metabolic flux between malignant and non-malignant cells may help clarify the mechanisms of UVC cytotoxicity and support the development of safer DNA-targeting anticancer strategies.
5. Conclusions
UVC irradiation induced a common early metabolic response in malignant and non-malignant cells, characterized by the accumulation of the pentose phosphate pathway intermediates 6-phosphogluconate and ribulose-5-phosphate and the depletion of several glycolytic intermediates. Decreases in selected TCA cycle metabolites were also observed in some cell types. Contrary to our initial hypothesis, no cancer-cell-specific metabolic response that could explain the greater UVC sensitivity of malignant cells was identified. The observed changes may represent an early attempt to support nucleotide synthesis and repair UVC-induced DNA damage, followed by disruption of central carbon metabolism, potentially in association with mitochondrial dysfunction. Further studies combining time-resolved metabolomics with measurements of metabolic flux, DNA damage and repair, enzyme activity, and mitochondrial function will be required to clarify the mechanisms underlying UVC-induced cytotoxicity and its preferential effects on rapidly proliferating cells.
Author Contributions
Conceptualization, H.S. and M.S.; methodology, H.S. S.O., M.K. and A.E; software, M.S.; validation, M.S.; formal analysis, M.S.; investigation, H.S, A.M.A., and M.S.; writing—original draft preparation, H.S.; writing—review and editing, M.S.; project administration, H.S. and M.S.; funding acquisition, H.S.; All authors have read and agreed to the published version of the manuscript.
Funding
This research was funded by the Japan Medical Herb Association Research Grant for Fiscal Year 2024 and 2025, entitled Development of Anti-Radiation and Anti-Aging Drugs Based on Vanillin and Lemongrass” (Principal Investigator: Hiroshi Sakagami), and the research fund based on the agreement between Meikai University and Autonomous University of the State of Mexico (Principal Investigator: Hiroshi Sakagami).
Institutional Review Board Statement
Not applicable for studies not involving humans or animals.
Informed Consent Statement
Not applicable for studies not involving humans.
Data Availability Statement
The original contributions presented in this study are included in the article/Supplementary Material. Further inquiries can be directed to the corresponding author.
Acknowledgments
The authors thank Dr. Nishino (Division of Fundamental Physics), Dr. Tsukahara (Division of Biochemistry), Meikai University School of Dentistry, for their constructive advices. .
Conflicts of Interest
The authors declare no conflicts of interest.
Abbreviations
The following abbreviations are used in this manuscript:
| ATP | Adenosine triphosphate |
| A560 | Absorbance at 560 nm |
| CE--TOF--MS | Capillary electrophoresis-time-of-flight-mass spectrometry |
| COVID--19 | Coronavirus disease 2019 |
| CSA | D-camphor-10-sulfonic acid |
| DMEM | Dulbecco’s modified Eagle’s medium |
| FBS | Fetal bovine serum |
| F1,6P | Fructose 1,6-bisphosphate |
| F6P | Fructose 6-phosphate |
| G6P | Glucose 6-phosphate |
| G6PD | Glucose--6--phosphate dehydrogenase |
| HDFa | Human dermal fibroblast |
| HGF | Human gingival fibroblast |
| HPLF | Human periodontal ligament fibroblast |
| MES | 2-(N-morpholino)ethanesulfonic acid |
| MTT | 3-(4,5-Dimethylthiazol-2-yl)-2,5-diphenyltetrazolium bromide |
| NAD | Nicotinamide adenine dinucleotide |
| NADP | Nicotinamide adenine dinucleotide phosphate |
| NADPH | Reduced nicotinamide adenine dinucleotide phosphate |
| PDL | Population doubling level |
| 6PG | 6--Phosphogluconate |
| 6PGD | 6--Phosphogluconate dehydrogenase |
| 3PG | 3--Phosphoglycerate |
| PEP | Phosphoenolpyruvate |
| PPP | Pentose phosphate pathway |
| R5P | Ribose 5-phosphate |
| ROS | Reactive oxygen species |
| Ru5P | Ribulose 5-phosphate |
| SD | Standard deviation |
| S7P | Sedoheptulose--7--phosphate |
| TCA | Tricarboxylic acid |
| UVC | Ultraviolet C |
References
- Igawa, N.; Nozawa, H.; Takeda, K.; Farnham, C.; Emura, K. Relationships between solar irradiance and UV-A and UV-B. J. Environ. Eng. AIJ 2024, 89(817), 154–159. [Google Scholar]
- Fuentes-León, F.; Quintero-Ruiz, N.; Fernández-Silva, F. S.; Munford, V.; Vernhes Tamayo, M.; Menck, C. F. M.; Galhardo, R. S.; Sánchez-Lamar, A. Genotoxicity of ultraviolet light and sunlight in the bacterium Caulobacter crescentus: Wavelength-dependence. Mutat. Res. Genet Toxicol. Environ. Mutagen 2024, 894, 503727. [Google Scholar] [CrossRef] [PubMed]
- Ibuki, Y.; Komaki, Y.; Yang, G.; Toyooka, T. Long-wavelength UVA enhances UVB-induced cell death in cultured keratinocytes: DSB formation and suppressed survival pathway. Photochem Photobiol. Sci. 2021, 20(5), 639–652. [Google Scholar] [CrossRef] [PubMed]
- Narouei, F. H.; Tang, Z.; Wang, S. I.; Hashmi, R. H.; Welch, D.; Sethuraman, S.; Brenner, D. J.; McNeill, V. F. Effects of germicidal far-UVC on ozone and particulate matter in a conference room. PLoS ONE 2025, 20(8), e0328224. [Google Scholar] [CrossRef] [PubMed]
- Ng, M. K.; Mont, M. A.; Bonutti, P. M. In Vitro Evaluation of the Ultraviolet Ceed Mobile Disinfection Device: A Rapid, Portable Approach for Surface Sterilization. Cureus 2025, 17(3), e80601. [Google Scholar] [CrossRef] [PubMed]
- Rothman, L. R.; Mir, A.; Meehan, S. A.; Mitchell, W. L. Squamous-cell carcinoma in situ. Dermatol. Online J. 2015, 21(12). [Google Scholar] [CrossRef]
- Liu, C. F.; Ou-Yang, Y.; Huang, C. Y.; Jao, S. W.; Kuo, Y. K.; Chen, H. C.; Cheng, S. C.; Wang, N. K.; Chuang, L. H.; Chen, Y. H.; Chen, W. Y. Zebrafish (Danio rerio) Is an Economical and Efficient Animal Model for Screening Potential Anti-cataract Compounds. Transl. Vis. Sci. Technol. 2022, 11(8), 21. [Google Scholar] [CrossRef] [PubMed]
- Sakagami, H.; Amano, S.; Uota, S.; Tanuma, S. I.; Inomata, M.; Shindo, A.; Kusano, M.; Kikkawa, Y.; Horiuchi, M.; Ooka, T. Prominent Anti-UVC Activity of Lignin Degradation Products. In Vivo 2022, 36(6), 2689–2699. [Google Scholar] [CrossRef] [PubMed]
- Shindo, A.; Kusano, M.; Sakagami, H.; Amano, S.; Inomata, M.; Abe, M.; Okazawa, M.; Ooka, T. Comparison of UVC Sensitivity and Dectin-2 Expression Between Malignant and Non-malignant Cells. In Vivo 2022, 36(5), 2116–2125. [Google Scholar] [CrossRef] [PubMed]
- Ding, X.; Pang, Y.; Zhang, B.; Zhao, L.; Niu, X.; Xu, D. Dose-specific lncRNA-mRNA networks modulate DNA damage and immune responses in CD4⁺ T cells under simulated space UVC irradiation. Life Sci. Space Res. (Amst) 2026, 48, 123–131. [Google Scholar] [CrossRef] [PubMed]
- Tian, M.; Ding, X.; Pang, Y.; Xu, D.; Sun, Y.; Xia, P. Transcriptomic dose-response by UVC and heavy ion radiation reveal pathways to immune impairment. Toxicol. Vitr. 2025, 108, 106086. [Google Scholar] [CrossRef] [PubMed]
- Kantoh, K.; Ono, M.; Nakamura, Y.; Nakamura, Y.; Hashimoto, K.; Sakagami, H.; Wakabayashi, H. Hormetic and anti-radiation effects of tropolone-related compounds. In Vivo 2010, 24(6), 843–51. [Google Scholar] [PubMed]
- Sugimoto, M.; Wong, D. T.; Hirayama, A.; Soga, T.; Tomita, M. Capillary electrophoresis mass spectrometry-based saliva metabolomics identified oral, breast and pancreatic cancer-specific profiles. Metabolomics 2010, 6(1), 78–95. [Google Scholar] [CrossRef] [PubMed]
- Peng, S. Y.; Lin, L. C.; Yang, Z. W.; Chang, F. R.; Cheng, Y. B.; Tang, J. Y.; Chang, H. W. Combined Treatment with Low Cytotoxic Ethyl Acetate Nepenthes Extract and Ultraviolet-C Improves Antiproliferation to Oral Cancer Cells via Oxidative Stress. Antioxidants 2020, 9(9). [Google Scholar] [CrossRef] [PubMed]
- Peng, S. Y.; Tang, J. Y.; Li, R. N.; Huang, H. W.; Wu, C. Y.; Chiu, C. C.; Chang, F. R.; Zhang, H. W.; Lee, Y. J.; Sheu, J. H.; Chang, H. W. Oxidative Stress-Dependent Synergistic Antiproliferation, Apoptosis, and DNA Damage of Ultraviolet-C and Coral-Derived Sinularin Combined Treatment for Oral Cancer Cells. Cancers 2021, 13(10). [Google Scholar] [CrossRef] [PubMed]
- Chuang, Y. T.; Shiau, J. P.; Yen, C. Y.; Hou, M. F.; Jeng, J. H.; Tang, J. Y.; Chang, H. W. Fucoidan/UVC Combined Treatment Exerts Preferential Antiproliferation in Oral Cancer Cells but Not Normal Cells. Antioxidants 2022, 11(9). [Google Scholar] [CrossRef] [PubMed]
- Yuan, Y.; Zhao, Y.; Chen, L.; Wu, J.; Chen, G.; Li, S.; Zou, J.; Chen, R.; Wang, J.; Jiang, F.; Tang, Z. Selective tumor cell death induced by irradiated riboflavin through recognizing DNA G-T mismatch. Nucleic Acids Res. 2017, 45(15), 8676–8683. [Google Scholar] [CrossRef] [PubMed]
- Zang, L.; Shimada, Y.; Miyake, H.; Nishimura, N. Transcriptome analysis of molecular response to UVC irradiation in zebrafish embryos. Ecotoxicol. Environ. Saf. 2022, 231, 113211. [Google Scholar] [CrossRef] [PubMed]
- Stincone, A.; Prigione, A.; Cramer, T.; Wamelink, M. M.; Campbell, K.; Cheung, E.; Olin-Sandoval, V.; Grüning, N. M.; Krüger, A.; Tauqeer Alam, M.; Keller, M. A.; Breitenbach, M.; Brindle, K. M.; Rabinowitz, J. D.; Ralser, M. The return of metabolism: biochemistry and physiology of the pentose phosphate pathway. Biol. Rev. Camb. Philos. Soc. 2015, 90(3), 927–63. [Google Scholar] [CrossRef] [PubMed]
- Liu, C. L.; Hsu, Y. C.; Lee, J. J.; Chen, M. J.; Lin, C. H.; Huang, S. Y.; Cheng, S. P. Targeting the pentose phosphate pathway increases reactive oxygen species and induces apoptosis in thyroid cancer cells. Mol. Cell Endocrinol. 2020, 499, 110595. [Google Scholar] [CrossRef] [PubMed]
- Redhu, A. K.; Bhat, J. P. Mitochondrial glucose 6-phosphate dehydrogenase and 6-phosphogluconate dehydrogenase abrogate p53 induced apoptosis in a yeast model: Possible implications for apoptosis resistance in cancer cells. Biochim Biophys. Acta Gen. Subj. 2020, 1864(3), 129504. [Google Scholar] [CrossRef] [PubMed]
- Daneshmandi, S.; Yan, Q.; Gomez, E. C.; Choi, J. E.; Katsuta, E.; Gharib, E.; Singh, P. K.; Higashi, R. M.; Lane, A. N.; Fan, T. W.; Wang, J.; Repasky, E. A.; McCarthy, P. L.; Mohammadpour, H. 6-Phosphogluconate dehydrogenase promotes mitochondrial fusion and immune suppression in tumor-associated monocytic suppressor cells. Nat. Commun. 2026, 17(1), 229. [Google Scholar] [CrossRef] [PubMed]
Figure 1.
Changes in cell density during replicative aging in vitro. Human gingival fibroblasts (HGF; A) and human periodontal ligament fibroblasts (HPLF; B) were passaged twice weekly at a split ratio of 1:3. Human dermal fibroblasts (HDFa; C) were passaged once weekly at a split ratio of 1:4, with one medium change between passages. Cell density was determined at the indicated population doubling levels (PDLs). Cell density progressively decreased as the cells approached replicative senescence.
Figure 1.
Changes in cell density during replicative aging in vitro. Human gingival fibroblasts (HGF; A) and human periodontal ligament fibroblasts (HPLF; B) were passaged twice weekly at a split ratio of 1:3. Human dermal fibroblasts (HDFa; C) were passaged once weekly at a split ratio of 1:4, with one medium change between passages. Cell density was determined at the indicated population doubling levels (PDLs). Cell density progressively decreased as the cells approached replicative senescence.
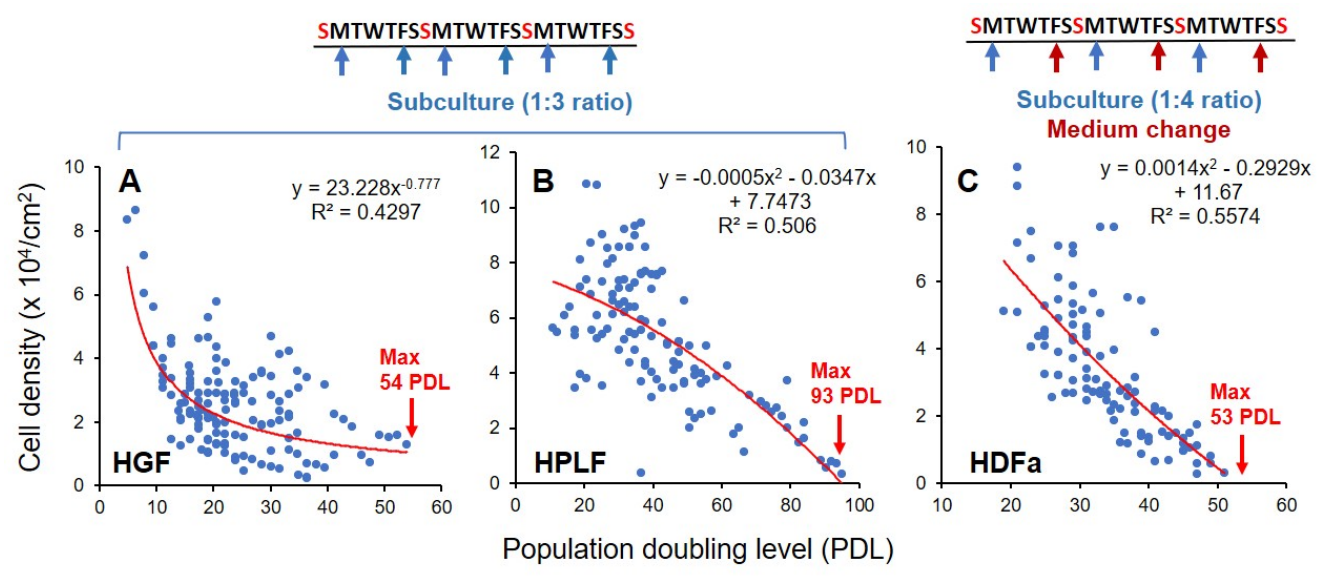
Figure 2.
Experimental setup for UVC irradiation. (A) Arrangement of the 96-well plate used for the UVC cytotoxicity assay. Cells in the upper three rows were exposed to UVC irradiation, whereas cells in the lower three rows were shielded with aluminum foil and served as the non-irradiated controls. (B,C) Positioning of a 96-well plate (B) and a 10-cm culture dish (C) beneath the UVC lamp. Cells were irradiated with 254-nm UVC at an irradiance of 1.193 W/m².
Figure 2.
Experimental setup for UVC irradiation. (A) Arrangement of the 96-well plate used for the UVC cytotoxicity assay. Cells in the upper three rows were exposed to UVC irradiation, whereas cells in the lower three rows were shielded with aluminum foil and served as the non-irradiated controls. (B,C) Positioning of a 96-well plate (B) and a 10-cm culture dish (C) beneath the UVC lamp. Cells were irradiated with 254-nm UVC at an irradiance of 1.193 W/m².
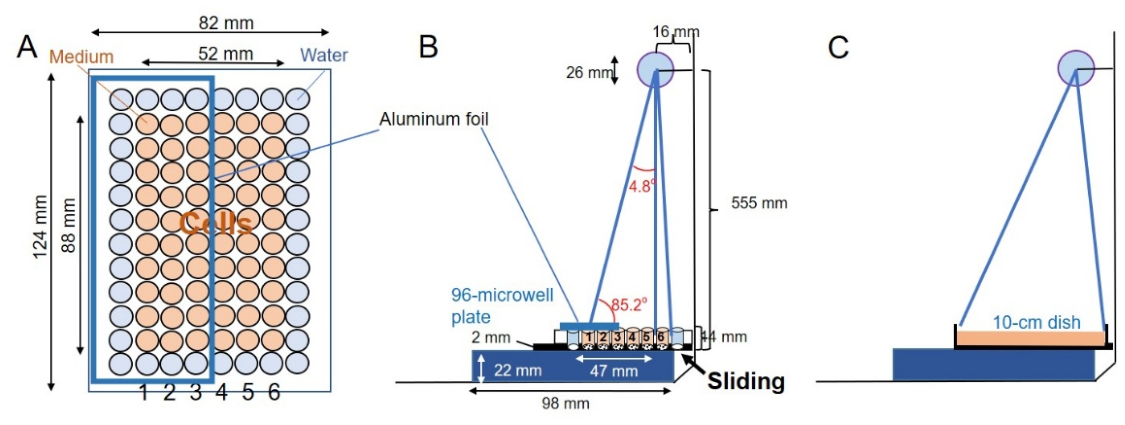
Figure 3.
Differential sensitivity of malignant and non-malignant cells to UVC irradiation. (A) Ca9-22, HGF, COLO 679, and HDFa cells were exposed to UVC for 0 min (non-irradiated control) or 3 min and then incubated for the indicated periods. Cell viability was assessed using the MTT assay and calculated as follows: viability (%) = [A₅₆₀ of UVC-irradiated cells/A₅₆₀ of non-irradiated cells] × 100. Values are presented as the mean ± SD of triplicate determinations. p < 0.05 versus the corresponding non-irradiated control. (B) UVC resistance of HGF, HPLF, and HDFa cells at the indicated population doubling levels (PDLs). UVC resistance was calculated from the MTT absorbance measured 48 h after 3 min of irradiation as follows: UVC resistance (%) = [A₅₆₀ of UVC-irradiated cells/A₅₆₀ of non-irradiated cells] × 100.
Figure 3.
Differential sensitivity of malignant and non-malignant cells to UVC irradiation. (A) Ca9-22, HGF, COLO 679, and HDFa cells were exposed to UVC for 0 min (non-irradiated control) or 3 min and then incubated for the indicated periods. Cell viability was assessed using the MTT assay and calculated as follows: viability (%) = [A₅₆₀ of UVC-irradiated cells/A₅₆₀ of non-irradiated cells] × 100. Values are presented as the mean ± SD of triplicate determinations. p < 0.05 versus the corresponding non-irradiated control. (B) UVC resistance of HGF, HPLF, and HDFa cells at the indicated population doubling levels (PDLs). UVC resistance was calculated from the MTT absorbance measured 48 h after 3 min of irradiation as follows: UVC resistance (%) = [A₅₆₀ of UVC-irradiated cells/A₅₆₀ of non-irradiated cells] × 100.
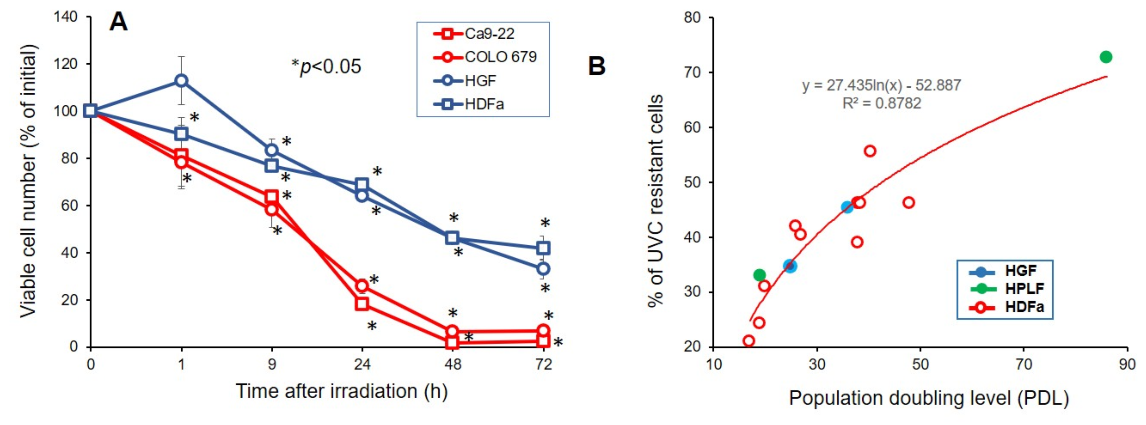
Figure 4.
Intracellular metabolite profiles of malignant and non-malignant cells before and immediately after UVC irradiation. Heatmaps show the relative intracellular abundance of metabolites detected in gingiva-derived Ca9-22 and HGF cells (A) and skin-derived COLO 679 and HDFa cells (B). Cells were either left untreated or exposed to UVC for 3 min, after which intracellular metabolites were immediately extracted and analyzed by CE-TOF-MS. Sample numbers correspond to those listed in Table 1. Relative metabolite levels above the overall mean are shown in red, whereas those below the overall mean are shown in blue. Each experimental group consisted of four independent biological replicates.
Figure 4.
Intracellular metabolite profiles of malignant and non-malignant cells before and immediately after UVC irradiation. Heatmaps show the relative intracellular abundance of metabolites detected in gingiva-derived Ca9-22 and HGF cells (A) and skin-derived COLO 679 and HDFa cells (B). Cells were either left untreated or exposed to UVC for 3 min, after which intracellular metabolites were immediately extracted and analyzed by CE-TOF-MS. Sample numbers correspond to those listed in Table 1. Relative metabolite levels above the overall mean are shown in red, whereas those below the overall mean are shown in blue. Each experimental group consisted of four independent biological replicates.
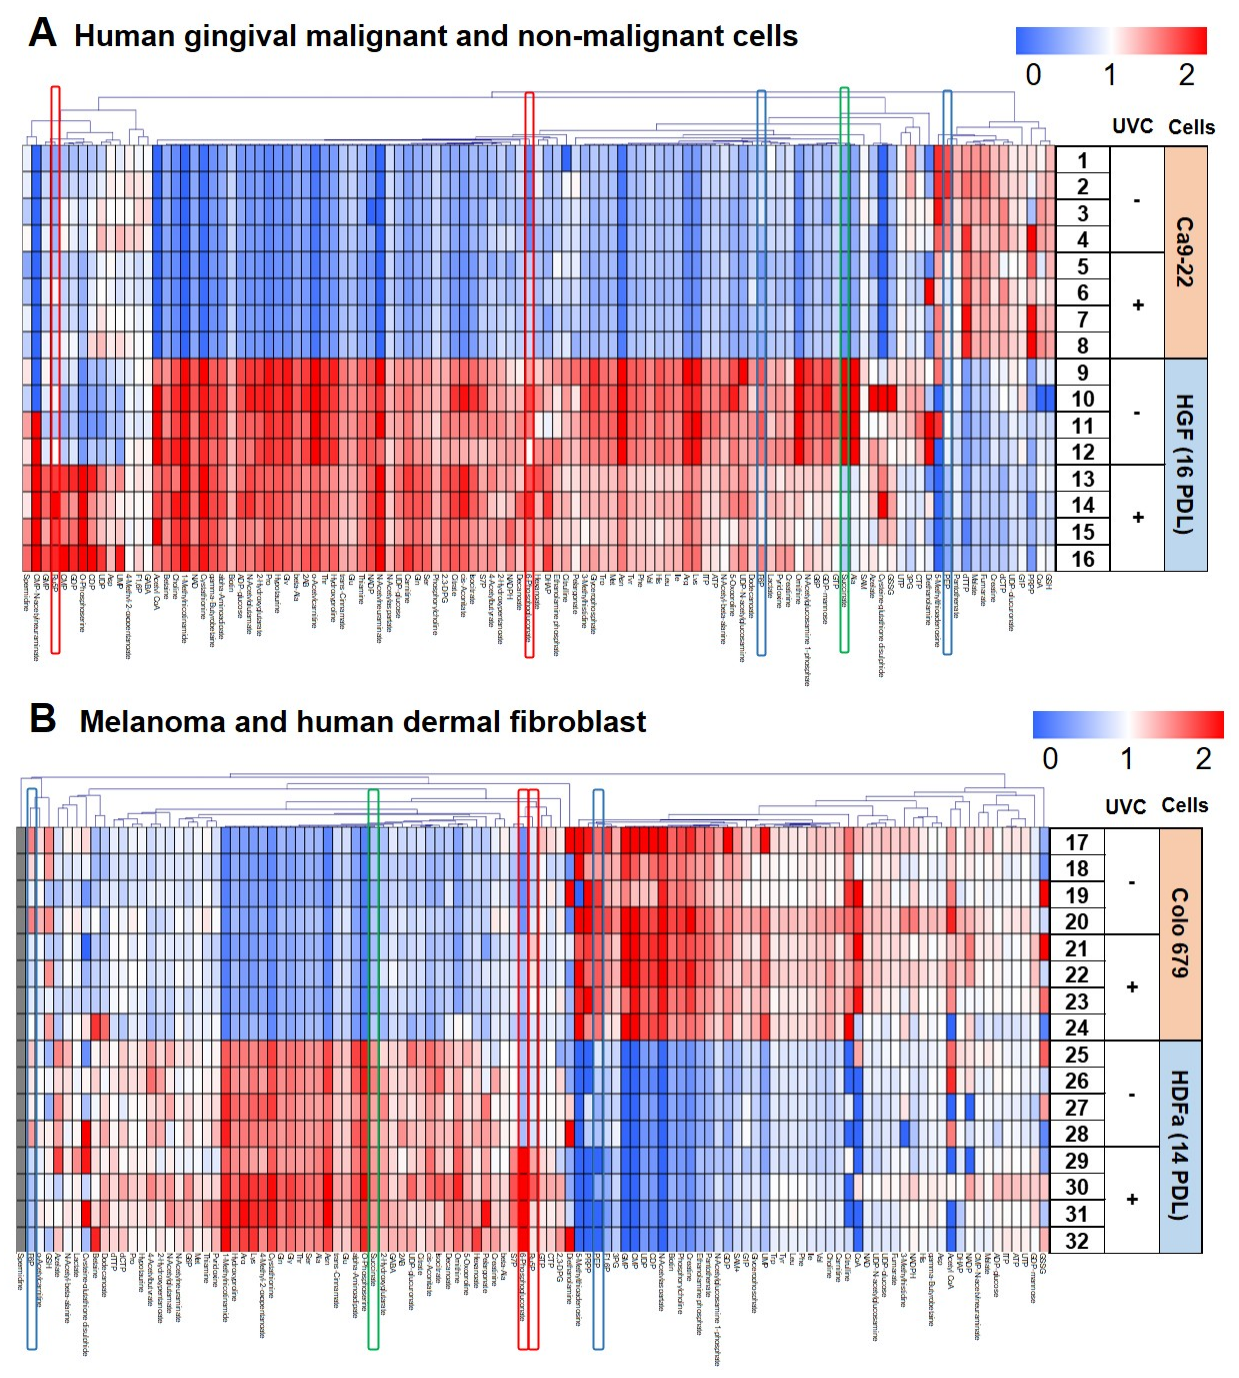
Figure 5.
Volcano plot analysis of UVC-induced changes in intracellular metabolites. Volcano plots show changes in intracellular metabolite concentrations immediately after UVC irradiation in Ca9-22 (A), HGF (B), COLO 679 (C), and HDFa (D) cells. The x-axis represents the log₂ fold change, calculated as log₂[mean UVC(+)/mean UVC(−)], and the y-axis represents −log₁₀(p). Positive log₂ fold-change (FC) values indicate increased metabolite concentrations following UVC irradiation, whereas negative values indicate decreased concentrations. Each point represents one metabolite. Point color indicates the direction and magnitude of the log₂ fold change, with red representing an increase and blue representing a decrease following UVC irradiation. Point size reflects statistical significance, with larger points corresponding to smaller p-values. The horizontal dashed line indicates the significance threshold of p = 0.05 [−log₁₀(0.05) = 1.30], whereas the vertical dashed line at log₂ fold change = 0 indicates no change between the UVC(+) and UVC(−) groups. The numbers labeled “Up” and “Down” indicate the numbers of metabolites above the p = 0.05 threshold with positive and negative log₂ fold-change values, respectively. Statistical comparisons were performed using an unpaired two-tailed Student’s t-test. Each experimental group consisted of four independent biological replicates (n = 4).
Figure 5.
Volcano plot analysis of UVC-induced changes in intracellular metabolites. Volcano plots show changes in intracellular metabolite concentrations immediately after UVC irradiation in Ca9-22 (A), HGF (B), COLO 679 (C), and HDFa (D) cells. The x-axis represents the log₂ fold change, calculated as log₂[mean UVC(+)/mean UVC(−)], and the y-axis represents −log₁₀(p). Positive log₂ fold-change (FC) values indicate increased metabolite concentrations following UVC irradiation, whereas negative values indicate decreased concentrations. Each point represents one metabolite. Point color indicates the direction and magnitude of the log₂ fold change, with red representing an increase and blue representing a decrease following UVC irradiation. Point size reflects statistical significance, with larger points corresponding to smaller p-values. The horizontal dashed line indicates the significance threshold of p = 0.05 [−log₁₀(0.05) = 1.30], whereas the vertical dashed line at log₂ fold change = 0 indicates no change between the UVC(+) and UVC(−) groups. The numbers labeled “Up” and “Down” indicate the numbers of metabolites above the p = 0.05 threshold with positive and negative log₂ fold-change values, respectively. Statistical comparisons were performed using an unpaired two-tailed Student’s t-test. Each experimental group consisted of four independent biological replicates (n = 4).
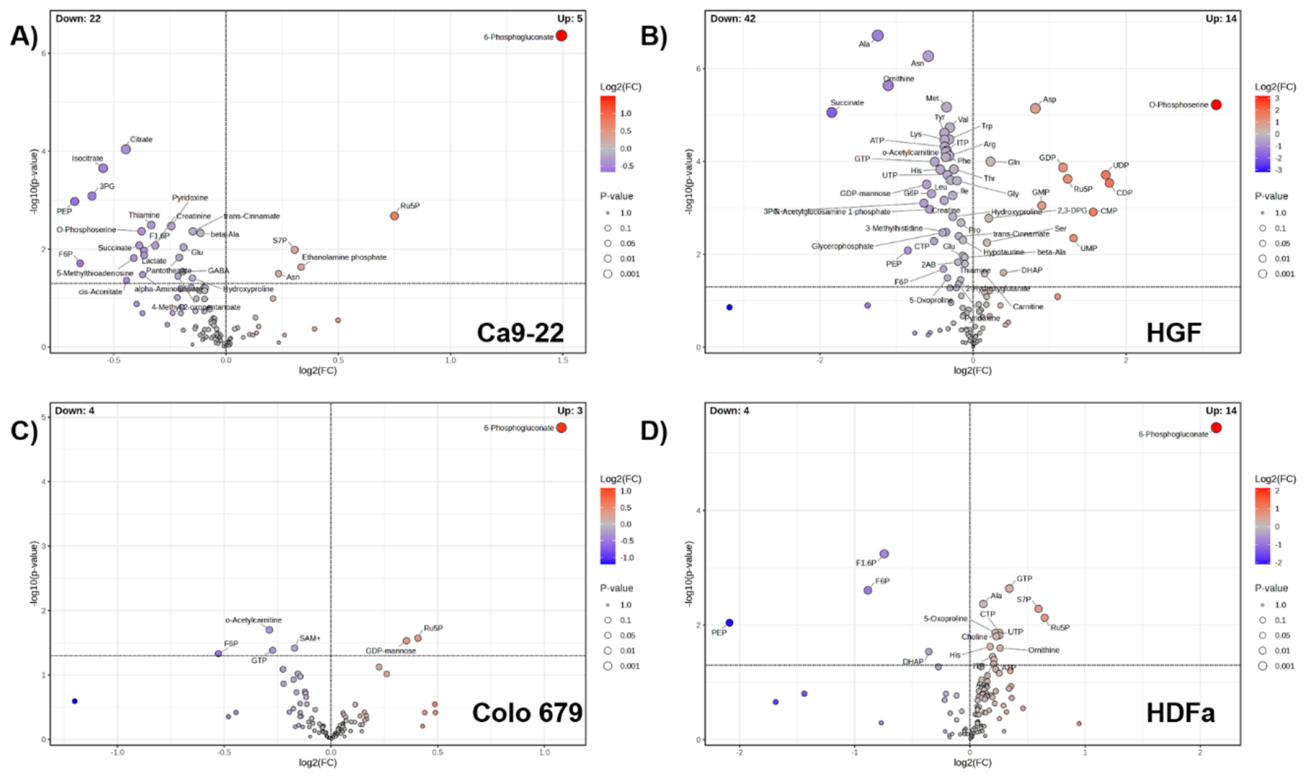
Figure 6.
Heatmap of UVC-induced changes in intracellular metabolites. For each metabolite, fold change was calculated from the mean intracellular concentrations in UVC-irradiated and non-irradiated cells as mean UVC(+)/mean UVC(−). The heatmap shows the direction and relative magnitude of the UVC-induced changes in Ca9-22, HGF, COLO 679, and HDFa cells. Metabolites that increased relative to the overall mean fold change are shown in red, whereas those that decreased are shown in blue. Each experimental group consisted of four independent biological replicates.
Figure 6.
Heatmap of UVC-induced changes in intracellular metabolites. For each metabolite, fold change was calculated from the mean intracellular concentrations in UVC-irradiated and non-irradiated cells as mean UVC(+)/mean UVC(−). The heatmap shows the direction and relative magnitude of the UVC-induced changes in Ca9-22, HGF, COLO 679, and HDFa cells. Metabolites that increased relative to the overall mean fold change are shown in red, whereas those that decreased are shown in blue. Each experimental group consisted of four independent biological replicates.
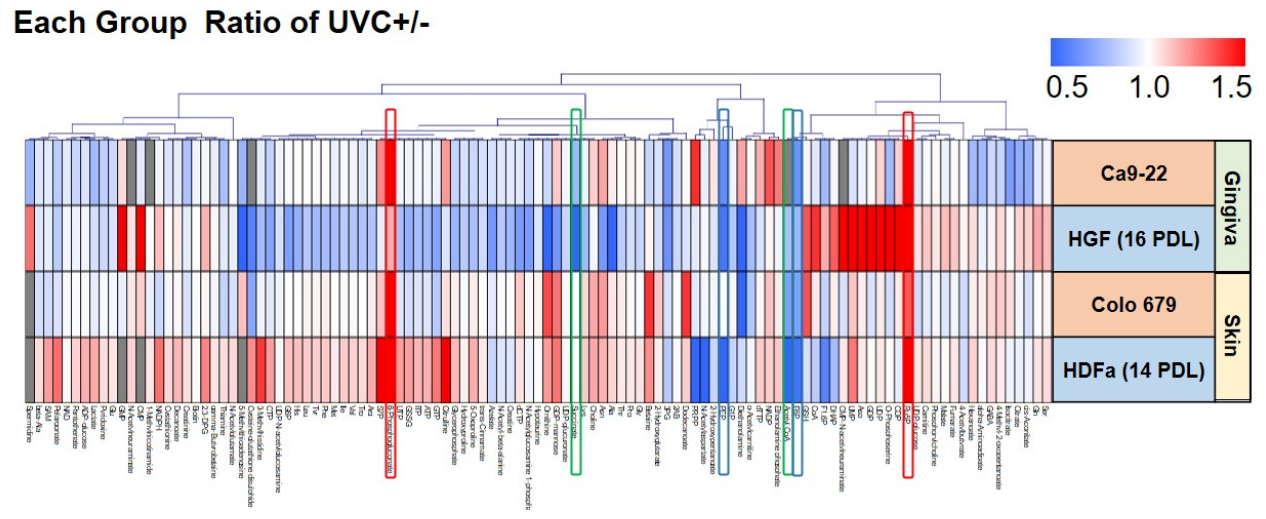
Figure 7.
Metabolites significantly altered immediately after UVC irradiation. Metabolites showing statistically significant changes after UVC irradiation are presented separately for Ca9-22 (A), HGF (B), COLO 679 (C), and HDFa (D) cells and are arranged by fold-change magnitude. Fold change was calculated as mean UVC(+)/mean UVC(−). Metabolites associated with the pentose phosphate pathway, glycolysis, and the TCA cycle are indicated in red, blue, and purple, respectively. Each experimental group consisted of four independent biological replicates. Statistical significance was determined by comparing individual metabolite concentrations in the UVC(+) and UVC(−) groups. Statistical significance was evaluated using an unpaired two-tailed Student’s t-test. p < 0.05.
Figure 7.
Metabolites significantly altered immediately after UVC irradiation. Metabolites showing statistically significant changes after UVC irradiation are presented separately for Ca9-22 (A), HGF (B), COLO 679 (C), and HDFa (D) cells and are arranged by fold-change magnitude. Fold change was calculated as mean UVC(+)/mean UVC(−). Metabolites associated with the pentose phosphate pathway, glycolysis, and the TCA cycle are indicated in red, blue, and purple, respectively. Each experimental group consisted of four independent biological replicates. Statistical significance was determined by comparing individual metabolite concentrations in the UVC(+) and UVC(−) groups. Statistical significance was evaluated using an unpaired two-tailed Student’s t-test. p < 0.05.
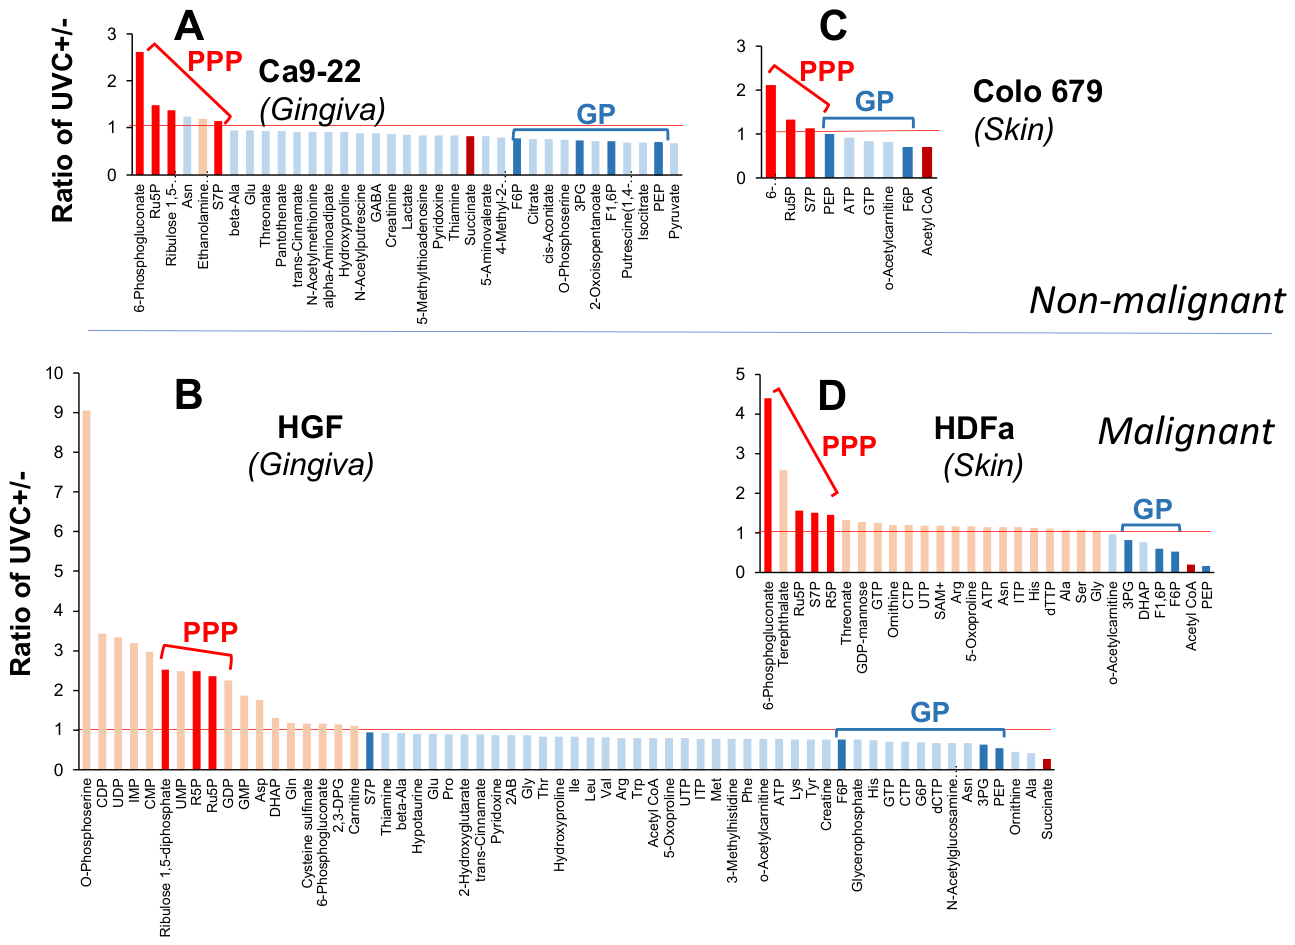
Figure 8.
Effects of UVC irradiation on representative intracellular metabolites. Intracellular concentrations of representative metabolites involved in the pentose phosphate pathway (A), glycolysis (B), the TCA cycle (C), glutathione metabolism (D), and nicotinamide coenzyme metabolism (E) were compared between non-irradiated and UVC-irradiated cells. Each experimental group consisted of four independent biological replicates. p < 0.05 for the comparison between the UVC(−) and UVC(+) groups. Blue and orange bars represent the UVC(−) and UVC(+) groups, respectively. Data are presented as the mean ± SD (n = 4). Statistical significance was evaluated using an unpaired two-tailed Student’s t-test. p < 0.05.
Figure 8.
Effects of UVC irradiation on representative intracellular metabolites. Intracellular concentrations of representative metabolites involved in the pentose phosphate pathway (A), glycolysis (B), the TCA cycle (C), glutathione metabolism (D), and nicotinamide coenzyme metabolism (E) were compared between non-irradiated and UVC-irradiated cells. Each experimental group consisted of four independent biological replicates. p < 0.05 for the comparison between the UVC(−) and UVC(+) groups. Blue and orange bars represent the UVC(−) and UVC(+) groups, respectively. Data are presented as the mean ± SD (n = 4). Statistical significance was evaluated using an unpaired two-tailed Student’s t-test. p < 0.05.
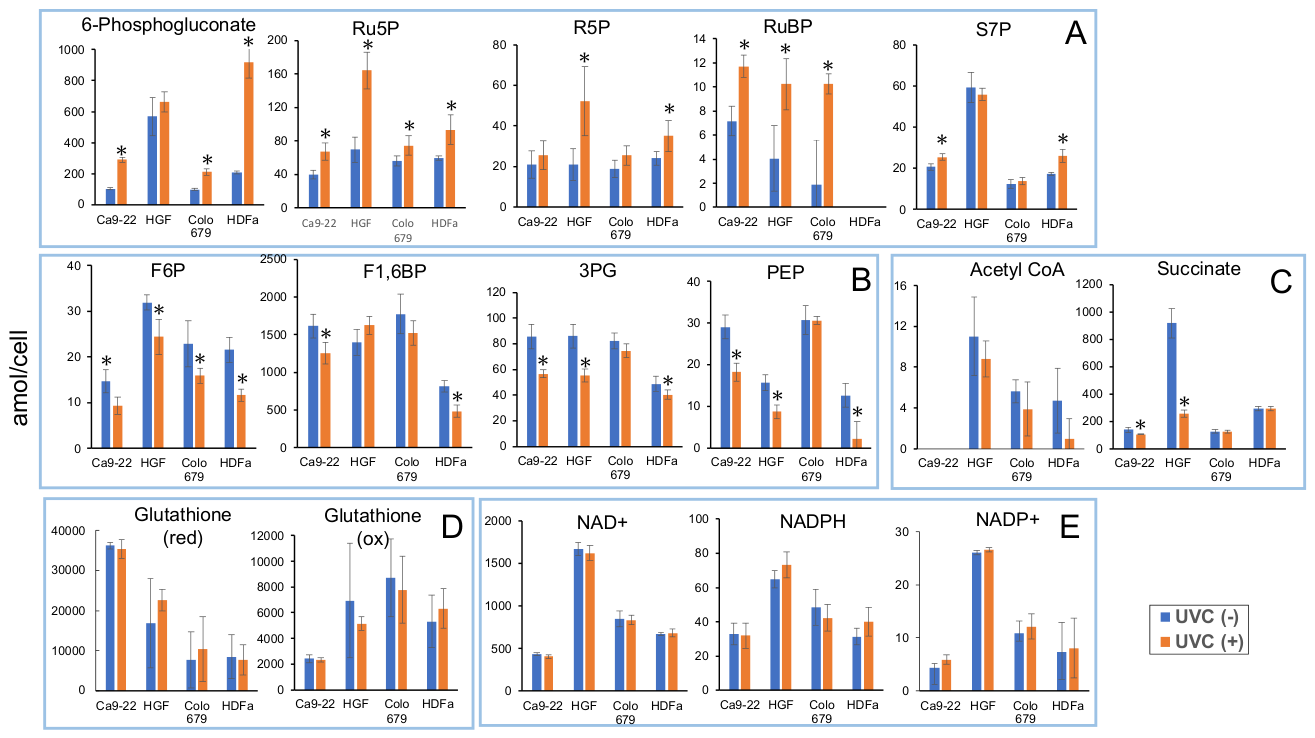
Figure 9.
UVC-induced changes in intracellular metabolites mapped onto major metabolic pathways. Changes in intracellular metabolite concentrations are shown within the pentose phosphate pathway (PPP), glycolytic pathway (GP), nucleotide synthesis pathways, and tricarboxylic acid (TCA) cycle. For each metabolite, fold change was calculated from the group mean concentrations as mean UVC(+)/mean UVC(−) and is presented as log₂ fold change. Positive values indicate increased metabolite concentrations following UVC irradiation, whereas negative values indicate decreased concentrations. The four bars for each metabolite represent Ca9-22, HGF, COLO 679, and HDFa cells, respectively, from left to right. Each experimental group consisted of four independent biological replicates (n = 4). Statistical comparisons between the UVC(−) and UVC(+) groups were performed using an unpaired two-tailed Student’s t-test applied to the individual metabolite concentrations. Error bars are not shown because each plotted value represents a log₂-transformed ratio calculated from the two group means rather than a mean of individually calculated fold changes. *p < 0.05, **p < 0.01, and ***p < 0.001.
Figure 9.
UVC-induced changes in intracellular metabolites mapped onto major metabolic pathways. Changes in intracellular metabolite concentrations are shown within the pentose phosphate pathway (PPP), glycolytic pathway (GP), nucleotide synthesis pathways, and tricarboxylic acid (TCA) cycle. For each metabolite, fold change was calculated from the group mean concentrations as mean UVC(+)/mean UVC(−) and is presented as log₂ fold change. Positive values indicate increased metabolite concentrations following UVC irradiation, whereas negative values indicate decreased concentrations. The four bars for each metabolite represent Ca9-22, HGF, COLO 679, and HDFa cells, respectively, from left to right. Each experimental group consisted of four independent biological replicates (n = 4). Statistical comparisons between the UVC(−) and UVC(+) groups were performed using an unpaired two-tailed Student’s t-test applied to the individual metabolite concentrations. Error bars are not shown because each plotted value represents a log₂-transformed ratio calculated from the two group means rather than a mean of individually calculated fold changes. *p < 0.05, **p < 0.01, and ***p < 0.001.
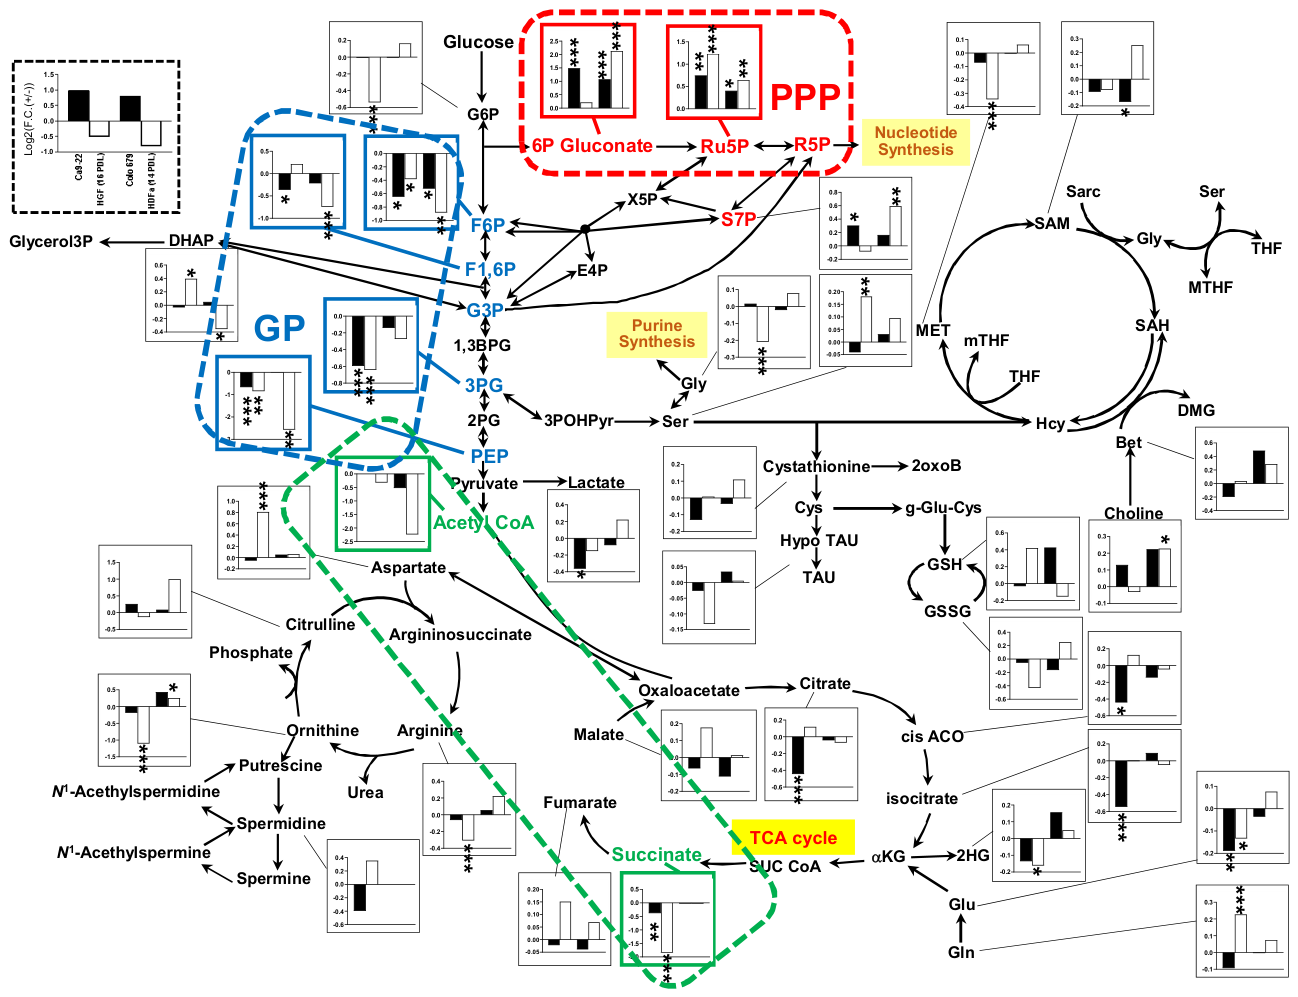

Table 1.
UVC irradiation conditions for malignant and non-malignant cells derived from gingiva (samples 1- 16) and skin (samples 17- 32).
Table 1.
UVC irradiation conditions for malignant and non-malignant cells derived from gingiva (samples 1- 16) and skin (samples 17- 32).
| Sample | Cell | Cell number /dish | UVC irradiation (3 min) |
|---|---|---|---|
| 1, 2, 3, 4 | Ca9-22 | 4.52 x 10⁶ | - |
| 5, 6, 7, 8 | Ca9-22 | 4.52 x 10⁶ | + |
| 9, 10, 11, 12 | HGF (16 PDL) (32% lifespan) | 2.19 x 10⁶ | - |
| 13, 14, 15, 16 | HGF (16 PDL) (32% lifespan) | 2.19 x 10⁶ | + |
| 17, 18, 19, 20 | Colo 679 | 2.30 x 10⁶ | - |
| 21, 22, 23, 24 | Colo 679 | 2.30 x 10⁶ | + |
| 25, 26, 27, 28 | HDFa (14 PDL) (25% lifespan) | 1.34 x 10⁶ | - |
| 29, 30, 31, 32 | HDFa (14 PDL) (25% lifespan) | 1.34 x 10⁶ | + |
Disclaimer/Publisher’s Note: The statements, opinions and data contained in all publications are solely those of the individual author(s) and contributor(s) and not of MDPI and/or the editor(s). MDPI and/or the editor(s) disclaim responsibility for any injury to people or property resulting from any ideas, methods, instructions or products referred to in the content. |
© 2026 by the authors. Licensee MDPI, Basel, Switzerland. This article is an open access article distributed under the terms and conditions of the Creative Commons Attribution (CC BY) license (http://creativecommons.org/licenses/by/4.0/).
Copyright: This open access article is published under a Creative Commons CC BY 4.0 license, which permit the free download, distribution, and reuse, provided that the author and preprint are cited in any reuse.