

Submitted:
31 August 2026
Posted:
02 September 2026
You are already at the latest version
Abstract
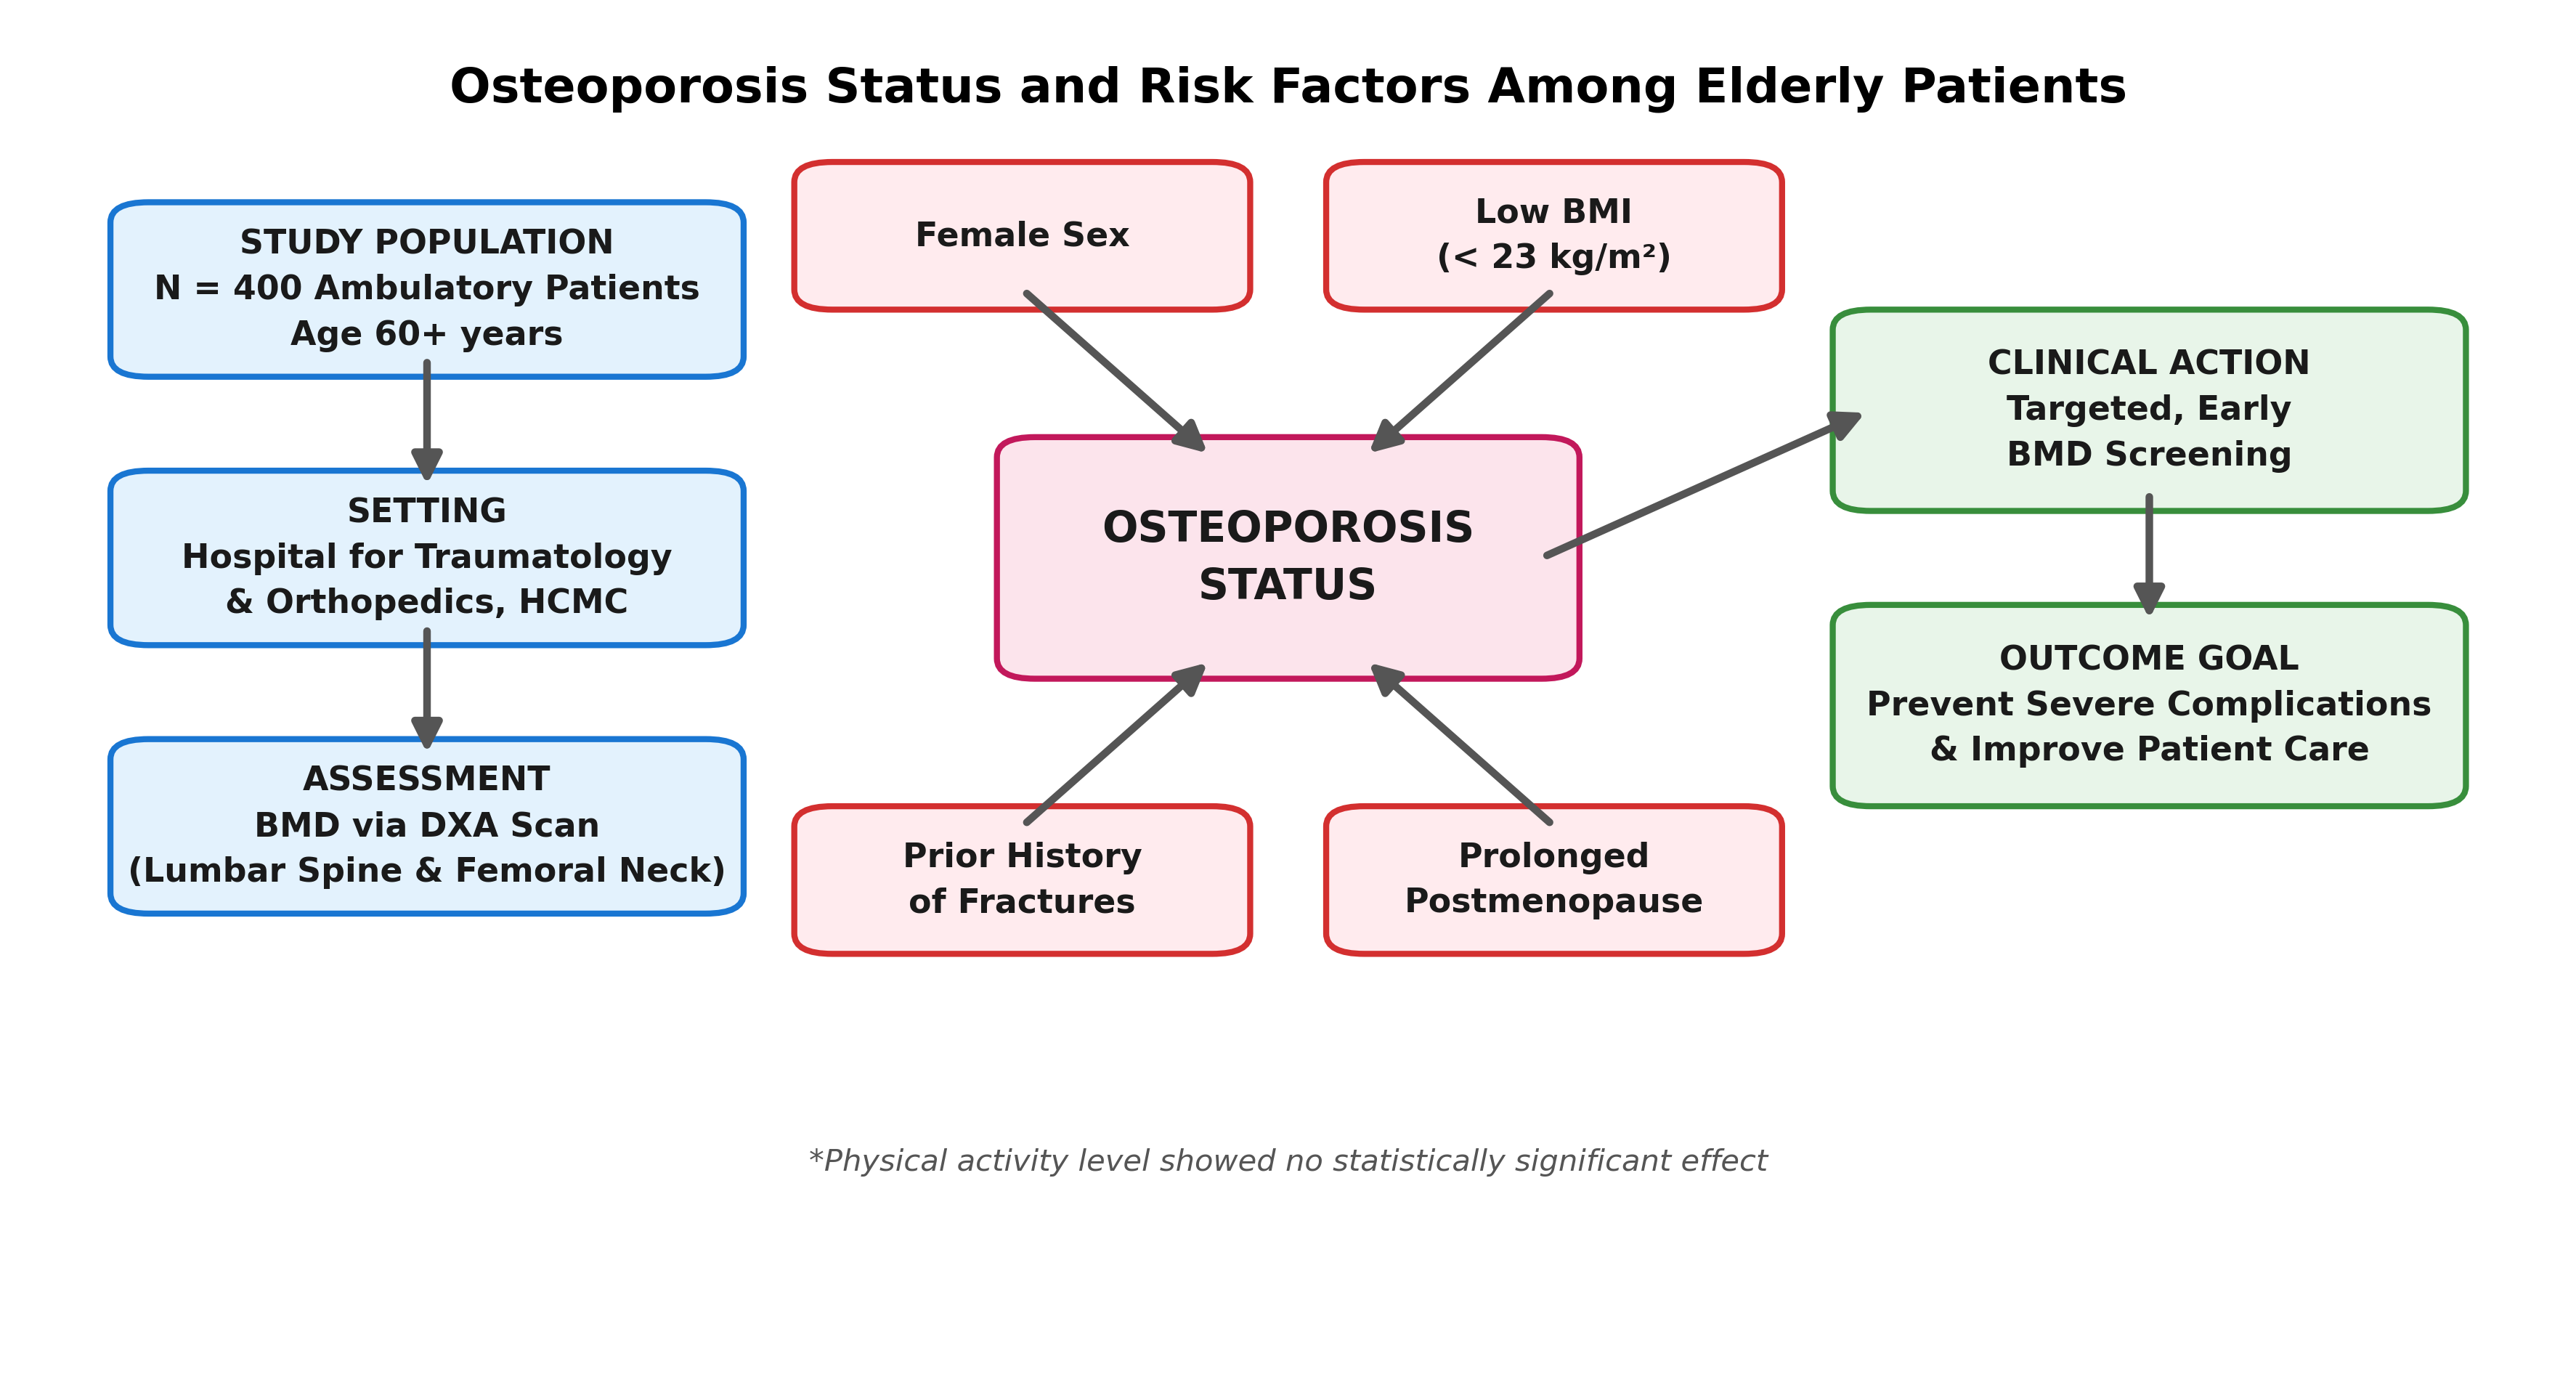
Background: Osteoporosis, is characterized by a compromise in bone strength, which is defined by a combination of bone mineral density (BMD) and bone quality. It is a common disease in the older people and undergo asymptomatic progression for years. One of the most severe complications of osteoporosis is fracture, which is not only diminishes the life quality of patients but also imposes a substantial burden on both families and health care systems. The survey of risk factors in this cohort shown that some factors truly contribute to the progress of osteoporosis, such as gender, body mass index (BMI) or the history of fractures. The results can prompt clinicians to conduct early screening and patient care and facilitate targeted interventions for older adults, who frequently present with multiple underlying comorbidities. Objectives: This study aimed to determine the prevalence of osteoporosis and identify associated risk factors among elderly patients. Methods: A cross-sectional descriptive study enrolled 400 ambulatory patients aged 60 years or older. BMD was measured at two anatomical sites: the femoral neck and the lumbar spine. Exclusion criteria comprised patients currently undergoing oncological therapy, as well as those with a history of or current treatment for osteoporosis. Results: Several risk factors that increase the likelihood of osteoporosis in the elderly include female sex, low body BMI < 23 kg/m² and a history of post-traumatic fractures. Female sex and low BMI were significantly associated with a higher prevalence of osteoporosis at both anatomy sites, whereas physical activity level showed no statistically significant effect. The duration postmenopause was significantly associated with an increased prevalence of osteoporosis at both the lumbar spine and femoral neck, exhibiting a progressive rise over time that peaked at age 30 years postmenopause. A history of fracture was significantly associated with osteoporosis status at both the lumbar spine and femoral neck, with a higher proportion of past fractures observed among participants with osteoporosis. (p < 0.05). Conclusions: This study emphasizes that female sex, low BMI, prolonged postmenopausal duration (age 30 years), and a prior history of fractures are significant clinical indicators of osteoporosis in the elderly. These findings highlight the critical need for targeted, early BMD screening programs prioritizing these high-risk groups to prevent severe osteoporotic complications and improve patient care.
Keywords:
osteoporosis
; lumbar spine
; femoral neck
; elderly people
; hospital for traumatology and orthopedics
; Vietnam
1. Introduction
Worldwide, more than 200 million people are estimated to be affected by osteoporosis [1]. In 2010, it was estimated that 27.5 million people had osteoporosis in five countries, including Germany, Italy, France, England and Spain [2]. In the United States, statistics indicate that more than 10 million individuals are affected by osteoporosis, while an additional up to 47 million have low bone density [3]. Osteoporosis arises from disrupted bone remodeling characterized by excessive bone resorption relative to bone formation [4]. Osteoporosis is classified into two types based on its cause: primary and secondary [5]. Primary osteoporosis is usually asymptomatic and often remains undetected until bone density loss is significant [6].
In adults, bone resorption and bone formation occur in balance. Following the attainment of peak bone mass, bone mass progressively declines with advancing age, although the rate of decline varies among individuals. Since estrogen and testosterone play essential roles in bone formation, changes in the levels of can significantly influence bone loss [7,8]. Accordingly, there are significant differences between men and women in the timing of osteoporosis onset. The risk factors of osteoporosis are highly diverse, including a calcium-deficient diet, poor nutrition, age, gender and irregular physical activity, making its prevention particularly challenging [9,10,11]. Therefore, the prevention of osteoporosis remains a major challenge for healthcare systems.
One of the most serious complications of osteoporosis is osteoporotic fracture. It is estimated that there are 37 million osteoporotic fractures worldwide each year among patients who are over 55, with three osteoporotic fractures occurring every three seconds [12]. The number of hip fractures is projected to increase from roughly 1.7 million in 1990 to 6.3 million by 2050, with the most substantial rise expected in Asia [13]. Osteoporotic fractures often result in chronic pain and disability, leading to increased dependence on care and higher mortality rates among affected individuals [14,15]. Due to increased life expectancy and socioeconomic development, osteoporosis has become a common health problem associated with substantial healthcare costs. It is predicted that by 2050, around 2.5 million cases of hip fractures will occur in Asia [16]. In the United Kingdom, the total cost of treating osteoporotic fractures accounted for approximately 2.4% of healthcare expenditure (equivalent to £5.4 billion) in 2019 [17].
In Vietnam, the prevalence of osteoporosis in women aged 50 years and older is 24.6%, which is 1.7 times higher than that in men. The rate of population aging is occurring rapidly and no elderly care models was implemented due to regional and cultural characteristics [18]. That is one of the factors contributing to the increasing prevalence of osteoporosis, causing many negative impacts on public health. Beyond their detrimental effects on quality of life, osteoporotic fractures impose substantial healthcare, economic, and social burdens on families and the broader society. Some studies on the Vietnamese population focus on postmenopausal women and men who are over 50 years old. It indicated that approximately one-third of women and one in ten men are at high risk of fracture [19]. However, the research using dual energy X-ray absorptiometry (DEXA) on both the lumbar spine and femoral neck is still limited. Furthermore, no research in Vietnam has characterized postmenopausal duration as a graded risk factor. To gain a deeper understanding of osteoporosis and the risk factors in Vietnam, this study was conducted to: (1) describe the prevalence of osteoporosis and (2) analyze several risk factors among elderly patients.
2. Materials and Methods
2.1. Data Collection and Participants Characteristics
The dataset was collected from the elderly patients who attended the Rheumatology Department of the Hospital for Traumatology and Orthopaedics from 2023 to 2025. The total of 400 patients was chose by the sample size equation.
Including criteria:
The patients who are:
- Above 60 years old.
- Able to ambulate independently.
- Agree to undergo all required paraclinical/laboratory investigations.
- Independently complete the interview questionnaire.
- Willingness to participate throughout the entire study period.
Exclusion criteria:
- Patients with psychiatric disorders, dementia, or cognitive impairment.
- Patients with a history or current diagnosis of bone diseases, including hyperparathyroidism, hypoparathyroidism, Paget’s disease, osteomalacia, renal osteodystrophy, osteogenesis imperfecta, bone metastases from cancer, evidence of renal failure, or a history of oophorectomy.
- Patients with a history of hip replacement or bilateral femoral neck fracture.
- Patients who are unable to move for BMD measurement.
- Patients for whom BMD measurement at the lumbar spine or femoral neck cannot be performed due to femoral head replacement, bilateral femoral neck fractures, or prior lumbar spine surgery.
Sample size
Where:
n: minimum sample size required for the study.
p: the estimated prevalence of osteoporosis among elderly patients visiting the Rheumatology Clinic at the Orthopedic and Trauma Hospital during the period 2023–2025. In this study, p = 0.5 was used because no previous study had been conducted at this hospital; this value also ensures the maximum sample size.
Z: the standard normal deviate corresponding to a 95% confidence level ( α= 0.05), where Z = 1.96.
d: the acceptable margin of error; in this study d = 0.05 was used.
Substituting these parameters into the formula yielded a minimum required sample size of 385 older participants.
Sampling method
Patients aged 60 years and older who visited the Rheumatology Clinic of the Hospital for Traumatology and Orthopedics and met the study inclusion criteria were recruited consecutively from October 2023 to March 2025, or until the required sample size was achieved.
2.2. Study Designs
A cross-sectional study was conducted. The structured questionnaire was designed some basic information such as general demographics, lifestyle habits and clinical characteristics. The general demographics comprises age, gender, occupational activity level. The clinical characteristics includes the medical records: history of fractures, postmenopausal record
Measurements
Body Max Index criteria
The Body Max Index (BMI) is calculated as this formula:
The BMI status was categorized according to the World Health Organization (WHO) Asia-Pacific regional criteria (2004), applying to both genders:
- BMI < 18.5 kg/m2 : Underweight
- 18.5 ≤ BMI < 23.0 kg/m2: Normal weight
- 23.0 ≤ BMI < 25 kg/m2: Overweight
- BMI ≥ 25 kg/m2: Obesity
Bone Mineral Density (BMD) measurements
DEXA is based on the principle of differential X-ray attenuation, which enables the quantification of bone mineral mass distinct from surrounding soft tissue. In this study, BMD was measured at the lumbar spine (L1–L4) and femoral neck. The bone mineral density was described by T-score, reported in standard deviation (SD) units.
Bone Mineral Density (BMD) criteria
The BMD was evaluated according to the WHO diagnostic criteria base on the T-score:
- T-score ≥ 1: Normal
- −2.5 < T-score < 1: Osteopenia
- T-score ≤ 2.5: Osteoporosis
- T-score ≤ 2.5 and fragility fracture: Severe osteoporosis
2.3. Statistics Analysis
The data was analyzed by R version 4.6.0 (R Foundation for Statistical Computing, Vienna, Austria. https://www.R-project.org/). The ratio observation is compared by Chi-squared test. Fisher’s exact test was used to compare proportions when the expected cell frequency was less than 5. Descriptive statistics, including mean values, standard deviations and percentages, were calculated.
Additionally, a multivariable logistic regression model was performed to evaluate the correlation between variables. The target outcome variable is binary, include non-osteoporosis (0) and osteoporosis (1). The model simultaneously includes the age, BMI value that was treated as a continuous variable and the history of fracture is also a categorical variable (“No” is the reference group):
logit(P(Y = 1)) = β0 + β1 (Age) + β2 (BMI group) + β3 (History of fracture Yes) + β4 (History of fracture Unknown)
3. Results
3.1. Baseline Characteristics of Participants
This study was conducted on a total of 400 patients, the majority of whom were female. The number of female patients was 7.89 times higher than that of males. The mean age of the study population was 66.88 ± 6.45, ranging from 60 to 96 years (Table 1).
In this study, the 60-69 age group was the most prevalent, accounting for 70.5% of the cohort, followed by the 70–79 age group at 25.5% and those aged 80 years or older at 4.0%. The prevalence of bone mineral density abnormalities differed significantly across anatomical sites: The prevalence of osteoporosis at the lumbar spine (29.75%) was higher than that at the femoral neck (6%). At the lumbar spine, it was observed a progressive increase in the prevalence of osteoporosis with advancing age. Specifically, the rates were 29.1% in the 60–69 age group, 28.4% in the 70–79 age group, and 50.0% in those aged 80 years or older. However, this baseline trend did not reach statistical significance (p > 0.05). On the other hand, at femoral neck, the prevalence of osteoporosis rose dramatically with age. The rates were 5.0% in the 60-69 group, 5.9% in the 70-70 group and 25.0% in the patients aged 80 or older. This difference was statistically significant across all three age cohorts (p <0.05) (Figure 1).
3.2. Risk Factors of Osteoporosis
3.2.1. Sex, BMI and Physical Activity
At the lumbar spine, both BMI and sex are significantly associated with bone density. The prevalence of osteoporosis in females (95.8%) was significantly higher than in males (4.2%), and this difference was statistically significant (p < 0.05); the patients with a BMI < 23 account for 51.26% of the osteoporosis group, compared to only 31.09% in the normal group. However, at the femoral neck, the prevalence of osteoporosis was not recorded in males, while 24 cases were recorded in females (p > 0.05). In addition, with the patients whose BMI > 23, it was demonstrated that the osteoporosis rate is lower than the group with BMI < 23 (p < 0.05) at lumbar spine and femoral neck. Regarding the physical activity factor, it was observed the high ratio of osteoporosis in patients who have less activity, rather than active group, but this difference was not statistically significant (p > 0.05) at either the lumbar spine or the femoral neck (Table 1).
3.2.2. Postmenopausal Period and Osteoporosis
It was observed that the duration of time elapsed since menopause is a critical factor of bone density. At the lumbar spine, the prevalence of osteoporosis increases continuously across all categories. Patients less than 10 years postmenopause demonstrate a 21.0% prevalence, which more than triples to 61.5% in patients who are 30 or more years postmenopause. Similar to the lumbar spine, at the femoral neck, it was shown the onset of osteoporosis appears lagged. The prevalence of osteoporosis remains low initially for < 10 years, then rising to 3.8% in the 10-19 years group and finally, increase dramatically to 19.2% after ≥ 30 years postmenopause (Figure 2). This relationship is confirmed by Chi-square test with p-value < 0.05 at both anatomy sites.
3.2.3. History of Fracture and Osteoporosis Status
The association between a history of fracture and bone mineral density status at the lumbar spine and femoral neck was analyzed (Table 2). At the lumbar spine, a history of fracture was significantly associated with bone status (p < 0.05). Among the participants, those with a history of fracture accounted for 28.57% of the non-osteoporosis group, 57.14% had no history of fracture, and 14.29% had an unknown status, compared to 16.73%, 68.33%, and 14.95% in the non-osteoporosis group, respectively.
Similarly, a statistically significant association was observed at the femoral neck (p < 0.05, Fisher's exact test). In this region, individuals with a history of fracture accounted for 45.83% of the osteoporosis group compared to only 18.62% of the non-osteoporosis group. Conversely, those without a fracture history represented 54.17% and 65.69% of the osteoporosis and non-osteoporosis groups, respectively, while an unknown fracture status accounted for 0.00% and 15.69%.
3.3. A Multivariable Logistic Regression
To evaluate the independent factors associated with osteoporosis at the lumbar spine, a multivariable logistic regression analysis was conducted. In this regression model (N = 400), history of fracture and BMI were significantly associated with osteoporosis at the lumbar spine. Specifically, patients with a history of fracture had 86% higher odds of having osteoporosis compared to those without fracture history (adjusted OR = 1.86, 95% CI: 1.09 - 3.17, p = 0.022). Conversely, higher BMI served as an independent protective factor, with each unit increase in BMI associated with an 11% reduction in the odds of osteoporosis (adjusted OR = 0.89, 95% CI: 0.83 - 0.95, p < 0.001). No statistically significant association was observed for age (aOR = 1.01, p = 0.455) or the unknown fracture status category (aOR = 1.08, p = 0.815) (Figure 3, Table 3).
4. Discussion
The mean age of the patients was 66.88 ± 6.5 years. The most predominant age group was 60–69 years, accounting for 70.5% of the study population, followed by 70–79 years (25.5%) and age 80 years (4.0%). The percentage of female participants is significantly higher than that of male participants. This number partly reflects broader community trends, where females are more likely to undergo screening and follow-up care than males [20,21].
The study showed that the percentage of osteoporosis inthe lumbar spine is higher than that in the femoral neck. This result is consistent with the literature: the lumbar spine, comprising the L1–L4 vertebrae, consists predominantly of trabecular bone [22]. The trabecular bone exhibits a greater rate of annual bone loss compared to cortical bone due to its higher metabolic turnover, thereby accounting for the earlier manifestation of osteoporosis in the lumbar spine relative to the femoral neck [23]. The BMD was associated with both sex and BMI. Females constituted the vast majority of patients in the osteoporosis group compared to males. Furthermore, the patients with low BMI represented a higher proportion of the osteoporosis group than the normal bone density group. The time elapsed since menopause was identified as an important determinant of BMD. At the lumbar spine, the prevalence of osteoporosis increased progressively with increasing years since menopause. A similar pattern was observed at the femoral neck, although the increase appeared to occur at a later stage. The association between years since menopause and osteoporosis prevalence was statistically significant at both anatomical sites, as demonstrated by the chi-square test (p < 0.05). At the lumbar spine, fracture history was significantly associated with bone status. Among participants with osteoporosis, 28.57% had a history of fracture, 57.14% had no history of fracture, and 14.29% had an unknown fracture status. The same association was observed at the femoral neck, where 45.83% of participants with osteoporosis had a history of fracture, compared with 18.62% of those without osteoporosis.
This study still has some limitations, such as the relatively short timeline, the number of male participations and the data remain susceptible to recall bias, which is inherently common among elderly cohorts. The disparity in the male-to-female ratio constitutes a notable limitation.
5. Conclusions
Osteoporosis is a crucial public health concern among elderly adults and a leading cause of fragility fractures. It affects quality of life, reduces life expectancy and places considerable financial pressure on healthcare systems globally. Consequently, early identification of risk factors, prompt diagnosis and appropriate therapeutic intervention are paramount to mitigating fracture incidence and optimizing patient outcomes. The findings of this study underscore that targeted osteoporosis screening among high-risk patient populations can facilitate early detection and guide prophylactic strategies to prevent fractures. Crucially, many lower-tier hospitals lack DEXA equipment, so healthcare providers should maintain high clinical vigilance for osteoporotic vertebral fractures and expedite spinal imaging to establish a definitive diagnosis. Therefore, enhancing osteoporosis surveys in the older population is necessary, especially among postmenopausal women and all individuals older than 50 years.
Author Contributions
Conceptualization, T.H. Le, D.Q. Pham; methodology, T.H. Le, H.A. Dai; validation, T.H. Le, H.A. Dai, D.Q. Pham; formal analysis, T.H. Le, D.Q. Pham; investigation, T.H. Le, H.A. Dai, D.Q. Pham; resources, T.H. Le; data curation, T.H. Le, H.A. Dai; writing—original draft preparation, T.H. Le, D.Q. Pham; writing—review and editing, T.H. Le, H.A. Dai, D.Q. Pham; visualization, D.Q. Pham; supervision, H.A. Dai; project administration, T.H. Le, D.Q. Pham. All authors have read and agreed to the published version of the manuscript.
Funding
This research received no external funding.
Institutional Review Board Statement
This study was approved by Institutional Biomedical Research Ethics Committee of Hospital for Traumatology and Orthopedics (Approval No. 17/HĐĐĐ-BVCTCH, dated October 27th, 2023).
Informed Consent Statement
Informed consent was obtained from all subjects involved in the study. All the patients were informed and clearly explained the purpose of the study. Participation was entirely voluntary and individuals retained the right to decline participation or withdraw from the study at any time without consequence. Strict confidentiality was maintained for all participant data, which were used exclusively for research purposes. Furthermore, all physical examination and laboratory findings were communicated to the participants to keep them informed of their health status.
Data Availability Statement
The datasets analyzed during the current study are not publicly available due to ethical reasons but are available from the corresponding author on reasonable request. Please contact Duy Quang Pham at pdquang@ntt.edu.vn for further information.
Acknowledgments
During the preparation of this manuscript, the authors used ChatGPT for the purposes of language editing and grammar polishing. The authors have reviewed and edited the output and take full responsibility for the content of this publication.
Conflicts of Interest
The authors declare no conflicts of interest.
Abbreviations
The following abbreviations are used in this manuscript:
| BMD | Bone Mineral Density |
| BMI | Body Mass Index |
| DEXA | Dual Energy X-ray Absorptiometry |
| WHO | World Health Organization |
References
- Reginster, J.-Y.; Burlet, N. Osteoporosis: A still increasing prevalence. Bone 2006, 38((2), Supplement 1):4–9. [Google Scholar] [CrossRef] [PubMed]
- Hernlund, E.; Svedbom, A.; Ivergard, M.; Compston, J.; Cooper, C.; Stenmark, J.; et al. Osteoporosis in the European Union: medical management, epidemiology and economic burden. A report prepared in collaboration with the International Osteoporosis Foundation (IOF) and the European Federation of Pharmaceutical Industry Associations (EFPIA). Arch. Osteoporos. 2013, 8(1), 136. [Google Scholar] [PubMed]
- Looker, A.C.; Sarafrazi Isfahani, N.; Fan, B.; Shepherd, J.A. Trends in osteoporosis and low bone mass in older US adults, 2005–2006 through 2013–2014. Osteoporos. Int. 2017, 28(6), 1979–88. [Google Scholar] [CrossRef] [PubMed]
- Rachner, T.D.; Khosla, S.; Hofbauer, L.C. Osteoporosis: now and the future. The Lancet 2011, 377(9773), 1276–87. [Google Scholar] [CrossRef] [PubMed]
- Sözen, T.; Özışık, L.; Başaran, N.Ç. An overview and management of osteoporosis. Eur. J. Rheumatol. 2016, 4(1), 46. [Google Scholar] [PubMed]
- Elias, N.; Ribeiro, J.E.G.; Campinho, L.A.; Reis, C.; Elias, L.A.M.S.; Labronici, P.J. Review of osteoporotic fractures: occurrence, prevention, and consequences. Rev. Bras. De Ortop. 2025, 60(02), 001–8. [Google Scholar] [CrossRef] [PubMed]
- Fink, H.A.; Ewing, S.K.; Ensrud, K.E.; Barrett-Connor, E.; Taylor, B.C.; Cauley, J.A.; et al. Association of testosterone and estradiol deficiency with osteoporosis and rapid bone loss in older men. J. Clin. Endocrinol. Metab. 2006, 91(10), 3908–15. [Google Scholar] [CrossRef] [PubMed]
- Krum, S.A.; Brown, M. Unraveling estrogen action in osteoporosis. Cell Cycle 2008, 7(10), 1348–52. [Google Scholar] [CrossRef] [PubMed]
- Chintham, S.; S, M.; Periasamy, P.; Gopalakrishnan, S. Exploring Women's Knowledge of Nutrition and Bone Health: A Preventive Focus on Osteoporosis. Cureus 2025, 17(5), e83722. [Google Scholar] [CrossRef] [PubMed]
- Altın, E.; Karadeniz, B.; Türkyön, F.; Baldan, F.; Akkaya, N.; Şimşir Atalay, N.; et al. The comparison of knowledge level and awareness of ostoporosis between women and men. 2014. [Google Scholar] [CrossRef]
- Pouresmaeili, F.; Kamalidehghan, B.; Kamarehei, M.; Goh, Y.M. A comprehensive overview on osteoporosis and its risk factors. Ther. Clin. Risk Manag. 2018, 14(null), 2029–49. [Google Scholar] [CrossRef] [PubMed]
- Global, regional, and national burden of bone fractures in 204 countries and territories, 1990-2019: a systematic analysis from the Global Burden of Disease Study 2019. Lancet Healthy Longev. 2021, 2(9), e580–e92. [CrossRef] [PubMed]
- Cooper, C.; Campion, G.; Melton, L.J. Hip fractures in the elderly: A world-wide projection. Osteoporos. Int. 1992, 2(6), 285–9. [Google Scholar] [CrossRef] [PubMed]
- Lorentzon, M.; Johansson, H.; Harvey, N.C.; Liu, E.; Vandenput, L.; McCloskey, E.V.; et al. Osteoporosis and fractures in women: the burden of disease. Climacteric 2022, 25(1), 4–10. [Google Scholar] [CrossRef] [PubMed]
- Catalano, A.; Martino, G.; Morabito, N.; Scarcella, C.; Gaudio, A.; Basile, G.; et al. Pain in Osteoporosis: From Pathophysiology to Therapeutic Approach. Drugs Aging 2017, 34(10), 755–65. [Google Scholar] [CrossRef] [PubMed]
- Cheung, C.L.; Ang, S.B.; Chadha, M.; Chow, E.S.; Chung, Y.S.; Hew, F.L.; et al. An updated hip fracture projection in Asia: The Asian Federation of Osteoporosis Societies study. Osteoporos. Sarcopenia 2018, 4(1), 16–21. [Google Scholar] [CrossRef] [PubMed]
- National Osteoporosis Guideline Group. Section 2: Introduction to osteoporosis and fragility fractures; National Osteoporosis Guideline Group (NOGG), 2021. [Google Scholar]
- Nguyen, L.T.; Nantharath, P.; Kang, E.G. The Sustainable Care Model for an Ageing Population in Vietnam: Evidence from a Systematic Review. Sustainability-Basel 2022, 14(5). [Google Scholar] [CrossRef]
- Hoang, D.K.; Doan, M.C.; Mai, L.D.; Ho-Le, T.P.; Ho-Pham, L.T. Burden of osteoporosis in Vietnam: An analysis of population risk. PLoS ONE 2021, 16(6), e0252592. [Google Scholar] [CrossRef] [PubMed]
- Li, Q.; Yang, J.; Tang, Q.; Feng, Y.; Pan, M.; Che, M.; et al. Age-dependent gender differences in the diagnosis and treatment of osteoporosis during hospitalization in patients with fragility fractures. BMC Geriatr. 2023, 23(1), 728. [Google Scholar] [CrossRef] [PubMed]
- De Martinis, M.; Sirufo, M.M.; Polsinelli, M.; Placidi, G.; Di Silvestre, D.; Ginaldi, L. Gender Differences in Osteoporosis: A Single-Center Observational Study. World J. Mens. Health 2021, 39(4), 750–9. [Google Scholar] [CrossRef] [PubMed]
- Lu, Y.-C.; Lin, Y.C.; Lin, Y.-K.; Liu, Y.-J.; Chang, K.-H.; Chieng, P.-U.; et al. Prevalence of Osteoporosis and Low Bone Mass in Older Chinese Population Based on Bone Mineral Density at Multiple Skeletal Sites. Sci. Rep. 2016, 6(1), 25206. [Google Scholar] [CrossRef] [PubMed]
- Chen, H.; Zhou, X.; Fujita, H.; Onozuka, M.; Kubo, K.-Y. Age-related changes in trabecular and cortical bone microstructure. Int. J. Endocrinol. 2013, 2013(1), 213234. [Google Scholar] [CrossRef] [PubMed]
Figure 1.
(A) Overall patient distribution by age category. (B) and (C) The prevalence of bone status diagnoses at the lumbar spine and femoral neck across age groups, respectively.
Figure 1.
(A) Overall patient distribution by age category. (B) and (C) The prevalence of bone status diagnoses at the lumbar spine and femoral neck across age groups, respectively.
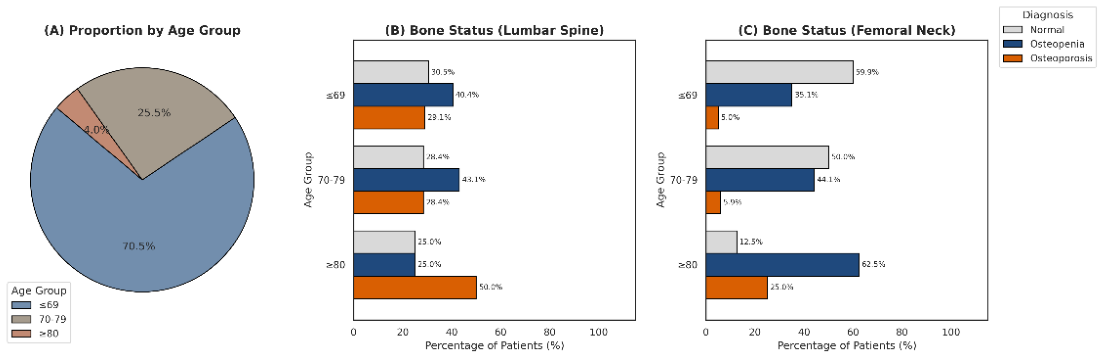
Figure 2.
Distribution of bone status diagnoses across postmenopausal duration categories at: (A) lumbar spine. (B) femoral neck.
Figure 2.
Distribution of bone status diagnoses across postmenopausal duration categories at: (A) lumbar spine. (B) femoral neck.
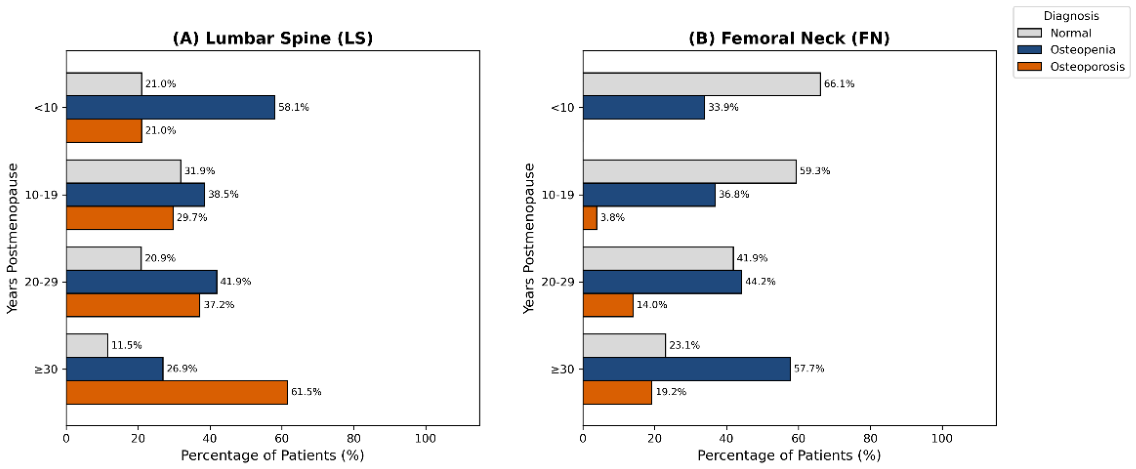
Figure 3.
Multivariable logistic regression analysis of risk factors associated with osteoporosis.
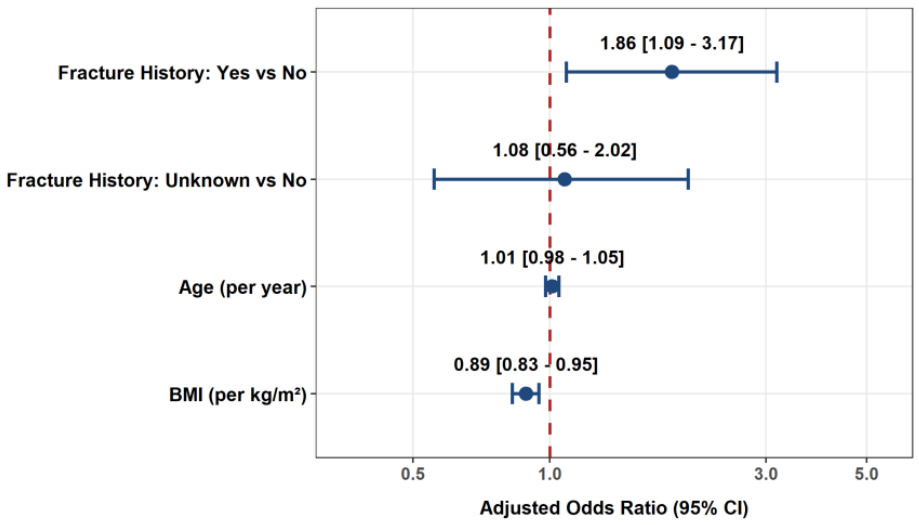

Table 1.
The baseline characteristics of participants.
| Variables | Total (N=400) |
Lumbar spine | p-value | Femoral neck | p-value | ||||
|---|---|---|---|---|---|---|---|---|---|
| Normal(%) | Osteopenia n (%) |
Osteoporosis n (%) |
Normal(%) | Osteopenia n (%) |
Osteoporosis n (%) |
||||
| Ages (years) | 66.88 ± 6.45 | 119 (29.75) | 162 (40.50) | 119 (29.75) | 0.5287* | 222 (55.50) | 154 (38.50) | 24 (6.00) | 0.0005* |
| ≤ 69 | 282 (70.50) | 86 (72.27) | 114 (70.37) | 82 (68.91) | 169 (76.13) | 99 (64.29) | 14 (58.33) | ||
| 70 -79 | 102 (25.50) | 29 (24.37) | 44 (27.16) | 29 (24.37) | 51 (22.97) | 45 (29.22) | 6 (25.00) | ||
| ≥ 80 | 16 (4.00) | 4 (3.36) | 4 (2.47) | 8 (6.72) | 2 (0.90) | 10 (6.49) | 4 (16.67) | ||
| Sex | 9.145e-06 | 0.0275* | |||||||
| Male | 45 (11.25) | 27 (22.69) | 13 (8.02) | 5 (4.20) | 32 (14.41) | 0 (0) | |||
| Female | 355 (88.75) | 92 (77.31) | 149 (91.98) | 114 (95.80) | 190 (85.59) | 141 (91.56) | 24 (100) | ||
| BMI | 0.0029 | 0.0001 | |||||||
| < 23 | 155 (38.75) | 37 (31.09) | 57 (35.19) | 61 (51.26) | 69 (31.08) | 69 (44.81) | 17 (70.83) | ||
| ≥ 23 | 245 (61.25) | 82 (68.91) | 105 (64.81) | 58 (48.74) | 153 (68.92) | 85 (55.19) | 7 (29.17) | ||
| Physical activity factor | 0.6652 | 0.8473 | |||||||
| Sedentary | 97 (24.25) | 29 (24.37) | 36 (22.22) | 32 (26.89) | 56 (25.23) | 36 (23.38) | 5 (20.83) | ||
| Active | 303 (75.75) | 90 (75.63) | 126 (77.78) | 87 (73.11) | 166 (74.77) | 118 (76.62) | 19 (79.17) | ||
* Using Fisher because FN has sample value < 5.
Table 2.
Association between fracture history and osteoporosis status at the lumbar spine and femoral neck.
Table 2.
Association between fracture history and osteoporosis status at the lumbar spine and femoral neck.
| Variables | Total (N=400) | Lumbar spine | p-value | Femoral neck | p-value | ||
|---|---|---|---|---|---|---|---|
| Non-osteoporosis n (%) |
Osteoporosis n (%) |
Non-osteoporosis n (%) |
Osteoporosis n (%) |
||||
| History of fracture | 0.024 | 0.002* | |||||
| Yes | 81 (20.25) | 47 (16.73) | 34 (28.57) | 70 (18.62) | 11 (45.83) | ||
| No | 260 (65) | 192 (68.33) | 68 (57.14) | 247 (65.69) | 13 (54.17) | ||
| Unknown | 59 (14.75) | 42 (14.95) | 17 (14.29) | 59 (15.69) | 0 | ||
* Fisher’s exact test.
Table 3.
Odds ratios and 95% confidence intervals for factors associated with osteoporosis.
| Characteristics | OR | 95% CI | p-value |
|---|---|---|---|
| Fracture_3groups | |||
| No | --- | --- | |
| Yes | 1.86 | 1.09 – 3.17 | 0.022 |
| Unknown | 1.08 | 0.56 – 2.02 | 0.8 |
| Age | 1.01 | 0.98 – 1.05 | 0.5 |
| BMI | 0.89 | 0.83 – 0.95 | < 0.001 |
| Abbreviations: CI = Confidence Interval, OR = Odds Ratio | |||
Disclaimer/Publisher’s Note: The statements, opinions and data contained in all publications are solely those of the individual author(s) and contributor(s) and not of MDPI and/or the editor(s). MDPI and/or the editor(s) disclaim responsibility for any injury to people or property resulting from any ideas, methods, instructions or products referred to in the content. |
© 2026 by the authors. Licensee MDPI, Basel, Switzerland. This article is an open access article distributed under the terms and conditions of the Creative Commons Attribution (CC BY) license (http://creativecommons.org/licenses/by/4.0/).
Copyright: This open access article is published under a Creative Commons CC BY 4.0 license, which permit the free download, distribution, and reuse, provided that the author and preprint are cited in any reuse.