

Submitted:
21 September 2026
Posted:
22 September 2026
You are already at the latest version
Abstract
Background: Oral frailty is a multidimensional condition associated with physical frailty, malnutrition, and adverse health outcomes in older adults. Although the Oral Frailty 5-item checklist (OF-5) is useful for screening, its binary classification may not capture the heterogeneous patterns of oral functional decline. The Oral Frailty 20-item Checklist (OF-20) was designed to provide a more detailed, domain-specific characterization of oral frailty while complementing, rather than replacing, the existing screening tool.Methods: This cross-sectional study included 297 older outpatients (138 men and 159 women; mean age, 77.5 ± 7.5 years) attending internal medicine clinics in Japan. The OF-20 comprises five domains: speech and social communication; dentition and masticatory function; eating and swallowing; nutritional status, appetite, and general condition; and oral dryness and oral hygiene. Associations between domain scores and demographic characteristics, physical function, laboratory parameters, and comorbidities were examined, with analyses stratified by sex.Results: Based on the conventional OF-5 criterion (score ≥2), 117 participants (39.4%) were classified as having oral frailty. However, OF-20 scores varied substantially among these participants, indicating heterogeneity not captured by the binary OF-5 classification. Higher scores in several domains were associated with older age, lower body weight, reduced grip strength, lower hemoglobin levels, and impaired renal function. The nutritional status, appetite, and general condition domain was associated with lower body weight in both sexes. The eating and swallowing domain was also associated with malignancy and respiratory disease, particularly among women.Conclusions: The OF-20 provides an exploratory, multidimensional profile of oral and systemic vulnerability that may complement the simple screening approach of the OF-5. These findings suggest that oral frailty may comprise heterogeneous patterns of vulnerability. Further studies are needed to develop the OF-20 into a screening tool that comprehensively evaluates frailty and oral frailty.
Keywords:
oral frailty
; multidisciplinary care
; comorbidities
; older adults
; outpatients
Introduction
Oral frailty has recently gained increasing attention as an early stage of oral functional decline that may precede physical frailty, sarcopenia, malnutrition, and disability in older adults [1]. A joint statement by three Japanese academic societies emphasized that subtle impairments in oral function, including reduced masticatory ability, swallowing difficulty, and articulation problems, may contribute to adverse systemic outcomes [2]. Therefore, early identification of oral frailty is considered important for preventing deterioration in both oral and general health [3].
In Japan, questionnaires have been developed for the assessment of oral frailty. The Oral Frailty Index-8 (OFI-8) was initially developed [4], and we previously reported its associations with blood biomarkers and physical measures [5]. A more concise Oral Frailty 5-item checklist (OF-5) was subsequently developed to facilitate simpler and more practical assessment [6]. The OF-5 ultimately served as the basis for the joint statement issued by three academic societies. We previously validated the OF-5 and OFI-8 as simple and highly concordant screening tools for oral frailty in Japanese outpatients [7]. Oral frailty assessed using the OF-5 was associated with reduced muscle mass, impaired physical function, subsequent frailty progression, and sex-specific differences in associations with physical and biological markers [8]. These findings highlight the potential of subjective oral assessments for identifying systemic health risks and supporting tailored geriatric care. Although the OF-5 has been adopted as a practical screening tool and forms the basis of current consensus-based criteria for oral frailty [2,6], its limited number of items may not fully capture the multidimensional nature of oral dysfunction, particularly aspects related to social interaction, appetite, dietary behavior, and oral hygiene. To address these limitations, the Oral Frailty 20-item Checklist (OF-20) was developed to comprehensively assess both oral function and general health status. In the present study, we conducted a preliminary investigation using the OF-20.
The OF-20 expands on the conventional OF-5 by covering five domains: 1) speech and social communication, 2) dentition and masticatory function, 3) eating and swallowing function, 4) nutritional status, appetite and general condition, and 5) oral dryness and oral hygiene. This multidimensional approach allows for a more detailed and quantitative evaluation of oral frailty.
The present study aimed to characterize the distribution of OF-20 scores and explore their associations with clinical characteristics, physical function, and laboratory markers in outpatients attending general internal medicine clinics. Rather than serving as a formal validation study, this exploratory phenotyping study investigated whether the OF-20 could capture heterogeneous patterns of oral and systemic vulnerability beyond the binary classification provided by the OF-5. The findings are intended to generate hypotheses regarding the potential utility of the OF-20 as a comprehensive assessment tool and to inform future studies evaluating its reliability, construct validity, and predictive validity.
Materials and Methods
This cross-sectional study included consecutive outpatients seen at the Department of Internal Medicine, Osaka Dental University Hospital, and the Department of Nephrology and Hypertension, National Cerebral and Cardiovascular Center, between 02/07/2025 and 20/05/2026. A total of 297 patients (138 men and 159 women) were included in the analysis. Data was obtained during the period from 04/06/2026, to 11/06/2026. The mean age of the study population was 77.5 ± 7.5 years.
Oral frailty was assessed using the newly developed Oral Frailty 20-item Checklist (OF-20), which was designed to expand upon the conventional Oral Frailty 5-item checklist (OF-5). The OF-20 was developed by the Sakai District Dental Association of Fukui Prefecture and presented at the 2025 Annual Meeting of the Japanese Society of Gerodontology [9,10]. The aim of this study was to explore the OF-20 as a multidimensional extension of the established OF-5, designed to provide a more detailed, domain-specific characterization of oral frailty rather than to replace the existing screening tool. The five OF-5 items were retained as core items, and the content of the existing OF-5 questionnaire was reviewed to identify clinically relevant aspects of oral and systemic vulnerability that were insufficiently represented by the OF-5, particularly social communication, dietary behavior, nutritional status, appetite, and oral hygiene. Based on this content-based review, five domains were defined: 1) speech and social communication, 2) dentition and masticatory function, 3) eating and swallowing function, 4) nutritional status, appetite and general condition, and 5) oral dryness and oral hygiene. Additional items were selected for each domain based on clinical relevance, complementarity with the OF-5 items, and feasibility for routine outpatient use, resulting in 15 supplementary items and a total of 20 items in the OF-20. Thus, the OF-20 comprises five domains, each containing four items, with domain scores ranging from 0 to 4. Items ①, ⑤, ⑦, ⑨, and ⑰ were originally included in the OF-5 and are shown in bold in Table 1.
The OF-20 questionnaires were administered during outpatient visits by five internal medicine physicians, and the resulting data were retrospectively extracted from the clinical database. Demographic and clinical data, including age, height, weight, body mass index (BMI), grip strength, and comorbidities, were collected from medical records. Laboratory parameters, including hemoglobin (Hb), serum albumin (Alb), serum creatinine (Cr), and estimated glomerular filtration rate (eGFR), were also recorded. Maximum grip strength had been measured using a grip strength dynamometer (GRIP-A; Takei Scientific Instruments Co., Ltd., Niigata, Japan). For comparison, oral frailty based on conventional criteria was defined as an OF-5 score of ≥2.
The study protocol was approved by the Ethics Committees of Osaka Dental University and the National Cerebral and Cardiovascular Center (Institutional Review Board approval number: 111449, Osaka Dental University). All procedures involving human participants were conducted in accordance with the ethical standards of the institutional and/or national research committees and with the principles of the Declaration of Helsinki and its later amendments or comparable ethical standards. The requirement for written informed consent was waived because of the retrospective nature of the study, and participants were provided with the opportunity to opt out of participation.
Statistical Analysis
For each OF-20 domain, participants were categorized into three ordinal groups according to domain score: 0, 1, and ≥2 points. Analyses were performed separately for men and women to account for sex-specific differences.
Continuous variables were expressed as mean ± standard deviation and compared across ordinal categories using the Jonckheere–Terpstra trend test. Categorical variables were analyzed using the Cochran–Armitage trend test. A two-sided P value < 0.05 was considered statistically significant. Because this was an exploratory study, no adjustment for multiple comparisons was performed, and the findings should be considered hypothesis-generating.
Results
The study included 297 outpatients (138 men and 159 women) with a mean age of 77.5 ± 7.5 years. As expected, significant sex-related differences were observed in body size, grip strength, hemoglobin, and serum creatinine levels, whereas serum albumin and estimated glomerular filtration rate (eGFR) did not differ significantly between men and women. Osteoporosis was markedly more prevalent among women, while respiratory diseases tended to be more common among men (Table 2).
The frequency of positive responses was analyzed separately by sex. Overall, the five simplified OF-5 items (①, ⑤, ⑦, ⑨, and ⑰) showed higher frequencies of positive responses than their corresponding items in the original questionnaire. Among the original items, ④reduced social interaction, ⑥poor dentition or poorly fitting dentures, and ⑬eating despite missing teeth were the most frequently reported, with no substantial sex differences observed (Table 2). Based on the conventional OF-5 criteria, 117 participants (39.4%) were classified as having oral frailty.
Participants were stratified according to their OF-20 scores and oral frailty status based on the OF-5 (cutoff ≥2). The participants classified as having oral frailty by the OF-5 exhibited a wide distribution of OF-20 scores, indicating substantial heterogeneity in oral functional decline that could not be fully captured by the OF-5 alone (Figure 1). At the item level, the most frequently reported problems were reduced frequency of ③ going out (38.7%), ⑰ oral dryness (35.0%), ⑤ having fewer than 20 remaining teeth (30.6%), and ④ reduced social interaction (27.9%), with minimal sex differences observed. These findings suggest that the OF-20 may provide a more comprehensive characterization of oral frailty and support individualized assessment and management.
Each domain score ranged from 0 to 4. Scores of 0 predominated in the eating and swallowing function and nutritional status, appetite and general condition domains, whereas a score of 0 was relatively uncommon in the oral dryness and oral hygiene domain, indicating that many participants reported at least one symptom in this category (Table 3). Because scores of 3 or 4 were rare, participants were categorized as 0, 1, or ≥2 points for trend analyses.
Domain-specific analyses revealed distinct clinical associations. Higher scores in the speech and social communication domain were associated with older age, lower hemoglobin levels, and reduced renal function (eGFR) in both sexes, with additional associations with lower grip strength, lower serum albumin levels, and a higher prevalence of cardiovascular disease and malignancy in men (Table 4A). In men, higher scores in the dentition and masticatory function domain were associated with older age and lower body weight, body mass index, and grip strength. In contrast, higher scores in this domain showed a tendency toward a lower prevalence of hypertension among men, while no significant associations were observed in women (Table 4B). Higher scores in the nutritional status, appetite, and general condition domain and the eating and swallowing function domain were associated with a higher prevalence of malignancy and respiratory disease, particularly among women (Table 4C, D). In the nutritional status, appetite, and general condition domain, higher scores were also associated with older age and lower body weight in both sexes, as well as with lower grip strength, hemoglobin levels, and renal function among men (Table 4D). Finally, higher scores in the oral dryness and oral hygiene domain were associated with lower body weight, body mass index, grip strength, and hemoglobin levels in men but showed no significant associations with comorbidities or with clinical variables in women (Table 4E).
Table 4. Clinical characteristics, physical function, and laboratory parameters across OF-20 domain score categories stratified by sex (A–E). Data are presented as mean ± standard deviation for continuous variables and n (%) for categorical variables. Domain-specific comparisons are shown separately for: (A) Speech and Social Communication, (B) Dentition and Masticatory Function, (C) Eating and Swallowing Function, (D) Nutritional Status, Appetite and General Condition, and (E) Oral Dryness and Oral Hygiene. Participants were categorized into three ordinal groups according to domain scores (0, 1, and ≥2 points). values for trend were calculated using the Jonckheere–Terpstra trend test for continuous variables and the Cochran–Armitage trend test for categorical variables. Abbreviations: OF-20, Oral Frailty 20-item checklist; BMI, body mass index; eGFR, estimated glomerular filtration rate.
A.
| Speech and Social Communication | Men (n = 138) | Women (n = 159) | |||||||
|
0 point (n =62) |
1 point (n = 38) |
≥ 2 points (n = 38) |
P for trend |
0 point (n =68) |
1 point (n =46) |
≥ 2 points (n = 45) |
P for trend | ||
| Age (years) | 74.5±6.3 | 77.5±7.3 | 79.9±7.3 | <0.001 | 75.9±6.8 | 79.8±8.2 | 79.9±7.6 | 0.004 | |
| Height (cm) | 165.8±6.9 | 165.6±7.1 | 163.9±6.8 | 0.144 | 152.8±4.8 | 150.9±6.8 | 151.0±4.8 | 0.043 | |
| Weight (kg) | 66.8±9.3 | 67.5±13.3 | 63.2±9.4 | 0.098 | 54.0±10.6 | 51.5±9.8 | 51.1±9.2 | 0.136 | |
| Body mass index: BMI (kg/m2) | 24.2±2.5 | 24.5±3.6 | 23.5±3.2 | 0.337 | 23.1±4.4 | 22.6±4.0 | 22.4±3.9 | 0.380 | |
| Grip strength (kg) | 31.9±7.3 | 29.8±7.0 | 27.1±7.0 | 0.002 | 17.2±3.4 | 17.2±5.2 | 16.0±4.8 | 0.172 | |
| Hemoglobin (g/dL) | 14.0±1.2 | 13.7±1.4 | 12.9±1.5 | <0.001 | 12.7±1.2 | 12.6±1.4 | 12.2±1.2 | 0.043 | |
| Albumin (g/dL) | 4.22±0.29 | 4.19±0.31 | 4.09±0.26 | 0.009 | 4.20±0.28 | 4.16±0.29 | 4.07±0.37 | 0.113 | |
| Creatinine (mg/dL) | 0.98±0.2 | 1.08±0.5 | 1.41±1.29 | 0.042 | 0.74±0.20 | 0.84±0.33 | 0.80±0.22 | 0.066 | |
| eGFR (mL/min/1.73m²) | 61.6±15.9 | 59.2±19.7 | 51.8±21.5 | 0.026 | 61.9±15.2 | 57.1±20.7 | 55.7±14.9 | 0.039 | |
| Comorbidities |
Hypertension, n (%) |
47(75.8) | 36(94.7) | 33(86.8) | 0.096 | 51(75.0) | 37(80.4) | 32(71.1) | 0.741 |
| Diabetes, n (%) | 13(21.0) | 9(23.7) | 9(23.7) | 0.808 | 13(19.1) | 8(17.4) | 6(13.3) | 0.451 | |
| Dyslipidemia, n (%) |
28(45.2) | 23(60.5) | 20(52.6) | 0.416 | 41(60.3) | 25(54.3) | 28(62.2) | 0.923 | |
| Cardiovascular disease, n (%) | 13(21.0) | 14(36.8) | 16(42.1) | 0.027 | 13(19.1) | 12(26.1) | 11(24.4) | 0.496 | |
| Cerebrovascular disease, n (%) | 8(12.9) | 4(10.5) | 5(13.2) | 1.000 | 10(14.7) | 8(17.4) | 5(11.1) | 0.688 | |
| Malignant neoplasm, n (%) | 7(11.3) | 9(23.7) | 11(28.9) | 0.025 | 5(7.4) | 8(17.4) | 5(11.1) | 0.457 | |
| Osteoporosis, n (%) | 1(1.6) | 1(2.6) | 1(2.6) | 0.731 | 12(17.6) | 9(19.6) | 8(17.8) | 1.000 | |
| Respiratory disease, n (%) | 5(8.1) | 2(5.3) | 5(13.2) | 0.476 | 1(1.5) | 3(6.5) | 1(2.2) | 0.790 | |
B.
| Dentition and Masticatory Function | Men (n = 138) | Women (n = 159) | |||||||
|
0 point (n =68) |
1 point (n = 32) |
≥ 2 points (n = 38) |
P for trend |
0 point (n =64) |
1 point (n =41) |
≥ 2 points (n = 54) |
P for trend | ||
| Age (years) | 74.6±7.4 | 78.5±6.2 | 79.4±6.6 | <0.001 | 77.0±7.4 | 79.6±7.0 | 78.4±8.4 | 0.339 | |
| Height (cm) | 166.0±7.7 | 165.5±6.2 | 163.6±6.0 | 0.052 | 152.5±4.9 | 151.4±5.4 | 151.1±6.2 | 0.284 | |
| Weight (kg) | 68.2±11.3 | 68.5±9.0 | 60.1±8.3 | <0.001 | 52.9±9.3 | 53.2±10.8 | 51.3±10.3 | 0.288 | |
| Body mass index: BMI (kg/m2) | 24.7±2.9 | 25.0±2.6 | 22.4±2.9 | 0.004 | 22.7±3.7 | 23.2±4.7 | 22.4±4.2 | 0.617 | |
| Grip strength (kg) | 31.8±7.4 | 29.2±6.5 | 27.6±7.1 | 0.003 | 17.6±3.8 | 17.0±5.1 | 15.8±4.4 | 0.094 | |
| Hemoglobin (g/dL) | 13.7±1.5 | 13.7±1.5 | 13.3±1.2 | 0.110 | 12.6±1.1 | 12.6±1.4 | 12.5±1.4 | 0.441 | |
| Albumin (g/dL) | 4.23±0.27 | 4.12±0.32 | 4.14±0.29 | 0.057 | 4.20±0.29 | 4.12±0.35 | 4.12±0.32 | 0.304 | |
| Creatinine (mg/dL) | 1.13±0.87 | 1.16±0.79 | 1.08±0.47 | 0.476 | 0.77±0.24 | 0.79±0.26 | 0.79±0.26 | 0.685 | |
| eGFR (mL/min/1.73m²) | 59.5±19.5 | 56.4±18.3 | 57.5±18.8 | 0.325 | 59.4±16.1 | 58.3±18.6 | 58.2±17.1 | 0.581 | |
| Comorbidities |
Hypertension, n (%) |
60(88.2) | 31(96.9) | 25(65.8) | 0.009 | 52(81.3) | 33(80.5) | 35(64.8) | 0.054 |
| Diabetes, n (%) | 11(16.2) | 9(28.1) | 11(28.9) | 0.120 | 10(15.6) | 8(19.5) | 9(16.7) | 0.903 | |
| Dyslipidemia, n (%) |
36(52.9) | 21(65.6) | 14(36.8) | 0.195 | 42(65.6) | 21(51.2) | 31(57.4) | 0.351 | |
| Cardiovascular disease, n (%) | 19(27.9) | 13(40.6) | 11(28.9) | 0.830 | 16(25.0) | 13(31.7) | 7(13.0) | 0.154 | |
| Cerebrovascular disease, n (%) | 9(13.2) | 4(12.5) | 4(10.5) | 0.764 | 12(18.8) | 7(17.1) | 4(7.4) | 0.091 | |
| Malignant neoplasm, n (%) | 12(17.6) | 6(18.8) | 9(23.7) | 0.530 | 6(9.4) | 3(7.3) | 9(16.7) | 0.249 | |
| Osteoporosis, n (%) | 1(1.5) | 2(6.3) | 0(0.0) | 1.000 | 9(14.1) | 10(24.4) | 10(18.5) | 0.553 | |
| Respiratory disease, n (%) | 3(4.4) | 2(6.3) | 7(18.4) | 0.021 | 2(3.1) | 0(0.0) | 3(5.6) | 0.608 | |
C.
| Eating and Swallowing Function | Men (n = 138) | Women (n = 159) | |||||||
|
0 point (n =80) |
1 point (n = 37) |
≥ 2 points (n = 21) |
P for trend |
0 point (n =91) |
1 point (n =41) |
≥ 2 points (n = 27) |
P for trend | ||
| Age (years) | 75.9±7.4 | 78.7±6.5 | 77.0±7.4 | 0.125 | 77.0±7.7 | 80.7±7.4 | 78.4±7.0 | 0.055 | |
| Height (cm) | 165.7±7.5 | 164.4±6.7 | 164.7±4.8 | 0.235 | 151.5±5.3 | 151.7±4.8 | 152.7±7.2 | 0.155 | |
| Weight (kg) | 67.7±11.0 | 63.2±8.6 | 64.5±11.8 | 0.053 | 52.5±9,4 | 52.0±9.5 | 52.9±12.8 | 0.655 | |
| Body mass index: BMI (kg/m2) | 24.6±3.0 | 23.4±2.5 | 23.7±3.9 | 0.094 | 22.9±3.8 | 22.6±4.3 | 22.6±5.2 | 0.314 | |
| Grip strength (kg) | 30.8±7.5 | 30.0±7.3 | 27.3±6.4 | 0.100 | 16.8±4.3 | 16.9±4.9 | 16.7±4.0 | 0.518 | |
| Hemoglobin (g/dL) | 13.7±1.4 | 13.6±1.5 | 13.0±1.3 | 0.144 | 12.6±1.1 | 12.2±1.5 | 13.0±1.3 | 0.742 | |
| Albumin (g/dL) | 4.20±0.25 | 4.15±0.31 | 4.11±0.38 | 0.386 | 4.16±0.28 | 4.11±0.34 | 4.19±0.37 | 0.572 | |
| Creatinine (mg/dL) | 1.15±0.92 | 1.15±0.50 | 0.96±0.27 | 0.790 | 0.77±0.25 | 0.86±0.28 | 0.72±0.17 | 0.423 | |
| eGFR (mL/min/1.73m²) | 58.9±20.1 | 54.2±16.9 | 62.5±17.3 | 0.873 | 60.4±17.4 | 52.7±16.0 | 62.3±15.6 | 0.341 | |
| Comorbidities |
Hypertension, n (%) |
69(86.3) | 30(81.1) | 17(81.0) | 0.533 | 68(74.7) | 35(85.4) | 17(63.0) | 0.548 |
| Diabetes, n (%) | 16(20.0) | 10(27.0) | 5(23.8) | 0.584 | 17(18.7) | 6(14.6) | 4(14.8) | 0.586 | |
| Dyslipidemia, n (%) |
38(47.5) | 21(56.8) | 12(57.1) | 0.360 | 55(60.4) | 21(51.2) | 18(66.7) | 0.916 | |
| Cardiovascular disease, n (%) | 14(17.5) | 13(35.1) | 6(28.6) | 1.000 | 16(17.6) | 15(36.6) | 5(18.5) | 0.458 | |
| Cerebrovascular disease, n (%) | 10(12.5) | 5(13.5) | 2(9.5) | 0.865 | 12(13.2) | 6(14.6) | 5(18.5) | 0.556 | |
| Malignant neoplasm, n (%) | 14(17.5) | 5(13.5) | 8(38.1) | 0.114 | 8(8.8) | 2(4.9) | 8(29.6) | 0.021 | |
| Osteoporosis, n (%) | 2(2.5) | 1(2.7) | 0(0.0) | 0.721 | 14(15.4) | 9(22.0) | 6(22.2) | 0.348 | |
| Respiratory disease, n (%) | 4(5.0) | 5(13.5) | 3(14.3) | 0.104 | 1(1.1) | 1(2.5) | 3(11.1) | 0.025 | |
D.
| Nutritional Status, Appetite and General condition | Men (n = 138) | Women (n = 159) | |||||||
|
0 point (n =75) |
1 point (n = 37) |
≥ 2 points (n = 26) |
P for trend |
0 point (n =87) |
1 point (n =39) |
≥ 2 points (n = 33) |
P for trend | ||
| Age (years) | 74.6±6.5 | 78.6±6.9 | 80.7±7.7 | <0.001 | 76.7±6.8 | 79.6±8.1 | 80.1±8.6 | 0.016 | |
| Height (cm) | 165.9±6.6 | 165.8±7.9 | 162.4±5.9 | 0.083 | 152.5±4.8 | 151.0±6.6 | 150.7±5.6 | 0.133 | |
| Weight (kg) | 68.0±10.8 | 65.7±10.5 | 60.6±8.5 | 0.005 | 54.1±9.9 | 49.6±7.7 | 51.2±11.8 | 0.019 | |
| Body mass index: BMI (kg/m2) | 24.6±3.0 | 23.8±2.8 | 23.0±3.2 | 0.035 | 23.2±4.0 | 21.8±3.5 | 22.6±5.1 | 0.069 | |
| Grip strength (kg) | 32.0±6.6 | 29.3±7.4 | 25.3±7.2 | <0.001 | 17.5±4.1 | 15.8±4.6 | 16.2±4.5 | 0.094 | |
| Hemoglobin (g/dL) | 13.9±1.3 | 13.6±1.3 | 12.6±1.4 | <0.001 | 12.6±1.0 | 12.6±1.6 | 12.3±1.4 | 0.136 | |
| Albumin (g/dL) | 4.19±0.29 | 4.22±0.26 | 4.07±0.31 | 0.202 | 4.20±0.29 | 4.11±0.30 | 4.08±0.37 | 0.114 | |
| Creatinine (mg/dL) | 1.06±0.81 | 1.22±0.84 | 1.19±0.41 | 0.013 | 0.76±0.21 | 0.80±0.31 | 0.83±0.24 | 0.284 | |
| eGFR (mL/min/1.73m²) | 62.3±19.0 | 55.1±19.1 | 51.0±15.9 | 0.005 | 60.2±16.9 | 59.0±18.7 | 54.5±15.0 | 0.216 | |
| Comorbidities |
Hypertension, n (%) |
66(88.0) | 29(78.4) | 21(80.8) | 0.298 | 67(77.0) | 28(71.8) | 25(75.8) | 0.819 |
| Diabetes, n (%) | 16(21.3) | 9(24.3) | 6(23.1) | 0.795 | 12(13.8) | 8(20.5) | 7(21.2) | 0.293 | |
| Dyslipidemia, n (%) |
37(49.3) | 23(62.2) | 11(42.3) | 0.913 | 57(65.5) | 19(48.7) | 18(54.5) | 0.160 | |
| Cardiovascular disease, n (%) | 23(30.7) | 12(32.4) | 8(30.8) | 1.000 | 24(27.6) | 8(20.5) | 4(12.1) | 0.076 | |
| Cerebrovascular disease, n (%) | 9(12.0) | 4(10.8) | 4(15.4) | 0.742 | 14(16.1) | 8(20.5) | 1(3.0) | 0.162 | |
| Malignant neoplasm, n (%) | 11(14.7) | 7(18.9) | 9(34.6) | 0.040 | 6(6.9) | 3(7.7) | 9(27.3) | 0.005 | |
| Osteoporosis, n (%) | 2(2.7) | 1(2.7) | 0(0.0) | 0.715 | 13(14.9) | 11(28.2) | 5(15.2) | 0.702 | |
| Respiratory disease, n (%) | 4(5.3) | 4(10.8) | 4(15.4) | 0.121 | 1(1.1) | 1(2.6) | 3(9.1) | 0.041 | |
E.
| Oral Dryness and Oral Hygiene | Men (n = 138) | Women (n = 159) | |||||||
|
0 point (n =55) |
1 point (n = 54) |
≥ 2 points (n = 29) |
P for trend |
0 point (n =64) |
1 point (n =64) |
≥ 2 points (n = 31) |
P for trend | ||
| Age (years) | 75.6±7.1 | 77.8±7.3 | 77.4±7.1 | 0.131 | 77.2±7.4 | 78.2±7.8 | 80.1±7.7 | 0.084 | |
| Height (cm) | 165.6±7.4 | 164.9±6.4 | 165.0±7.3 | 0.614 | 151.4±5.9 | 152.1±5.4 | 151.8±4.9 | 0.605 | |
| Weight (kg) | 68.4±10.8 | 65.4±10.1 | 62.4±10.4 | 0.027 | 51.1±9.1 | 52.5±9.4 | 54.9±12.5 | 0.230 | |
| Body mass index: BMI (kg/m2) | 24.9±2.8 | 24.0±3.0 | 22.9±3.1 | 0.007 | 22.3±3.5 | 22.7±3.8 | 23.9±5.7 | 0.316 | |
| Grip strength (kg) | 32.0±6.8 | 29.1±7.2 | 27.9±7.8 | 0.014 | 17.5±4.4 | 16.7±4.2 | 15.8±4.6 | 0.609 | |
| Hemoglobin (g/dL) | 13.9±1.3 | 13.4±1.5 | 13.4±1.5 | 0.045 | 12.7±1.1 | 12.6±1.2 | 12.2±1.7 | 0.104 | |
| Albumin (g/dL) | 4.25±0.24 | 4.08±0.33 | 4.22±0.26 | 0.177 | 4.17±0.26 | 4.18±0.33 | 4.06±0.36 | 0.440 | |
| Creatinine (mg/dL) | 1.11±0.39 | 1.07±0.93 | 1.24±0.92 | 0.624 | 0.80±0.27 | 0.74±0.22 | 0.84±0.24 | 0.644 | |
| eGFR (mL/min/1.73m²) | 56.3±18.7 | 61.7±18.7 | 55.4±19.5 | 0.734 | 57.9±17.2 | 62.3±17.6 | 53.1±14.0 | 0.566 | |
| Comorbidities |
Hypertension, n (%) |
50(90.9) | 44(81.5) | 22(75.9) | 0.059 | 50(78.1) | 49(76.6) | 21(67.7) | 0.326 |
| Diabetes, n (%) | 12(21.8) | 13(24.1) | 6(20.7) | 1.000 | 8(12.5) | 12(18.8) | 7(22.6) | 0.205 | |
| Dyslipidemia, n (%) |
31(56.4) | 28(51.9) | 12(41.4) | 0.219 | 39(60.9) | 38(59.4) | 17(54.8) | 0.666 | |
| Cardiovascular disease, n (%) | 16(29.1) | 19(35.2) | 8(27.6) | 1.000 | 14(21.9) | 14(21.9) | 8(25.8) | 0.800 | |
| Cerebrovascular disease, n (%) | 8(14.5) | 6(11.1) | 3(10.3) | 0.612 | 8(12.5) | 9(14.1) | 6(19.4) | 0.452 | |
| Malignant neoplasm, n (%) | 9(16.4) | 12(22.2) | 6(20.7) | 0.575 | 7(10.9) | 9(14.1) | 2(6.5) | 0.740 | |
| Osteoporosis, n (%) | 1(1.8) | 1(1.9) | 1(3.4) | 0.716 | 8(12.5) | 12(18.8) | 9(29.0) | 0.055 | |
| Respiratory disease, n (%) | 3(5.5) | 7(13.0) | 2(6.9) | 0.693 | 3(4.7) | 1(1.6) | 1(3.2) | 0.766 | |
Discussion
In this cross-sectional study of older outpatients, we found that the newly developed OF-20 questionnaire provided a broader and more nuanced assessment of oral frailty than the conventional OF-5. Nearly 40% of participants were classified as having oral frailty according to OF-5 criteria, consistent with previous reports [11]. However, OF-20 scores showed substantial variability within this group, suggesting that oral frailty is not a uniform condition but rather a heterogeneous spectrum of oral functional decline.
As noted above, oral frailty is increasingly recognized as an early indicator of vulnerability in older adults and is closely associated with physical frailty, sarcopenia, malnutrition, and disability. The conventional OF-5 has been useful as a simple screening tool; however, its binary classification framework may overlook differences in severity and underlying domains of dysfunction. Our findings support this limitation, as the OF-20 identified gradations of impairment even among patients categorized similarly by OF-5.
A major strength of the OF-20 is its multidimensional structure. Unlike the OF-5, it includes domains related not only to mastication and swallowing but also to social interaction, appetite, dietary behavior, and oral hygiene. These domains revealed distinct clinical associations.
In particular, higher scores in the speech and social communication domain were associated with aging, lower hemoglobin levels, and impaired renal function, suggesting that communication-related oral decline may reflect broader physiological vulnerability. Consistent with these findings, decline in oral motor function assessed through speech production has been associated with aging, lower hemoglobin levels, and impaired renal function in patients with chronic kidney disease [12].
Decline in speech and social communication may be related to age-related neuromuscular deterioration, anemia, and systemic muscle loss associated with renal dysfunction. Communication difficulties have been associated with smaller social networks, less frequent participation in social activities, and greater feelings of loneliness [13,14]. Multidimensional oral functional decline, encompassing oral motor, masticatory, and swallowing functions, has been associated with deficits in intrinsic capacity, particularly in the locomotion domain, among older adults [15].
Furthermore, social isolation and reduced social participation have been associated with reduced cognitive stimulation and physical activity [16,17], as well as declines in cognitive and physical functioning [18]. Because declines in cognitive and physical functioning can also limit social participation, communication difficulties and reduced social activity may mutually reinforce cognitive and physical vulnerability [19]. Taken together, these findings suggest that these oral functional declines may reflect broader physiological and functional vulnerability rather than merely localized oral problems.
Similarly, the nutritional status, appetite, and general condition domain showed notable associations with lower body weight, reduced grip strength, and impaired renal function, particularly in men, indicating a close relationship between oral frailty and nutritional or systemic decline. Oral problems may reduce appetite and nutrient intake, contributing to lower body weight and sarcopenia, characterized by reduced muscle mass and strength. In addition, impaired renal function involves a complex interplay among chronic inflammation, metabolic abnormalities, anorexia, and increased protein catabolism, which may contribute to systemic metabolic deterioration and muscle wasting. Decline in oral function, particularly impaired chewing and swallowing, is associated with a reduced variety of foods consumed, lower food intake and dietary quality, and malnutrition [20,21]. Insufficient nutritional intake may, in turn, contribute to sarcopenia, characterized by loss of muscle mass and strength [22]. In chronic kidney disease, uremia, chronic inflammation, metabolic acidosis, anorexia, and increased protein catabolism may interact to promote protein-energy wasting and muscle depletion [23,24,25,26]. In men, these associations may have been influenced by differences in muscle mass, nutritional status, comorbidity burden, or other sex-related factors. Consequently, decline in this domain may reflect the progression of a systemic cycle linking impaired oral function, inadequate nutrition, muscle loss, and renal dysfunction.
Notably, higher scores in the eating and swallowing function domain were associated with malignancy and respiratory disease. Similar eating and swallowing impairments have been reported in patients with cancer [27,28,29], particularly head and neck [30], esophageal, and lung cancers, as well as in patients with chronic respiratory diseases such as chronic obstructive pulmonary disease (COPD). In cancer, these impairments may result from cachexia and treatment-related muscle and mucosal damage, whereas in COPD they may be related to swallowing muscle dysfunction and disrupted breathing–swallowing coordination, increasing the risk of aspiration [31,32,33]. Reduced appetite and swallowing difficulties may further contribute to inadequate dietary intake, malnutrition, and sarcopenia, potentially exacerbating systemic vulnerability [34,35]. Thus, elevated scores in the eating and swallowing domain may reflect not only localized oral dysfunction but also underlying disease burden and broader systemic vulnerability. Although these findings do not establish a diagnostic role for OF-20, unexplained or progressive dysphagia, choking, or appetite loss may warrant further clinical assessment for underlying systemic disease.
Interestingly, higher scores in the dentition and masticatory function domain were associated with a lower prevalence of hypertension among men. This finding contrasts with previous epidemiological studies reporting positive associations between tooth loss or impaired masticatory function and hypertension [36]. However, lower blood pressure has been reported in frail older adults [37,38]. One possible explanation is that severe masticatory impairment may reduce both the amount and variety of food consumed, leading to inadequate dietary intake, lower body weight, and low BMI, which may subsequently contribute to frailty and reduced blood pressure. This interpretation is consistent with the lower body weight and grip strength observed in this group and with previous reports linking masticatory impairment to reduced dietary intake and frailty [39,40,41]. Thus, the lower prevalence of hypertension may reflect nutritional depletion, sarcopenia, frailty, and reduced physiological reserve rather than a protective effect of masticatory dysfunction itself. This interpretation is consistent with the concept of reverse epidemiology, whereby conventional cardiovascular risk factors may exhibit paradoxical associations with clinical outcomes in older adults and patients with chronic diseases [42,43]. However, given the cross-sectional design, reverse causation and underlying disease burden cannot be excluded.
The observed sex-specific differences are also noteworthy. Associations between OF-20 scores and physical or laboratory markers were generally stronger in men, whereas associations with malignancy and respiratory disease were more evident in women. In women, sex-related differences have been reported in the clinical presentation of lung cancer and COPD, including smoking exposure, dyspnea, airway pathology, and disease progression [44]. In addition, among community-dwelling older adults, dysphagia has been associated with oral, physical, cognitive, and psychological frailty in women [45]. Thus, the stronger associations observed in women may reflect differences in disease characteristics, age, nutritional status, BMI, frailty, smoking history, treatment status, or symptom and oral function assessment. Although associations with malignancy and respiratory disease were more pronounced in women, it remains unclear whether these findings represent true sex-specific effects or differences in underlying patient characteristics. These findings suggest that OF-20 may reflect not only oral dysfunction but also broader physical frailty, nutritional decline, and systemic disease burden. Accordingly, the observed sex differences should be considered hypothesis-generating rather than evidence of sex-specific causal pathways and warrant further investigation.
The OF-20 may provide additional clinical information beyond binary classification with the OF-5 by providing a domain-specific profile of oral and systemic vulnerability. Elevated scores in the speech/social communication, dentition/mastication/swallowing, and nutritional/general condition domains may indicate underlying frailty, nutritional decline, or systemic disease and may help identify areas requiring further dental, nutritional, medical, or rehabilitative assessment. Thus, the OF-20 may facilitate individualized, multidisciplinary management by identifying specific domains of vulnerability rather than simply classifying the presence or absence of oral frailty.
This study has several limitations. First, its cross-sectional design precludes establishing causal or temporal relationships between OF-20 scores and systemic parameters. Second, because participants were recruited solely from internal medicine outpatient clinics, the findings may be subject to selection bias and may not be fully generalizable to healthier community-dwelling older adults or dental patients. Third, the OF-20 is a self-reported questionnaire and was not directly compared with objective measures of oral function, such as tongue pressure or masticatory performance, or with psychological and cognitive assessments that may influence communication and appetite. Finally, the predictive validity of the OF-20 for long-term health outcomes and its responsiveness to clinical interventions remain to be established in prospective longitudinal studies. The OF-20 is organized into five domains, each comprising four items; however, its structural validity has not been established through factor analysis, nor has its internal consistency been adequately evaluated. In addition, although the OF-20 is currently analyzed as a continuous measure and at the domain level, no cutoff value or predefined criteria for the total score have been established for its use as a clinical screening tool. These issues should therefore be clearly recognized as important areas for further investigation to facilitate the future clinical implementation of the OF-20.
The OF-20 is not intended to replace the OF-5 as a simple screening tool. Rather, the OF-5 may serve as an efficient tool for identifying individuals at risk of oral frailty, whereas the OF-20 may provide a more detailed, multidimensional characterization of the specific domains of vulnerability. Thus, the two instruments may have complementary roles in clinical assessment: OF-5 for screening and OF-20 for multidimensional characterization.
In conclusion, the OF-20 may provide a more comprehensive and quantitative assessment of oral frailty than the OF-5 by capturing its multidimensional and heterogeneous nature. Its associations with physical frailty, nutritional decline, and systemic disease burden suggest its potential utility as a multidimensional marker of vulnerability in older adults in both dental and general medical settings. However, further studies in larger, independent cohorts are needed to establish its reliability, construct validity, and predictive validity.
Data Availability
The data cannot be shared publicly because they contain potentially identifiable patient information. Researchers who meet the criteria for access to confidential data may obtain the data via the Clinical Trials Committee. The institution responsible for overseeing data access is the Institutional Review Board of Osaka Dental University. If you would like to access the data, please contact us by phone (+81-72-864-3111) or online (https://www.osaka-dent.ac.jp/access.html).
Funding Statement
This study was supported in part by JSPS KAKENHI (grant number: 25K10671 [2025–2029]), awarded to HK.
Acknowledgments
We would like to thank all the medical staff of Osaka Dental University and the National Cerebral and Cardiovascular Center who supported this study. We gratefully acknowledge the members of the Sakai District Dental Association of Fukui Prefecture for granting permission to use this questionnaire in the present study and for their valuable advice and guidance in the preparation of this manuscript.
References
- Tanaka, T.; Takahashi, K.; Hirano, H.; Kikutani, T.; Watanabe, Y.; Ohara, Y.; Furuya, H.; Tetsuo, T.; Akishita, M.; Iijima, K. Oral Frailty as a Risk Factor for Physical Frailty and Mortality in Community-Dwelling Elderly. J. Gerontol. A Biol. Sci. Med. Sci. 2018, 73(12), 1661–1667. [Google Scholar] [CrossRef]
- Tanaka, T.; Hirano, H.; Ikebe, K.; Ueda, T.; Iwasaki, M.; Minakuchi, S.; Arai, H.; Akishita, M.; Kozaki, K.; Iijima, K. Consensus statement on “Oral frailty” from the Japan Geriatrics Society, the Japanese Society of Gerodontology, and the Japanese Association on Sarcopenia and Frailty. Geriatr. Gerontol. Int. 2024, 24(11), 1111–9. [Google Scholar] [CrossRef]
- Dibello, V.; Lobbezoo, F.; Lozupone, M.; Sardone, R.; Ballini, A.; Berardino, G.; et al. Oral frailty indicators to target major adverse health-related outcomes in older age: a systematic review. Geroscience 2023, 45(2), 663–706. [Google Scholar] [CrossRef]
- Tanaka, T.; Hirano, H.; Ohara, Y.; Nishimoto, M.; Iijima, K. Oral Frailty Index-8 in the risk assessment of new-onset oral frailty and functional disability among community-dwelling older adults. Arch. Gerontol. Geriatr. 2021, 94, 104340. [Google Scholar] [CrossRef]
- Kusunoki, H.; Ekawa, K.; Kato, N.; Yamasaki, K.; Motone, M.; Shinmura, K.; Yoshihara, F.; Shimizu, H. Association between oral frailty and cystatin C-related indices-A questionnaire (OFI-8) study in general internal medicine practice. PLoS ONE 2023, 18(4), e0283803. [Google Scholar] [CrossRef]
- Tanaka, T.; Hirano, H.; Ikebe, K.; Ueda, T.; Iwasaki, M.; Shirobe, M.; Minakuchi, S.; Akishita, M.; Arai, H.; Iijima, K. Oral frailty five-item checklist to predict adverse health outcomes in community-dwelling older adults: a Kashiwa cohort study. Geriatr. Gerontol. Int. 2023, 23(9), 651–9. [Google Scholar] [CrossRef]
- Kusunoki, H.; Tsuji, S.; Ekawa, K.; Kato, N.; Yamasaki, K.; Yoshihara, F.; Shimizu, H. Comparative Analysis of the Oral Frailty Five-item Checklist and Oral Frailty Index-8 Tools in Assessing Oral Frailty and Their Association with Systemic Health Indicators. JMA J. 2025, 8(4), 1250–1260. [Google Scholar] [CrossRef]
- Kusunoki, H.; Hasegawa, Y.; Nagasawa, Y.; Shojima, K.; Yamazaki, H.; Mori, T.; Tsuji, S.; Wada, Y.; Tamaki, K.; Nagai, K.; Matsuzawa, R.; Kishimoto, H.; Shimizu, H.; Shinmura, K. Oral frailty and its relationship with physical frailty in older adults: a longitudinal study using the oral frailty five-item checklist. Nutrients 2024, 17(1), 17. [Google Scholar] [CrossRef]
- Araie, N.; Saito, T.; Hata, Y.; Kido, M. Development of the “Oral Frailty Check [OF-5-based]” (Part 1). The 36th Annual Meeting of the Japanese Society of Gerodontology, Japan, June 2025; Available online: https://pub.confit.atlas.jp/ja/event/gero36/presentation/1-P07-07.
- Saito, T.; Araie, N.; Hata, Y.; Kido, M. Development of the “Oral Frailty Check [OF-5-based]” (Part 2: Survey). The 36th Annual Meeting of the Japanese Society of Gerodontology, Japan, June 2025; Available online: https://pub.confit.atlas.jp/ja/event/gero36/presentation/2-P06-08.
- Iwasaki, M.; Shirobe, M.; Motokawa, K.; Tanaka, T.; Ikebe, K.; Ueda, T.; Minakuchi, S.; Akishita, M.; Arai, H.; Iijima, K.; Sasai, H.; Obuchi, S.; Hirano, H. Prevalence of oral frailty and its association with dietary variety, social engagement, and physical frailty: Results from the Oral Frailty 5-Item Checklist. Geriatr. Gerontol. Int. 2024, 24(4), 371–377. [Google Scholar] [CrossRef]
- Kosaka, S.; Ohara, Y.; Naito, S.; Iimori, S.; Kado, H.; Hatta, T.; Yanishi, M.; Uchida, S.; Tanaka, M. Association among kidney function, frailty, and oral function in patients with chronic kidney disease: a cross-sectional study. BMC Nephrol. 2020, 21(1), 357. [Google Scholar] [CrossRef]
- Palmer, A.D.; Newsom, J.T.; Rook, K.S. How does difficulty communicating affect the social relationships of older adults? An exploration using data from a national survey. J. Commun. Disord. 2016, 62, 131–46. [Google Scholar] [CrossRef]
- Palmer, A.D.; Carder, P.C.; White, D.L.; Saunders, G.; Woo, H.; Graville, D.J.; Newsom, J.T. The Impact of Communication Impairments on the Social Relationships of Older Adults: Pathways to Psychological Well-Being. J. Speech Lang. Hear Res. 2019, 62(1), 1–21. [Google Scholar] [CrossRef]
- Miyahara, S.; Maeda, K.; Kawamura, K.; Matsui, Y.; Satake, S.; Arai, H.; Umegaki, H. Association between intrinsic capacity and oral health in older patients in a frailty clinic. Eur. Geriatr. Med. 2024, 15(4), 1119–1127. [Google Scholar] [CrossRef]
- Maharani, A.; Pendleton, N.; Leroi, I. Hearing Impairment, Loneliness, Social Isolation, and Cognitive Function: Longitudinal Analysis Using English Longitudinal Study on Ageing. Am. J. Geriatr. Psychiatry 2019, 27(12), 1348–1356. [Google Scholar] [CrossRef]
- Cacioppo, J.T.; Hawkley, L.C. Perceived social isolation and cognition. Trends Cogn. Sci. 2009, 13(10), 447–54. [Google Scholar] [CrossRef]
- Duan, Y.; Jiang, S.; Yin, Z.; Wang, S.; Gao, J.; Yang, M.; Chen, C.; Fu, H.; Wang, C. Association of social isolation and cognitive performance: a longitudinal study using a four-wave nationwide survey. BMC Public Health 2023, 23(1), 1409. [Google Scholar] [CrossRef]
- Kojima, G.; Aoyama, R.; Tanabe, M. Associations Between Social Isolation and Physical Frailty in Older Adults: A Systematic Review and Meta-Analysis. J. Am. Med. Dir. Assoc. 2022, 23(11), e3–e6. [Google Scholar] [CrossRef]
- Iwasaki, M.; Hirano, H.; Ohara, Y.; Motokawa, K. The association of oral function with dietary intake and nutritional status among older adults: Latest evidence from epidemiological studies. Jpn. Dent. Sci. Rev. 2021, 57, 128–137. [Google Scholar] [CrossRef]
- Iwasaki, M.; Motokawa, K.; Watanabe, Y.; Shirobe, M.; Ohara, Y.; Edahiro, A.; Kawai, H.; Fujiwara, Y.; Kim, H.; Ihara, K.; Obuchi, S.; Hirano, H. Oral hypofunction and malnutrition among community-dwelling older adults: Evidence from the Otassha study. Gerodontology 2022, 39(1), 17–25. [Google Scholar] [CrossRef]
- Kugimiya, Y.; Iwasaki, M.; Ohara, Y.; Motokawa, K.; Edahiro, A.; Shirobe, M.; Watanabe, Y.; Obuchi, S.; Kawai, H.; Fujiwara, Y.; Ihara, K.; Kim, H.; Ueda, T.; Hirano, H. Relationship between Oral Hypofunction and Sarcopenia in Community-Dwelling Older Adults: The Otassha Study. Int. J. Environ. Res. Public Health 2021, 18(12), 6666. [Google Scholar] [CrossRef]
- Carrero, J.J.; Stenvinkel, P.; Cuppari, L.; Ikizler, T.A.; Kalantar-Zadeh, K.; Kaysen, G.; Mitch, W.E.; Price, S.R.; Wanner, C.; Wang, A.Y.; ter Wee, P.; Franch, H.A. Etiology of the protein-energy wasting syndrome in chronic kidney disease: a consensus statement from the International Society of Renal Nutrition and Metabolism (ISRNM). J. Ren. Nutr. 2013, 23(2), 77–90.24. [Google Scholar] [CrossRef]
- Stenvinkel, P.; Ketteler, M.; Johnson, R.J.; Lindholm, B.; Pecoits-Filho, R.; Riella, M.; Heimbürger, O.; Cederholm, T.; Girndt, M. IL-10, IL-6, and TNF-alpha: central factors in the altered cytokine network of uremia--the good, the bad, and the ugly. Kidney Int. 2005, 67(4), 1216–33. [Google Scholar] [CrossRef]
- Ikizler, T.A.; Cano, N.J.; Franch, H.; Fouque, D.; Himmelfarb, J.; Kalantar-Zadeh, K.; Kuhlmann, M.K.; Stenvinkel, P.; TerWee, P.; Teta, D.; Wang, A.Y.; Wanner, C.; International Society of Renal Nutrition and Metabolism. Prevention and treatment of protein energy wasting in chronic kidney disease patients: a consensus statement by the International Society of Renal Nutrition and Metabolism. Kidney Int. 2013, 84(6), 1096–107. [Google Scholar] [CrossRef]
- Kalantar-Zadeh, K.; Fouque, D. Nutritional Management of Chronic Kidney Disease. N Engl. J. Med. 2017, 377(18), 1765–1776. [Google Scholar] [CrossRef]
- Matsuo, H.; Sakuma, K. Pathophysiology of cachexia and characteristics of dysphagia in chronic diseases. Asia Pac. J. Oncol. Nurs. 2022, 9(10), 100120. [Google Scholar] [CrossRef]
- Wakabayashi, H.; Matsushima, M.; Uwano, R.; Watanabe, N.; Oritsu, H.; Shimizu, Y. Skeletal muscle mass is associated with severe dysphagia in cancer patients. J. Cachexia Sarcopenia Muscle 2015, 6(4), 351–7. [Google Scholar] [CrossRef]
- Marmor, S.; Cohen, S.; Fujioka, N.; Cho, L.C.; Bhargava, A.; Misono, S. Dysphagia prevalence and associated survival differences in older patients with lung cancer: A SEER-Medicare population-based study. J. Geriatr. Oncol. 2020, 11(7), 1115–1117. [Google Scholar] [CrossRef]
- Willemsen, A.C.H.; Pilz, W.; Hoeben, A.; Hoebers, F.J.P.; Schols, A.M.W.J.; Baijens, L.W.J. Oropharyngeal dysphagia and cachexia: Intertwined in head and neck cancer. Head Neck 2023, 45(4), 783–797. [Google Scholar] [CrossRef]
- Lin, T.F.; Shune, S. Chronic Obstructive Pulmonary Disease and Dysphagia: A Synergistic Review. Geriatrics 2020, 5(3), 45. [Google Scholar] [CrossRef]
- Gross, R.D.; Atwood, C.W., Jr.; Ross, S.B.; Olszewski, J.W.; Eichhorn, K.A. The coordination of breathing and swallowing in chronic obstructive pulmonary disease. Am. J. Respir. Crit. Care Med. 2009, 179(7), 559–65. [Google Scholar] [CrossRef]
- Cvejic, L.; Harding, R.; Churchward, T.; Turton, A.; Finlay, P.; Massey, D.; Bardin, P.G.; Guy, P. Laryngeal penetration and aspiration in individuals with stable COPD. Respirology 2011, 16(2), 269–75. [Google Scholar] [CrossRef]
- Landi, F.; Calvani, R.; Tosato, M.; Martone, A.M.; Ortolani, E.; Savera, G.; Sisto, A.; Marzetti, E. Anorexia of Aging: Risk Factors, Consequences, and Potential Treatments. Nutrients 2016, 8(2), 69. [Google Scholar] [CrossRef]
- Fielding, R.A.; Landi, F.; Smoyer, K.E.; Tarasenko, L.; Groarke, J. Association of anorexia/appetite loss with malnutrition and mortality in older populations: A systematic literature review. J. Cachexia Sarcopenia Muscle 2023, 14(2), 706–729. [Google Scholar] [CrossRef]
- Tada, A.; Tano, R.; Miura, H. The relationship between tooth loss and hypertension: a systematic review and meta-analysis. Sci. Rep. 2022, 12(1), 13311. [Google Scholar] [CrossRef]
- Anker, D.; Santos-Eggimann, B.; Zwahlen, M.; Santschi, V.; Rodondi, N.; Wolfson, C.; Chiolero, A. Blood pressure in relation to frailty in older adults: A population-based study. J. Clin. Hypertens. (Greenwich) 2019, 21(12), 1895–1904. [Google Scholar] [CrossRef]
- Odden, M.C.; Peralta, C.A.; Haan, M.N.; Covinsky, K.E. Rethinking the association of high blood pressure with mortality in elderly adults: the impact of frailty. Arch. Intern Med. 2012, 172(15), 1162–8. [Google Scholar] [CrossRef]
- Kiesswetter, E.; Poggiogalle, E.; Migliaccio, S.; Donini, L.M.; Sulmont-Rossé, C.; Feart, C.; Suwalska, A.; Wieczorowska-Tobis, K.; Pałys, W.; Łojko, D.; Saba, A.; Sinesio, F.; Polito, A.; Moneta, E.; Ciarapica, D.; Brug, J.; Volkert, D. Functional determinants of dietary intake in community-dwelling older adults: a DEDIPAC (DEterminants of DIet and Physical ACtivity) systematic literature review. Public Health Nutr. 2018, 21(10), 1886–1903. [Google Scholar] [CrossRef]
- Murakami, M.; Hirano, H.; Watanabe, Y.; Sakai, K.; Kim, H.; Katakura, A. Relationship between chewing ability and sarcopenia in Japanese community-dwelling older adults. Geriatr. Gerontol. Int. 2015, 15(8), 1007–12. [Google Scholar] [CrossRef]
- Özsürekci, C.; Kara, M.; Güngör, A.E.; Ayçiçek, G.Ş.; Çalışkan, H.; Doğu, B.B.; Cankurtaran, M.; Halil, M.G. Relationship between chewing ability and malnutrition, sarcopenia, and frailty in older adults. Nutr. Clin. Pract. 2022, 37(6), 1409–1417. [Google Scholar] [CrossRef]
- Ahmadi, S.F.; Streja, E.; Zahmatkesh, G.; Streja, D.; Kashyap, M.; Moradi, H.; Molnar, M.Z.; Reddy, U.; Amin, A.N.; Kovesdy, C.P.; Kalantar-Zadeh, K. Reverse Epidemiology of Traditional Cardiovascular Risk Factors in the Geriatric Population. J. Am. Med. Dir. Assoc. 2015, 16(11), 933–9. [Google Scholar] [CrossRef]
- Martín-Ponce, E.; Santolaria, F.; Alemán-Valls, M.R.; González-Reimers, E.; Martínez-Riera, A.; Rodríguez-Gaspar, M.; Rodríguez-Rodríguez, E. Factors involved in the paradox of reverse epidemiology. Clin. Nutr. 2010, 29(4), 501–6. [Google Scholar] [CrossRef]
- Siegfried, J.M. Sex and Gender Differences in Lung Cancer and Chronic Obstructive Lung Disease. Endocrinology 2022, 163(2), bqab254. [Google Scholar] [CrossRef]
- Nishida, T.; Yamabe, K.; Honda, S. Dysphagia is associated with oral, physical, cognitive and psychological frailty in Japanese community-dwelling elderly persons. Gerodontology 2020, 37(2), 185–190. [Google Scholar] [CrossRef]
Figure 1.
Distribution of OF-20 total scores stratified by sex and conventional oral frailty status. Histogram showing the distribution of total Oral Frailty 20-item Checklist (OF-20) scores among men (A) and women (B) outpatients. The horizontal axis represents the total OF-20 score (ranging from 0 to 20 points), and the vertical axis indicates the number of participants. Bars are color-coded according to conventional oral frailty status based on the Oral Frailty 5-item checklist (OF-5): without oral frailty (OF-5 score < 2: blue) and oral frailty (OF-5 score ≥ 2: orange). Note the wide distribution of OF-20 scores among participants classified as having oral frailty by OF-5 criteria, reflecting the heterogeneity of oral functional decline.
Figure 1.
Distribution of OF-20 total scores stratified by sex and conventional oral frailty status. Histogram showing the distribution of total Oral Frailty 20-item Checklist (OF-20) scores among men (A) and women (B) outpatients. The horizontal axis represents the total OF-20 score (ranging from 0 to 20 points), and the vertical axis indicates the number of participants. Bars are color-coded according to conventional oral frailty status based on the Oral Frailty 5-item checklist (OF-5): without oral frailty (OF-5 score < 2: blue) and oral frailty (OF-5 score ≥ 2: orange). Note the wide distribution of OF-20 scores among participants classified as having oral frailty by OF-5 criteria, reflecting the heterogeneity of oral functional decline.
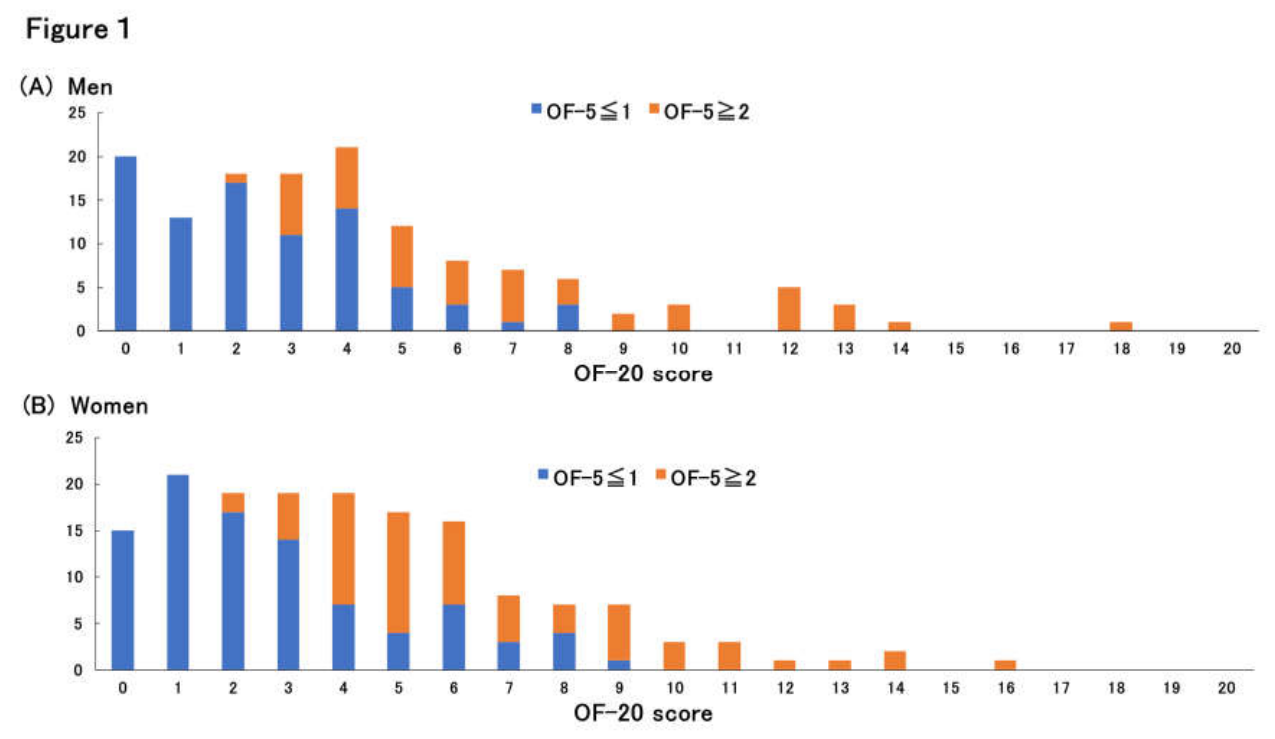

Table 1.
OF-20 Questionnaire Items Used in This Study.
| Speech and Social Communication |
|
| |
| |
| |
| Dentition and Masticatory Function |
|
| |
| |
| |
| Eating and Swallowing Function |
|
| |
| |
| |
| Nutritional Status, Appetite and General condition |
|
| |
| |
| |
| Oral Dryness and Oral Hygiene |
|
| |
| |
|
Table 2.
Baseline Characteristics of the Participants and Responses to the OF-20 Questionnaire, Stratified by Sex. Abbreviations: OF-20, Oral Frailty 20-item checklist; eGFR, estimated glomerular filtration rate.
Table 2.
Baseline Characteristics of the Participants and Responses to the OF-20 Questionnaire, Stratified by Sex. Abbreviations: OF-20, Oral Frailty 20-item checklist; eGFR, estimated glomerular filtration rate.
|
Total (n = 297) |
Men (n = 138) |
Women (n = 159) |
P value | ||
| Age (years) | 77.5±7.5 | 76.8±7.2 | 78.2±7.7 | 0.124 | |
| Height (cm) | 158.0±9.1 | 165.2±6.9 | 151.8±5.5 | <0.001 | |
| Weight (kg) | 58.7±12.3 | 66.0±10.6 | 52.4±10.0 | <0.001 | |
| Body mass index: BMI (kg/m2) | 23.4±3.7 | 24.1±3.0 | 22.8±4.1 | 0.002 | |
| Grip strength (kg) | 23.0±8.8 | 30.0±7.3 | 16.8±4.4 | <0.001 | |
| Hemoglobin (g/dL) | 13.0±1.4 | 13.6±1.4 | 12.5±1.3 | <0.001 | |
| Albumin (g/dL) | 4.16±0.30 | 4.18±0.29 | 4.15±0.31 | 0.495 | |
| Creatinine (mg/dL) | 0.94±0.57 | 1.12±0.76 | 0.78±0.25 | <0.001 | |
| eGFR (mL/min/1.73m²) | 58.5±17.9 | 58.2±18.9 | 58.7±17.0 | 0.805 | |
|
Comorbidities |
Hypertension, n (%) | 236(79.5) | 116(84.1) | 120(75.5) | 0.084 |
| Diabetes, n (%) | 58(19.5) | 31(22.5) | 27(17.0) | 0.244 | |
| Dyslipidemia, n (%) | 165(55.6) | 71(51.4) | 94(59.1) | 0.199 | |
| Osteoporosis, n (%) | 79(26.6) | 43(31.2) | 36(22.6) | 0.114 | |
| Malignant neoplasm, n (%) | 40(13.5) | 17(12.3) | 23(14.5) | 0.614 | |
| Cardiovascular disease, n (%) | 45(15.2) | 27(19.6) | 18(11.3) | 0.053 | |
| Cerebrovascular disease, n (%) | 32(10.8) | 3(2.2) | 29(18.2) | <0.001 | |
| Respiratory disease, n (%) | 17(5.7) | 12(8.7) | 5(3.1) | 0.047 | |
| Questions | |||||
| Speech and Social Communication |
|
36(12.1) | 19(13.8) | 17(10.7) | 0.478 |
|
45(15.2) | 23(16.7) | 22(13.8) | 0.520 | |
|
115(38.7) | 48(34.8) | 67(42.1) | 0.232 | |
|
83(27.9) | 41(29.7) | 42(26.4) | 0.604 | |
| Dentition and Masticatory Function |
|
91(30.6) | 38(27.5) | 53(33.3) | 0.314 |
|
79(26.6) | 35(25.4) | 44(27.7) | 0.694 | |
|
77(25.9) | 32(23.2) | 45(28.3) | 0.354 | |
|
67(22.6) | 28(20.3) | 39(24.5) | 0.407 | |
| Eating and Swallowing Function |
|
82(27.6) | 35(25.4) | 47(29.6) | 0.438 |
|
31(10.4) | 13(9.4) | 18(11.3) | 0.704 | |
|
43(14.5) | 16(11.6) | 27(17.0) | 0.247 | |
|
43(14.5) | 26(18.8) | 17(10.7) | 0.049 | |
| Nutritional Status, Appetite and General condition |
|
72(24.2) | 32(23.2) | 40(25.2) | 0.786 |
|
46(15.5) | 26(18.8) | 20(12.6) | 0.150 | |
|
38(12.8) | 14(10.1) | 24(15.1) | 0.226 | |
|
56(18.9) | 27(19.6) | 29(18.2) | 0.769 | |
| Oral Dryness and Oral Hygiene |
|
104(35.0) | 49(35.5) | 55(34.6) | 0.903 |
|
47(15.8) | 20(14.5) | 27(17.0) | 0.634 | |
|
49(16.5) | 27(19.6) | 22(13.8) | 0.211 | |
|
47(15.8) | 22(16.9) | 25(15.7) | 1.000 | |
| Oral frailty (OF-5≧2) | 117(39.4) | 51(37.0) | 66(41.5) | 0.475 | |
Table 3.
Distribution of OF-20 domain scores stratified by sex. Data are presented as n (%). Domain scores range from 0 to 4 points based on the number of positive responses to the four items in each domain. Abbreviations: OF-20, Oral Frailty 20-item checklist.
Table 3.
Distribution of OF-20 domain scores stratified by sex. Data are presented as n (%). Domain scores range from 0 to 4 points based on the number of positive responses to the four items in each domain. Abbreviations: OF-20, Oral Frailty 20-item checklist.
| Men (n = 138) | Women (n = 159) | |||||||||
| Scores | 0 | 1 | 2 | 3 | 4 | 0 | 1 | 2 | 3 | 4 |
| Speech and Social Communication, n (%) | 62(44.9) | 38(27.5) | 22(15.9) | 15(10.9) | 1(0.7) | 68(42.8) | 46(28.9) | 35(22.0) | 8(5.0) | 2(1.3) |
| Dentition and Masticatory Function, n (%) | 68(49.3) | 32(23.2) | 18(13.0) | 15(10.9) | 5(3.6) | 64(40.2) | 41(25.8) | 30(18.9) | 16(10.1) | 8(5.0) |
| Eating and Swallowing Function, n (%) | 80(58.0) | 37(26.8) | 14(10.1) | 3(2.2) | 4(2.9) | 91(57.2) | 41(25.8) | 15(9.4) | 10(6.3) | 2(1.3) |
| Nutritional Status, Appetite and General condition e, n (%) | 75(54.3) | 37(26.8) | 20(14.5) | 2(1.4) | 4(2.9) | 87(54.7) | 39(24.5) | 27(17.0) | 4(2.5) | 2(1.3) |
| Oral Dryness and Oral Hygiene, n (%) | 55(39.9) | 54(39.1) | 24(17.4) | 4(2.9) | 1(0.7) | 64(40.3) | 64(40.3) | 28(17.6) | 3(1.9) | 0(0.0) |
Disclaimer/Publisher’s Note: The statements, opinions and data contained in all publications are solely those of the individual author(s) and contributor(s) and not of MDPI and/or the editor(s). MDPI and/or the editor(s) disclaim responsibility for any injury to people or property resulting from any ideas, methods, instructions or products referred to in the content. |
© 2026 by the authors. Licensee MDPI, Basel, Switzerland. This article is an open access article distributed under the terms and conditions of the Creative Commons Attribution (CC BY) license.
Copyright: This open access article is published under a Creative Commons CC BY 4.0 license, which permit the free download, distribution, and reuse, provided that the author and preprint are cited in any reuse.