

Submitted:
31 August 2026
Posted:
01 September 2026
You are already at the latest version
Abstract
This study evaluates the financial viability of municipal solid waste (MSW) composting in Attanagalla Pradesheeya Sabha (APS), Sri Lanka, using a scenario-based financial assessment. Three scenarios were compared: the existing waste-management system (S0), optimized utilization of existing composting capacity (S1), and expanded composting with additional infrastructure investment (S2). Capital and operating expenditures, compost sales, waste-collection fees, and government contributions were incorporated. Financial performance was assessed using the Benefit–Cost Ratio (BCR), Net Present Value (NPV), and incremental cost analysis, with NPV evaluated over 15 years at a 9% discount rate. Financial performance improved progressively from S0 to S2. Under baseline assumptions, S2 achieved annual financial break-even, generating the strongest annual financial performance among the scenarios, while its 15-year NPV remained negative at approximately LKR −26.2 million, indicating that the initial infrastructure investment was not fully recovered within the assessment period. Sensitivity analysis showed that S2 remains financially viable only under relatively favorable operating and market conditions, particularly with effective OPEX control and high compost sales realization. The findings indicate that expanded composting can improve municipal cost recovery and support agricultural resource recovery, but infrastructure expansion should be accompanied by market development, product-quality assurance, and careful financial management for long-term financial sustainability.
Keywords:
municipal solid waste
; composting
; financial viability
; scenario analysis
; Sri Lanka
1. Introduction
Municipal solid waste (MSW) management remains a pressing global challenge, particularly in low- and middle-income countries where rapid urbanization, population growth, and limited institutional capacities continue to outpace waste infrastructure development [1]. Currently, approximately 30% of global waste remains either openly dumped or uncollected, thereby exacerbating risks to local economies, public health, and the environment [2]. Open dumping, which persists as the dominant disposal practice across many developing nations, contributes substantially to greenhouse gas (GHG) emissions, groundwater contamination, and public health risks [2,3]. Concurrently, the global shift toward sustainable agriculture has intensified demand for organic fertilizers (OFs), driven by growing concerns over the environmental consequences of excessive chemical fertilizer (CF) use, including soil degradation, water eutrophication, and biodiversity loss [4,5,6].
Sri Lanka generates approximately 7,500–8,000 metric tonnes of municipal solid waste per day at the national level [7]. The Western Province, where the present study area is located, represents the country’s principal waste-generating region and faces particularly high pressures on municipal waste-management infrastructure [8]. Previous comparative research on municipal solid waste management in Sri Lanka has also identified persistent institutional, administrative, and operational constraints affecting local-authority waste-management performance, emphasizing the need for context-specific and resource-efficient management strategies [9].Earlier national assessments reported open dumping as the predominant waste-management pathway, accounting for approximately 85% of managed waste, compared with approximately 10% treated through composting and 5% through recycling [10]. These conditions highlight the continuing need to strengthen waste diversion and resource-recovery pathways, particularly for biodegradable municipal waste. The country's agricultural sector is heavily dependent on rice as a staple crop, supporting approximately 1.8 million farmers and feeding a population of over 22 million [11]. Historically, paddy cultivation in Sri Lanka has relied on imported CFs, most notably urea, triple super phosphate (TSP), and muriate of potash (MOP). The Government of Sri Lanka's (GOSL) abrupt enactment of Regulation No. 07/2021, which banned chemical fertilizers and agrochemicals in pursuit of 100% organic farming, exposed deep structural vulnerabilities in the country's agricultural and waste management systems. While the policy was reversed following a 4.6% decline in agricultural production and a rice import deficit of 134,716 metric tons in late 2021, it nonetheless catalyzed renewed national interest in domestic OF production [12].
Solid Waste Compost (SWC) derived from MSW has been widely recognized as a viable organic amendment that can improve soil structure, enhance microbial activity, and substitute for chemical inputs in crop production [13,14]. This represents a significantly missed opportunity both for nutrient recovery and for reducing landfill-related methane emissions, a potent contributor to climate change.
Despite the growing literature on composting within the separate domains of solid waste management and organic agriculture, few studies have examined their integration, particularly from a financial feasibility perspective in developing country contexts [15,16]. The economic viability of SWC production is a critical but underexplored determinant of whether composting can be scaled up as a mainstream waste management strategy. Without a clear demonstration of financial sustainability, local authorities which are the primary operators of composting facilities in Sri Lanka are unlikely to invest in the infrastructure upgrades necessary to increase compost yield and quality [16]. Furthermore, SWC's market competitiveness relative to other available organic fertilizers, and its price optimization potential, have received limited empirical attention in the Sri Lankan context.
A previous study by Fernando and Aramaki [17] developed a scenario-based framework for the APS waste management system and demonstrated the greenhouse-gas mitigation potential of progressively diverting biodegradable municipal waste from open dumping to composting. Building on that environmental assessment, the present study extends the same case study framework to examine a distinct but complementary question: whether such an expansion of municipal composting is financially viable for a resource constrained local authority. Accordingly, the present analysis evaluates the existing APS waste-management system (S0) [18], optimized utilization of existing composting capacity (S1), and expanded composting with additional infrastructure investment (S2), with particular emphasis on capital and operating costs, revenue generation, municipal cost recovery, and long-term financial performance Financial performance is assessed using Benefit-Cost Ratio (BCR) and Net Present Value (NPV) over a 15-year project horizon, complemented by incremental cost analysis to identify the cost implications of scaling up SWC production. Accordingly, this study examines (i) how progressive increases in municipal composting capacity affect financial performance; (ii) whether operational optimization or infrastructure-led expansion can achieve municipal cost recovery; and (iii) how sensitive the financially preferred scenario is to operating expenditure, SWC selling price, and market realization.
By quantifying the financial implications of progressively increasing composting within an existing local-authority waste-management system, this study contributes novel empirical evidence to support evidence-based policy formulation in sustainable waste management and organic agriculture in Sri Lanka, with broader implications for similar low- and middle-income country contexts pursuing integrated resource recovery strategies aligned with the UN Sustainable Development Goals (SDGs 2, 11, 12, and 13).
2. Materials and Methods
2.1. Study Area
This study was conducted in the Waste Management Unit (WMU) of APS, located within the Attanagalla Divisional Secretariat (ADS) division of Gampaha District, Western Province, Sri Lanka. APS represents a mixed semi-urban and rural context typical of many local authorities (LAs) in Sri Lanka's developing peri-urban fringe. WMU of APS is responsible for municipal solid waste management within 25 wards; however, waste collection coverage remains limited because of insufficient vehicles, infrastructure, and operational resources. Agriculture is also important within the study area. Approximately 1,574 ha are allocated to paddy cultivation, providing a potentially relevant agricultural end-use context for locally produced SWC. APS was therefore selected as a representative case of a resource-constrained local authority where municipal waste management and agricultural resource needs can be evaluated through an integrated financial scenario analysis.
2.2. Research Design
This study builds upon the scenario-based waste-management framework previously developed for APS by Fernando and Aramaki [17], which evaluated the greenhouse-gas implications of progressively increasing biodegradable-waste diversion to composting. The present study retains the corresponding S0–S2 material-flow structure to ensure methodological continuity but extends the framework to a comparative financial assessment of municipal composting Three scenarios were established under a common system boundary and an identical MSW input of 450 t/month to enable direct comparison of alternative composting strategies (figure 1). Across all three scenarios, recycling (3.5 t/month) and waste-to-energy (WtE) treatment (64.4 t/month) were held constant to isolate the financial effects associated with changes in biodegradable-waste diversion to composting and residual disposal.
The material flows under S0, S1, and S2 were quantified using a common total MSW input of 450 t/month to ensure consistency across the scenario comparison. Table 1 summarizes the allocation of MSW among composting, animal feed, recycling, Waste -to-Energy (WtE), and open dumping/residual disposal, and presents the corresponding mass balance for each scenario.
S0 represents the existing APS waste management system and serves as the baseline, with 50 t/month of biodegradable waste processed for composting. S1 represents operational optimization of the existing facility, increasing composting to 106.4 t/month without major infrastructure expansion. S2 represents an expanded composting system in which the entire available biodegradable waste fraction (279 t/month) is directed to composting, requiring additional infrastructure and capital investment. This scenario structure therefore captures a progressive transition from current practice, through improved use of existing capacity, to full-scale composting expansion. Each scenario was analysed using the same operational assumptions, cost categories, and revenue streams to ensure comparability. Capital expenditure (CAPEX), operating expenditure (OPEX), and revenue from compost sales were estimated for each scenario using operational records, local authority financial data, equipment quotations, and market prices. Financial performance was subsequently evaluated using BCR, NPV, and the incremental cost analysis.
The research framework consisted of four sequential stages: (i) collection of operational and financial data, (ii) development of alternative composting scenarios, (iii) estimation of costs and revenues for each scenario, and (iv) comparative financial evaluation to identify the most economically viable waste management option (Figure 2).
2.3. Data Sources and Financial Assumptions
The financial assessment was based on operational and financial information obtained from APS records [18], field observations, and information provided by the APS Waste Management Unit, supplemented by relevant government statistics and published sources [19,20]. The data included monthly waste flows, compost production, labour and operational requirements, existing infrastructure, waste collection and transportation activities, compost sales, and revenues associated with municipal waste management. For scenario modelling, complete separation of the identified biodegradable and non-biodegradable waste fractions was assumed to establish an upper-bound technical scenario for resource recovery. This upper-bound assumption should be interpreted considering previous APS-based evidence showing that household participation in waste source separation varies considerably with waste-collection service availability and local operational conditions [21]. The night soil was excluded from the analysis due to the absence of legal provisions governing its use as fertilizer in Sri Lanka. Scenario-specific cost and revenue components were subsequently estimated according to the operational requirements of S0, S1, and S2.
The compost conversion factor applied in the scenario analysis was derived from the existing operational performance reported by APS [18]. Accordingly, approximately 50 t/month of biodegradable waste processed through the existing composting facility yields approximately 13 t/month of finished SWC. This corresponds to an observed compost yield of approximately 26%, calculated as the ratio of finished compost output to biodegradable waste input. The same conversion factor was applied to S1 and S2 to estimate compost production under increased processing volumes.
The financial assessment incorporated OPEX and, where applicable, capital-related costs. Under S2, additional infrastructure investment was required for expansion of the composting facility and acquisition of a new 5-t huller, resulting in an initial capital investment of LKR 45 million. The treatment of depreciation and capital expenditure in the financial calculations is described in Section 2.7.

Table 2.
Data sources and key assumptions used in the financial assessment of the three MSW management scenarios.
Table 2.
Data sources and key assumptions used in the financial assessment of the three MSW management scenarios.
| Data/Parameter | Application in Financial Assessment | Data Source/Basis |
|---|---|---|
| MSW quantity and material flows | Establishment of waste flows under S0, S1, and S2 | APS operational records, field information, and scenario material-balance analysis |
| Biodegradable waste directed to composting | S0: 50.0; S1: 106.4; S2: 279.0 t/month | APS operational data and scenario estimates |
| Solid waste compost (SWC) production | S0: 13.0; S1: 27.6; S2: 72.5 t/month | APS production data and scenario estimates |
| Waste directed to open dumping | S0: 202.1; S1: 145.7; S2: 103.1 t/month | Scenario material-balance analysis |
| Waste collection OPEX | Estimation of labour and fuel expenditure associated with collection | APS operational and financial information |
| Composting OPEX | Estimation of labour, electricity, fuel, and water costs | APS operational and financial information |
| Open-dump transportation OPEX | Estimation of labour and fuel expenditure for transportation to the dumping site | APS operational and financial information |
| S2 capital investment | Additional composting floor/piling area and acquisition of a new 5-t huller | Infrastructure and equipment requirements estimated for S2 |
| Existing infrastructure and equipment | Existing collection vehicles, bobcat, and 3-t huller excluded from additional capital investment | Existing APS assets; additional capital and depreciation costs excluded |
| Land | No additional land acquisition cost included | Existing land/dumping site owned by APS |
| Compost sales revenue | SWC production × selling price | APS compost production and selling-price information |
| Government contribution | Included as a contribution toward workers' salaries | Existing APS/government financial arrangement |
| Waste collection fee revenue | Included in total municipal waste-management revenue | APS financial information |
| Recycling | Maintained at 3.5 t/month across S0, S1, and S2 | Fixed scenario assumption |
| Waste-to-Energy (WtE) | Maintained at 64.4 t/month across S0, S1, and S2 | Fixed scenario assumption |
| Recycling and WtE costs/revenues | Recycling-related volume and associated revenues were retained in total municipal revenue, and were held constant across S0 – S2 . | Study boundary assumption to isolate financial effects attributable to changes in composting |
| Discount rate | 9% per annum for NPV estimation | Central Bank of Sri Lanka reference adopted in the original analysis [22] |
| Financial assessment period | 15 years | Study assessment horizon | 5-t huller useful life | 15 years | Depreciation assumption |
| Waste collection pattern | No seasonal variation in monthly waste collection | Study assumption |
| Waste segregation | Upper-bound scenario assumption: complete availability of the identified biodegradable fraction for separation and recovery under S2. | Study assumption |
2.4. Baseline Infrastructure and Cost–Revenue Structure (S0)
Scenario S0 represents the existing MSW management system operated by APS and serves as the baseline for evaluating the alternative scenarios. The financial assessment considers the existing infrastructure, manpower, and operational inputs associated with waste collection, composting, and open dumping, together with the corresponding revenue sources. Table 3 summarizes the principal infrastructure and cost–revenue components considered under S0.
2.5. Operational Structure of Alternative Scenarios
Following the baseline scenario (S0), two alternative scenarios were developed to evaluate the financial implications of increasing biodegradable waste diversion to composting under different levels of operational and infrastructure development. Both S1 and S2 were constructed using the same total MSW input of 450 t/month and the same system boundary as S0 to ensure direct comparability. Recycling and WtE flows were maintained at the levels defined in Section 2.2. The principal differences among the scenarios therefore arise from the quantity of biodegradable waste processed through composting, the corresponding compost output, the amount of residual waste directed to open dumping, and the level of infrastructure and operating resources required.
2.5.1. Scenario 1: Optimized Utilization of Existing Capacity (S1)
Scenario S1 represents improved utilization of the existing APS composting facility without major physical expansion. Under this scenario, improved segregation and operational efficiency enable the quantity of biodegradable waste directed to composting to increase from 50.0 t/month in S0 to 106.4 t/month. The S1 composting input of 106.4 t/month represents the maximum processing level estimated to be achievable using the existing APS composting infrastructure without major capital expansion, based on facility capacity and operational records. This results in an estimated SWC production of 27.6 t/month. The existing allocation of 130 t/month of biodegradable waste to animal feed is retained, while the quantity of residual waste directed to open dumping declines to 145.7 t/month. Existing collection vehicles, the bobcat, huller, and composting infrastructure continue to be used, and therefore S1 primarily reflects increased operational utilization rather than substantial new capital investment. The additional financial requirements associated with increased labour, fuel, electricity, water, and transportation were incorporated into the scenario assessment.
2.5.2. Scenario 2: Expanded Composting Capacity (S2)
Scenario S2 represents an expanded composting system in which the entire biodegradable fraction available within the defined system boundary (279.0 t/month) is directed to composting. The remaining 103.1 t/month directed to open dumping consists of non-compostable residual waste remaining after recycling and WtE allocation, rather than biodegradable waste. Accordingly, 279.0 t/month of biodegradable waste are directed to composting, increasing estimated SWC production to 72.5 t/month. In this scenario, the existing diversion of biodegradable waste to animal feed is discontinued, and the quantity of waste directed to open dumping is reduced to 103.1 t/month. Unlike S0 and S1, S2 requires additional capital investment to increase processing capacity, including expansion of the composting piling and floor areas and acquisition of a new 5-t huller. The additional infrastructure, equipment, labour, fuel, electricity, water, maintenance, and related operating requirements were included in the financial assessment. The proposed 5-t huller was assumed to have a useful life of 15 years for depreciation purposes.
2.6. Cost–Revenue Framework
A common cost–revenue framework was applied to S0, S1, and S2 to ensure consistent financial comparison across the three waste management pathways. The analysis considered costs associated with waste collection, composting, and transportation of residual waste to the open dumping site. OPEX included labour, fuel, electricity, and water requirements, while CAPEX was incorporated only where additional infrastructure or equipment was required. Under S2, this included expansion of the composting area and acquisition of a new 5-t huller, and the initial capital investment consisted of LKR 3.0 million for the proposed 5-t huller and LKR 42.0 million for facility expansion. Annual scenario costs included OPEX and, where applicable, depreciation calculated according to the accounting treatment described in Section 2.7.
Revenue components considered in the financial assessment included income from SWC sales, waste collection fees, and government supplementation toward workers’ salaries. The assessment was conducted from the financial perspective of APS rather than from a societal economic perspective; consequently, government salary contributions and waste-service fee receipts were treated as financial inflows to the local authority. This approach allowed the analysis to isolate the financial effects attributable specifically to changes in composting capacity, compost production, and residual waste disposal.
2.7. Financial Evaluation Methods
The financial performance of S0, S1, and S2 was evaluated using three complementary indicators: BCR, NPV, and the incremental cost per additional tonne of SWC production. Annual costs and revenues were first estimated for each scenario using the common cost–revenue framework described above. The BCR was calculated as the ratio of total annual benefits to total annual costs,
 where Bs and Cs represent the total annual benefits and costs of scenario s, respectively. A BCR greater than 1 indicates that revenues exceed costs, whereas a value below 1 indicates financial non-viability. Long-term financial performance was assessed using Net Present Value (NPV) over a 15-year assessment period at an annual discount rate of 9% [22]. Annual net financial flows were assumed to remain constant over the assessment period, consistent with the scenario assumptions. No additional initial investment was assigned to S0 and S1, whereas an initial investment of LKR 45 million was assigned to S2 for facility expansion and acquisition of the proposed 5-t huller.
NPV = − I₀ + Σₜ₌₁¹⁵ [CFₜ / (1 + 0.09)ᵗ]
Where I0 is the initial capital investment, CFt is the annual net cash flow in year t, 0.09 is the discount rate, and 15 years is the assessment period.
The financial analysis applies scenario-specific accounting assumptions in which depreciation is included for newly introduced S2 assets, while depreciation of existing APS assets is excluded because historical acquisition-cost information was unavailable. Straight-line depreciation was applied, assuming useful lives of 15 years for the 5-t huller and 25 years for the facility expansion. Consequently, the results should be interpreted as a comparative local-authority financial assessment rather than a complete asset-replacement or societal economic appraisal.
In addition, the incremental financial requirement for increasing compost production was assessed using the marginal cost of additional SWC production,
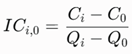 where Ci and Co represent the costs of the alternative and baseline scenarios, respectively, and Qi and Qo represent their corresponding SWC outputs. This indicator was used to compare the additional cost of expanding compost production under S1 and S2 relative to S0 and to assess the scope for improving financial sustainability through compost price optimization.
2.8. Financial Sensitivity Analysis
A deterministic one-at-a-time sensitivity analysis was conducted for Scenario S2 to evaluate the stability of its financial performance under plausible variations in key operating and market parameters. S2 was selected because it was the only scenario reaching the financial break-even threshold under the baseline assumptions and because it required additional infrastructure investment. Three variables with direct implications for annual financial performance were examined: (i) SWC selling price, (ii) OPEX, and (iii) the proportion of projected SWC production successfully sold.
The baseline S2 model assumed annual revenue of LKR 28.972 million and annual cost of LKR 28.520 million. SWC sales accounted for LKR 17.4 million of annual revenue, while the remaining revenue streams were held constant during the sensitivity calculations. The SWC selling price was independently varied by ±20%, while all other revenue components and costs were maintained at their baseline values. OPEX was also varied by ±20%, while annual depreciation was held constant at LKR 1.8 million. Market-realization uncertainty was assessed by assuming that 80%, 90%, and 100% of projected SWC production was sold at the baseline unit price. Each parameter varied independently while all other model inputs remained unchanged.
Financial performance under each sensitivity condition was evaluated using the annual financial balance and BCR. A BCR greater than 1.0 was interpreted as annual financial viability, while a value below 1.0 indicated that annual revenues were insufficient to recover annual costs.
Table 4.
Parameters applied in the financial sensitivity analysis of Scenario S2.
| Parameter | Baseline condition | Sensitivity conditions | Indicator evaluated |
|---|---|---|---|
| SWC selling price | LKR 20/kg | −20%, baseline, +20% | Annual balance; BCR |
| OPEX | LKR 26.64 million/year | −20%, baseline, +20% | Annual balance; BCR |
| SWC sales realization | 100% of projected output | 80%, 90%, 100% | Annual balance; BCR |
Note: Only the selected parameter varied in each sensitivity test; all other model inputs were held at their baseline values.
3. Results
3.1. Cost and Revenue Performance across Scenarios
Relative to S0, S2 reduced the modeled quantity directed to open dumping/residual disposal by approximately 49%, equivalent to about 99 t/month. Financial performance also improved progressively from S0 to S2.The baseline scenario (S0) generated the lowest annual revenue and the largest financial deficit, whereas S1 reduced the deficit through increased SWC production. Although S2 incurred the highest annual accounting cost because of increased operating requirements and depreciation associated with the additional infrastructure and equipment, it generated the highest revenue and was the only scenario to achieve a positive annual financial balance. Annual costs were approximately LKR 23.4 million, 24.2 million, and 28.5 million for S0, S1, and S2, respectively, while the corresponding annual revenues were approximately LKR 12.8 million, 17.2 million, and 29.0 million. Consequently, the annual financial balance improved from a deficit of approximately LKR 10.6 million in S0 and LKR 7.0 million in S1 to a surplus of approximately LKR 0.5 million in S2, demonstrating progressively improved financial performance with increased composting capacity.
Table 5.
Comparative annual financial performance of S0, S1, and S2.
| Scenarios | S0 | S1 | S2 |
|---|---|---|---|
| Annual cost (LKR) (in millions) | 23.4 | 24.2 | 28.5 |
| - Waste collection OPEX | 17.2 | 19.1 | 19.1 |
| -Composting OPEX | 2.5 | 2.3 | 5.5 |
| -Annual depreciation of new assets | 0.0 | 0.0 | 1.8 |
| -open dump transportation OPEX | 3.7 | 2.8 | 2.1 |
| Annual revenue (LKR) (in millions) | 12.8 | 17.2 | 29.0 |
| -Supplementation from national government | 8.1 | 9.0 | 10.0 |
| -SWC selling | 3.1 | 6.6 | 17.4 |
| -Revenue from recycled items + waste fee tax | 1.6 | 1.6 | 1.6 |
| Deficit/surplus | -10.6 | -7.0 | +0.5 |
The increase in financial performance corresponded with higher SWC production, which rose from 13.0 t/month in S0 to 27.6 t/month in S1 and 72.5 t/month in S2. Although S2 required greater expenditure, the increase in compost output and associated revenue was sufficient to offset the additional cost under the assumptions adopted in the analysis.
3.2. Benefit–Cost Ratio (BCR)
The BCR increased progressively across the three scenarios. S0 recorded a BCR of 0.547, indicating that annual revenues recovered only slightly more than half of the associated costs. S1 improved the BCR to 0.711 but remained below the financial viability threshold of 1.0. In contrast, S2 achieved a BCR of 1.016, making it the only scenario in which annual financial benefits exceeded annual costs. The results therefore indicate that increasing compost production through operational optimization alone was insufficient to achieve financial viability, whereas the expanded-capacity scenario crossed the break-even threshold.
Table 6.
Benefit–Cost Ratio and comparative financial status of the three scenarios.
| Scenario | BCR | Interpretation |
|---|---|---|
| S0 | 0.547 | Financially non-viable |
| S1 | 0.711 | Improved relative to S0, but financially non-viable |
| S2 | 1.016 | Exceeds the financial viability threshold |
Note: BCR values were calculated using the unrounded underlying annual cost and revenue estimates; values presented in Table 5 are rounded for reporting purposes.
3.3. Net Present Value over the Assessment Period
The 15-year NPV assessment showed substantial differences in long-term financial performance across the three scenarios. S0 exhibited the weakest trajectory, reflecting persistent annual financial losses, while S1 performed comparatively better but remained below the break-even position throughout the assessment period. S2 exhibited the strongest financial trajectory, recording the least negative cumulative NPV among the three scenarios, although it remained below the NPV break-even threshold throughout the 15-year assessment period (Table 7; Figure 3). Figure 3 complements the numerical NPV results presented in Table 7 by illustrating the cumulative financial trajectories of the three scenarios over the 15-year assessment period. S0 and S1 show progressively declining cumulative NPVs because of their recurring annual financial deficits, whereas S2 improves from its initial investment-related NPV of −LKR 45 million due to positive annual net cash flows. Nevertheless, none of the scenarios reaches the NPV break-even line within the assessment period. At Year 15, S2 records the least negative NPV (−LKR 26.20 million), compared with S1 (−LKR 56.30 million) and S0 (−LKR 86.10 million), confirming its comparatively stronger long-term financial performance.
Although the scenario did not achieve full recovery within the assessment horizon, its substantially improved trajectory indicates greater potential for long-term financial sustainability relative to S0 and S1.
3.4. Incremental Cost of Additional SWC Production
The incremental cost associated with increasing SWC production was evaluated relative to the baseline scenario (S0). Using the annual accounting costs and annual SWC production of each scenario, the analysis quantified the additional annual cost required to produce each additional tonne of SWC relative to the existing system. The results are presented in Table 8.
The incremental cost of increasing SWC production under S1 was approximately LKR 4,377 per additional tonne relative to S0, whereas S2 required approximately LKR 7,097 per additional tonne. The higher incremental cost under S2 reflects the additional operating and annualized capital costs associated with expanded processing capacity. However, S2 also produced a substantially greater increase in SWC output, adding approximately 714 t/year relative to S0 compared with 175.2 t/year under S1. These results should therefore be interpreted together with the BCR, NPV, and revenue performance of each scenario rather than as an independent measure of overall financial attractiveness.
3.5. Indicative Market Price Context for SWC
The current selling price of SWC produced by APS was approximately LKR 20/kg, which was substantially lower than the prices reported for other organic fertilizers available in Sri Lanka (table 9). The prices range from approximately LKR 114/kg for bio-carbon organic compost granular fertilizer to LKR 300/kg for bone meal fertilizer, with cow dung, chicken manure, and goat manure priced between LKR 164 and LKR 180/kg. The comparatively low SWC selling price indicates a substantial difference between the existing municipal compost price and other organic fertilizer prices in the market.
3.6. Financial Sensitivity Analysis Results
The sensitivity analysis (table 10) demonstrated that the financial viability of S2 is highly dependent on operating costs, SWC pricing, and successful market realization. Under the baseline assumptions, S2 generated annual revenue of LKR 28.972 million against annual costs of LKR 28.520 million, yielding a modest annual surplus of approximately LKR 0.452 million and a recalculated BCR of 1.016. This places the scenario only slightly above the financial break-even threshold.
The results indicate that S2 should be regarded as conditionally financially viable rather than strongly profitable. A 20% decrease in the SWC selling price reduces the BCR from 1.016 to 0.894, whereas a 20% increase raises it to 1.138. OPEX has an even stronger influence on financial performance: a 20% increase reduces the BCR to 0.856, while a 20% reduction increases it to 1.249. Market realization is similarly critical. At a 90% sales realization rate, the BCR declines to 0.955, indicating that annual costs would no longer be fully recovered.
Figure 4 illustrates the sensitivity of the S2 BCR to variations in operating expenditure, SWC selling price, and sales realization. Relative to the baseline BCR of 1.016, OPEX produced the largest variation in financial performance, with the BCR ranging from 0.856 under a 20% increase in OPEX to 1.249 under a 20% reduction. Changes in SWC selling price also substantially affected financial viability, while reduced sales realization progressively lowered the BCR below the break-even threshold of 1.0.
The baseline model further implies that approximately 97.4% of projected SWC sales must be realized at the current price for S2 to break even, assuming all other revenues and costs remain unchanged. Similarly, annual OPEX could increase by only approximately 1.7% above the baseline level before the annual BCR falls below 1.0. These thresholds demonstrate the narrow financial margin of the expanded composting scenario and highlight the importance of controlling operating expenditure and securing a reliable market for the additional SWC output.
4. Discussion
4.1. From Capacity Optimization to Cost Recovery
The scenario-based financial assessment reveals that a gradual increase in municipal solid waste composting can enhance the financial performance of local-authority waste management. However, expanding processing capacity does not guarantee financial sustainability. Financial performance improved from S0 to S1 and S2 as larger volumes of biodegradable waste were redirected to compost production. S0 incurred the largest annual deficit, whereas S1 reduced this deficit by increasing compost production from 13.0 to 27.6 t/month, primarily through better use of existing infrastructure. Despite this improvement, S1 did not reach the annual financial break-even point. In contrast, S2 increased SWC production to 72.5 t/month and was the only scenario to achieve a positive annual financial balance. These findings suggest that optimizing the use of existing assets can mitigate municipal financial losses, but addressing structural processing limitations may necessitate further investment when current capacity is inadequate for cost recovery. This interpretation is consistent with previous financial and techno-economic studies showing that the performance of municipal composting systems is strongly influenced by processing scale, facility configuration, operational efficiency, cost structure, and the availability of viable markets for recovered compost products [15,16,24].
4.2. Strategic Pathways for Composting Development
The three scenarios represent progressively more intensive pathways for municipal composting development. S0 reflects continuation of the existing system, S1 represents operational optimization using existing infrastructure, and S2 represents investment-led capacity expansion. The comparison demonstrates that improved utilization of existing capacity alone reduced the municipal financial deficit but was insufficient to achieve annual cost recovery. In contrast, S2 required an initial capital investment of LKR 45 million to remove processing-capacity constraints and substantially increase compost output and associated revenue. The results suggest that infrastructure investment can improve financial performance when capacity is utilized and converted into output, consistent with evidence that composting economics are sensitive to system configuration and design [16,24]. However, investment decisions should consider not only technical processing capacity but also the ability of the municipality to operate the expanded system efficiently and sell the additional compost produced.
4.3. Convergence and Divergence of BCR and NPV Trajectories
BCR and NPV analyses provide distinct financial insights. Under baseline assumptions, S2 is the only scenario that achieves annual cost recovery, whereas the persistent deficits of S0 and S1 keep them below the viability threshold. However, despite achieving an annual operational surplus, S2’s 15-year NPV remains negative. This contrast highlights an important distinction for infrastructure-intensive municipal projects: annual operating viability does not necessarily imply recovery of the initial capital investment. Consequently, while S2 demonstrates a significantly stronger long-term financial trajectory compared to the status quo (S0) and operational optimization (S1), it should be interpreted as a conditionally viable municipal pathway that may still require external capital subsidies or low-cost development financing to bridge the gap between daily self-sufficiency and long-term asset recovery.
4.4. Sensitivity and Financial Risks of Expanded Operations
The sensitivity analysis further demonstrates that the apparent annual viability of S2 is conditional rather than robust. Operating expenditure (OPEX) emerged as the most critical determinant of financial success among the variables examined, with even minor cost overruns rapidly pushing the project back into a net annual deficit. Similarly, S2's viability is highly sensitive to compost market performance; a drop in either the selling price realized or the proportion of compost output successfully sold would quickly erode the narrow baseline margin. These stringent thresholds highlight that S2 is only marginally viable under baseline conditions and is highly susceptible to operational inefficiencies or market fluctuations. Therefore, expanding production capacity should not be regarded merely as a technical waste-disposal solution. Instead, it must be managed as an active commercial venture, where controlling operational costs and ensuring reliable market development are prioritized alongside the physical diversion of waste.
4.5. Operational Cost Control and Efficiency
Since OPEX exerts the most significant influence on annual financial performance, enhancing operational efficiency is essential for maintaining cost recovery under expanded operations. In resource-constrained municipalities like APS, waste management departments must prioritize strategies aimed at improving equipment utilization, reducing unnecessary fuel and electricity consumption, minimizing downtime, and optimizing labor allocation. Given that S2 operates on a narrow annual surplus, even minor inflation in labor wages or fuel prices could rapidly destabilize its break-even status. Consequently, routine operational audits and preventive maintenance protocols particularly for the proposed 5-t huller are not merely technical recommendations, but critical financial safeguards required to protect the municipality from recurring operational deficits.
4.6. Agricultural Pricing and Product Differentiation
Integrating expanded composting into local agricultural markets presents a vital revenue-enhancement opportunity. The current APS compost selling price (approximately LKR 20/kg) is substantially lower than commercial organic alternatives in Sri Lanka. While this low price point presents an initial marketing advantage to encourage adoption among local paddy farmers, it also limits the facility's cost-recovery capacity. However, raising the selling price to close this gap cannot be done arbitrarily; it must be justified by verified product quality, chemical consistency, proper packaging, and official organic certification. Building farmer confidence through demonstrated agronomic performance and establishing reliable municipal distribution channels are essential prerequisites for transitioning the composting facility from a waste-disposal service to a self-sustaining commercial asset.
4.7. Public Service Mandate and Investment Trade-offs
In assessing these scenarios, it is essential to interpret the financial outcomes within the institutional framework of public administration. Local authorities manage waste management as a public service, not as a profit-oriented enterprise. Therefore, financial sustainability should not be evaluated based on commercial profitability standards. Instead, the focus should be on reducing chronic municipal deficits and progressing toward annual operational cost recovery, which are significant fiscal accomplishments. From this perspective, the higher capital expenditure required for S2 is justified, as the investment alleviates a binding physical capacity constraint, enabling the municipality to expand compost production and generate sufficient recurring revenue to cover operational costs. Policymakers should regard S2 not as a highly profitable commercial investment but as a fiscally optimized public resource-recovery pathway.
4.8. Phased Implementation Strategy
The findings complement the assessment reported by Fernando and Aramaki [17]. Earlier analysis showed that in-creasing biodegradable-waste diversion from S0 to S2 reduces GHG emissions, but this pathway does not guarantee long-term financial viability. To mitigate the financial risks identified in the sensitivity analysis, a phased implementation strategy is highly recommended for the local authority. In the initial phase, APS should focus on improving source separation at the household level [21] and optimizing the operational efficiency of the existing facility (as modeled in S1) to maximize feedstock quality and identify operational bottlenecks. Transitioning to major infrastructure expansion (S2) should only proceed once the municipality secures a reliable supply of segregated organic waste, demonstrates consistent operational capacity, and establishes verifiable demand within the local agricultural sector. Post-expansion, the facility's performance should be closely monitored using key operational indicators; such as actual compost sales realization rates, operating expenditures, and product quality.
4.9. Study Limitations and Future Research Directions
Several modeling limitations should be acknowledged when interpreting these conclusions. The financial model assumes constant waste generation rates and does not capture seasonal fluctuations in organic waste composition or compost demand. Furthermore, S2 represents an upper-bound scenario assuming complete source separation; in practice, contamination and variable public participation may reduce actual compost yields. Additionally, this analysis was conducted strictly from the financial perspective of the local authority, meaning that valuable societal externalities—such as avoided public health costs, landfill space conservation, greenhouse-gas mitigation, and chemical fertilizer substitution—were not monetized. Future research should incorporate these broader economic externalities and employ probabilistic modeling, such as Monte Carlo simulations, to capture market and operational uncertainties more dynamically as long-term empirical data become available.
5. Conclusions
This study evaluated the financial implications of progressively increasing municipal solid waste composting within the APS using three operational scenarios. Financial performance improved from the existing system (S0) to optimized use of existing capacity (S1) and further to expanded composting with additional infrastructure investment (S2). S2 achieved the strongest annual financial performance, generating approximately LKR 29.0 million in annual revenue against LKR 28.5 million in annual costs and a Benefit–Cost Ratio of 1.016. It also reduced modeled residual disposal by approximately 49% relative to S0, demonstrating the potential of expanded composting to improve both municipal cost recovery and biodegradable-waste diversion. However, the 15-year NPV of S2 remained negative at approximately LKR −26.20 million, indicating that annual financial break-even does not imply full recovery of the initial infrastructure investment within the assessment period. Sensitivity analysis further showed that S2 is conditionally rather than universally viable, with financial performance particularly dependent on operating expenditure, SWC selling price, and successful market realization. These findings indicate that infrastructure expansion should be accompanied by effective cost control, reliable compost markets, appropriate pricing, and consistent product-quality assurance. Overall, the scenario-based framework provides a practical decision-support approach for local authorities seeking to strengthen municipal resource recovery while moving toward more improved financially sustainable solid waste management systems.
Author Contributions
“Conceptualization, C.J.F.; methodology, C.J.F; validation, C.J.F and A.T.; formal analysis, C.J.F; investigation, C.J.F; resources, C.J.F; data curation, C.J.F; writing—original draft preparation, C.J.F; writing—review and editing, C.J.F and A.T.; visualization, C.J.F; supervision, C.J.F and A.T.; project administration, C.J.F; funding acquisition, C.J.F. and A.T. All authors have read and agreed to the published version of the manuscript.”.
Funding
This research was supported by the Japan International Cooperation Agency (JICA) and Toyo University through the doctoral scholarship program of the first author.
Data Availability Statement
The data supporting the findings of this study are available from the corresponding author upon reasonable request. Certain operational and financial data obtained from Attanagalla Pradesheeya Sabha may be subject to institutional restrictions.
Acknowledgments
The authors gratefully acknowledge the Attanagalla Pradesheeya Sabha and its Waste Management Unit for providing operational information and facilitating access to the composting facility. The authors also acknowledge Toyo University for its academic and institutional support during the conduct of this research.
Conflicts of Interest
“The authors declare no conflicts of interest.”.
Abbreviations
| MSW | Municipal Solid Waste |
| SWC | Solid Waste Compost |
| CAPEX | Capital Expenditure |
| OPEX | Operational Expenditure |
| NPV | Net Present Value |
| BCR | Benefit-Cost Ratio |
References
- World Bank. What a Waste 3.0: Global Snapshot of Solid Waste Management toward Circularity until 2050; World Bank: Washington, DC, USA, 2026. [CrossRef]
- Zhang, Z., Chen, Z., Zhang, J., Liu, Y., Chen, L., Yang, M., Osman, A. I., Farghali, M., Liu, E., Hassan, D., Ihara, I., Lu, K., Rooney, D. W., & Yap, P.-S. (2024). Municipal solid waste management challenges in developing regions: A comprehensive review and future perspectives for Asia and Africa. Science of the Total Environment, 930, 172794. [CrossRef]
- Siddiqua, A.; Hahladakis, J.N.; Al-Attiya, W.A.K.A. An overview of the environmental pollution and health effects associated with waste landfilling and open dumping. Environ. Sci. Pollut. Res. 2022, 29, 58514–58536. [CrossRef]
- Fein-Cole, M. J., Esham, M., Jayathilake, N., Otoo, M., Koliba, C., Galford, G. L., Porterfield, K. K., Wijethunga, I. B., & Roy, E. D. (2024). Lessons from the short-lived 2021 fertilizer import ban in Sri Lanka based on analysis of nutrient flows. ACS Sustainable Resource Management, 1(11), 2361–2371. [CrossRef]
- Bhatia, T., & Sindhu, S. S. (2024). Sustainable management of organic agricultural wastes: Contributions in nutrients availability, pollution mitigation and crop production. Discover Agriculture, 2, 130. [CrossRef]
- Wichern, F., García-González, M. C., Moral, R., Papangelou, A., et al. (2024). Editorial on special issues: “Regional nutrient management in the circular economy” & “Nitrogen and carbon recycling: Benefits from the stakeholders’ perspective.” Nutrient Cycling in Agroecosystems, 129, 277–286. [CrossRef]
- Ministry of Environment, Sri Lanka. (2024). First biennial transparency report of Sri Lanka. Ministry of Environment, Sri Lanka. https://www.env.gov.lk/.
- Japan International Cooperation Agency. (2023). The project for formulation of Western Province solid waste management master plan: Final report. Japan International Cooperation Agency, EX Research Institute Ltd., & Kokusai Kogyo Co., Ltd. https://openjicareport.jica.go.jp/pdf/12383394.pdf.
- Fernando, C. J., & Tsuji, M. (2024). Assessment of municipal solid waste management systems of Sri Lanka and Japan in terms of knowledge sharing: A comparative study. Journal of Material Cycles and Waste Management, 26(3), 1819–1839. [CrossRef]
- Menikpura, S. N. M., Gheewala, S. H., & Bonnet, S. (2012). Sustainability assessment of municipal solid waste management in Sri Lanka: Problems and prospects. Journal of Material Cycles and Waste Management, 14(3), 181–192. [CrossRef]
- Department of Census and statistics, Sri Lanka. 2022. https://www.statistics.gov.lk/Agriculture/StaticalInformation/.
- Drechsel, P., Madhuwanthi, P., Nisansala, D. et al. On the feasibility of an agricultural revolution: Sri Lanka’s ban of chemical fertilizers in 2021. Food Sec. 17, 585–602 (2025). [CrossRef]
- Serafini, F., Pantani, OL., Santoni, M. et al. A Systematic Review of Scientific Research on Municipal Solid Waste Compost: Impacts on Crop Productivity and Soil Fertility. J Soil Sci Plant Nutr (2026). [CrossRef]
- Grego, S., Mezzetti, M., Bucci, G., Corradini, D., & Mincione, E. (2000). Changes in the Apolar Organic Fraction Through The Composting Process. Compost Science & Utilization, 8(2), 116–123. [CrossRef]
- Otoo, M., & Drechsel, P. (Eds.). (2018). Resource Recovery from Waste: Business Models for Energy, Nutrient and Water Reuse in Low- and Middle-income Countries (1st ed.). Routledge. [CrossRef]
- Hadi Pandyaswargo, A., & Gamaralalage Jagath Premakumara, D. (2014). Financial sustainability of modern composting: the economically optimal scale for municipal waste composting plant in developing Asia. International Journal of Recycling of Organic Waste in Agriculture, 3(3). [CrossRef]
- Fernando, C. J., & Aramaki, T. (2026). Greenhouse Gas Mitigation Through Municipal Solid Waste Composting: A Case Study from Semi-Urban Sri Lanka. Sustainability, 18(7), 3481. [CrossRef]
- Attanagalla Pradesheeya Sabha (APS). Annual Report 2024; Attanagalla Pradesheeya Sabha: Attanagalla, Sri Lanka, 2024.
- Waste Management Authority (Western Province), Sri Lanka, and Japan International Cooperation Agency (JICA) (2023). Western Province Solid Waste Management Master Plan (MP) in Sri Lanka. https://wma.wp.gov.lk/.
- Department of Census and Statistics, Sri Lanka. (2024). https://www.statistics.gov.lk/.
- Fernando, C. J., & Toshiya, A. (2025). Household waste separation practices in semi-urban Sri Lanka: The role of waste collection services in Attanagalla Pradesheeya Sabha in the Western Province. Journal of Material Cycles and Waste Management, 27(5), 3919–3930. [CrossRef]
- Central Bank of Sri Lanka. (2024). Annual economic review 2024. https://www.cbsl.gov.lk/en/publications/economic-and-financial-reports/annual-economic-review/annual-economic-review-2024.
- Asiri Hardware & Chemicals. (n.d.). Organic fertilizer. Retrieved August 12, 2026, from https://asirihardware.lk/product-category/garden/garden-supplies-maintenance/fertilisers/organic-fertilizer/.
- Oviedo, A., Mora, M., Ponsa, S. et al. Techno-economic evaluation of decentralized community composting as a management model to valorize organic matter in small and medium-sized towns. J Mater Cycles Waste Manag 27, 4234–4251 (2025). [CrossRef]
Figure 1.
Scenario establishment for the comparative financial evaluation.
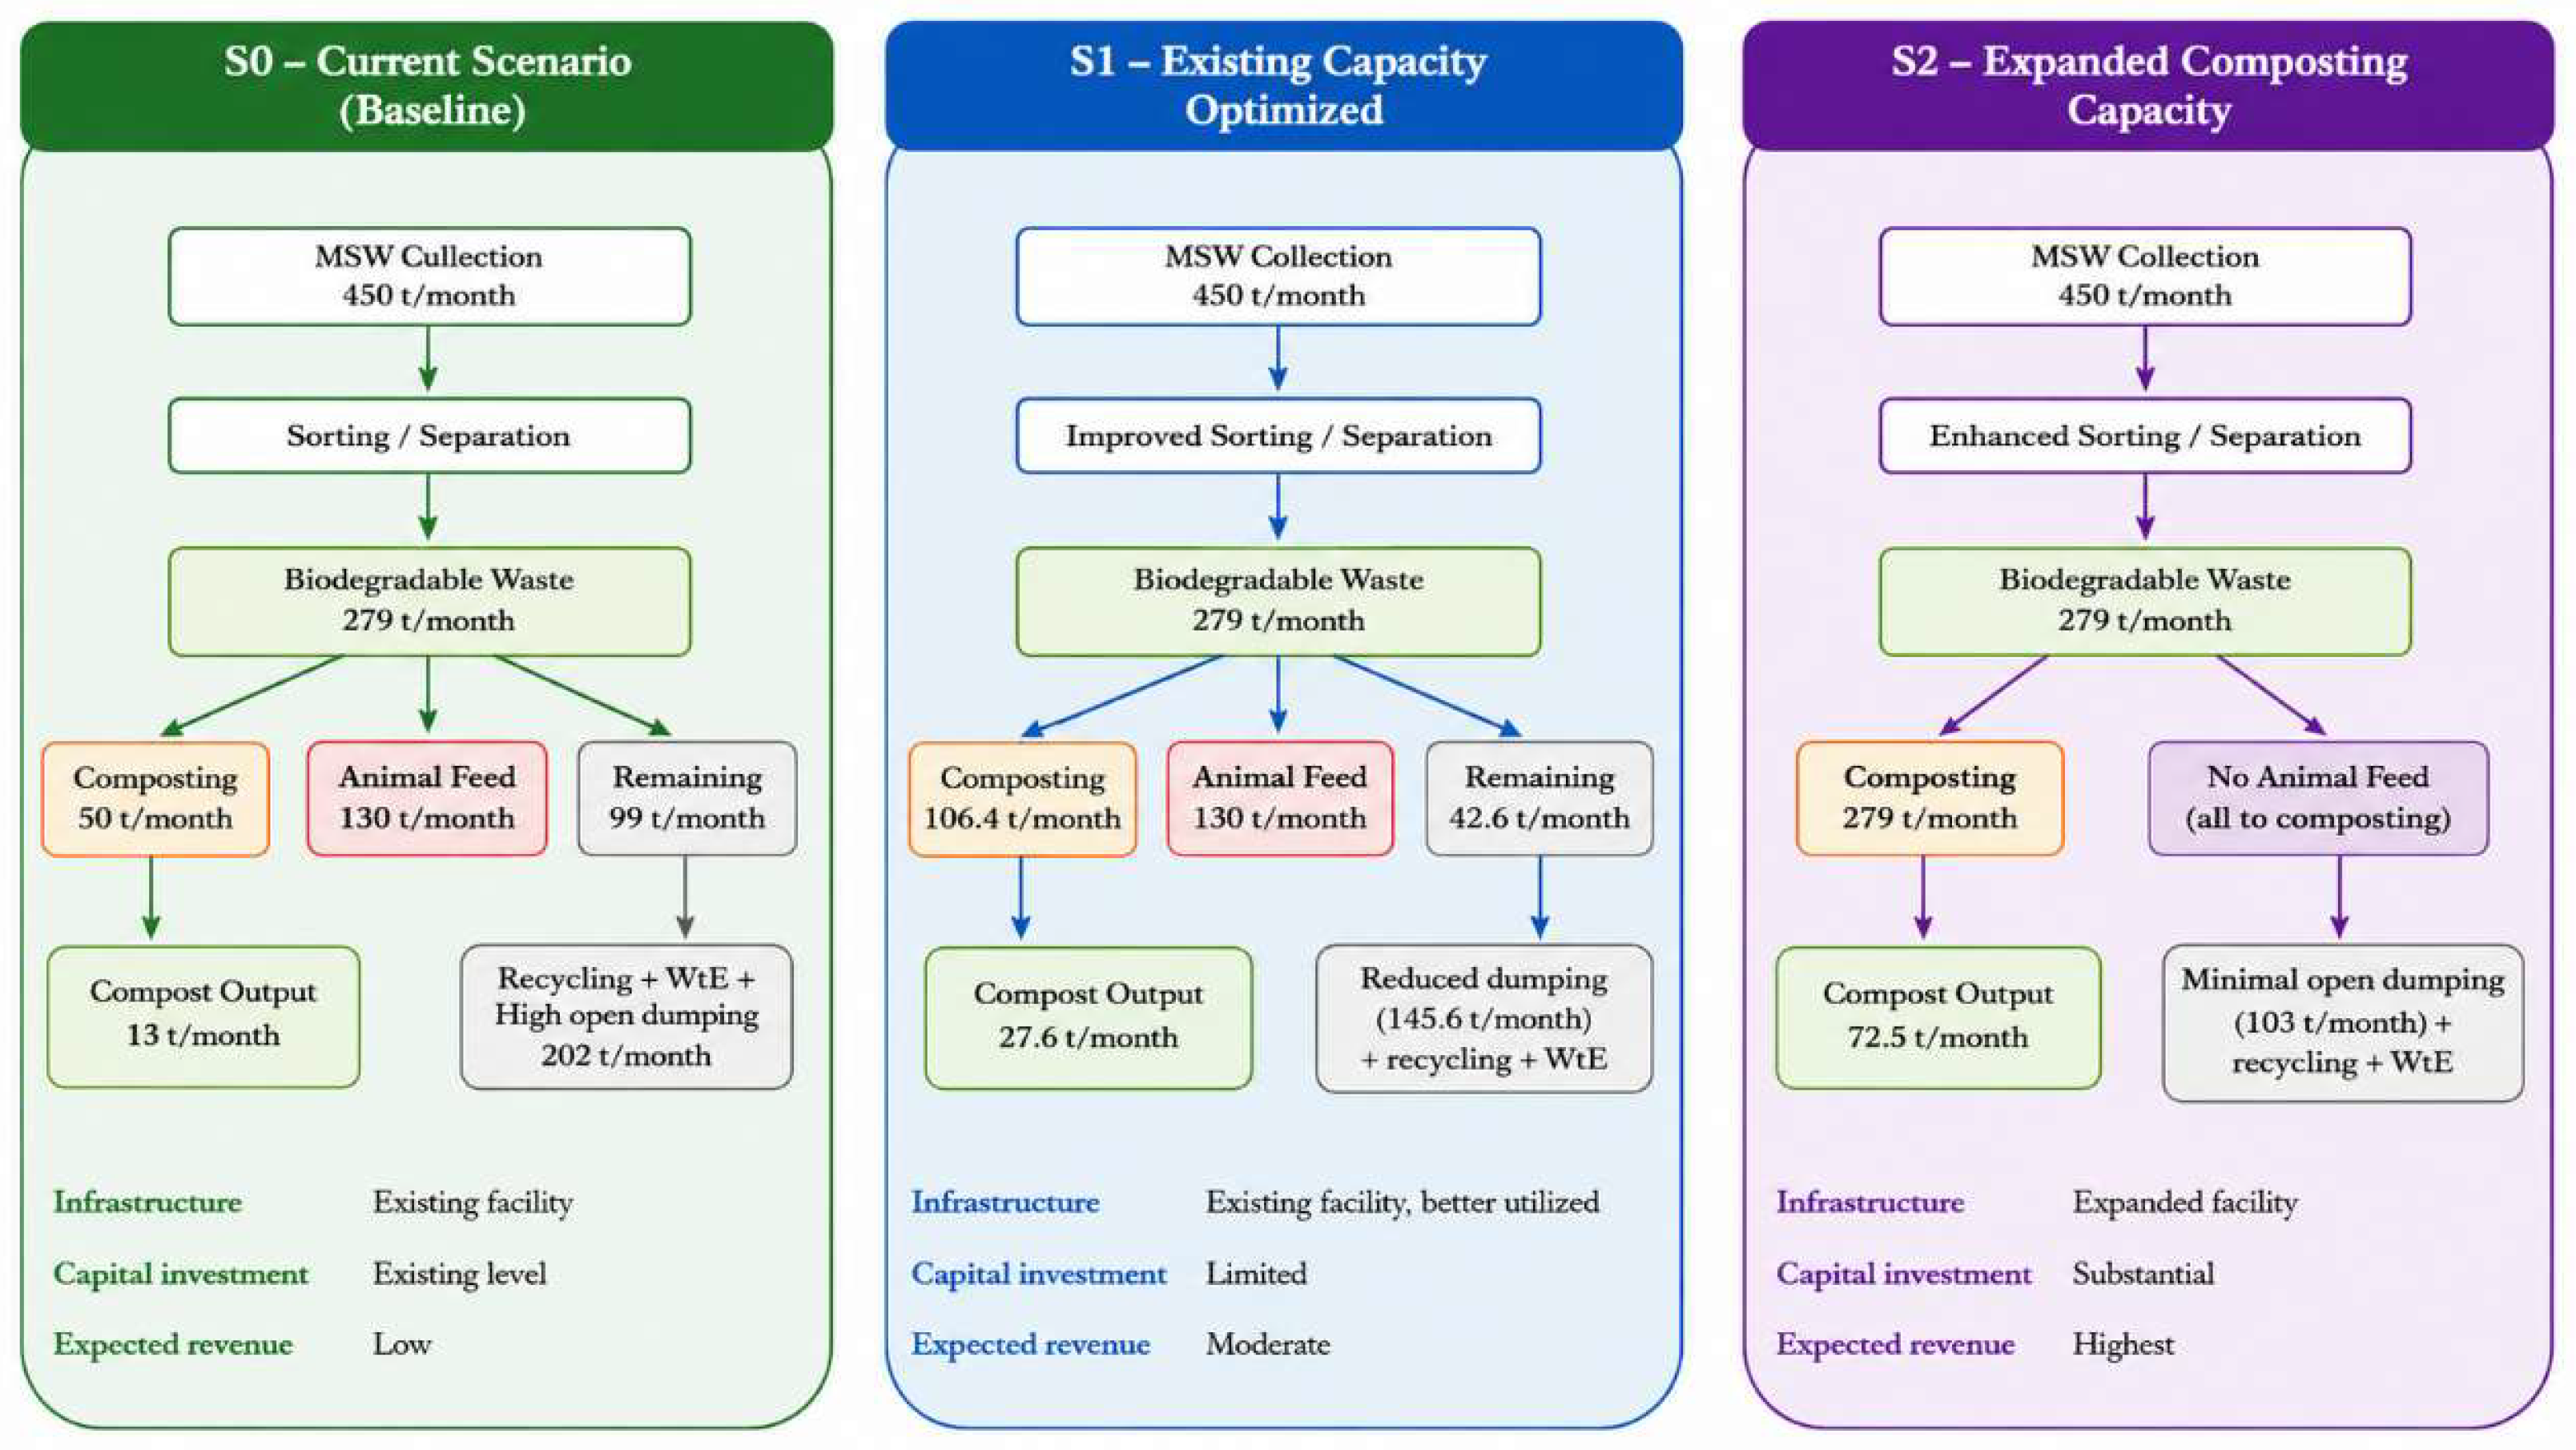
Figure 2.
Overall methodological framework used for financial assessment.

Figure 3.
Cumulative NPV trajectories of the three scenarios over the 15-year assessment period at a 9% discount rate.
Figure 3.
Cumulative NPV trajectories of the three scenarios over the 15-year assessment period at a 9% discount rate.
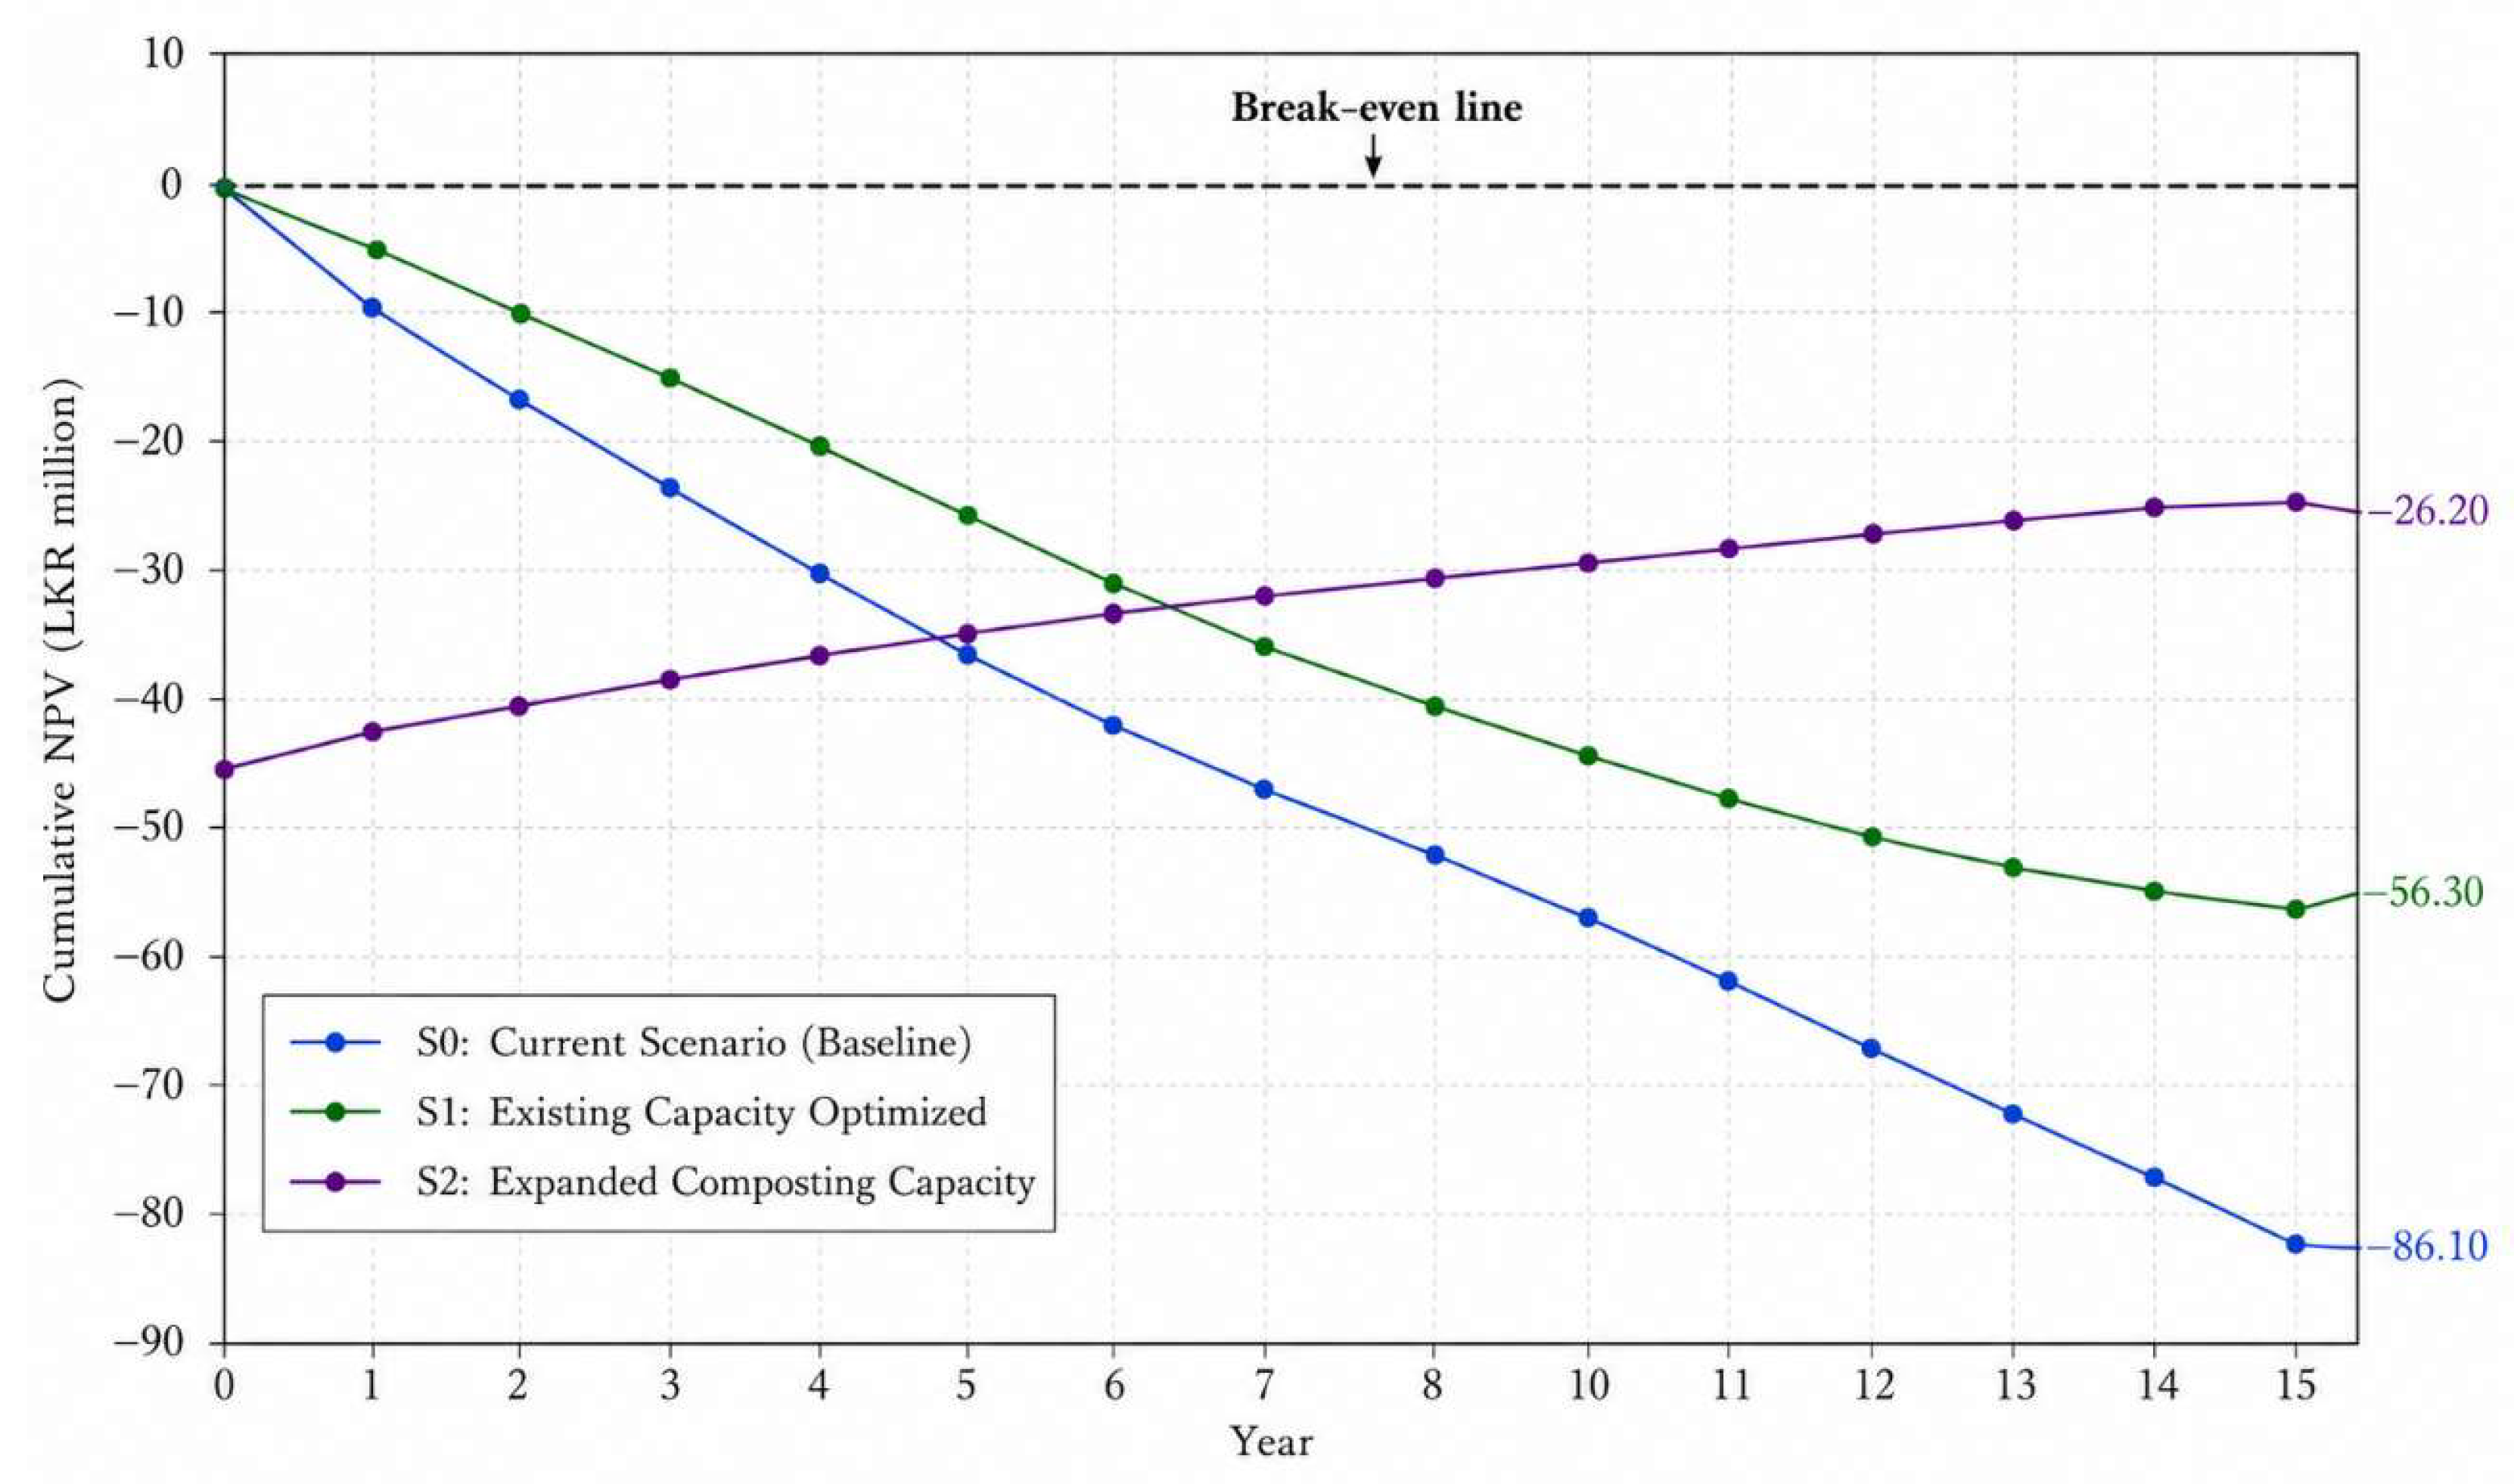
Figure 4.
Sensitivity of the S2 Benefit–Cost Ratio to changes in operating expenditure, SWC selling price, and sales realization.
Figure 4.
Sensitivity of the S2 Benefit–Cost Ratio to changes in operating expenditure, SWC selling price, and sales realization.
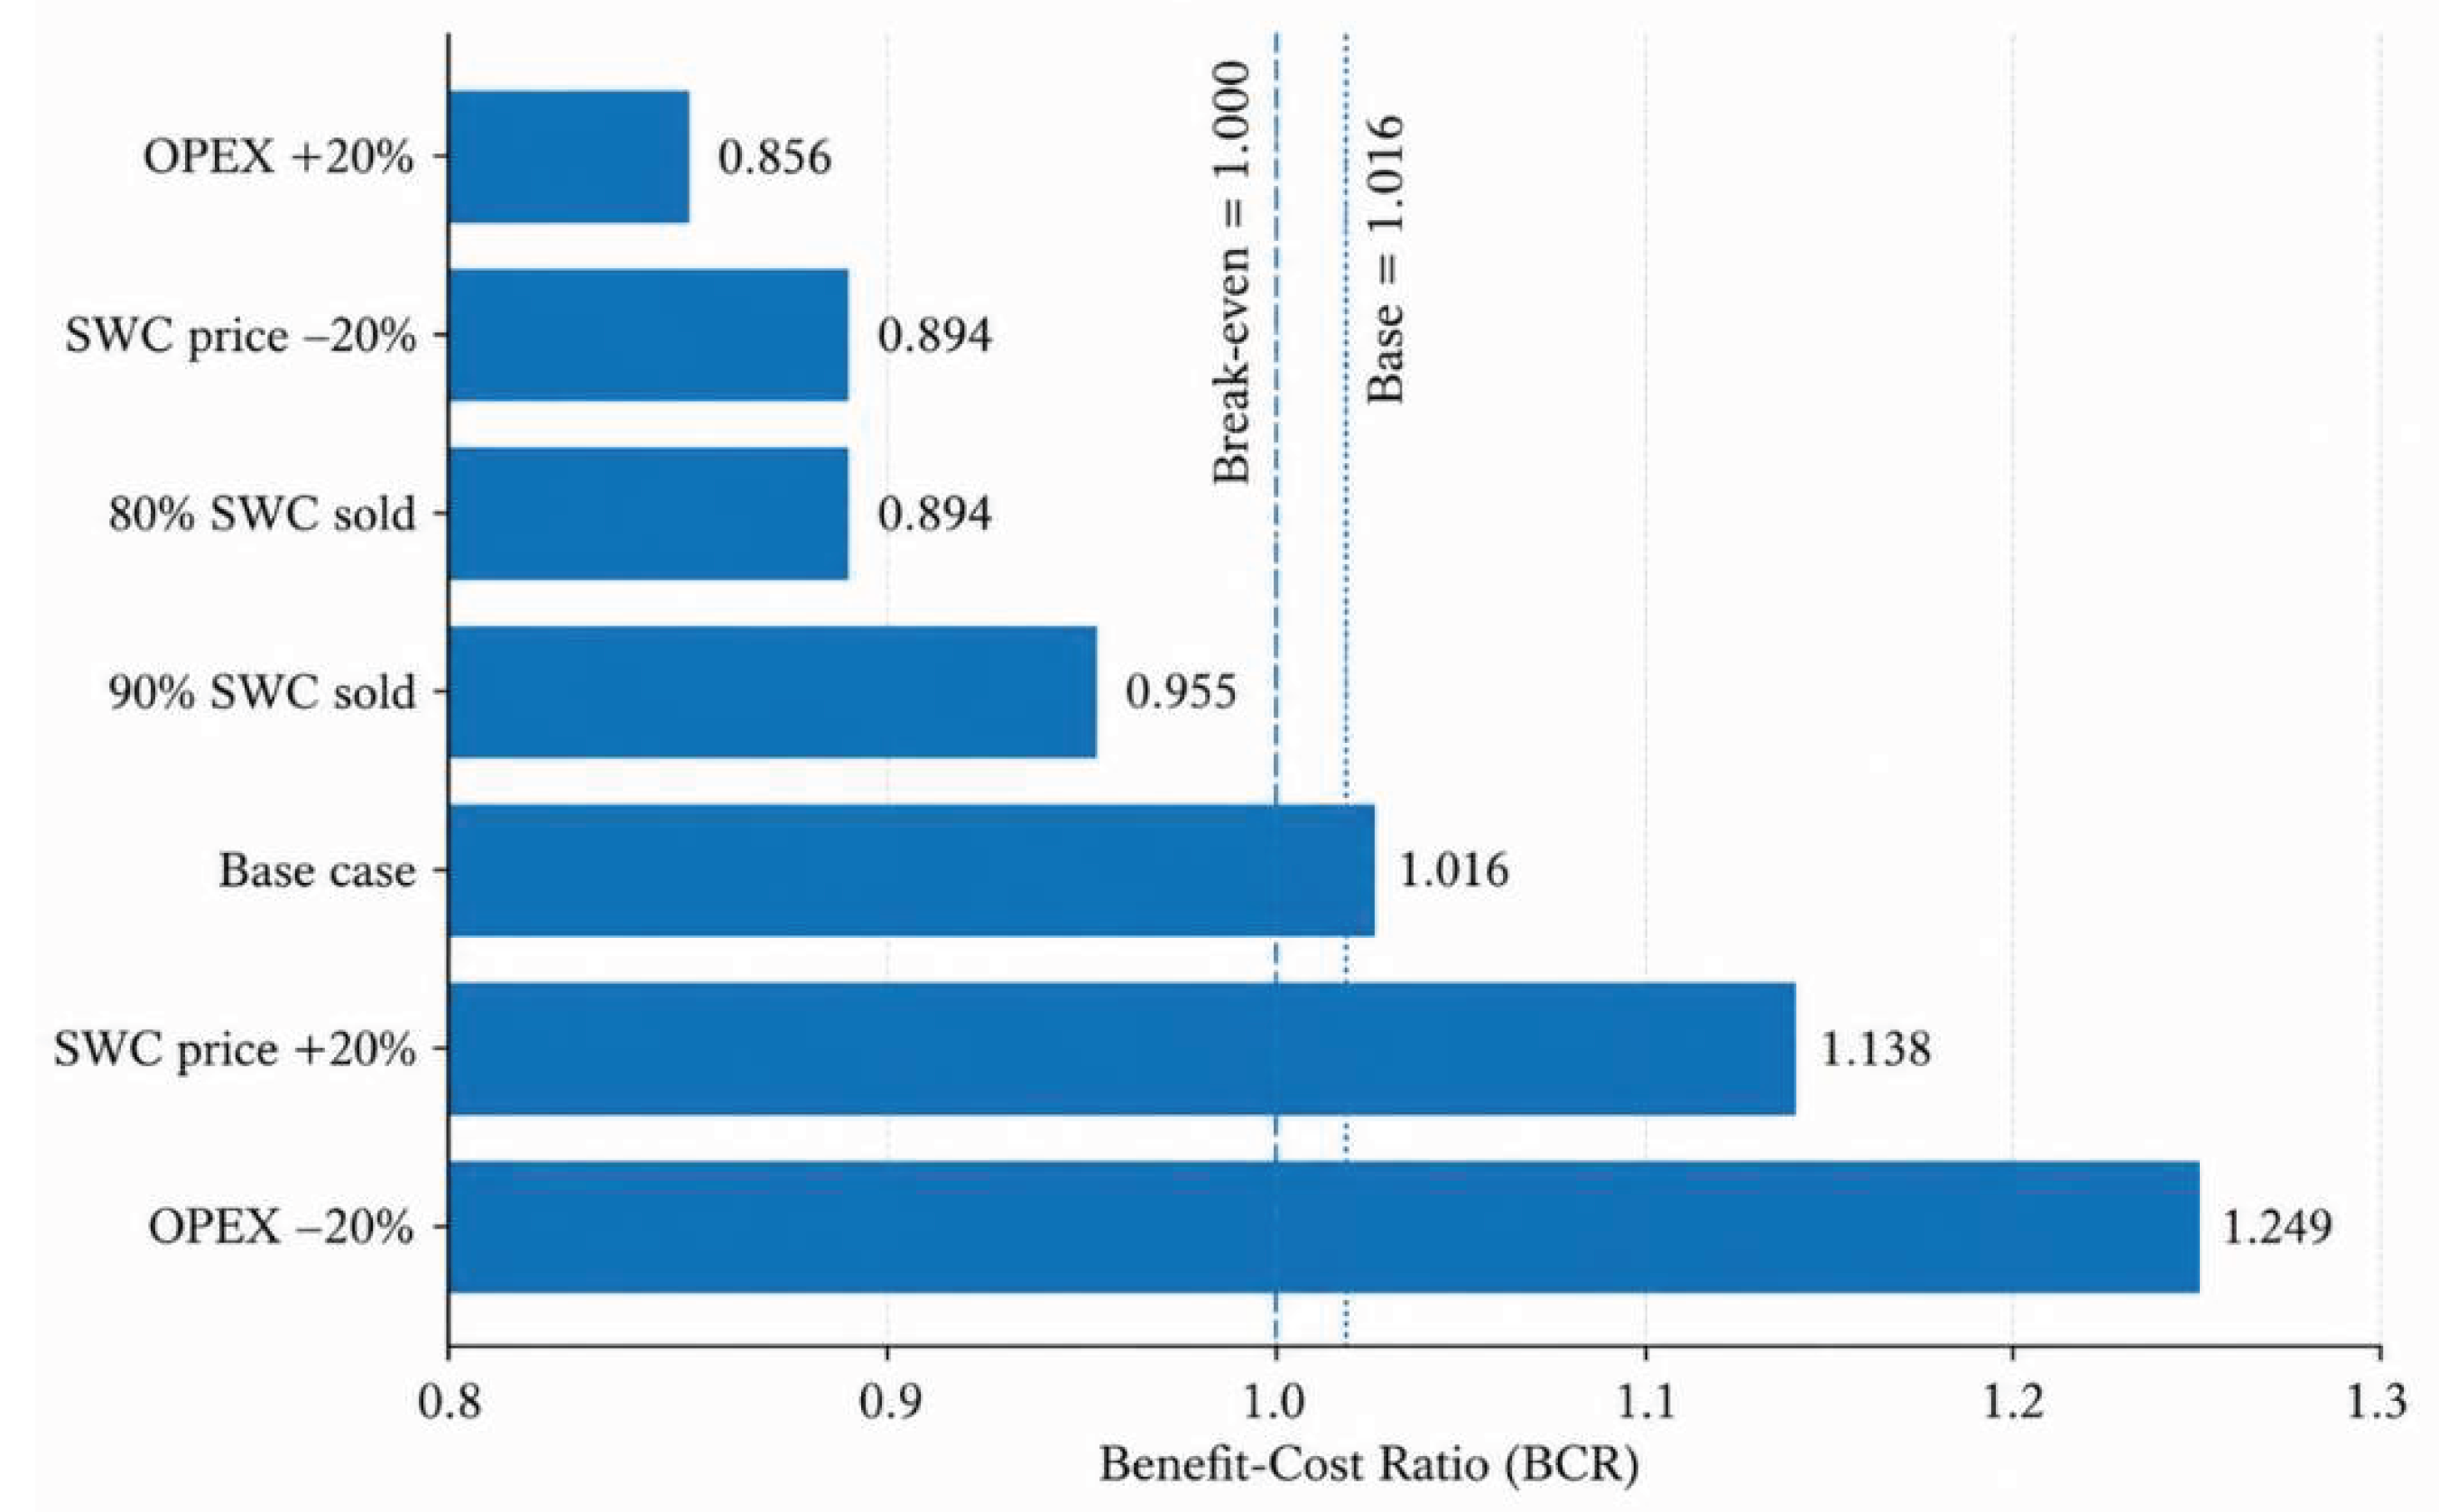
Table 1.
Material Flow and Mass Balance across the Three MSW Management Scenarios (S0–S2).
| Flow (t/month) | S0 | S1 | S2 |
|---|---|---|---|
| Biodegradable fraction | 279.0 | 279.0 | 279.0 |
| Composting | 50.0 | 106.4 | 279.0 |
| Animal feed | 130.0 | 130.0 | 0.0 |
| Recycling | 3.5 | 3.5 | 3.5 |
| WtE | 64.4 | 64.4 | 64.4 |
| Open dumping/residual | 202.1 | 145.7 | 103.1 |
| Total MSW | 450.0 | 450.0 | 450.0 |
Table 3.
Baseline infrastructure, operating inputs, and cost–revenue calculation basis under S0.
| Process | Equipment/activity | Operating input | Unit cost | Calculation basis | Revenue |
|---|---|---|---|---|---|
| Collection | Existing tractor fleet | 10 tractors; 300 L/tractor/month; 30 workers | Diesel: LKR 317/L; salary: LKR 16,000/person/month | Fuel: 10 × 300 × 317; labour: 30 × monthly salary | Waste-service fee; government contribution |
| Composting | Existing 3-t huller | 179 kWh/month | LKR 14.65/kWh + fixed charge | Electricity use × tariff + fixed charge | SWC sales |
| Composting | Existing bobcat | 150 L/month | Diesel: LKR 317/L | 150 × 317 | — |
| Composting | Water use | 2,600 m³/month | LKR 110/m³ + service charge | Water use × tariff + service charge | — |
| Composting | Labour | 10 workers | LKR 16,000/person/month | 10 × monthly salary | — |
| Residual transport | Existing 2-t truck | 4 trips/day; fuel use from APS records | Diesel: LKR 317/L | Monthly fuel use × 317 | — |
| Residual transport | Labour | 2 workers | LKR 16,000/person/month | 2 × monthly salary | — |
Note: Existing tractors, the 3-t huller, and the 2-t residual transport truck were treated as existing APS assets. Their historical acquisition costs and depreciation were excluded because reliable cost information was unavailable; only the associated operating expenditures were included under S0. LKR= Sri Lankan Rupee.
Table 7.
Cumulative NPVs over 15 years for S0, S1 and S2.
| Scenario | Initial investment | Discount rate | Assessment period | 15-year NPV (LKR million) |
|---|---|---|---|---|
| S0 | 0 | 9% | 15 years | -86.10 |
| S1 | 0 | 9% | 15 years | -56.30 |
| S2 | LKR 45.0 million | 9% | 15 years | −26.20 |
Table 8.
Incremental Cost of Additional SWC Production Relative to the Baseline Scenario (S0).
| Comparison | Annual SWC production (t/year) | Additional SWC relative to S0 (t/year) | Additional annual cost (LKR) | Incremental cost (LKR/t) |
|---|---|---|---|---|
| S1 vs. S0 | 331.2 | 175.2 | 766,934.80 | 4,377 |
| S2 vs. S0 | 870.0 | 714.0 | 5,067,103.50 | 7,097 |
Table 9.
Comparison of APS SWC price with selected organic fertilizers.
| Organic fertilizer product | Unit price (LKR/kg) | Source |
|---|---|---|
| APS solid waste compost | 20 | APS operational records [18] |
| Bio-carbon organic compost granular fertilizer | 114 | [23] |
| Cow dung manure fertilizer | 164 | [23] |
| Goat dung manure | 165 | [23] |
| Chicken manure fertilizer | 180 | [23] |
| Bone meal fertilizer | 300 | [23] |
Note: The comparison reflects nominal retail prices and does not imply nutrient-equivalent substitution among fertilizer products.
Table 10.
Financial sensitivity analysis results for Scenario S2.
| Sensitivity condition | Annual revenue (million LKR) | Annual cost (million LKR) | Annual balance (million LKR) | BCR | Financial interpretation |
|---|---|---|---|---|---|
| Base case | 28.972 | 28.520 | +0.452 | 1.016 | Marginally viable |
| SWC selling price −20% | 25.492 | 28.520 | −3.028 | 0.894 | Non-viable |
| SWC selling price +20% | 32.452 | 28.520 | +3.932 | 1.138 | Viable |
| OPEX −20% | 28.972 | 23.192 | +5.780 | 1.249 | Viable |
| OPEX +20% | 28.972 | 33.848 | −4.876 | 0.856 | Non-viable |
| 80% of projected SWC sold | 25.492 | 28.520 | −3.028 | 0.894 | Non-viable |
| 90% of projected SWC sold | 27.232 | 28.520 | −1.288 | 0.955 | Non-viable |
| 100% of projected SWC sold | 28.972 | 28.520 | +0.452 | 1.016 | Marginally viable |
Note: In the SWC selling-price analysis, only SWC sales revenue was varied while other revenue sources were held constant. In the OPEX analysis, operating expenditure varied by 20% while annual depreciation remained unchanged. Sales-realization scenarios assume that the specified proportion of projected SWC output is sold at the baseline selling price.
Disclaimer/Publisher’s Note: The statements, opinions and data contained in all publications are solely those of the individual author(s) and contributor(s) and not of MDPI and/or the editor(s). MDPI and/or the editor(s) disclaim responsibility for any injury to people or property resulting from any ideas, methods, instructions or products referred to in the content. |
© 2026 by the authors. Licensee MDPI, Basel, Switzerland. This article is an open access article distributed under the terms and conditions of the Creative Commons Attribution (CC BY) license.
Copyright: This open access article is published under a Creative Commons CC BY 4.0 license, which permit the free download, distribution, and reuse, provided that the author and preprint are cited in any reuse.