

Submitted:
31 August 2026
Posted:
01 September 2026
You are already at the latest version
Abstract
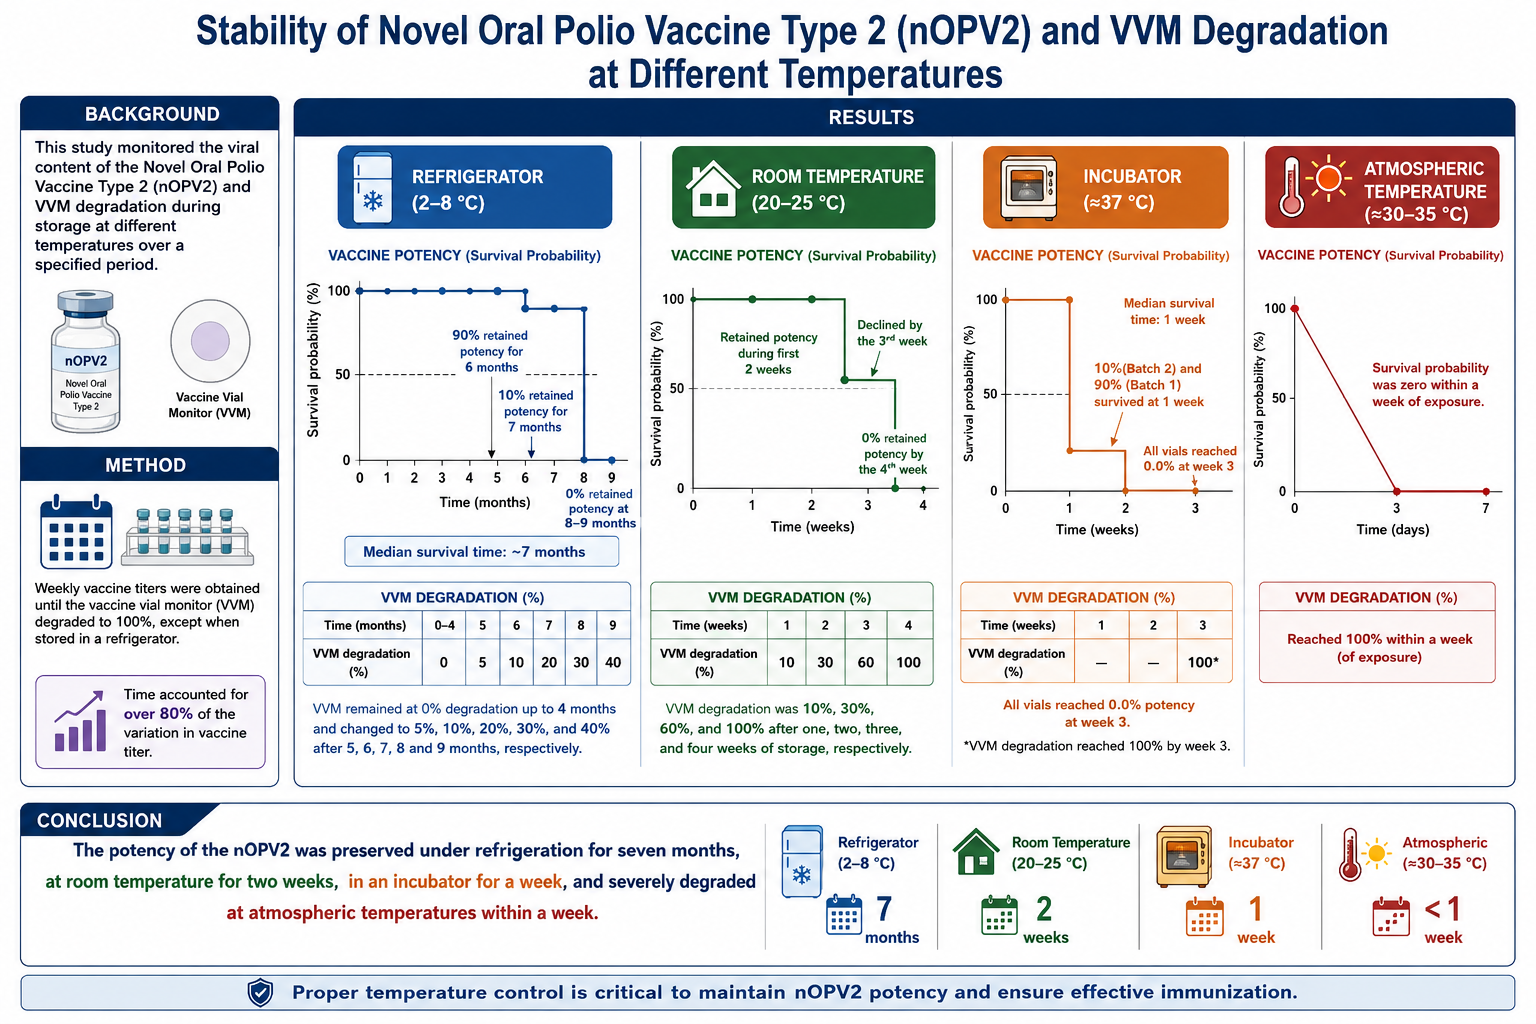
Background: This study monitored the viral content of the Novel Oral Polio Vaccine Type 2 (nOPV2) and VVM degradation during storage at different temperatures over a specified period. Method: Weekly vaccine titers were obtained until the vaccine vial monitor (VVM) degraded to 100%, except when stored in a refrigerator. Results: At refrigerator temperature, 90% and 10% of the vaccine vials retained potency for six and seven months, respectively, but none retained potency at 8 to 9 months. The median survival time was approximately seven months. The VVM remained at 0% degradation up to 4 months and changed to 5%, 10%, 20%, 30%, and 40% after 5, 6,7,8 and nine months, respectively. At room temperature, the nOPV2 retained potency during the first two weeks, declined by the third week, and none retained potency by the fourth week. The degradation of the VVM was rated 10 %, 30%, 60%, and 100% after one, two, three, and four weeks of storage, respectively. The median survival time at incubator temperature was one week, during which 10% and 90% of the vaccine in batches 2 and 1, respectively, survived, but all vials reached 0.0% at week 3. At atmospheric temperature, the survival probability was zero within a week of exposure. Time accounted for over 80% of the variation in vaccine titer. Conclusion: The potency of the nOPV2 was preserved under refrigeration for seven months, at room temperature for two weeks, in an incubator for a week, and severely degraded at atmospheric temperatures within a week.
Keywords:
nOPV2
; temperatures
; storage
; titers
; potency
; vaccine vial monitor
1. Introduction
Poliomyelitis, a debilitating paralytic disease that largely affects children, is usually caused by the poliovirus (serotypes 1, 2, and 3). Essentially, the oral polio vaccine (OPV) contains a live, weakened, non-disease-causing form of poliovirus that replicates in the intestine. Its ability to replicate in the gut leads to a robust immune response to poliovirus upon subsequent exposure. The eradication of the wild poliovirus type 2 was officially declared in 2015. In 2016, immunization programs in countries (Including Nigeria) using OPV switched from trivalent OPV (tOPV) (containing types 1, 2, and 3 Sabin strains) to bivalent OPV (bOPV) (containing types 1 and 3 Sabin strains) [1,2]. On rare occasions, some OPV strains can revert by mutation to the disease-causing form (vaccine-derived poliovirus, VDPV) as they replicate in the intestine. Communities that are not fully immunized can facilitate the spread of the mutated poliovirus strains. This situation is worse in communities with poor hygiene, poor sanitation, poor waste disposal, or overcrowding. Interestingly, the lower the population's immunity, the longer VDPV survives and the more it mutates and reverts to virulence.
The switch from tOPV to bOPV led to several outbreaks of the vaccine derived poliovirus serotype 2 (VDPV2) because:(a) the routine immunization (RI) coverage was chronically very low( b) the decline in mucosal immunity was inevitable considering the accumulating number of children born after the switch (c) there was insufficient RI coverage with a single dose of Inactivated Pollio Vaccine (IPV) after the switch and (d) with the low immunization coverage in Nigeria, the use of monovalent (mOPV2) to contain cVDPV 2 outbreaks seeded new cVDPV2 emergence [3,4]. In 2020, a total of 1,021 human paralytic cases of cVDPV2 and isolation of 537 cVDPV2 from sewage samples were reported globally from 27 countries, of which 21 are in the WHO African Region [5]. In Nigeria, cVDPV 2 isolates declined from 34 in 2018 to 18 in 2019 and 8 in 2020, then rose sharply to 415 in 2021 [6]. Since 2021, nOPV2, which is a more genetically stable vaccine with reduced risk of reversion to neurovirulence than mOPV2, has been used in Nigeria for cVDPV2 outbreak response. Despite these remarkable changes, new cVDPV2 polio outbreaks continue to circulate in multiple countries [7,8]. Therefore, the detection of VDPV is considered a global public health emergency [9,10].
With the persistent outbreaks of VDPV2 in the region, using a potent vaccine is crucial to contend it. However, remote settlements in many African countries may lack adequate electricity or alternative energy supply for the required storage condition of the vaccines. Like any other vaccine, storing nOPV2 at the wrong temperature can impair its live virus content and lower its potency. This study aimed at assessing the viability of nOPV2 by monitoring its potency through its virus content when subjected to diverse storage temperatures over specified periods. Additionally, the changes in the VVM and the titer of the vaccine were also monitored during the storage period.
2. Study Location
Borno is one of the six states in northeastern Nigeria and Maiduguri is its capital as well as the largest city. Maiduguri has the population of 1,112,449 and is located at 11.85°N latitude and 13.16°E longitude. The climatic condition in Maiduguri consists of a hot, sweltering dry season and a hot, wet season. Between April and August, the temperature could vary between 42 °C (107 °F) and 32 °C (89 °F) respectively [11]. Usually, March, April and May are the hottest months in Maiduguri and the daily temperature in these months is usually above 38.9°C [12]. The annual rainfall could be up to 552mm (21.7 inches), especially between July and September.
2.1. The Supplier of nOPV2 Used in the Study
The vaccination centers in Nigeria are categorized into Federal, State and Local governments. The Epidemiological Unit (EPU), serves as the central storage facility in Borno State. This implies that all vaccines allocated to Borno State from the Federal vaccine storage facility are primarily stored at EPU before being distributed to the different vaccination centers at the local government areas. In this study, only three batches of nOPV 2 vaccines from two different manufacturers which were stored at EPU at the time of sample collection were tested. (Table 1). Usually, vials of nOPV2 are stored at -15 to -25°C at the EPU which is consistently equipedd with standby generators, Solar refrigerators and freezers in addition to the National electricity supply. From the storage records of the vaccines, relevant details extracted include the date the vaccine was manufactured, name of the manufacturers, the date it arrived at the EPU, the batch numbers. expiry date and the stabilizers used. Since the distance between EPU and testing Laboratory (WHO National Polio Laboratory, University of Maiduguri Teaching Hospital, Maiduguri, Borno State, Nigeria) could take 5-10 minutes depending on the traffic, all the vaccine vials were transported in a Giostyle VC 2.6 L containing 4 ice packs of 0.4 litres. On arrival in the laboratory, each vaccine vial was physically examined to assess its appearance, consistency, color, transparency, and if there were any visible particles.
2.2. Storage in the refrigerator
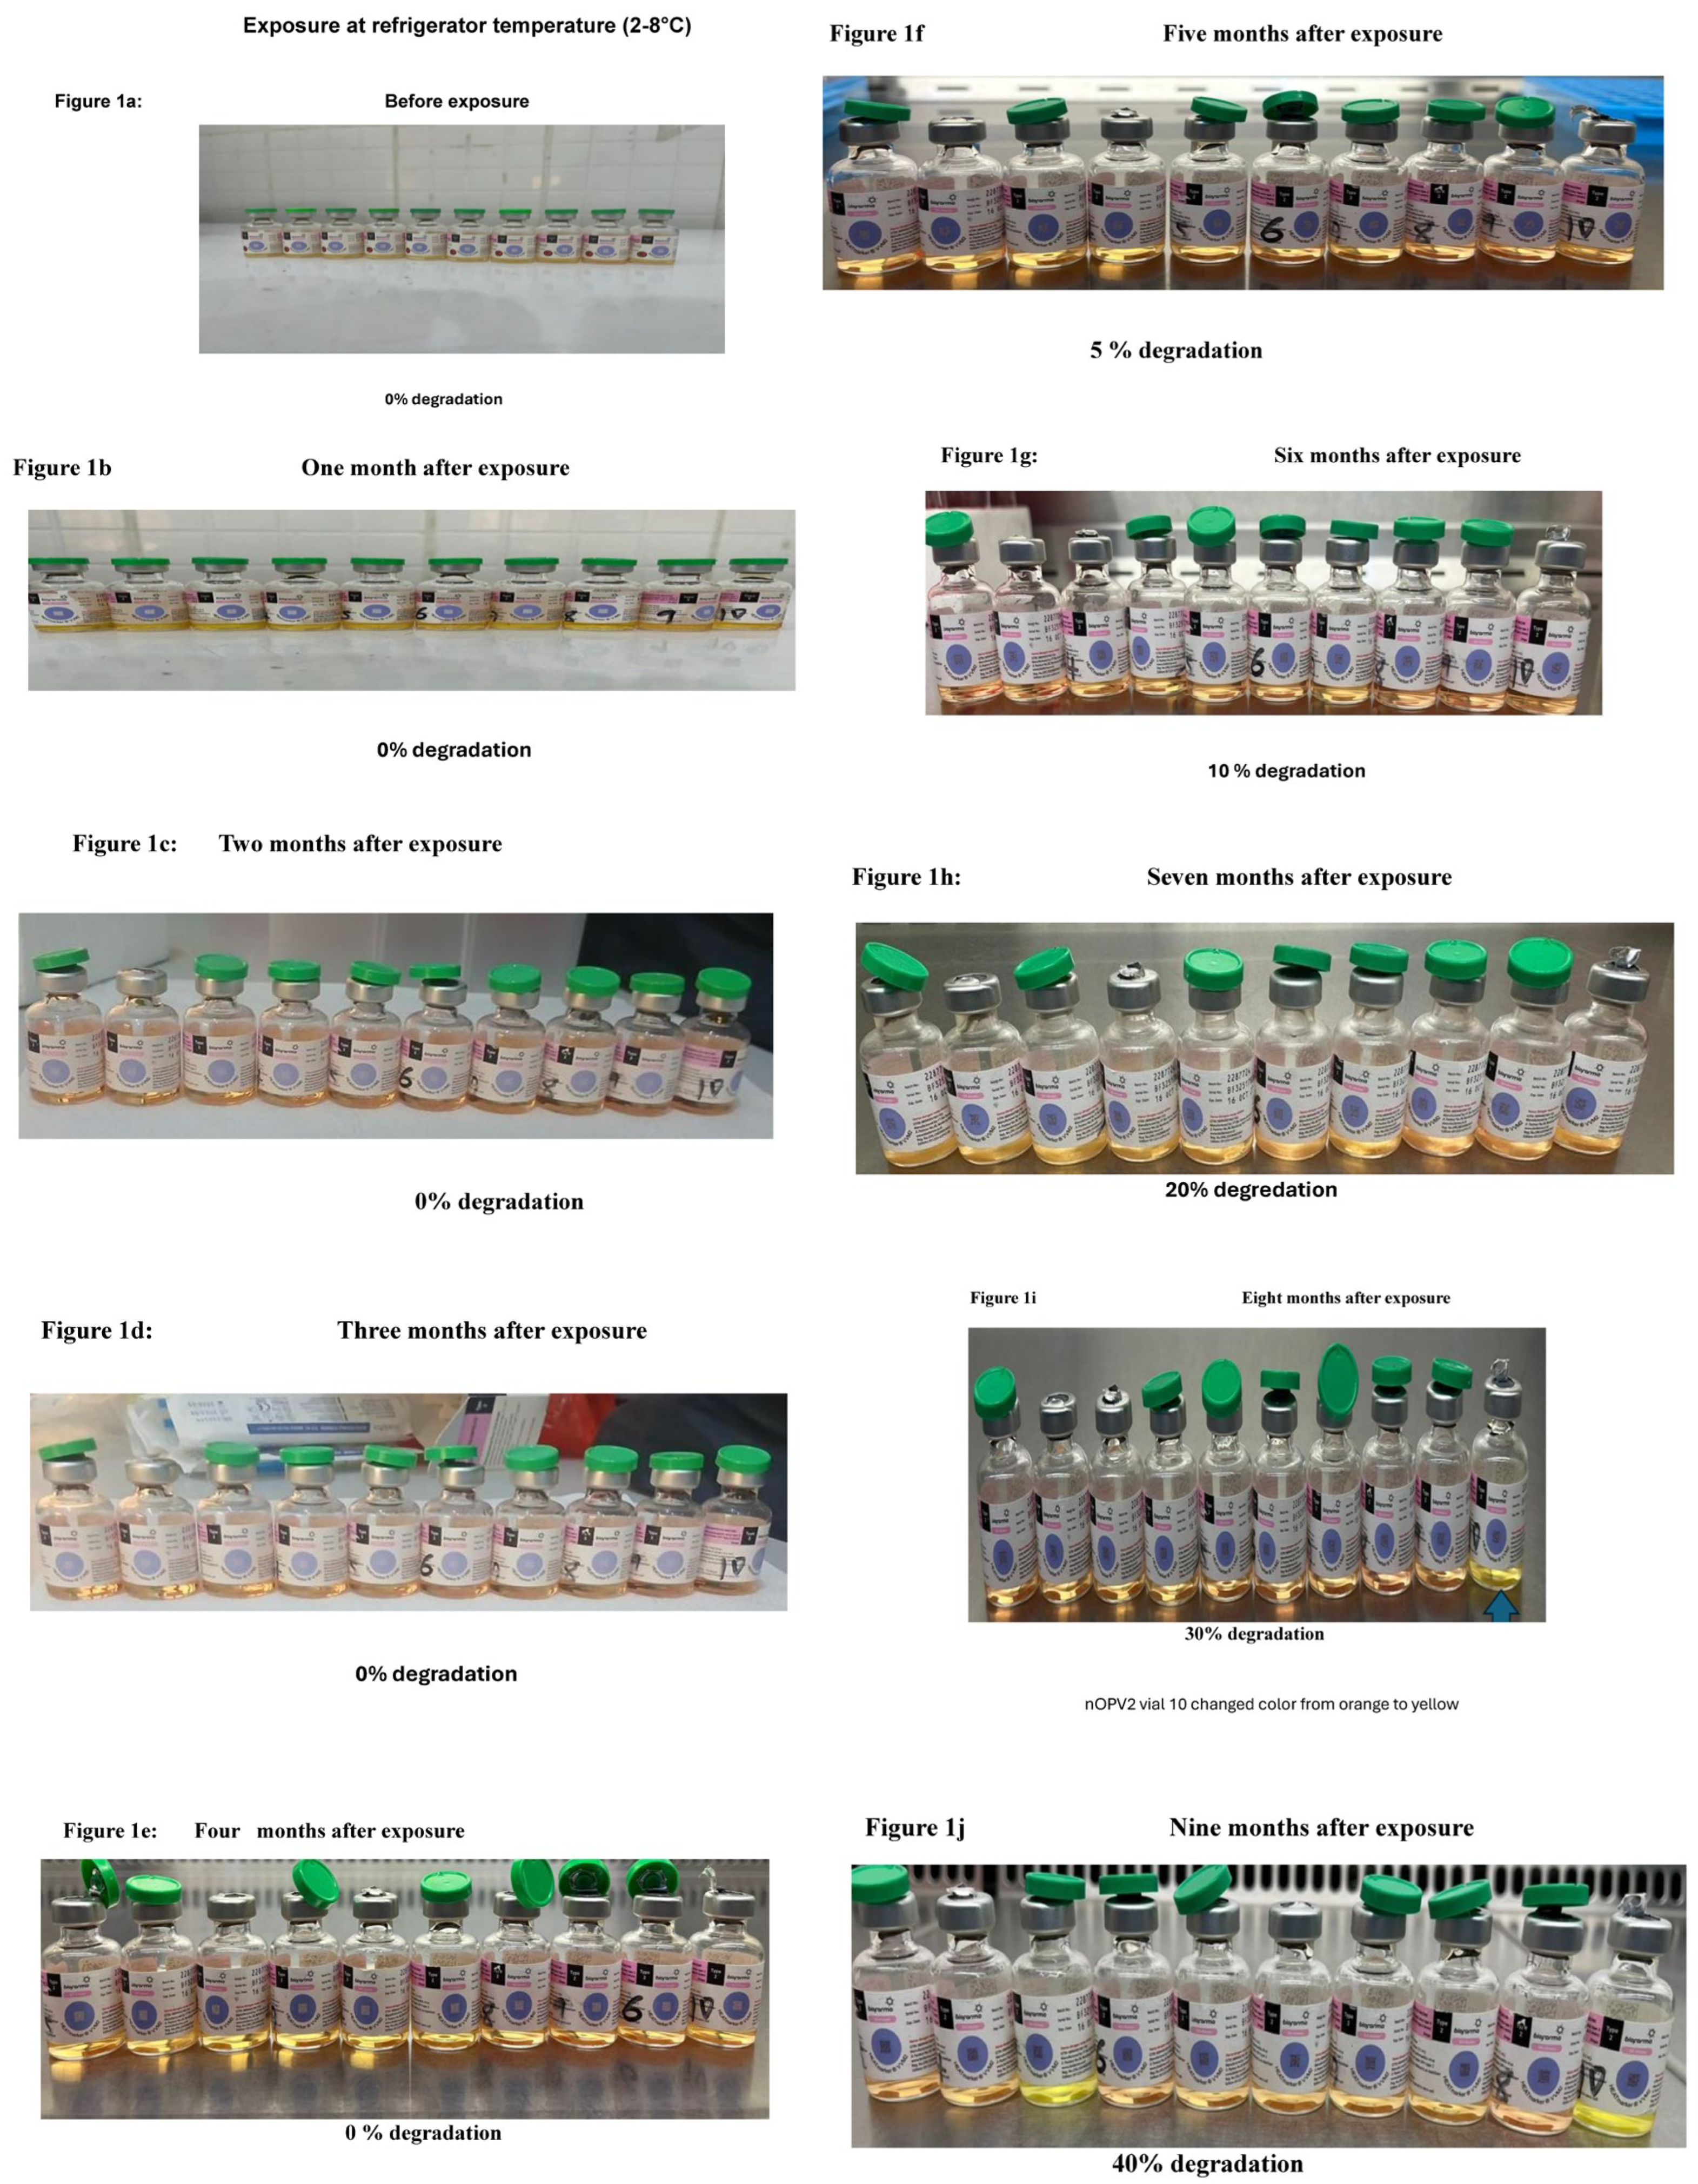
Before storage in the refrigerator, the vials of the vaccines were labelled 1-10 and 250 µl of the vaccine from each vial was aspirated using a disposable insulin syringe into the corresponding dilution tubes labelled 1-10. Initial titers of the vaccine in each vial were obtained before storage (see the titration protocol below). The daily recorded temperatures of the fridge were used to obtain average monthly temperatures (Appendix 1). Of the 5ml of the vaccine per vial, 250 µl was used for monthly titration while the vaccines were being stored. This implies that repeated aspiration using a fresh insulin syringe per vial was carried out for the nine months of the study. (Appendix 2). Notably, during the aspiration process, the tightly fitted rubber stopper supported by a ring-like metal cap on the vaccine vial was not removed to avoid contamination. Taking the picture of the VVM and monthly titration were carried out on the same day. The exercise was terminated after nine months when the titers of all the vaccines vials were significantly below the required minimum value although the color change on the VVM failed to reach stage 4 or 100% degradation (Figure 1a-i).
2.3. Storage in a Room Within the Laboratory
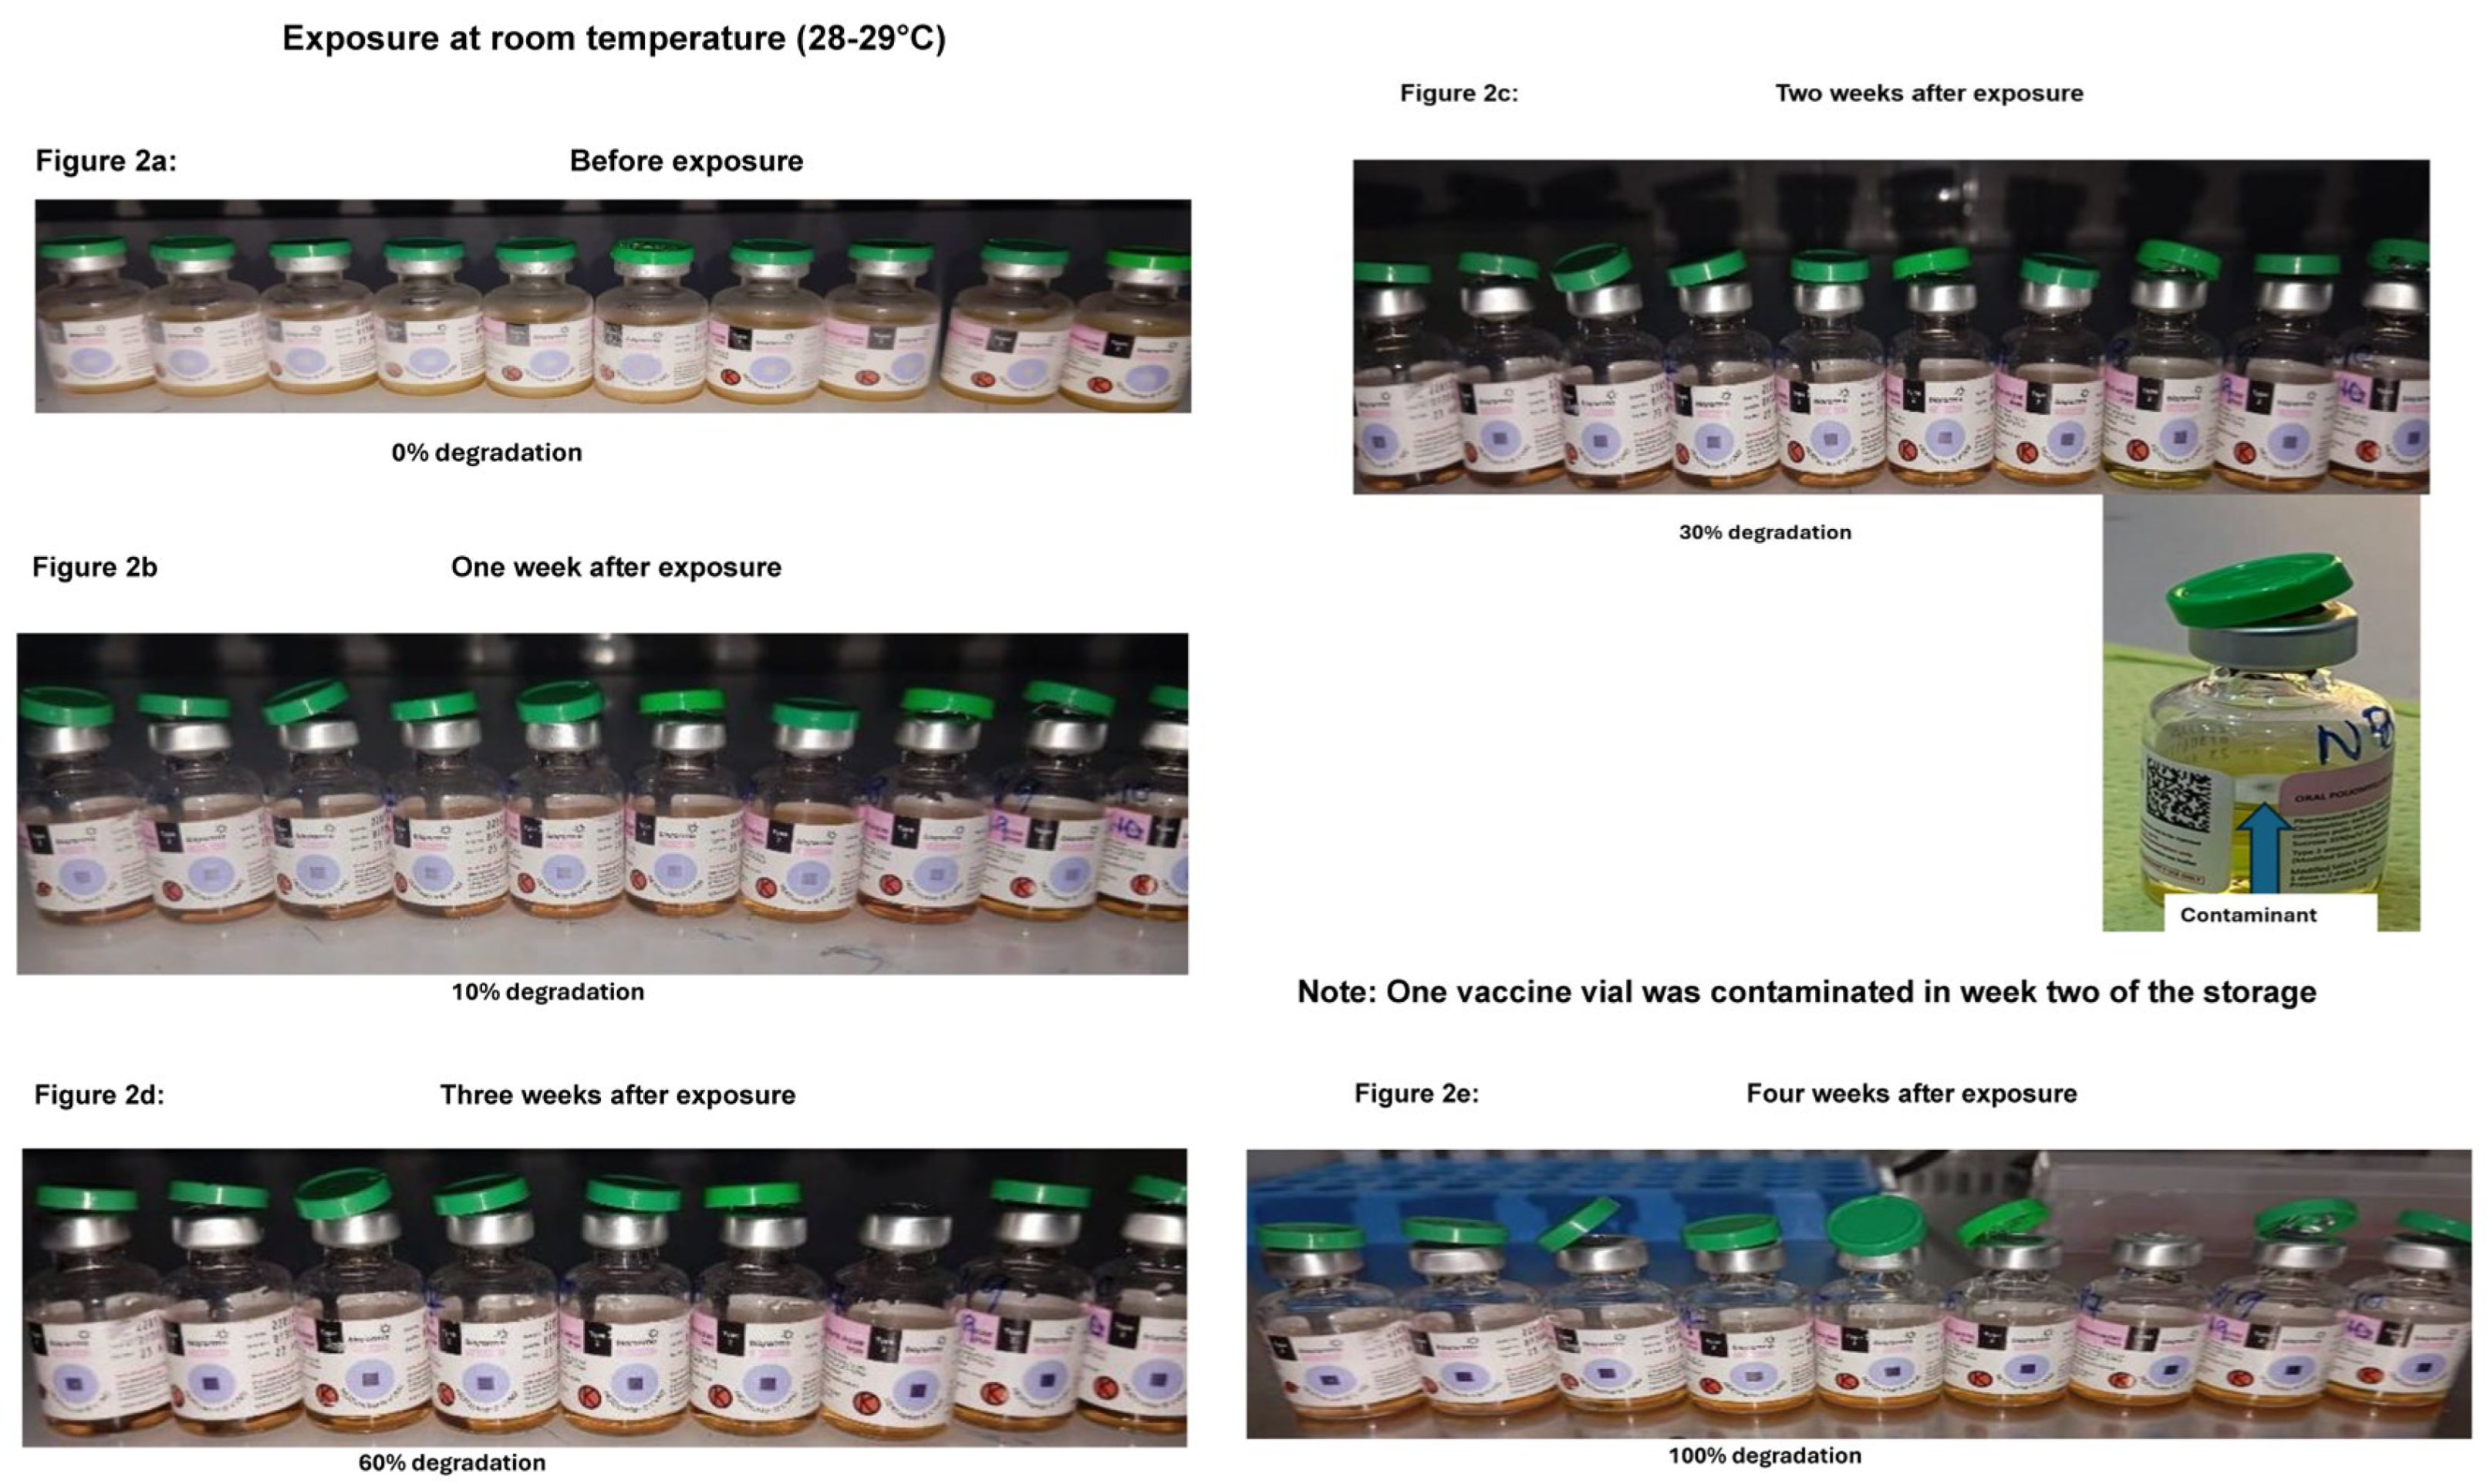
A Styrofoam that contained no ice pack was kept on a shelf in a room within the laboratory (Appendix 2). Ten vials of nOPV2 were placed on top of the Styrofoam. The temperature of the room was recorded daily and was eventually used to obtain average weekly values (Appendix 1). The process of aspiration of the vaccine for titration and taking pictures of the VVM were performed on weekly basis as described above under storage in the refrigerator. Once the VVM color attained stage 4 or 100% degradation, the whole exercise was terminated (Figure 2a-d).
2.4. Storage in the Incubator Kept in the Laboratory
The incubator was humidified by placing a trough filled with water in it before keeping twenty vials of nOPV2 vaccine (Appendix 2). The average weekly temperatures of the incubator were obtained from the daily readings (Appendix 1). The process of aspiration of the vaccine for titration and taking pictures of the VVM were performed on weekly basis as described above under storage in the refrigerator. Once the VVM color attained stage 4 or 100% degradation, the whole exercise was terminated (Figure 3a-d).
2.5. Storage at the Atmospheric Temperatures
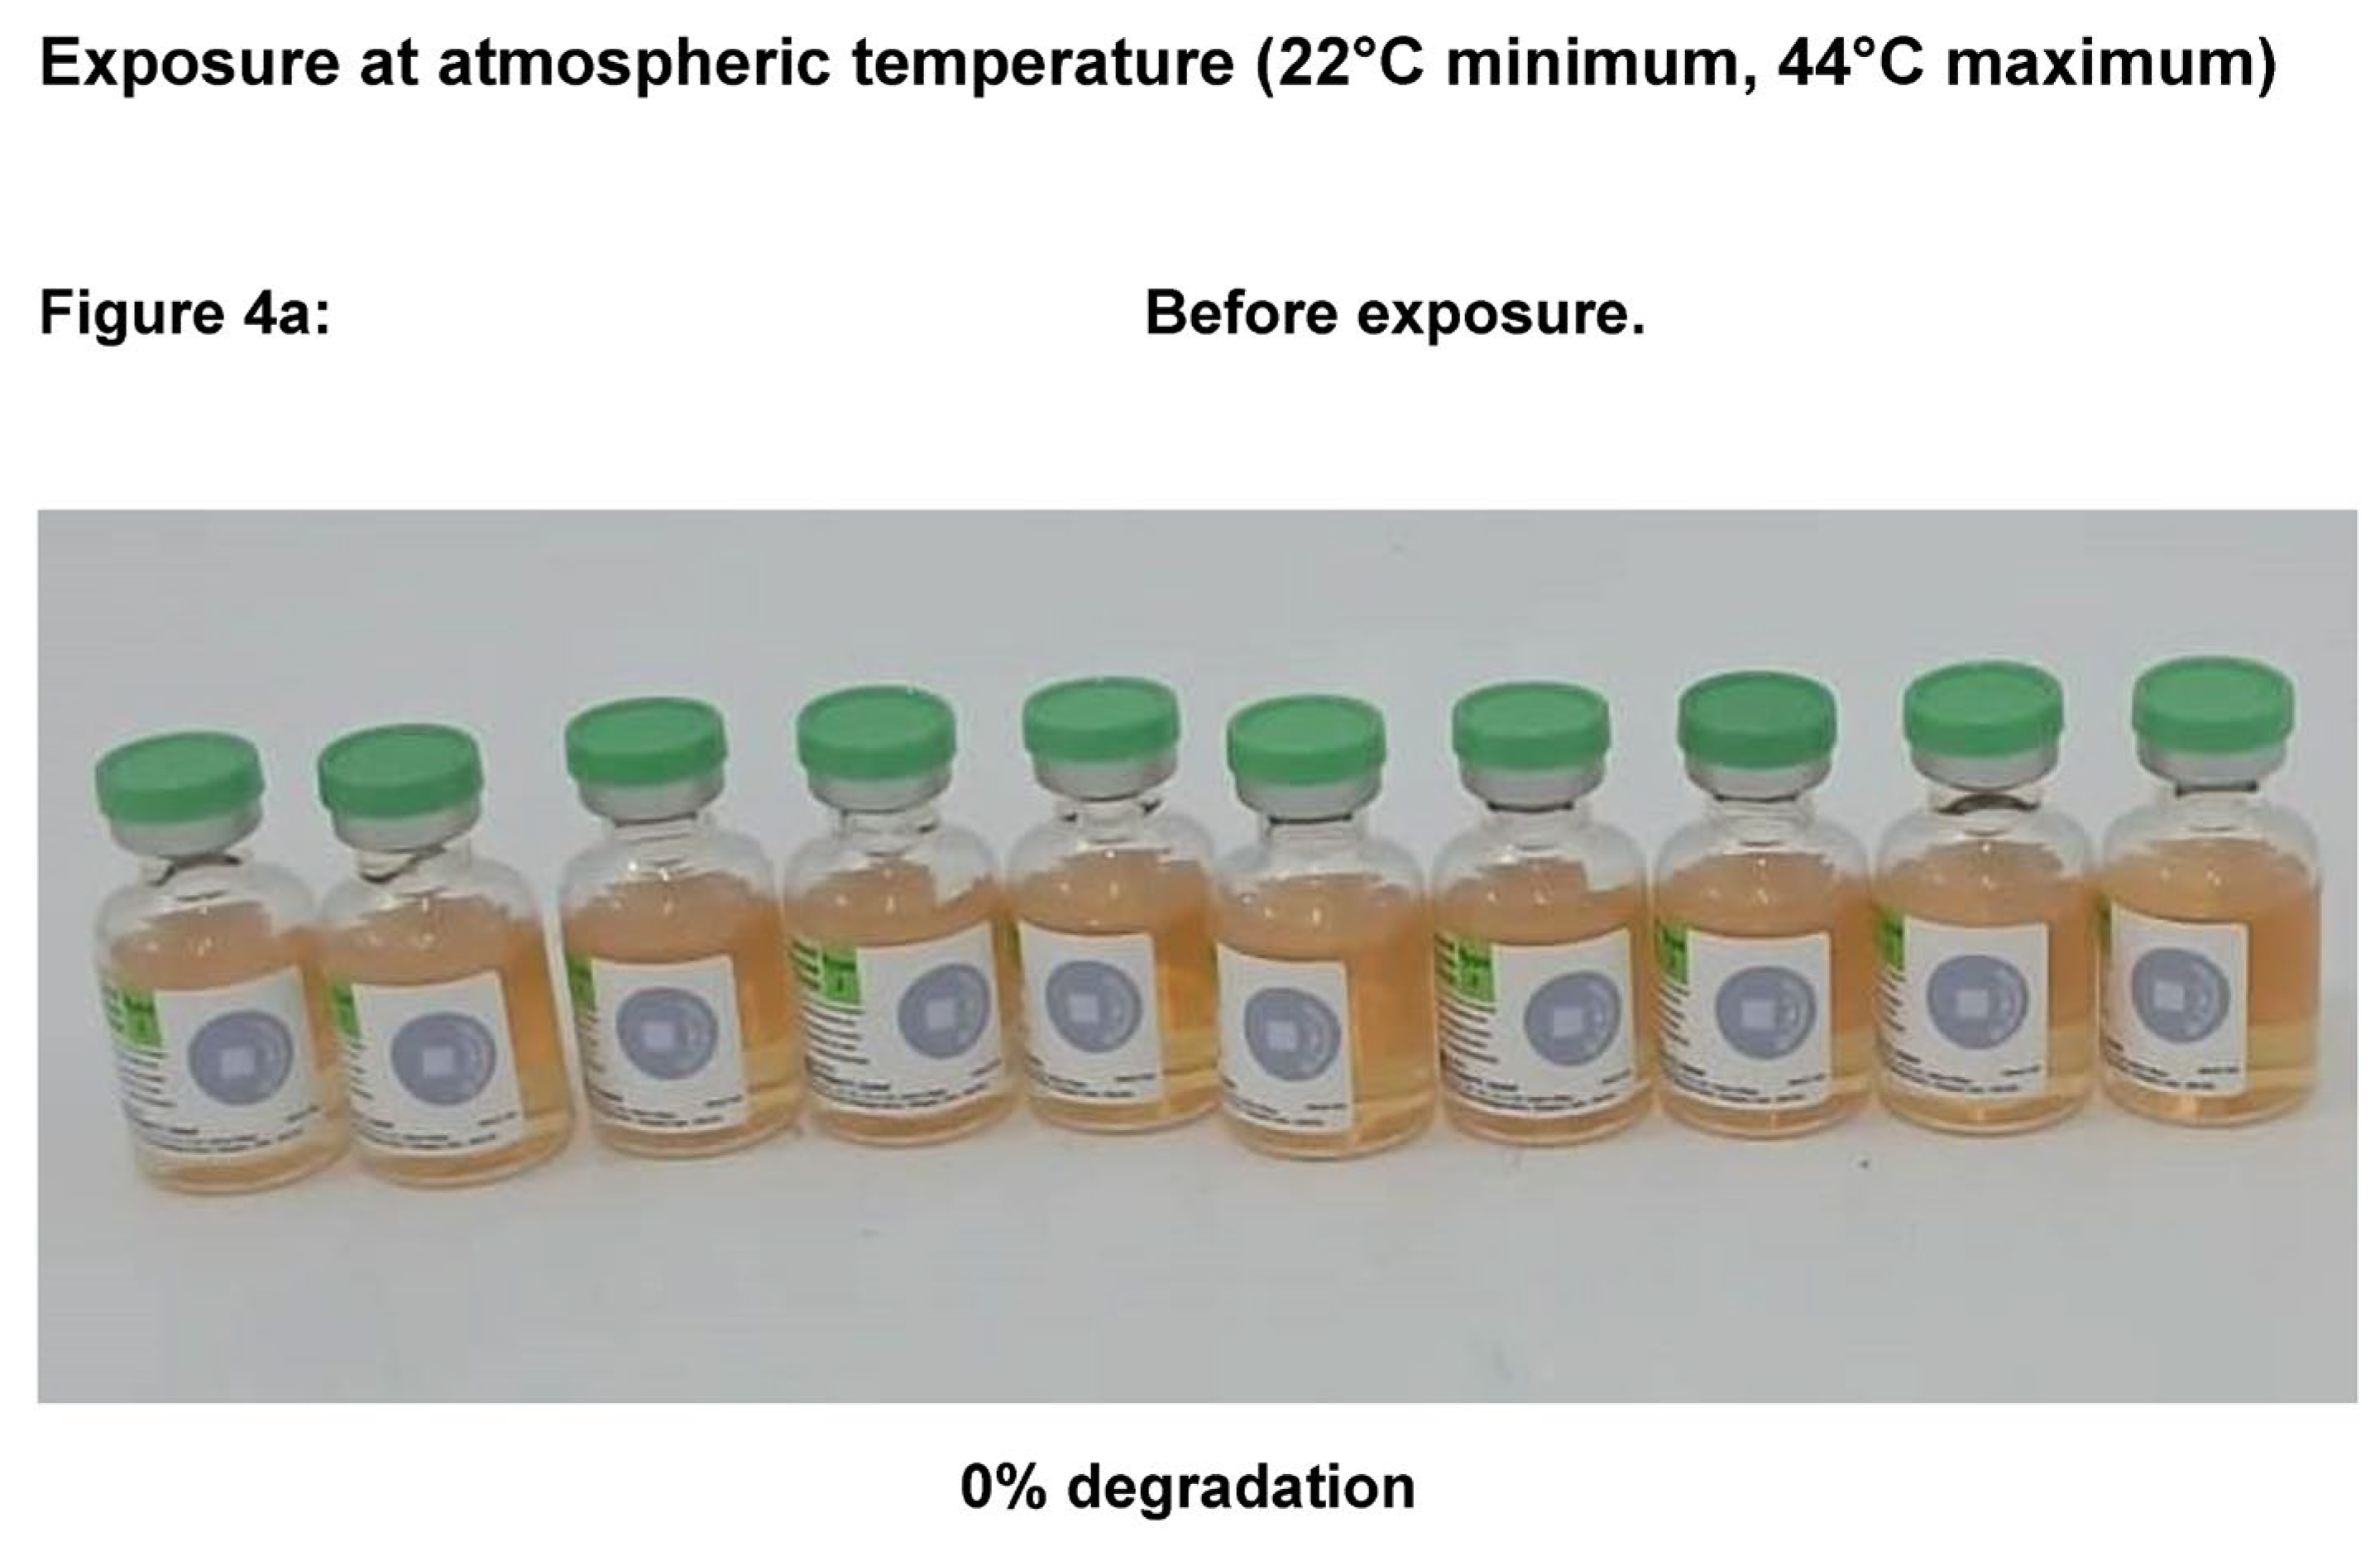
A locally constructed Stevenson’s screen with digital thermometer (Yough et al 2025) was used to store ten vials of nOPV2 under atmospheric temperature. The aim of using this special package was to prevent the vaccine from being blown away by strong winds, soaked by rain, contaminated by birds or insect droppings and to reduce the direct effect of the sun. The daily readings were taken at 6.30 to 7 am and 1 pm to 2 pm. (Appendix 1). These readings were used to calculate average weekly values. The process of aspiration of the vaccine for titration and taking pictures of the VVM were performed on weekly basis as described above under storage in the refrigerator. The exercise was terminated when the color of the VVM attained stage 4 or 100% (Figure 4a-b).
2.6. Evaluation of the Colour Changes on the VVM
Before subjecting nOPV2 vials to different storages conditions, the pictures of VVM affixed to the vaccine vials were taken. Similarly, the pictures of the VVM under different storage conditions were also taken monthly/weekly depending on the storage temperature used. However, once the color of the VVM attained 100% status, the exercise was terminated except storage at the refrigerator. With the use of the subjective visual scoring, the color changes of VVM as the study progressed on monthly/ weekly basis was scored as: 0%, 10%, 20%, 30%, 40%, 50%, 60%, 70%, 80%, 90%, 100%. The VVM was evaluated and classified before and after storage using the above VVM scores at different temperatures alongside each infectious virus titer.
2.7. The Use of the Reference Strains to Validate of the Protocol
2.8. Preparation of the Local Virus Stock (LVS) from the Reference Strains Using Poliovirus Serotypes 1, 3) and nOPV2
The reference Sabin 1 (01/528) and Sabin 3 (01/532), were kindly supplied by the National Institute of Biological Standards (NIBSC), UK in December 2018. The nOPV2 (manufactured by B/E Biological E. Limited, Telangana, India-500078) were obtained from the EPU, Borno State, Nigeria. These strains were used to validate the protocol adapted in this study. The method used for the production of the LVS for each serotype from the reference strains, identification of the virus isolates (LVS), and the determination of the titer of the LVS in parallel with the reference strains were performed as previously described (13,16,17).
2.9. Titration of the nOPV2 Using the Validated Protocol
The titration of nOPV 2 was performed as previously described for bOPV 1 and 3 After taking the pictures of the VVM, the vaccine vials were labelled 1-10 and the aspirated vaccine from each vial was dispensed into corresponding cryovials. Maintenance medium (MM) was dispensed into a set of dilution tubes labelled 1-10 as follows;1800 μL into tube 1 and 900 μL into tubes 2-8. Then 200ul of the vaccine from cryovial 1 was added to dilution tube one and vortexed before 100ul was transferred from tube one into tube 2. After vortexing tube 2, 100 μL was transferred to tube 3. This process continued till tube 10, after which 100 μL was discarded. Therefore, the dilutions of the vaccine were from 10-1 -10-10. A microtiter plate was divided into two parts to accommodate two vaccine vials per plate. Then, 100 μL of the dilution 10-3 was dispensed into 5 wells of the appropriately labelled microtiter plate (five wells per dilution). Another set of five wells were used for 10-4 and the process was repeated till 10-10 was dispensed. μL100 L20B cell line concentration of 1.2 × 10^5 was added to each well of the microtiter plate. This process was repeated for each vaccine vial stored under different conditions. Controls in each microplate include cell control wells, (only cell and medium) and 10-5 of the LVS (positive control) with a known CPE status. The microtiter plate was rocked gently to mix the content, sealed, incubated at 36 °C, and examined daily for 7 days for cytopathic effect (CPE). In Poliovirus CPE infected cells usually round up, shrink, showed marked nuclear pyknosis, become refractile, degenerate, and falls off from the surface [18,19]. The titer of each vaccine vial was calculated using Spearman-Kärber formulas [20] as follows:
Log CCID50 = L −d(S−0.5)
Where L = log10 of the reciprocal of the lowest dilution at which all the wells showed CPE)
d = log10 of the dilution factor between successive dilutions. For 10-fold serial dilution: d = 1
S = sum of the proportion of wells with CPE
0.5 = the 50% endpoint (median infectious dose)
The viral titer (CCID50®) was the smallest amount of virus capable of causing cytopathic effects in 50% of infected cells.
2.12. Criteria for the Validation of the Protocol and Testing of the Vaccine
(a) The five wells with the virus dilution of 10-3 should have 100% CPE
(b) At least three wells of higher virus dilution must show 100% CPE.
(c) Wells with the highest dilutions (10-8, 10-9, 10-10) should show no CPE
(d) One or more wells with the highest dilution (10-8 or 10-9 or 10-10) showing CPE were considered invalid
(e) The cell control wells must not have any CPE
(f) All the wells with the LVS (at 10-5 dilution) must have CPE.
(g) The new titer of the nOPV2 and the previously stored LVS must be within +-0.5.
(h) If the test is invalid based on the results, the experiment should be repeated with fresh vaccine samples.
2.13. Interpretation of the Results
The WHO minimum required titer as pasted on the vaccine vial for nOPV2 was ≥105.0CCID50/0.1µ. In this study, vaccine titers of ≥105.0 CCID50/0.1mL or ≥106.0 CCID50/mL were similarly considered potent. Also, the color change of the VVM scored 0-50% were still considered potent provided the vaccine titer is not below the minimum requirements.
2.14. Statistical Analysis Data
The statistical package used was R software, version 4.4.1. which contains stats, utils, graphics and additional packages such as tidyverse, ggplots2, dplyr, lme4 and survival. Furthermore, it has a wide range of built-in statistical functions which include descriptive statistics, hypothesis testing, modelling, and data handling. This package does not fix the significance threshold but provides tools to control false positives in multiplicity handling. Both descriptive and inferential statistical techniques were used to analyze the data in this study, The descriptive statistics (mean, standard deviation and range of titers) provided a clear picture of how nOPV2 potency changed over time under four different storage conditions. The deeper understanding of how storage temperature and time interact to affect nOPV2 potency was highlighted by the use of linear mixed model. This model also separates the true effects of condition and time from natural variation between vials caused by repeated measurements on the same vials. With the use of Pairwise comparisons of titers at each time point relative to baseline, the precise time points at which vaccine potency began to deviate significantly from the initial threshold value under each storage condition was identified. To complement the pairwise comparisons of mean titer changes, survival analysis evaluated the time elapsed during which each vaccine vial lost potency (<106·⁰ CCID₅₀/mL). The comparison of the survival distributions of the different storage conditions was done using log-rank test.
2.15. Ethical Approval
The study was primarily an undergraduate research project but was supported by the Emergency Operation Center for the National Primary Health Care Development Agency (EOC-NPHCDA) in Borno State who approved the release of the vaccine samples for the study. The Borno State Health Research Ethics Committee gave provisional approval with ref SHREC No. 113/2026 dated 11 June 2025 for the study. Since no use of human/animal subjects were involved, neither informed consent nor personal data was obtained.
3. Results
The physical examination of the 50 vials of nOPV2 vaccine samples before exposure to different storage conditions revealed that they were not turbid, had normal consistency, and contained no visible particles. However, during the second week of storage at room temperature, one vaccine vial showed suspected fungal growth (figure 2c) and was immediately discarded. The three batches of the nOPV2 vaccines tested were manufactured by two different companies: PT Bio Farma, Indonesia (batches 1 and 2) and Biological E Limited, India (batch 3). Table 1 shows other relevant information about the nOPV2 vaccine samples used in the study. The initial titers of the 50 vials of nOPV2 tested before they were stored at different temperature had titers above the WHO minimum recommended value (105.0CCID50/0.1mL). These initial titers across batches 1 and 2 of nOPV2 vaccine manufactured by Bio Farma ranged from 105.1 to 10 6.1 CCID50/mL, indicating uniform vaccine quality in comparison to batch 3. Precisely, the average titers of batches 1 and 2 were 105.5 CCID50/mL, while batch 3 was 105.0 CCID50/mL. Similarly, the color change of the VVM on the 50 vials of nOPV2 was at 0% score (stage 1) before exposure, indicating that the vaccines were potent.
3.1. Storage in the Refrigerator Within the Laboratory
The titers of nOPV2 vaccines stored in the refrigerator at average monthly temperatures of 5, 3, 3, 4, 3, 2, 4, 6, and 6°C for nine months is presented in Table 2. In this storage condition, the ten vials of nOPV2 sustained higher titers than the minimum requirements for four months. The titer of one (10%) vial was slightly below the reference value (log 5.0) after five and six months of storage. At the 7th month of storage, all the vials except one were below the reference titer. The decrease in the titers of the vaccines from eight to nine months of storage was significantly lower than the minimum requirement. Before and after exposure to varying refrigerator temperatures (approximately 3–5°C) for 3 months, the vaccine recorded a mean titer of 5.96 ± 0.13 log10 CCID50 with a standard deviation (SD) of 0.13. At the fourth month, the mean titer reduced marginally to 5.88 ± 0.20. From the fifth month, the mean titer dropped sharply to 5.24 ± 0.23. By the seventh month, the mean titer fell below the critical reference threshold of 5.0 log10 CCID50 (mean = 4.64 ± 0.25. At the seventh and ninth months, the mean titer declined sharply to 3.66 ± 0.83 and finally to 3.12 ± 0.54. The virus titer of the vaccines also aligned with the color change of VVM up to 4 months of storage, which remained at 0% degradation. However, at 5 and six months, the color of VVM changed slightly to 5% and 10% scores, respectively. The score of the color change on VVM gradually increased to 20%,30%, and 40 % after storage for seven, eight, and nine months, respectively. Although the titer of the vaccine samples significantly decreased at eight and nine months, the color of the VVM failed to attain 100% score (Figure 1a-j).
Figure 1.
The color of VVM remained at 0% degradation up to 4 months of storage. The change in VVM gradually increased to 5%, 10%, 20%,30%, and 40 % after storage for five, six, seven, eight, and nine months, respectively. Although the titer of the vaccine samples significantly decreased at eight and nine months, the color of the VVM failed to attain 100% degradation. During the eight (vial No.8) and nine (vial No. 3 &10) months of storage, some vaccine vials changed color from orange to yellow.
Figure 1.
The color of VVM remained at 0% degradation up to 4 months of storage. The change in VVM gradually increased to 5%, 10%, 20%,30%, and 40 % after storage for five, six, seven, eight, and nine months, respectively. Although the titer of the vaccine samples significantly decreased at eight and nine months, the color of the VVM failed to attain 100% degradation. During the eight (vial No.8) and nine (vial No. 3 &10) months of storage, some vaccine vials changed color from orange to yellow.
3.2. Vaccine Stored in a Room Within the Laboratory
The average weekly temperature of the room where the vaccine samples were kept was 28–29 °C indicating a very minimum fluctuation over four weeks. Overall, the titers of all the vaccine samples retained potency up to a week. After two weeks of exposure, the titer of the 5 vaccine vials (56%) fell below the reference value. The loss in titer was gradual in the third week but became very drastic in week 4 (Table 3). After one week of storage, the mean titer decreased slightly to 5.30 log₁₀CCID₅₀/m with a low SD of 0.10. By Week 2, the mean potency had further declined to 5.18 log₁₀CCID₅₀/mL with increased SD of 0.18. A more pronounced reduction was observed at week 3, where the mean titer fell to 4.84 log₁₀CCID₅₀/mL with a substantial increase in variability SD 0.43). The greatest decline occurred at Week 4, when the mean potency decreased to 4.08 log₁₀CCID₅₀/mL with an SD of 0.52. The change in the color of VVM was scored 10 %, 30%, 60%, and 100% after one, two, three, and four weeks of storage, respectively (Figure 2a-e).
Figure 2.
Before exposure, the color of VVM was at 0% degradation and increased to 10 %, 30%, 60%, and 100% after one, two, three, and four weeks of storage, respectively. However, one nOPV2 vial exhibited a fungal-like contaminant after two weeks of storage at room temperature and was discarded immediately.
Figure 2.
Before exposure, the color of VVM was at 0% degradation and increased to 10 %, 30%, 60%, and 100% after one, two, three, and four weeks of storage, respectively. However, one nOPV2 vial exhibited a fungal-like contaminant after two weeks of storage at room temperature and was discarded immediately.
3.3. Vaccines Stored in the Incubator Within the Laboratory
During storage in the incubator, the vaccine vials experienced sustained high temperatures of 35–36 °C resulting in potency decline over three weeks. The initial titers of 80% of the vaccine samples in batch 2 and 100% in batch 3 met the WHO minimum requirement. However, after one week of exposure to this temperature, only 50% in batch 2 and 10% in batch 3 attained the minimum value. However, at weeks 2 and 3, all the vaccine samples in both batches fell below the minimum titers. Before exposure, the vaccine exhibited a mean titer of 5.48 log₁₀CCID₅₀/mL with an SD of 0.40. However, after just one week of exposure to incubator temperatures, the mean potency declined to 4.87 log₁₀CCID₅₀/mL, representing a reduction of 0.61 log₁₀CCID₅₀/mL from baseline. By week 2, the mean titer had decreased further to 4.47 log₁₀CCID₅₀/mL, and the SD declined from 0.40 before exposure to 0.22. At this stage, the vaccine had lost approximately 18.4% of its baseline potency value. At Week 3, the mean potency dropped to 3.51 log₁₀CCID₅₀/mL, representing a total reduction of 1.97 log₁₀CCID₅₀/mL from the baseline, resulting in a decline of approximately 36.0% in the mean log titer. Although the SD increased slightly to 0.30, the consistently low titers across vials suggest widespread degradation of the vaccine under prolonged exposure to high temperatures. The change in the color of VVM in both batches was scored at 30%, 50%, and 100 % after storage for one, two, and three weeks, respectively (Figure 3a-d).
3.4. Exposure to the Atmospheric Temperature
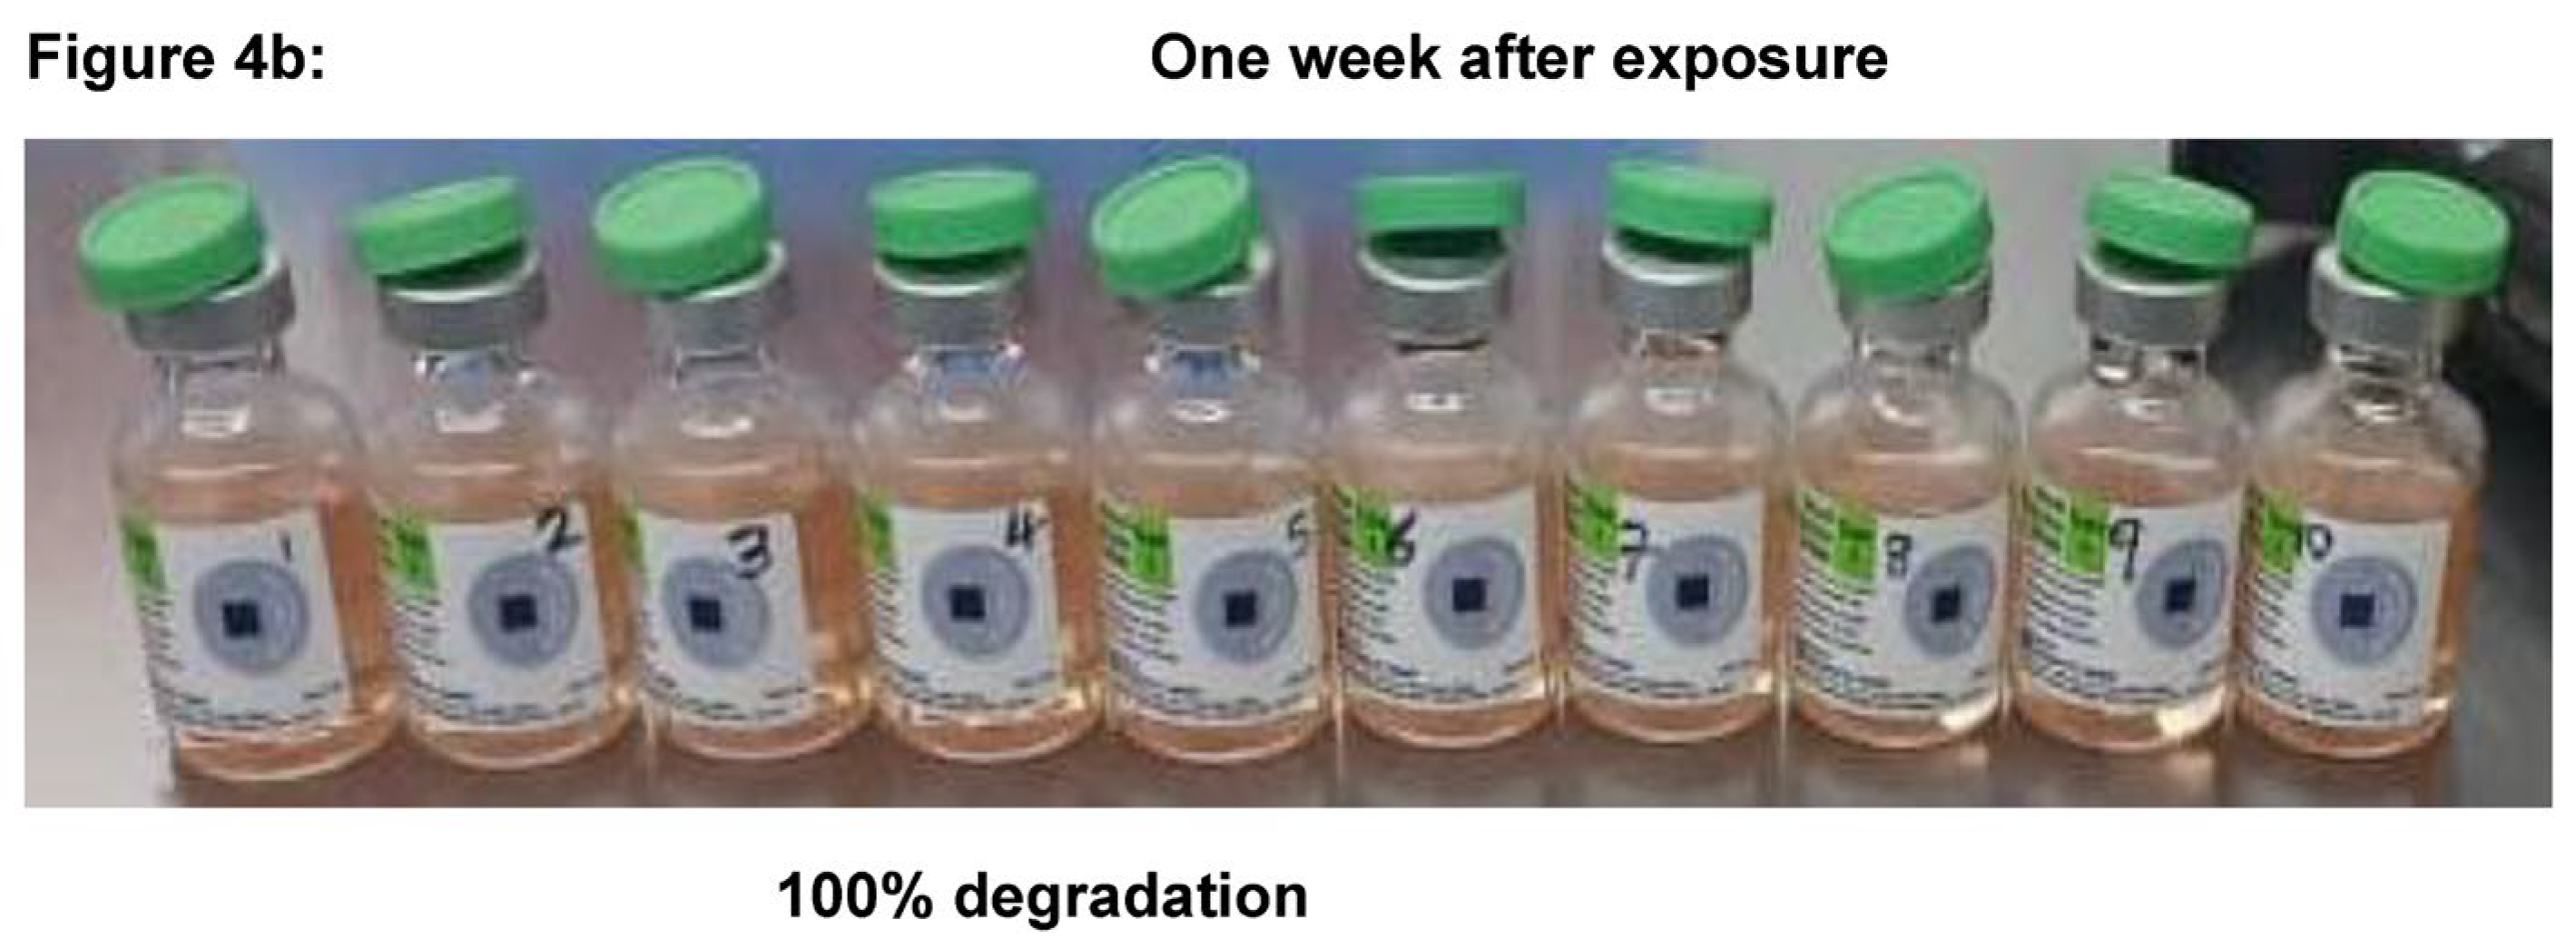
Before exposure, only 20% of the vaccine samples met the minimum required titer. After one week of storage at atmospheric temperature, all the vaccine samples significantly declined below the expected value. Initially, the mean titer was 4.78 log₁₀CCID₅₀/0.1 mL, with a SD of 0.29. However, after just one week of exposure, the mean potency dropped sharply to 3.92 log₁₀CCID₅₀/0.1 mL, representing a reduction of 0.86 log₁₀CCID₅₀, or approximately 18% of baseline titer. The SD of 0.26 suggests that this decline was relatively consistent across the vials. The VVM of all the vaccine samples attained 100% degradation within a week (Figure 4a-b).
Figure 4.
The VVM of all the vaccine samples attained 100% degradation within a week.
4. Discussion
This study measured the infectious dose units (CCID50) of the live poliovirus content of nOPV2 vaccine. Therefore, higher viral titers within the vaccine represents a greater dose of the active virus. Consequently, it corresponds to increased potency and a greater ability to induce an immune response [ 18, 23, 24]. For nOPV2, the recommended minimum threshold of 105.0 CCID50/0.1mL ensures its efficacy. In this study, the virus content of nOPV2 vaccine was monitored during storage at four different conditions over time. Before the vaccines were subjected to different storage conditions, the titers of the 50 vials of the nOPV2 vaccine were above the minimum threshold value. At this stage, the survival probability was 1.00, implying complete initial viability of all the vaccine vials. Additionally, the potency of the vaccines at this stage confirms the standard storage condition of these vaccines at EPU, Borno State in agreement with previous reports on other vaccine types [14,19].
At the refrigerator temperature (2-6 °C), the mean titer of 5.96 ± 0.13 log10 CCID50 and low standard deviation (±0.13) were observed in the first three months of exposure. At the fourth month, the mean titer reduced marginally to 5.88 ± 0.20. Although this reduction was small, it probably signaled the onset of gradual thermal or environmental stress effects on vaccine integrity. Similarly, the survival probability remained unchanged at 1.00 through the fourth month. From the fifth month, the mean titer dropped sharply to 5.24 ± 0.23, indicating a substantial loss of vaccine potency. At this time, the survival probability declined to 0.90, indicating that 90% of the vaccine vials still retained acceptable potency while 10% had failed. This represented the first observable decline in the survival curve and marked the beginning of measurable deterioration in vaccine stability. This downward trend continued steadily through the sixth month (5.22 ± 0.19). A similar trend was observed with bOPV where the potency was sustained for six months in the refrigerator [19]. However, the titer of 40% and 10% of bOPV and nOPV 2 vaccine vials respectively were below the minimum threshold value. Since the titers of bOPV vaccine vials stopped at six months of storage in the refrigerator, both vaccines cannot be compared this period. With nOPV2, the mean titer fell below the critical reference threshold of 5.0 log10 CCID50 (mean = 4.64 ± 0.25) at the seventh month,, indicating that a significant proportion of the vaccine samples did not meet the manufacturer's potency requirements. At this level, the survival probability dropped dramatically to 0.10, indicating that 10% of the vaccine vials remained above the acceptable potency threshold. This steep reduction indicates a period of accelerated degradation, where the majority of the vaccine titer declined within a relatively short time window. The most notable degradation occurred between the seventh and ninth months, during which the mean titer declined sharply from 3.66 ± 0.83 to 3.12 ± 0.54. This stage was also characterized by a marked increase in standard deviation, particularly at month eight, suggesting increasing heterogeneity in potency stability. The survival probability reached 0.00, indicating complete failure of all vaccine vials due to prolonged exposure.
The Kaplan–Meier estimates showed survival probabilities declining from 1.00 at baseline to 0.90 at month five, dropping sharply to 0.10 at month seven, and reaching 0.00 by months eight and nine. The median survival time was approximately seven months, indicating that half of the vaccine vials lost acceptable potency by this point. The linear regression model showed a strong negative relationship between exposure time and titer, with a monthly decline of 0.310 log10 CCID50 units and R² = 0.811, indicating that time accounted for over 80% of the variation in vaccine titer. The exponential decay model also confirmed biologically plausible degradation, with an estimated decay rate of 0.0667 per month and R² = 0.767, suggesting approximately 6–7% loss of remaining potency each month. Similarly, the virus titer of the vaccines also aligned with the VVM color up to 4 months of storage, with degradation remaining at 0%. However, at 5 and six months, the VVM changed slightly to 5% and 10% degradation, respectively. The change in VVM gradually increased to 20%, 30%, and 40 % after storage for seven, eight, and nine months, respectively. Similarly, the color change in the VVM of nOPV2 and bOPV [19] was the same after six months of storage at this temperature. At 0.00 survival probabilities of the vaccine samples at 8 and 9 months of storage, the VVM did not reach 100% degradation (Figure 1a-j). It is not yet known whether a similar color change would occur on the VVM of bOPV vaccine after storage for nine months at this temperature. Overall, refrigeration effectively preserves nOPV2 potency for at least 6–7 months, after which gradual degradation becomes evident as previously reported [25].
After one week of storage at room temperature, the mean titer decreased slightly to 5.30 log₁₀CCID₅₀/0.1mL, representing a modest reduction in potency. The low SD of 0.10 suggested that the decline was relatively consistent across all vaccine vials. At week 2, the mean titer had further declined to 5.18 log₁₀CCID₅₀/0.1mL. Similarly, the titer of bOPV was above the minimum required threshold after storage at this temperature for two weeks [19]. Although the vaccine remained above the minimum acceptable potency threshold of 5.0 log₁₀CCID₅₀/0.1mL, the downward trend indicated the onset of measurable thermal degradation. The increase in SD to 0.18 suggested emerging variability in the response of individual vials to prolonged exposure. A more pronounced reduction was observed at week 3, where the mean titer fell to 4.84 log₁₀CCID₅₀/mL, dropping below the manufacturer’s recommended minimum potency value. The greatest decline occurred at week 4, when the mean potency decreased to 4.08 log₁₀CCID₅₀/0.1mL with an SD of 0.52. This represented an overall reduction of approximately 1.30 log₁₀CCID₅₀/mL (24.2%) from baseline (week 0). Our findings corroborate a report that vial-specific factors can exacerbate potency loss [26]. The color change in the VVM was scored 10 %, 30%, 60%, and 100% after one, two, three, and four weeks of storage, respectively (Figure 2a-e) similar to what was reported on bOPV [19]. Additionally, average weekly room temperature of 28-29 °C over four weeks indicated minimum fluctuation. Unlike storage in the refrigerator, room temperature (28–29°C) resulted in a markedly reduced survival period, with a median time to failure of approximately 3.5 weeks and a mean survival time of 3.2 weeks. Like bOPV[19], all the vials (100%) of nOPV2 in this study reached failure by the end of the fourth week, with a survival probability of 0.0. The hazard trend shows a moderate increase, indicating a consistent and accelerating risk of potency loss over time. The log-rank test revealed a statistically significant difference compared with refrigeration (p < 0.001), confirming that room temperature exposure significantly reduces vaccine stability.
During the storage at incubator temperature, a mean titer of 5.48 log₁₀CCID₅₀/0.1mL with an SD of 0.40 before exposure dropped to 4.87 log₁₀CCID₅₀/0.1mL, representing a reduction of 0.61 log₁₀CCID₅₀/0.1mL from baseline after a week of storage. At week 2, the mean titer had decreased further to 4.47 log₁₀CCID₅₀/mL, reflecting continued loss of viral viability. The decline in the standard deviation to 0.22 indicated greater consistency among vials, but the vaccine had lost approximately 18.4% of its baseline potency value. At Week 3, the mean potency dropped to 3.51 log₁₀CCID₅₀/mL, representing a total reduction of 1.97 log₁₀CCID₅₀/mL from baseline. This corresponds to a decline of approximately 36.0% in the mean log titer and indicates severe loss of vaccine potency. Although the standard deviation increased slightly to 0.30, the consistently low titers across vials suggest widespread degradation of the vaccine under prolonged exposure to high temperatures, in agreement with Milstien et al. [26]. The decline was sufficient to reduce the average potency below the acceptable threshold of 5.0 log₁₀CCID₅₀/0.1mL.
The color changes in VVM in both batches was scored 30%, 50%, and 100 % after storage for one, two, and three weeks, respectively (Figure 3a-d). A similar trend has been reported for bOPV in which both the color of the VVM and the titer did not deteriorate after storage at this temperature for a week [19]. The median time to vaccine failure below the minimum threshold value was approximately 2.0 weeks, while the mean survival time was 1.9 weeks. The stability of the potency of nOPV 2 at 29 °C for two weeks and one week at 36 °C could be attributed to the use of a sucrose stabilizer. This speculation is supported by a report that sucrose stabilizer protects the live attenuated virus during manufacturing, storage, and transportation [27,28]. Like room temperature, all vials reached failure (100%), and survival probability dropped to 0.0 at week four. However, the hazard trend was classified as high, indicating a much steeper increase in failure risk over time compared to room temperature. The log-rank test also showed a highly significant difference from refrigeration (p < 0.001), emphasizing the strong impact of elevated temperature on vaccine degradation.
There was a rapid and severe decline in vaccine potency when stored at atmospheric temperatures. The mean potency of 4.78 log₁₀CCID₅₀/0.1 mL, with an SD of 0.29 before exposure, dropped sharply to 3.92 log₁₀CCID₅₀/0.1 mL (SD = 0.26). The reduction in titer was 0.86 log₁₀CCID₅₀, or approximately 18% of baseline potency after one week of storage at this temperature. The decline in the titer was relatively consistent across the vials. This rapid decrease in potency indicates that exposure to high ambient temperatures—even for a short duration—is sufficient to compromise nOPV2 efficacy. Overall, vaccines exposed to uncontrolled atmospheric conditions are at high risk of rapid potency loss, highlighting the need for strict monitoring and temperature-controlled transport and storage in field settings to preserve vaccine efficacy. The atmospheric condition (~44°C) demonstrated the most extreme instability, with a median time to failure of just 1.0 week and a mean survival time also of 1.0 week. As previously reported for bOPV [19], all the vials of nOPV2 failed rapidly (100%), and survival probability was zero within a week of exposure. The hazard trend was very high, reflecting an abrupt and severe increase in failure risk under extreme heat conditions. The change in the color of VVM of all the vaccine samples was scored 100% within a week (Figure 4a-b).
During storage at the incubator (batch 2 at week 2) and the refrigerator (months 8 and 9), some vials of nOPV2 changed color from orange to yellow, but the titers and VVM degradation were not adversely affected. However, one nOPV2 vial exhibited a fungal-like contaminant after two weeks of storage at room temperature and was discarded immediately (Figure 2c).
5. Conclusions
The potency of nOPV2 assessed by the virus content is highly temperature-dependent. The median survival time was approximately 7 months for refrigeration, 2 weeks at room temperature, one week at an incubator, and less than 1 week at atmospheric temperatures, with statistically significant differences across all conditions
Supplementary Materials
The following supporting information can be downloaded at the website of this paper posted on Preprints.org, Appendix 1: Daily temperature readings; Appendix 2: How the nOPV2 vaccine vials were kept during storage at different temperatures.
Funding
This research was an undergraduate research project that was further expanded for publication purposes and did not receive any specific grant from funding agencies in the public, commercial, or not-for-profit sectors.
Authors Contributions
Marycelin Mandu Baba-Conceptualization, Literature search, data interpretation, project administration, resources, writing the original draft and final version, and supervision 2. Amina Yusuf Ali - Investigation, resources, methodology, review, and editing 3. Mercy Doose Yough- Investigation, resources, methodology, review, and editing 4. Abubakar Yakubu- Investigation, resources, methodology, review, and editing 5. Jane Oowo Anyiam- Project administration, validation, data curation, review, and editing 6. Bashir Adebayo Elegbede- Project administration, validation, review, and editing.
Conflicts of Interest
All the authors hereby declare no conflict of interest.
Data Availability statement
The original contributions presented in this study are included in the article/supplementary material. Further inquiries can be directed to the corresponding author(s).
Acknowledgments
We are indeed grateful to all the staff of the WHO National Polio Laboratory, Maiduguri, for their moral and technical assistance. We sincerely thank the Borno State Ministry of Health and the Borno State Primary Health Care Development Authority for permitting us to conduct the study and providing technical support. The technical assistance of Miss Amina Usman Abubakar, Joseph Vandy Momoh and Ibrahim Bitrus is highly appreciated. We thank the World Health Organization and the University of Maiduguri Teaching Hospital (UMTH) for hosting the Laboratory facility where the test was performed.
My Biographical Note
Marycelin Baba (PhD) has worked with the University of Maiduguri, Nigeria, since 1987 to date. She has been the Director of the WHO National Polio Laboratory, University of Maiduguri Teaching Hospital, from 2006 to date and serves as a member of five National Polio Committees in Nigeria. Additionally, she has published over 90 articles in both local and international peer-reviewed journals.
Abbreviations
OPV: Oral Polio vaccine, nOPV2: Novel Oral Polio vaccine serotype 2, tOPV: trivalent oral Polio vaccine ( serotype 1,2,3), bOPV (bivalent Oral Polio vaccine serotype 1 & 2, VVM: vaccine vial monitor, VPD: vaccine preventable diseases, WHO: World Health Organization, GPEI: Global Polio Eradication Initiative, EPU: Epidemiological Unit, cVDPV: circulating vaccine-derived poliovirus, AFP: Acute flaccid paralysis, MMC: Maiduguri Metropolitan Council, LGA: Local government area, OBR: outbreak response, NIBSC: National Institute of Biological Standards, UK: United Kingdom, LVS: Local virus stock, GM: Growth medium, MEM: Minimum essential medium, L20B: a mouse cell line genetically engineered to express the human poliovirus receptor CD155, CC: Cell culture control, CCID50: Cell culture infectious dose 50, PV: Poliovirus, CPE: Cytopathic effect.
References
- Wassilak, S. G.; Vertefeuille, J.F.; Martin, R. M. The Globally Synchronized Switch-Another Milestone Toward Achieving Polio Eradication. JAMA Pediatr. 2016 ;170(10):927-928. [CrossRef]
- Liyasu, Z.; Danzomo, A. A.; Jeyaseelan, V.; Gofama, M. M.; Akintan, P. E.; Akinrinoy, O. O.; Also, U.; Abdullahi H, Mawashi, K. Y.; Gajida, A. U.; Sifontes, G.; Mainou, B. A.; Cavestany, R. L.; Mach, O.; Verma, H. Impact of novel Oral Poliovirus Type 2 vaccination campaigns: A seroprevalence survey in Nigeria. Vaccine. 2025, 54:126978 ISSN 0264-410X. [CrossRef]
- Saleem, A. F.; Yousafzai, M. T.; Mach, O.; Khan, A.; Quadri, F.; Weldon, W.; C.; Oberste, M. S.; Zaidi, S. S.; Alam, M. M.; Sutter, R. W.; Zaidi, A. K. M. Evaluation of vaccine derived poliovirus type 2 outbreak response options: A randomized controlled trial, Karachi, Pakistan. Vaccine. 2018, 36(13):1766-71.
- Wang H. Why Have cVDPV2 Outbreaks Increased Globally After the Polio Immunization Strategy Switch: Challenges for the Polio Eradication Endgame. China CDC Wkly. 2020 ;2(11):176-179.
- Global Polio Eradication Initiative. Novel Oral Polio Vaccine (nOPV2) Management, Monitoring, Removal and Disposal (in 50-dose vials with VVM type 2. Technical advice 2021file:///C:/Users/MARYCELIN/Desktop/Backup%2006-0 22/My%20Documents/Manuscript/2026/nOPV2/Articles/nOPV2-vaccine-handling.pdf. Accessed on 10 May 2025.
- World Health Organization. Weekly GPEI Polio Analyses. Accessed Sep 8, 2022.
- Global Polio Eradication Initiative. cVDPV2 outbreaks and the type 2 novel oral polio vaccine (nOPV2). Geneva, Switzerland: World Health Organization; 2024. https://polioeradication.org/wp-content/uploads/2024/08/GPEI_nOPV2_Factsheet_5-January-2024.pdf. Accessed on 3 June 2026.
- Asekun, A.; Nkwogu, L.; Bawa, S.; Usman, S.; Edukugho, A.; Ocheh, J.; Banda, R.; Nagda, G. W.; Nsubug, P.; Archer, R., Nebechukwu, T.; Mohammed, A.; Shuaib, F.; Bolu, O.; Adamu, U. Deployment of novel oral polio vaccine type 2 under emergency use listing in Nigeria: the rollout experience. Pan Afr Med J. 2023, 45(Suppl 2):3. [CrossRef]
- World Health Organization, Geneva: 2017. Standard Operating Procedures: responding to a poliovirus event or outbreak, global polio eradication initiative.
- WHO Disease outbreak news -Circulating vaccine-derived poliovirus type 1 – Israel. 2025. https://www.who.int/emergencies/disease-outbreak-news/item/2025-DON578. Accessed 20 June 2026.
- Sunheron. Maiduguri weather and climate in 2025 https://www.sunheron.com/cities/nigeria/maiduguri-weather-climate/ . Accessed on 30 September 2025.
- Weather Spark. Climate and Average Weather Year-Round in Maiduguri , Nigeria. 2024. https://weatherspark.com/y/74227/Average-Weather-in-Maiduguri-Nigeria-Year-Round. Accessed on 30 September 2025.
- World Health Organization. Polio Laboratory Manual; WHO: Geneva, Switzerland, 2004; No. WHO/IVB/04.10.
- Muhammad, T.; Baba, S. S.; Zaria, L. T.; Abdul-Dahiru, E. Y.; Thilza, I. B. Determination of Thermal Stability of Oral Polio Vaccine (OPV) at Different Temperatures under Laboratory Conditions. Stem Cell 2010, 1: 69–73. 27.
- WHO. Testing the correlation between the vaccine vial monitor and vaccine potency. WHO/V&B/99.11 1999. https://iris.who.int/server/api/core/bitstreams/13c7743d-07c7-47de-bf7a-02e5e4c510a7/content. Accessed on 29 September, 2025.
- Baba, M. M.; Kawu, A. A.; Bukar, S. A.; Melton, M. S.; Mala, A.; Salisu, I.; Oderinde, B. S. Population immunity to the three serotypes of poliovirus post-interruption of wild poliovirus transmission in Nigeria. J Virus Erad. 2025, 11(4):100615. [CrossRef]
- Gerloff, N.; Mandelbaum, M.; Pang, M. H.; Collins, N.; Brown, B.; Sun, H.; Hawington, C.; Hecker, J.; Agha, C.; Burns, C.; Vega, E. Direct detection of polioviruses using a recombinant poliovirus receptor. PLoS One 2021;16(11):e0259099. [CrossRef]
- Eswaran, S. P.; Praharaj, A. K.; Chander, Y.; Nagendra , A. Potency Titration of Oral Polio Vaccine by Estimation of Live Virus Content Using Tissue Culture Technique. Med J Armed Forces India 2003, 59(2):105-7. [CrossRef]
- Yough, M. D.; Ali, A. Y.; Murba, A. U.; Melton, M. S.; Abdelrahim, K.; Baba, M. M. Monitoring the infectious titer of bOPV and the vaccine vial monitor stage at different storage temperature ranges. Hum Vaccin Immunother. 2026; 22(1):2662762. [CrossRef]
- Kärber, G.; Beitrag, zur kollektiven; Behandlung, pharmakologischer Reihenversuche. Naunyn-Schmiedebergs Archiv für experimentelle Pathologie und Pharmakologie. 1931 162, 480–483.
- Lei, C.; Yang, J.; Hu, J.; Sun, X. On the Calculation of TCID50 for Quantitation of Virus Infectivity. Virol Sin. 2021, 36(1):141-144. [CrossRef]
- Reed, L. J.; Muench, H. A. simple method of estimating fifty percent endpoints. American Journal of Epidemiology 1938; 27: 493–497.
- Fadlyana, E.; Rusmil, K.; Rahmawati, A.; Bachtiar, N. S. Evaluation of oral poliovirus vaccine potency and immunogenicity in tropical conditions. Paediatrica Indonesiana 2020, 60(3): 123–132.
- Kutumbetov, L.; Myrzakhmetova, B.; Tussipova, A.; Zhapparova, G.; Tlenchiyeva, T.; Bissenbayeva, K.; Zhapar, K.; Zhugunissov, K.; Nurabayev, S.; Kerimbayev, A. Safety and Immunogenicity of the Live Attenuated Vaccine QazCOVID-Live Against Coronavirus Infection COVID-19: Pre-Clinical Study Results. Vaccines, 2024, 12(12), 1401. [CrossRef]
- Zipursky, S.; Boualam, L.; Cheikh, D. O.; Fournier-Caruana, J.; Hamid, N.; Janssen, F.; Guichard, S. Assessing the potency of oral poliovirus vaccine under field conditions in West Africa. Vaccine 2011; 29(20): 3588–3594.
- Milstien, J. B.; Kaddar, M.; Kieny, M. P. 2006. The impact of globalization on vaccine development and availability. Health Aff 25(4): 1061-1069.
- Kamali-Jamil, R.; Shayestehpour, M.; Sadigh, Z. A.; Taqavian, M.; Shahkarami, M. K.; Esna-Ashari, F.; Shahbazi, R.; Mohammadi, A.; Foroughi, A.; Romani, B. The Effect of Various Stabilizers on Preserving Immunogenicity of Lyophilized Mumps Vaccines. J Res Health Sci. 2017; 17(4):393.
- Malenovska H. The influence of stabilizers and rates of freezing on preserving of structurally different animal viruses during lyophilization and subsequent storage. Journal of Applied Microbiology 2014; 117(6):1810-1819. [CrossRef]
Figure 3.
The degradation of VVM in both batches was rated at 30%, 50%, and 100 % after storage for one, two, and three weeks, respectively (Figure 3a-d). No difference was observed in percentage of VVM degradation between both batches. The nOPV2 vial 4 (batch2) changed color from orange to yellow.
Figure 3.
The degradation of VVM in both batches was rated at 30%, 50%, and 100 % after storage for one, two, and three weeks, respectively (Figure 3a-d). No difference was observed in percentage of VVM degradation between both batches. The nOPV2 vial 4 (batch2) changed color from orange to yellow.
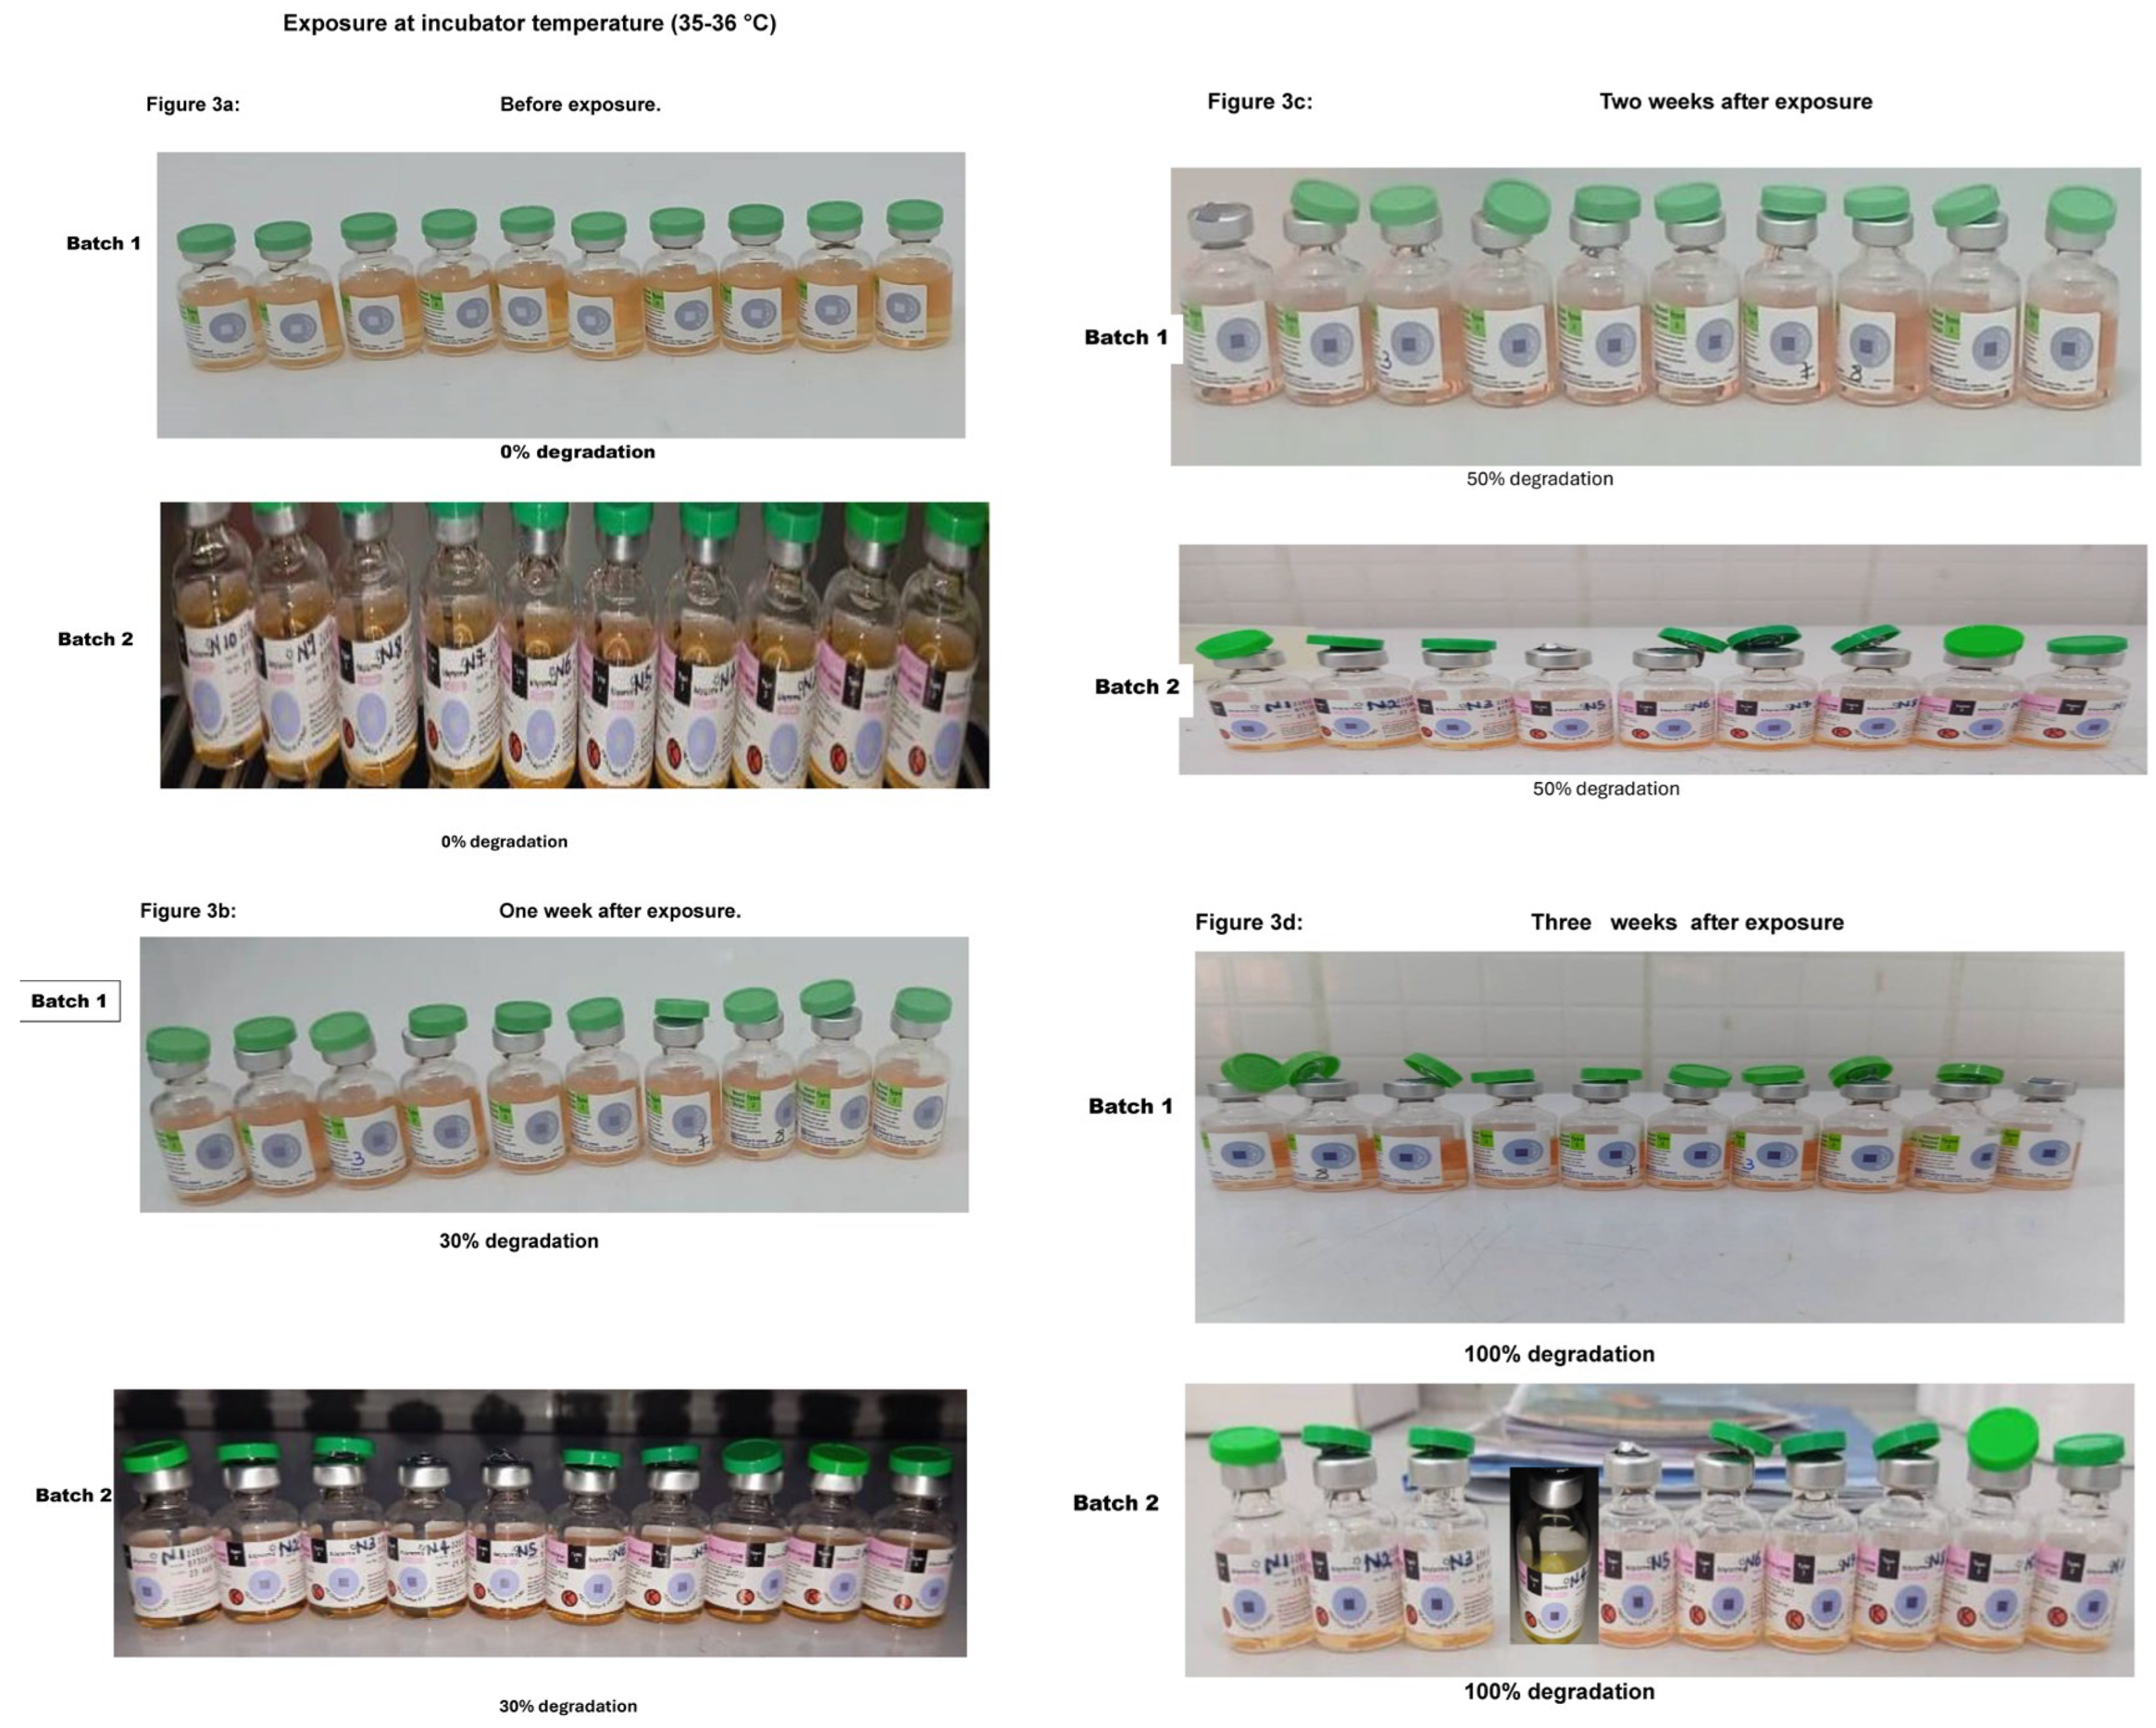

Table 1.
Details about the vaccine samples used for the study.
| S/No | Storage conditions | Number of vials | Expiry date | Manufacturer | Batch Number | Lot No | Date of collection | Type of stabilizer |
|---|---|---|---|---|---|---|---|---|
| 1 | Refrigerator Temperature |
10 | 16/10/2027 | PT Biofarma (persero) |
Batch 1 2287724 |
None | 28/09/25 | Sucrose 35%(w/) |
| 2 | Room Temperature | 10 | 23/8/2026 | PT Biofarma (persero) |
Batch 2 2285324 |
None | 21/07/2025 | Sucrose 35%(w/) |
| 3a | Incubator Temperature |
10 | 23/8/2026 | PT Biofarma (persero) |
Batch 2 2285324 |
None | 21/07/2025 | Sucrose 35%(w/) |
| 3b | Incubator Temperature |
10 | June 2026 | Biological E limited | Batch 3 421604924A |
8044.01 ENG | 17/02/2025 | Sucrose 35%(w/) |
| 4 | Atmospheric temperature |
10 | June2026 | Biological E limited | Batch 3 421604924A |
8044.01 ENG | 17/02/2025 | Sucrose 35%(w/) |
The three batches of the nOPV2 vaccines tested were manufactured by two different companies- P TBiofarma (batches 1 and 2) and Biologicals E (batch 3). Other details of the nOPV2 vaccine tested are contained in Table 1.
Table 2.
The titer of nOPV2 before and after exposure to the refrigerator temperature (28°C- 29 °C).
Table 2.
The titer of nOPV2 before and after exposure to the refrigerator temperature (28°C- 29 °C).
| S/No | The titer indicated on the nOPV2 vaccine vial by the manufacturer | Before exposure | After 1 month of exposure (Average monthly temperature = 5oC) |
After 2 months of exposure (Average monthly temperature = 3oC) |
After 3 months of exposure (Average monthly temperature = 3oC) |
After 4 months of exposure (Average monthly temperature = 4oC) |
After 5 months of exposure (Average monthly temperature = 3oC) |
After 6 months of exposure (Average monthly temperature = 2oC) |
After 7 months of exposure (Average monthly temperature = 4oC) |
After 8 months of exposure (Average monthly temperature = 6oC) |
After 9 months of exposure (Average monthly temperature = 6oC) |
|---|---|---|---|---|---|---|---|---|---|---|---|
| 1 | ≥5.0 | 5.9 | 5.9 | 5.9 | 5.9 | 5.9 | 5.3 | 5.3 | 4.9 | 3.5 | 3.1 |
| 2 | ≥5.0 | 5.9 | 5.9 | 5.9 | 5.9 | 5.9 | 5.1 | 5.1 | 4.3 | 3.1 | 2.9 |
| 3 | ≥5.0 | 6.1 | 6.1 | 6.1 | 6.1 | 6.1 | 5.1 | 5.1 | 4.5 | 2.7 | 2.5 |
| 4 | ≥5.0 | 6.1 | 6.1 | 6.1 | 6.1 | 6.1 | *4.9 | *4.9 | 4.7 | 2.7 | 2.3 |
| 5 | ≥5.0 | 5.9 | 5.9 | 5.9 | 5.9 | 5.5 | 5.1 | 5.1 | 4.7 | 2.7 | 2.7 |
| 6 | ≥5.0 | 6.1 | 6.1 | 6.1 | 6.1 | 5.9 | 5.1 | 5.1 | 4.7 | 4.5 | 3.7 |
| 7 | ≥5.0 | 6.1 | 6.1 | 6.1 | 6.1 | 6.1 | 5.3 | 5.3 | 4.3 | 4.1 | 3.3 |
| 8 | ≥5.0 | 5.9 | 5.9 | 5.9 | 5.9 | 5.7 | 5.7 | 5.5 | 5.1 | 4.7 | 3.9 |
| 9 | ≥5.0 | 5.9 | 5.9 | 5.9 | 5.9 | 5.9 | 5.5 | 5.5 | 4.7 | 4.7 | 3.7 |
| 10 | ≥5.0 | 5.7 | 5.7 | 5.7 | 5.7 | 5.7 | 5.3 | 5.3 | 4.5 | 3.9 | 3.1 |
The manufacturer’s titers: nOPV2 =105.0CCID50/.1ml. With the Reference titre 105.0CCID50/0.1ml, the ten vials of nOPV2 sustained higher titers than the minimum requirements for four months. The titer of one (10%) vial was slightly below the reference value (log 5.0) after five and six months of storage. At the 7th month of storage, all the vials except one were below the reference titer. The decrease in the titers of the vaccines from eight to nine months of storage was significantly lower than the minimum requirement.
Table 3.
The titer of nOPV2 before and after exposure to the room temperature (28°C- 29 °C).
| Vaccine vials | Titer (10xxCCID50/0.1mL) values | ||||||
|---|---|---|---|---|---|---|---|
| The titer indicated on the NOPV vaccine vial by the manufacturer | Before exposure (initial) | After 1 week of exposure (Average weekly temperature = 28oC) |
After 2 weeks of exposure (Average weekly temperature = 29oC) |
After 3 weeks of exposure (Average weekly temperature = 29oC) |
After 4 weeks of exposure (Average weekly temperature = 29oC) |
||
| 1 | ≥5.0 | 5.3 | 5.3 | 4.9 | 4.3 | 4.3 | |
| 2 | ≥5.0 | 5.3 | 5.3 | 4.9 | 4.1 | 4.1 | |
| 3 | ≥5.0 | 5.1 | 5.1 | 4.7 | 4.5 | 4.1 | |
| 4 | ≥5.0 | 5.3 | 5.1 | 4.9 | 4.3 | 4.1 | |
| 5 | ≥5.0 | 5.5 | 5.3 | 5.1 | 4.9 | 3.5 | |
| 6 | ≥5.0 | 5.1 | 5.1 | 5.1 | 4.9 | 3.9 | |
| 7 | ≥5.0 | 5.3 | 5.1 | 5.1 | 4.7 | 3.3 | |
| 8 | ≥5.0 | 5.3 | 5.1 | contamination | contamination | contamination | |
| 9 | ≥5.0 | 5.3 | 5.3 | 5.3 | 4.9 | 3.9 | |
| 10 | ≥5.0 | 5.3 | 5.1 | 4.9 | 4.7 | 3.7 | |
The manufacturer’s titers: nOPV2 =105.0CCID50/.1ml. The vaccine vials stored at room temperature (28–29 °C) exhibited a gradual decline in the titer over three weeks. Using the reference titer (log10 5.0), the titers of all the vaccine samples retained potency up to a week. After two weeks of exposure, the titer of the 5-vaccine vial (56%) fell below the reference value. The loss in titer was gradual in the third week but became very drastic in week 4 (Table 3).
Disclaimer/Publisher’s Note: The statements, opinions and data contained in all publications are solely those of the individual author(s) and contributor(s) and not of MDPI and/or the editor(s). MDPI and/or the editor(s) disclaim responsibility for any injury to people or property resulting from any ideas, methods, instructions or products referred to in the content. |
© 2026 by the authors. Licensee MDPI, Basel, Switzerland. This article is an open access article distributed under the terms and conditions of the Creative Commons Attribution (CC BY) license (http://creativecommons.org/licenses/by/4.0/).
Copyright: This open access article is published under a Creative Commons CC BY 4.0 license, which permit the free download, distribution, and reuse, provided that the author and preprint are cited in any reuse.