
Submitted:
31 August 2026
Posted:
01 September 2026
You are already at the latest version
Abstract
Energy constraints along with scalability and vulnerability to several malicious attacks including Blackhole, Grayhole, Flooding and Scheduling attacks, are serious impediments for wireless sensors networking deployment. Therefore, we present FlowerSec, a novel topology design for wireless sensor networks along with an AI enhanced security scheme which has the ability to overcome afore stated downsides by design. The sensor network is configured on a hierarchical topology of “Flowers,” each comprising a central, resource-rich “Seed” node (Cluster Head) and up to four “Leaf” nodes. The security boundaries that emerge naturally within such topology along with the ease of operating the energy efficient sleep mode, has given us use to propose a scheme which has high-security guarantees with minimal energy loss. Hence a lightweight supervised AI based Intrusion detection System is deployed at the Seed node. Our LightGBM based model with SHAP feature selection that selects only the top 8 network features can obtain an optimal Macro F1-score of 0.9494 on WSN-DS real world dataset (number of instances are 374,661). The classification at CH occurs at 0.0066 ms per sample proving this is a computationally cheap method and can be performed at resource-constrained nodes such as CHs. Beside this, the supervised engine is complemented with an unsupervised AutoEncoder which is trained on pure normal traffic and able to isolate the benign traffic with reconstruction loss difference of >300 times (AUC-ROC score is 0.9819). We adopt confidence gated escalation protocol which sends the packets having low confidence scores of the supervised engine for detection of novel unseen attacks at a small bounded energy cost of the unsupervised engine.
Keywords:
wireless sensor networks
; intrusion detection
; machine learning
; clustering
; SHAP
; network security
; fault tolerance
; energy efficiency
1. Introduction
Wireless Sensor Networks are now used in many areas and fields (some of them) from: real-world monitoring, care homes, military watching - even smart homes and homes for dementia patients too. To make the nodes smaller, the cost of deployment should be low because to make it as a wireless network, a normal one consists of cheap nodes with limited power budgets. But on the other hand, they must work together in teams and check on the area and send the data. However, the hardware itself is the issue to be designed, but why? Simply because the batteries are small, which is hard and impossible to replace later, as you know. So the processors are weak either. But on the other hand, the nodes fail or could move without any warning to each other. However, the wireless medium is exposed to attacks. The nodes themselves could be attacked and compromised, so the data too might be compromised, and then there goes your system. So some of the factors should be addressed to the security aspects, for example, confidentiality and authenticity too. As for authentication too, availability of the nodes should be well addressed, and data accuracy must be the top feature.
There are two problems always appear in almost every deployment. Firstly, energy: node battery lasts for a limited amount of time. An attack that drains energy will kill or fail the entire network. Secondly, the most important problem that also appears is Security. Mostly traffic-oriented attacks like Blackhole, Grayhole, Flooding, and also Scheduling have to destroy the clustered network, because one node can actually drop or cause delay over the region.
One standard approach to energy consumption is ’Clustering’. In this approach we gather few nodes i.e., forming a "Cluster" and elect one as master that communicate or exchange message with master nodes of the other clusters. Hence, all the messages that nodes produced are accumulated at one node which reduce redundancy of message transmission and manages communicational load.
A protocol like LEACH taught how much such a structure like that helps in energy saving and also creates attractive targets. Since all nodes depend upon their Cluster Head’s honest behavior, some new work tries to add both the security and fault tolerance to the energy aware clustering, but such properties like that are usually added later instead of being built at the beginning of the system.
In this paper, we propose a more suitable security framework, (called FlowerSec) for cluster WSNs driven by our AI approach, which is formed by the integration of the fault tolerant Flower architecture with a light-weight scheme for recognizing components of WSN sensors and actuators This architecture means that FlowerSec naturally defines security boundaries and provides smart power management by identifying which are components of FlowerNet with sensing devices that demand which level of QoS. FlowerSec provides 3 hierarchical levels with their QoS and security phases for different type of applications as follows:
- Level 1 for mission critical applications (high security, QoS guarantees). The components could include things like heart monitoring units or sensors associated with mission-critical applications that demand guaranteed uptime and data integrity.
- Level 2 for normal daily monitoring which could adapt when there is need or on call (moderate security and smart QoS). These components could include things like surveillance cameras and door open sensors, and etc.
- Level 3 for legacy statistics logging, thus supporting a variety of hardware (low security with best effort QoS). These components could include humidity sensors, light sensors, and etc.
In terms of controlling the devices of each layer while observing security and faults related to the IoT devices, FlowerSec has been equipped with a new mechanism which can learn and anticipate the type of a IoT device, it may encounter, given the type of work to be performed. Thus, FlowerSec has developed in each of devices associated with its security layers a light weight ML scheme which identifies the components whose behavior adapts according to operational priorities. FlowerSec’s ML agents have three forms.
- 1.
- Active ML: where ML is always on e.g. for level 1 (high security) devices. These sensors such medical monitoring equipment require high availability and reliability.
- 2.
- Sleep ML - where ML is idle
- 3.
- Alert/On call ML - where its functionality activates only when its sensing devices are needed and deactivates soon afterwards to preserve energy e.g. level 2 and 3 type of devices.
In a difficult time where the flower in particular layer is facing failures i.e. Flower of type I, to allow the entire community to recover from this difficulty, it needs to regenerate using 3 different mechanisms provided by the FlowerSec frame-work known as single-layer re-generation through the flower expansion, the multi-layered re-generation mechanisms where the failed layers are recovered by other layers in the flower which are more secure than them and a third hybrid option to combine these two regeneration mechanisms. These regeneration mechanisms assist in allowing the flower or of its layers to degrade in a graceful way whenever subjected to malicious actions with in specified energy thresholds given as the data loss percentage against the flower node depletion. It has been seen that the hybrid approach provides better degradation performance over its counterpart mechanisms during random malicious attacks. These regeneration mechanisms effectively support the longevity and sustainability of the community within specified service level i.e. 99% against different malicious attacks.
The remainder of this paper is structured as follows: The Section 2 evaluates the related work on the system to gain knowledge about WSN clustering, security, and packets.The Section 3 contains information about the Flower Architecture, which includes as well the basic building blocks and the multiple layer structure. Section 4 contains the recovery mechanisms of the framework. Section 5 introduces the AI-enhanced security framework and the machine learning methodology. Section 6 details the experiments validation and discusses the results. Finally, Section 7 concludes the paper and outlines directions for future work.
2. Related Work
Clustering, Routing, Energy management and Security are the core areas of research of Wireless Sensor Networks. The key literature review from each of these areas along with the positioning of the FlowerSec framework is presented in this section.
Clustering has remained as the one major approach for improving the network scalability and energy efficiency of the networks [1]; the random rotation of Cluster Head has been started during LEACH for equally distributing energy among all networks and is further refined by various protocols like HEED & PEGASIS by adding support for energy-aware clusters & chain-based data aggregation methods [2,3]. Recently CREN-RCL has been implemented by assigning energy-efficient clusters for the sensor nodes based on its distance & communication to its neighbors nodes, this method can achieve a classification accuracy up to 94.38% with forwarding ratio 0.982 [4]
Another approach by using fuzzy inference clustering for energy efficient routing will be using of Mamdani type Fuzzy inference Systems for adaptive cluster formation and will ensure balanced and stable clustering as cluster head optimization based on inspired Dynamic Adaptive Fig Tree Wasp Sum biotic Coevolutionary Optimization [5] algorithm ensuring low energy consumption of 1.02J also with good throughput of 0.93Mbps highlighting the potential of bio inspired optimization techniques for WSN clustering [5].
Staying safe in these networks started becoming a huge priority to a lot of people ’cause these little devices could easily get targeted and messed with by hackers. Their attack can screw with the data or cut off the sensors’ communication with one another or even just drain the hell out of their batteries till the last system dies. So they trained some computer using a whole process of ’learning what is real" and making some reorganization to a simple every day traffic to allow for it to flag down and report an unusual event quickly or as soon as happens.
Intensive research into a range of surveys of an anomaly intrusion detection [6] shows that to reach a required high measure. To test the network defenses, WSN DS data set is the main standard of over than 374,000 real-world examples both of safe traffic and actual attacks have been collected to use for experiment by the survey researchers [7]. Such surveys show remarking accurately on numbers of ways such voting classifier combining Random Forest, K-Nearest Neighbors and also XGBoost. With its combining Particle Swarm for Optimization, the accuracy reaches as perfect as 99.99% [8]. With the usage of XGBoost by a lightweight approach, the accuracy can also be achieved near 99.73% for with the reduction 68% of time reduction side by side the processing rate is reduced as to compare to the other classifiers. This can help with the constrained resource use on WSNs, for they can be constrained on resources [9].
WSN research refers ’Flower’ concept mainly for optimization algorithm. SEEF (Secured Energy Efficient Framework) proposes a cross layer design using flower pollination optimization for dynamic optimal routing and achieves a throughput of 0.57 MB/s and a packet delivery ratio of 96% [10]. Such a design relies on Sybil attack detection as well at cluster head and at base station levels and trust values are computed based also on residual energy and dropping rated. Federating disjoint segments (algorithm FLOWER): this method groups the disjoint segments forming clusters that forms an intercluster star topology at which each cluster is appointed using one distinct mobile agent. Although they share the same word, but the core working of those systems is different from our proposed FlowerSec that we have envisioned. Now a days any work relating or using flower is one doing or two doing: using flower pollination as an optimization meta heuristic or focusing on networking to connect with other small networks to act together (federate). That is where FlowerSec has taken inspiration to introduce a new physical topology for how the sensors are being organized. There also flowers consists of a Seed who sits in centre (Seed node) may surrounded up to four Leaf node, however at each flower-unit (cluster) there are natural security boundaries making possible having an an AI powered intrusion detection. FlowerSec envisions this being done with the power of AI to detect an enemy movement using Machine learning concepts and then with the help of communication done between the flower’s ’Seed’ and neighbouring flower ’Seeds’ (clusters) it becomes possible to identify the enemy location and take all the possible steps to eliminate that danger (with the help of Drone Swarm and/or the help from an ally network or the control room) [11].
Even with significant advancements in clustering, intrusion detection and nature (flower) inspired optimization, research lacks in an integrated framework that leverages both, structured nature inspired topology and AI empowered security features in WSN. Most approaches towards clustering which are effective in terms of energy consumption and scalability lack in built-in security boundary or fault security. Thus, WSN-DS, data-set is to be extensively used for intrusion detection that is applied in this unique architecture which is called flower base. The solution FlowerSec addresses this research gap by utilizing the first ever integrated approach by implementing Flower topology and AI enhanced security by trying it on standard set of data for a real-time perspective than relying purely on complex network.
3. Flower Architecture
The basis of the FlowerSec solution will be the Flower architecture, which describes architecture components, structure they form and general rules of their interactions in the solution.
3.1. Basic Building Block: The Flower
FlowerSec is based entirely around one topology that they call the Flower, a self sustained cluster built around one strong node (Seed), which acts as the CH. Up to 4 leafs can exist orbiting the Seed inside the trust zone, the leaves being the nodes collecting the data.
The chosen limit of four Leaves is not an arbitrary value. It is a limitation derived mathematically based on a geometric proof of packing up to three non-overlapping congruent tangent circles. This allows for ultimate insurance by ensuring at least 3 redundant communication channels for each Leaf. Two Leaves need to meet the distance , where r is the sensing radius at any given time, to ensure the Leaves do not overlap but still maintain full coverage as seen in Figure 8a, retaining as full as possible coverage by the “Seeds” as seen in Figure 1, while avoiding as much loss of coverage during rotation.
Establishing that, in effect, marks and divides the territory between which is the area where Seed can keep watch and authenticate her members. Leaving her a small and localized area to apply her security policies. These connections are nothing fancy, not even really “connections”; they are bidirectional communication lines. This facilitates continuous flow of sensor information from Leaves to be aggregated on Seed and information like configuration updates (or security settings) to be disseminated by Seed over to its Leaves.
Further supporting this line protection to provide protection for communication across the exchanges as the architecture allows for the opting in of encrypted communication suggesting either data privacy is not mandatory in an aspect, but a more trusted method of communication, in this case. The more generalized method of trusted communication may be relied on in these operations within the architecture where applicable. Another possible add-on feature to the present design is an optional Leaf Redundancy Path which works without the intervention of a Seed and allows communication to continue as usual along another alternative route. This allows the cluster an inbuilt defense to being isolated from a node or a network link, while allowing the flowerSec architecture to cope with such problems, while also making it robust enough handle small faults and cope with some self-healing within the cluster in locations. The Seed in this state not only serves as data aggregator for further collection, but a strong local security administrator, that enables the flowerSec to offer targeted, effective and robust security supervision.
3.2. Formation of MultiFlower Layer
The Figure 2 shows the Flower architecture applied and extended from an isolated cluster out into a fully interconnected network space, showing how several Flowers cooperate together to form one continuous and expandable secure domain. We observe that core component buildings present within the Figure 2 are repeated through the secure area, each Flower operating as a self-sufficient unit whilst also partaking in further collaboration and cooperation across the network, leading to enhanced security across the entire deployment area.
Finally adjacent Flowers’Seeds set up secured direct communication links, turning from a collection of independent clusters into a combined working security infrastructure. Such links would carry threat intelligence, synchronization of policies, and consensus over decisions in the whole network. The Flower remains its own Security/Trust Boundary so its particular monitoring by Seed becomes untouched by network growth. The dual-layer approach is crucial: the Seed still monitors Leaves on a local level for irregularities but on a global level shares insights that allow together to detect attacks that would not be able to be sensed by a single cluster. Every flower, as it gets closer to each other or becomes more in range, will provide a secure connection with each other, then establishing an expanding network. Increasing the number of flowers increases the security because they all work interconnectedly; thus, if a security breach happens inside in some flowers, other flowers will see it, notifying others to put countermeasures in place. So then the entire network has a bigger scope, making it difficult for hackers and terrorist organizations from hacking.
3.3. Multi Layer Architecture with Differentiated QoS and Security
The FlowerSec Framework fully unfolds in Figure 3 multilayer architecture where single Flowers and interconnections between them form a hierarchy representing different demands of real-world sensor deployments. Three different layers arise combining the tradeoff between security, performance and energy consumption using an intelligent machine learning component adapting the overall behavior to the assigned layer role.
Layer 1 on top is the heaviest guarded zone as it is being powered by high security with high QoS (Quality of Service) to serve for time critical needs such as those for surveillance using UAV (Unmanned Aerial Vehicle) and satellite as it holds most critical data like real time and surveillance. Its machine learning model remains on as its delay has most impact, meaning it should constantly analyze all packets if there is an intrusion or abnormality at the cost of high battery life and resource and high compute. Followed by Level 2 in the middle which holds medium security and QoS of regular monitoring. Its machine learning is on/off basis, meaning it does not always power up and only does so when the network condition warrants it so that there should also be some energy efficiency as some nodes cannot run on full power all the time. The lowest layer is for regular data with low security and it does not always ensure QoS at all, especially critical services. Its machine learning model lies low and only runs background work at times for surveillance.
It is not the difference between the layers, so much as the flow that connects the higher layer information from the lower data sets, that really make this architecture exciting. Data will not fester it its own layer: under anomaly or when there is the demand for scrutiny over lower priority information, the flow will go upwards. The flow makes architecture move, instead of staying a hierarchy. There, the layers would be connected, yet the distinction between layers intelligent. To this is the testimony of the note on energy and also by implication, machine learning optimisation. The most important layer never sleeps, the medium wakes if necessary, to let off pressure while the lower still layer rests to conserve energy against more important battles.
4. Recovery Mechanisms
To resist to node failures, attacked or hostile environments, mechanisms have to deal with recovery and flowerSec has a large set of recovery mechanisms. These mechanisms are organized from local to global scale and each can be involved independently or together according to failure intensity and nature. Figure 4 illustrates these mechanisms through four consecutive panels, showing the chronological sequence of actions from when network runs normally, through detection of the attack, its recovery and further into ML predicted self healing.
4.1. Single-Layer Recovery
The Flowers contain the leaves in which failure cases appear. When a Leaf (or the Seed) within a Flower undergoes a localized failure, the surviving Leaves within that Flower can expand their sensing ranges or adjust their connections as shown in the middle section of the Figure 4, Flower Expansion. Thus it can effectively patch out that gap, through flower expansion, where Leaves either expand their sensing radius, or, through re-positioning manage to provide coverage to areas previously served by the failed node. Where previously they were tightly bound up and happily clustered into close arrangements, they moved to gradually spread out, the movement itself healing an area, the covering the ground left free by an expanding gap or some other problem. All physical elements of reconstruction to cover in built fault healing characteristics.
Spare nodes used to connect Flowers together are also used in repair process; mobile nodes are used and moved closer to the failure point to act as Seeds instead of fractured Seed nodes. Process is quick, low energy and used for minor changes that does not require any major structure repairs.
4.2. Multi-Layer Recovery
When a failure is more catastrophic and a Flower is partitioned or a critical Seed fails, the use of layers by the architecture comes to help, such as Figure 4 Panel (B). A layer of lower priority (e.g. Layer 2) provides a backup Seed to be used so as to restore connectivity and service to a critical layer (e.g. Layer 1). This cross-layer recovery allows a critical application to continue being served when its infrastructure gets compromised.
Layer recovery happens via negotiation among active layers, the recovering layer requesting support from adjacent ones and this leads to salvation coming from unexpected quarters to this Leaf in Layer 1, the all-important layer, who finds himself surrounded through no fault of his own on some occasion. So Layer 2, hitherto for monitoring purposes only, comes to provide an alternative secure routing path through the redundant Leaf and they co-act to show that even during crises the essential flow of data need not be compromised while one is under attack.
4.3. Hybrid Recovery
With widespread failure or network partition is taken care of by the global response. The previous methods apply simultaneously, with flowers being picked at every layer depending on the distance from the point of failure. This approach minimizes structural changes to occur on any single layer within the recovery process, where a trade-off is available between local and cross-layer strategies. Also, with the escalation of data and with reconfiguration of routers in case the traffic is on its upper or lower layer and reestablishment of the network geometry, it is a global response which is required if failure impacts a very large area where costs if reconstructed would only be the option on single-layer or multi-layer mechanisms, as would involve enormous expenses.
4.4. ML-Predicted Self-Healing
This is where the FlowerSec framework truly sets itself apart: in the proactive aspect of its recovery strategy. As depicted in Figure 4 Panel (D), the ML Predictive Model silently scrutinizes patterns indiscernible to human observers. If it perceives subtle early signals hinting at impending failure in a critical Leaf, it pre-emptively activates a single Layer specific (local node recovery) self healing mechanism before any failure occurs. Instead of reacting to an eventual failure, the system is now capable of identifying and isolating it in advance. This is an unparalleled enhancement when compared to simple failure recovery processes (that take place after a system failure). This feature finds particular use in layer one applications where avoiding disruption at all costs is the objective. Forecasting system failures further enables the system to schedule recovery procedures during times of light load traffic for minimal disruption to regular operations, maximizing the lifetime of the network in terms of performance optimization.
From peaceful operation to coordinated response, from physical reconfiguration to predictive intelligence, the layered wisdom built into the FlowerSec is emerging! Resilience is not a single mechanism, but a spectra consisting of capabilities including proactive, reactive, local and cross-layer, physical reconfiguration and algorithmic methods, all in parallel, to make sure the network is not just surviving but thriving in the face of failures and attacks that are inevitable for operation in challenging environments where wireless sensor networks are called to deploy.
5. AI-Enhanced Security Framework
FlowerSec (based on the Flower architecture) enables intelligent and adaptable security monitoring using machine learning based intrusion detection schemes. Adopting a hierarchical detection model, FlowerSec comprises local monitoring via Seeds with collaboration for network wide threat detection.
5.1. Intrusion Detection System
Based on WSN-DS dataset, a large benchmark consisting of 374,000 labelled normal and attack instances consisting of Blackhole, Grayhole, Flooding and Schedule (TDMA) attacks, the intelligent model performs an intrusion detection of the WSN. The Leaves report sensed information to their parent Seeds. Sensors aggregate sensor-information and extract features from it. The features are then converted into feature vector, the input to ML. The Seed makes a classification as to whether sensor-information depicts normal behavior or an attack. The attacking node is then isolated, a recovery process is initiated by the Seed and a message is pushed to Base station. An active learning approach allows continuous updates of the ML model.
5.2. Machine Learning Methodology
Once more let me stress that although architecture such as flowersec provide great topological foundations, to secure the network there needs to be intelligent decision making that needs to be as local to a detection as possible. Lightweight Machine Learning IDS only need to be operated at Leaf node levels due to Leaf nodes being severely resource deprived and Base Station too remote (high latency). Seed nodes have the just right amount of resources and network visibility required.
In this section we will select the best tree based ensemble methods i.e. XGBoost [12] and LightGBM [13] and use the best which best fits our specification. Here we have chosen LightGBM because of the following reasons: The learning algorithm of LightGBM uses Histogram which helps reduce the time consumed since traditional Gradient Boosting algorithms are slow and they consume a lot of memory. This model will use LightGBM as its main model to be run on Seed node since tree ensemble is computationally heavy due to this property we use the histogram based approach.
Network traffic datasets are also largely imbalanced - there is much normal vs attack traffic. To avoid the model biasing towards the majority when we are training, we will use balanced class weighting to punish misclassifications of minority attacks when they occur above wrong predictions of normal traffic. This achieves good recall (important with critical attack traffic) without generation of artificial attack examples (e.g. using SMOTE) which results in unnecessary noise being introduced into the dataset.
5.3. SHAP-Based Feature Selection for Lightweight Deployment
The computational overhead needed for a WNS deployment should be as minimal as possible. Process all features of the network at the Seed node, is just going to drain the battery life. Thus we use SHAP to identify global feature importance [14]. We calculate absolute mean SHAP value across all attack classes to determine minimum viable features required only. Results obtained through ablation studies confirm reduction of the feature space from 16 to top features (8) is feasible and still achieve higher detection performance, thereby supporting energy saving objectives by reducing the computational footprint of the model, according to the FlowerSec Layer 3 (Sleeping ML) and Layer 2 (On demand ML) paragraphs.
6. Experimental Validation
In to test FrowerSec, we ran number of experiments by apply to a well known public dataset. The reason for choosing the dataset is to provide a reference for others and to allow direct results comparison with other past researchers.
6.1. Dataset Description
The first evaluation was performed on WSN-DS [15], a dataset made explicitly for testing WSN intrusion analysis. It has 374,661 labeled records, classified among five normal and attack types (normal, Blackhole, Grayhole, Flooding, TDMA Scheduling). The raw features, which include node roles, routing metrics and even energy consumption, total 19. Further to show generic usage, we compared performance with SensorNetGuard. It was focused around identifying the malicious sensor node, with 10,000 records.
6.2. Multi-Dataset Investigation and Feature Extraction
Before specifying criterion, we checked each workspace - one by one - comparing four dataset we had access to - WSN-DS, SensorNetGuard, NSL-KDD and CIC-IDS2017 [16]: it proves crucial to be in control because the same physical terms turn out under meaningful names, thus property that turn up next to a dot in the start view may turn out indicative of exactly what we need for example packet operations like Packet Rateard in SensorNetGuSLK, remembering FCIC-IDS2017 And Total Fwd appears as a mixture of Packets, while number of transmitted records as Data Sent To BS in WSNDS, Data Throughput in SensorNetGuard and src_bytes in NSL-KDD.
We derived security related semantic distribution functions based on the real-world for each dataset using exactly the same SHAP guided method of LightGBM run independently on selected datasets without proper merge that would create columns imbalance and artificial padding (invalidating the estimation) due to differences in feature space/WSNDS substance count and size (374,661 rows, 10 for SN Guard and 125,000 train rows itself for NSL-KDD), which made merging useless and gave room for a statistically sound need for better understanding each dataset and validating proposed techniques with separate approach for each: primary is WSN-DS due to energy and cluster-based routing nature of it, whereas SensorNetGuard gives a ground for WSN cross-validation benchmarks and NSL-KDD transferability test which is independent on the standard Network traffic, for which feature matching Table 1 was formed.
On application of the attack classification task against binary dailies on the level of NSL-KDD, the independent pipeline extracted and highlighted eighth informative local attributes of the vertex with the most vital being, those related to src_bytes, remember and dst_host_srv_count, Version at the accuracy level of 0.87, with Macro F047 and an Area Under Curve of 0.9605 for the Receiver Operating Characteristic is achieved. However the low level of absolute accuracy level as compared with WNN datasets prove that the implementation of SHAP-guided pipeline can be done irrespective of the differences in domain of different feature space at the most efficient of capacity but absence of actual and unique WSN routing and energy levels from the domain of the TCP/IP are the features of most basic requirement to make it feasible.
6.3. Preprocessing and Methodology
We apply a three-step method for the preprocessing pipeline that is completely done to accurately test the results and avoiding the occurrence of data leakages. To remove all the specific IDs, every identifier column that has many specific node IDs were dropped so that our model is forced to train on generalized traffic instead of training with memorizing specific node(device) activity. To balance the splits and ensure fair mixture, the 80/20 train/test split has been used with balanced sampling so that it splits evenly all the labels (the rare minor attacks and regular major attack classes). To scale the features on the training data, we use the RobustScaler [17], which would remove any effect done by any unexpected spikes on the network as it scales data using the IQR.
6.4. Performance Comparison and Ablation Study
Table 2 presents the performance comparison between standard baselines and our proposed FlowerSec-IDS (Top-8) model.
Referencing Table 2, we have attained Macro F1-score of 0.9494 on 8 features with FlowerSec-IDS. This represents a minor 1.7% drop on all 16 features model but the 50% feature processing load. More importantly, the inference remains low at 0.0066ms per sample and hence proves that the Seed node can perform live inspection of traffic packets without a network bottleneck.
In case our first shot of splitting the datasets gave us a fortunate scoring shot purely by chance a 10 fold stratified cross-validation [18] was run across the whole dataset of 374,661 incidences meaning that the algorithm had to train and evaluate on ten completely new ’slices’ of traffic, under this stress test experiment the Top 8 FLOWERSEC-IDS proved reliable recording a mean value for Accuracy of 0.9895 +/- 0.0005 and a mean for Macro-f1 of 0.9507 +/- 0.0031. With such small deviations over ten independent folds confirms that the detection performance is specific to the reduced feature set space and not a lucky training split.
To better understand what was the statistical significance of the feature reduction, we performed a McNemar’s test [19] comparison of the misclassifications made on the test set by the 16 feature and 8 feature models. With the resulting p-value of <0.0001 it is confirmed that the difference in number of errors (8 in our case) and hence their rate, is statistically significant. The reduction to the a lower number of features without doubt comes at a certain cost when under ideally clean conditions, as can be seen from the light fall in Macro F1 score of this model (0.9667 to 0.9494). But the results prove that in the cases of constrained resources this small trade-off is absolutely worth it, not least the fact that energy and process overhead has now been exactly halved and noise tests have demonstrated that the gap reverses itself under sensors’ error accumulation: lower importance features tend to distract more with the noise - while 8 higher importance features are enough for accurate enough classification. Reduction was made deliberately as an engineering choice and not as an occasional error of accuracy.
While standard k-fold cross-validation works fine for obtaining a batch estimate, real-world deployment on the sensor node doesn–t receive data in batches; it receives unknown packets one by one. Simulating the constraint of a real-time arrival is more rigorously tested by Leave-One-Out cross-validation carried out on a stratified sample of 3,000 instances; the model is trained on historic context of N-1 packets and has to predict the class of one, newly arrived. Under strict constraints of a real-time implementation, the model works as steady, scoring 0.9917 Accuracy and 0.9586 Macro F1-score with an average inference time of a single, unbatched packet at 1.1494ms. Such latency of <2ms per individual arrival theoretically guarantees the functionality over live traffic capture that should neither create queuing to the traffic flow nor dropping any packets under high loads.
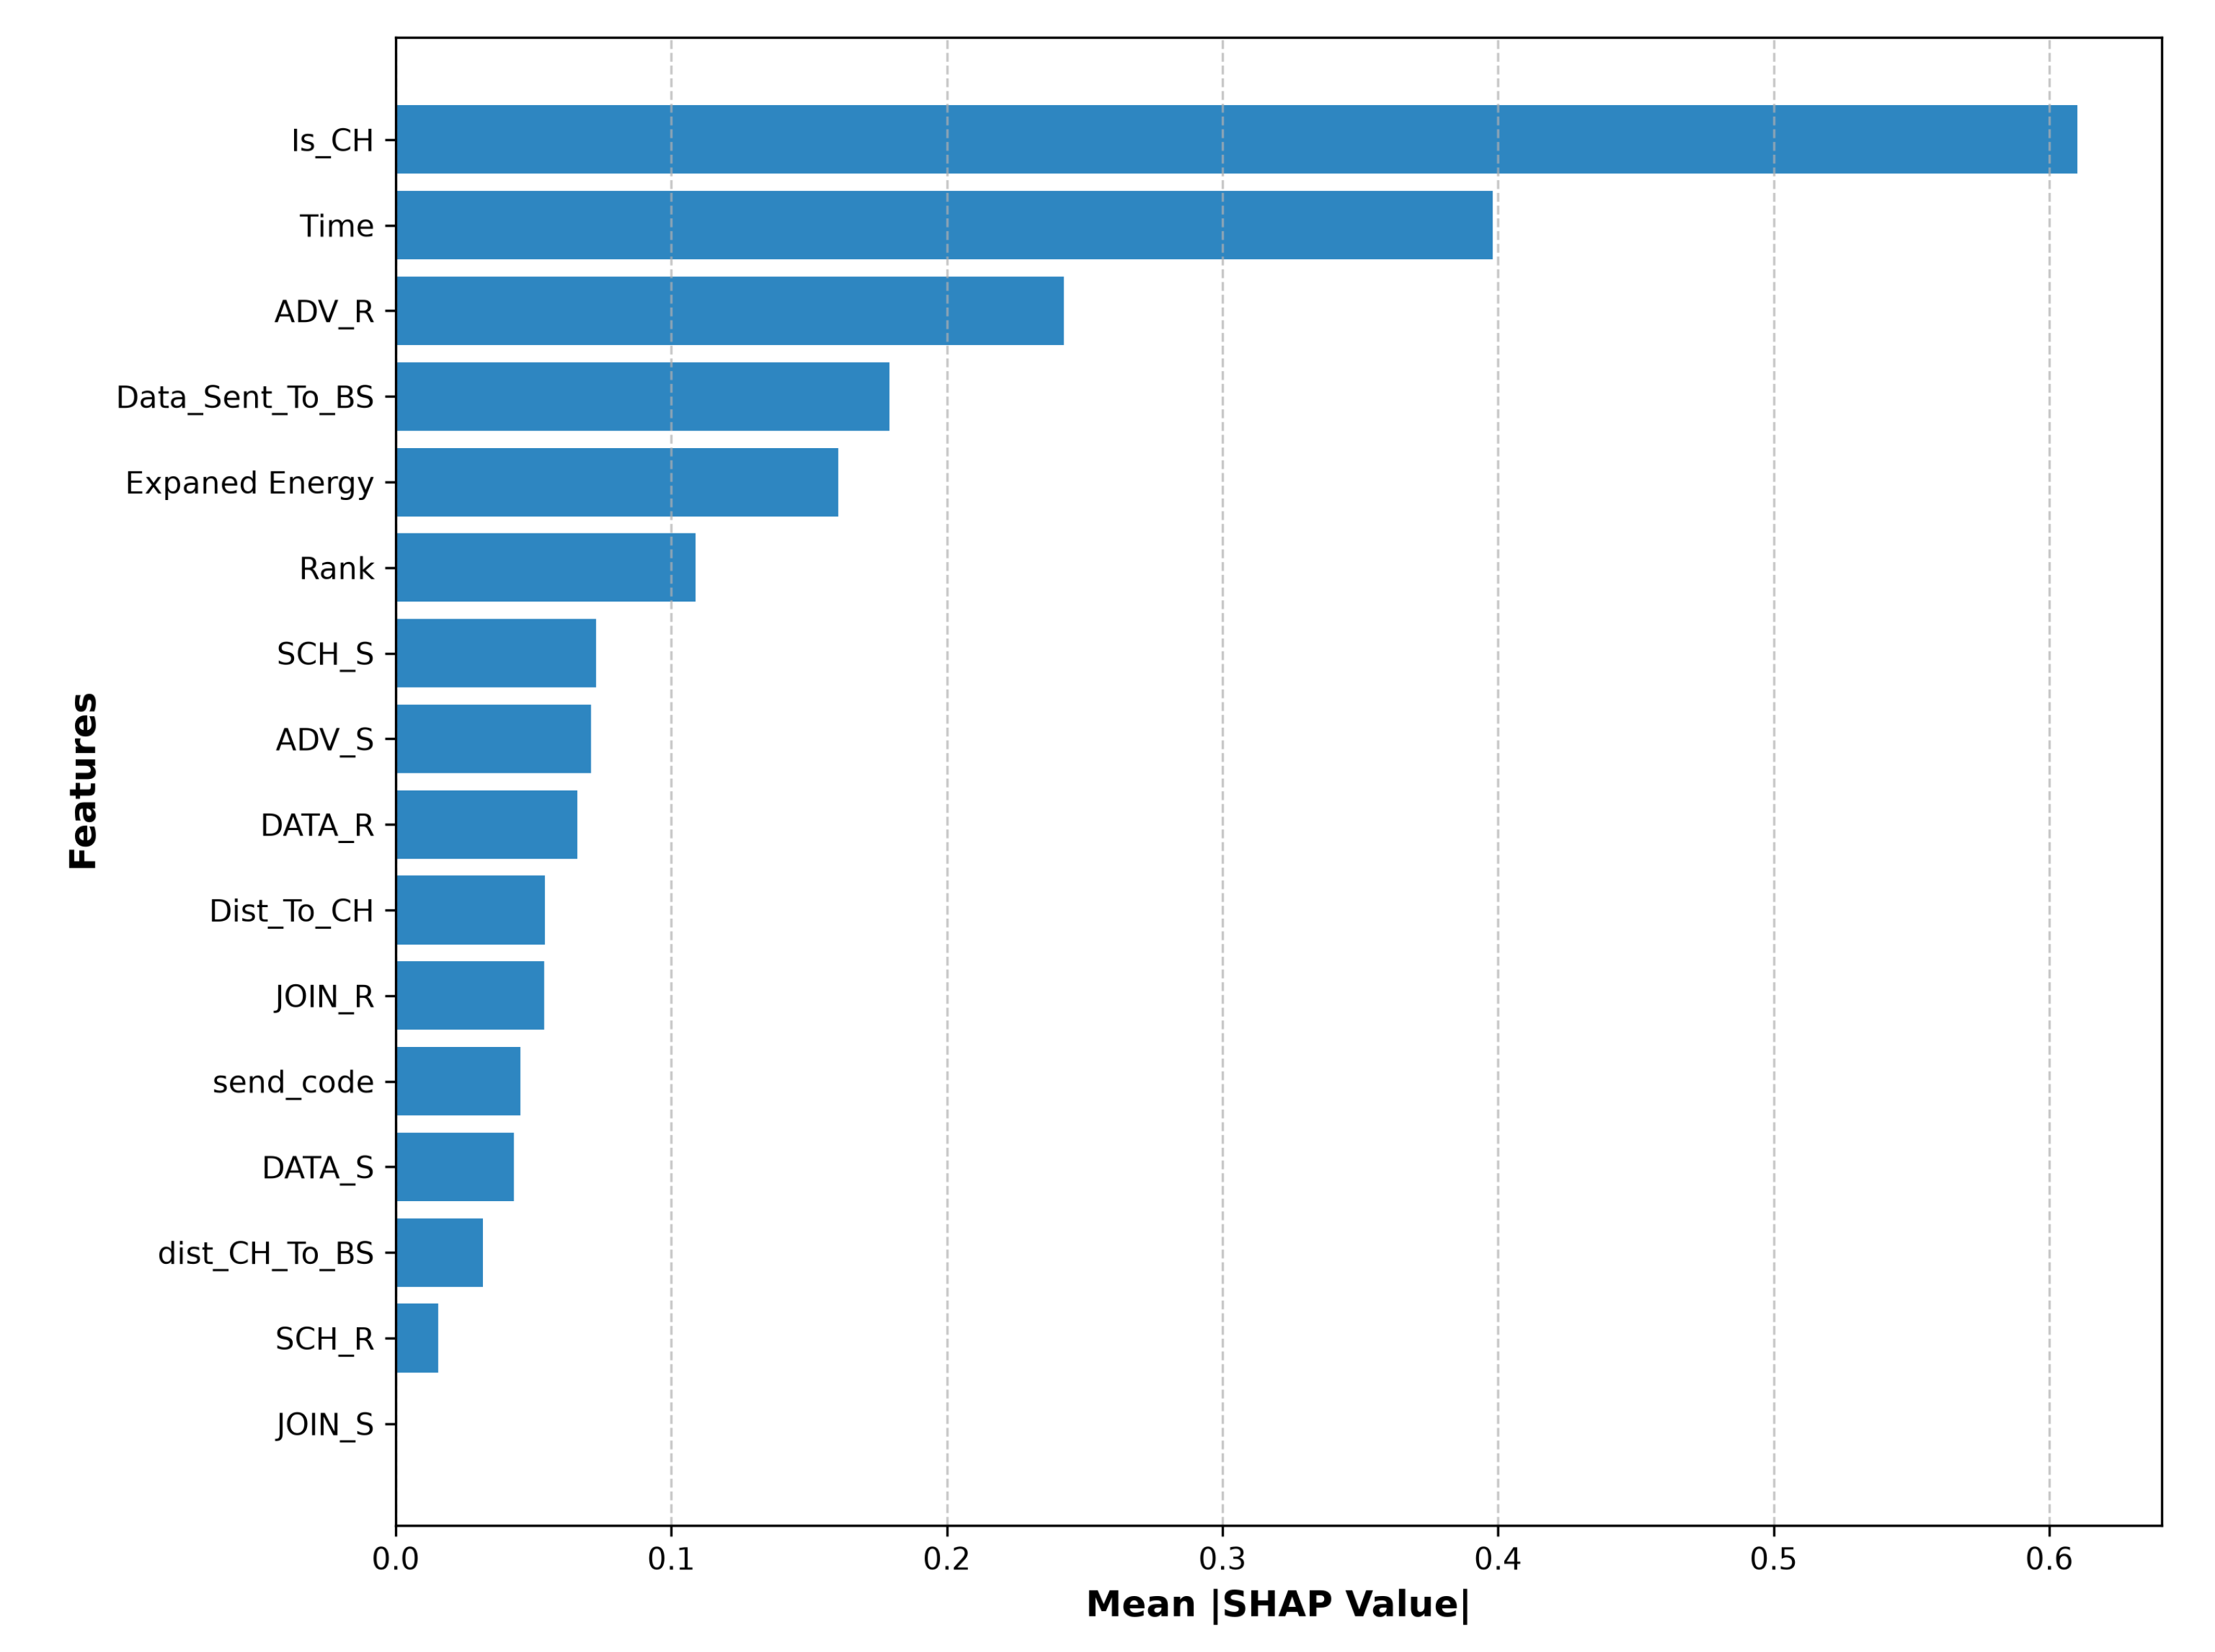
The most important features are the following: Is_CH, Time, ADV_R, Data_Sent_To_BS, Expanded Energy, Rank, SCH_S, ADV_S. Moreover, this list perfectly matches the features the Seed node can monitor within the FlowerSec architecture.
Figure 5.
Global Feature Importance using Mean Absolute SHAP values. Top 8 features, which are chosen for FlowerSec-IDS (lightweight) model is highlighted in color.
Figure 5.
Global Feature Importance using Mean Absolute SHAP values. Top 8 features, which are chosen for FlowerSec-IDS (lightweight) model is highlighted in color.
6.5. Visual Analysis of Detection Performance
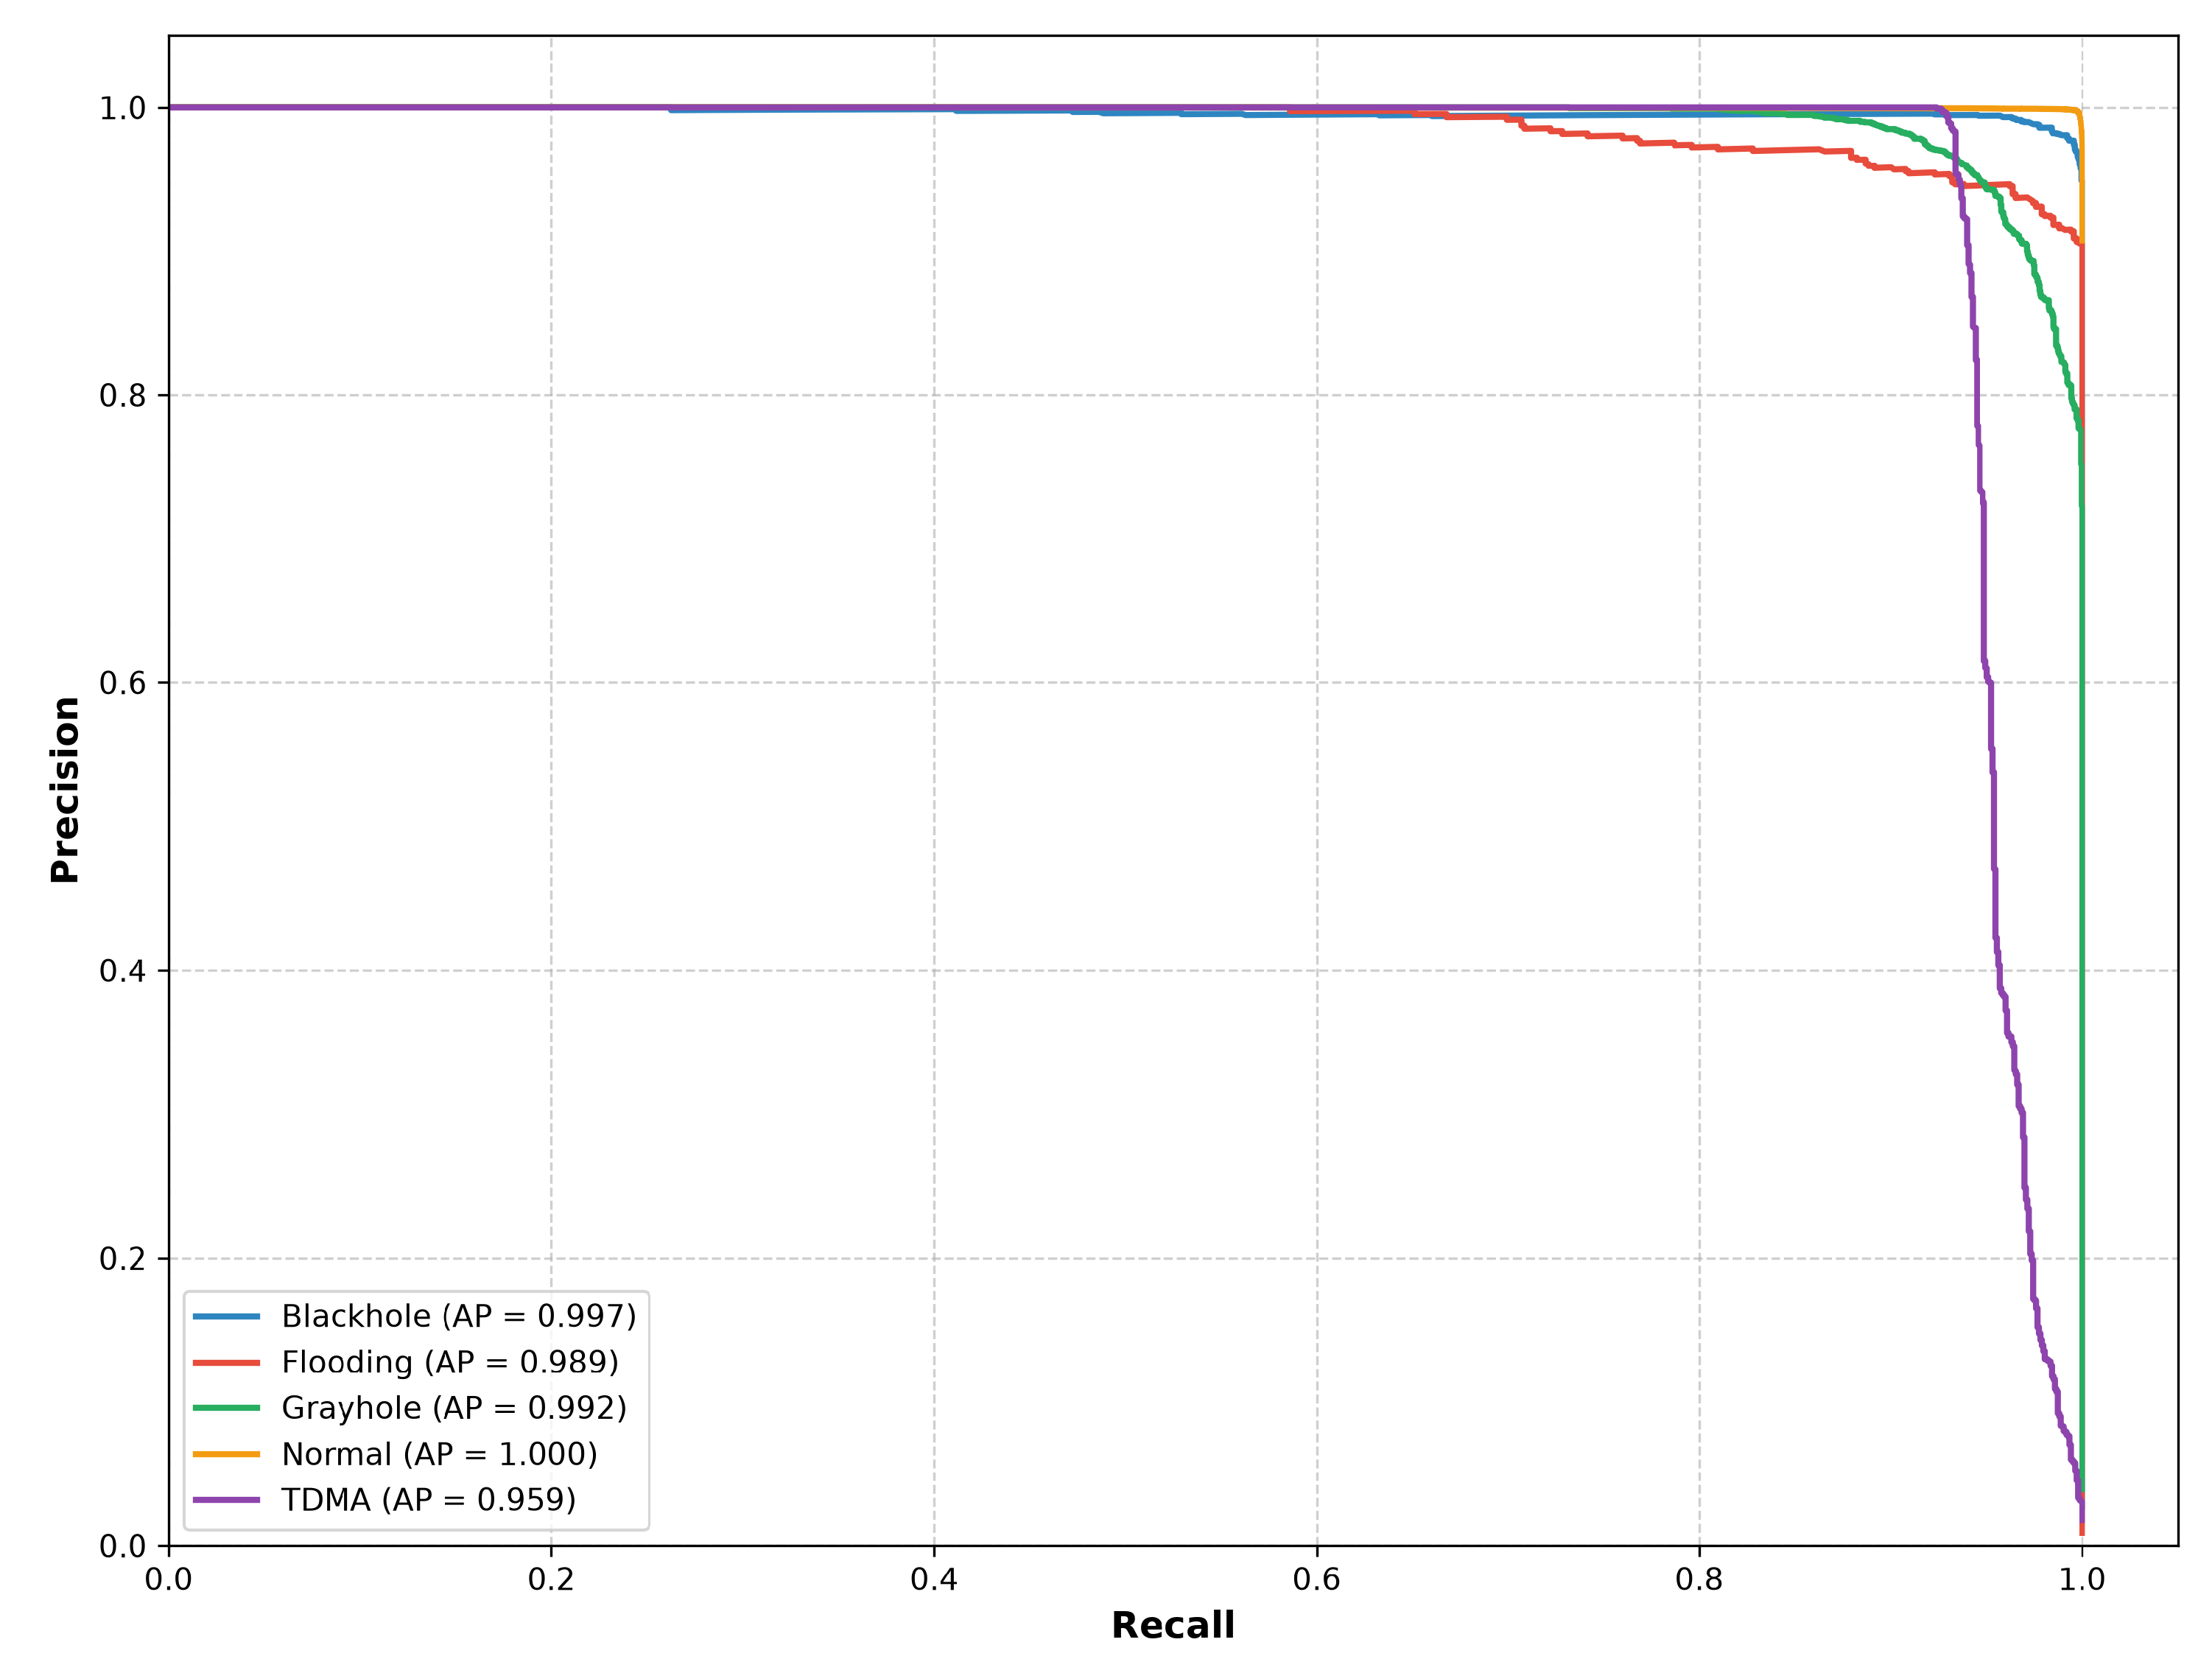
We also generated PR curves and Confusion Matrix to double check our model’s resistivity of unbalanced class problem. PR curves in Figure 7 display high AP(>0.95), even for the minority Flooding class, proving that balancing class weights did stop model from ignoring rare attacks.
The confusion matrix in Figure 6 illustrates that the model is having perfect recall of Flooding and Blackhole attacks but is sometime classifying a more complex normal graph as Grayhole and TDMA attack. From a WSN point of view this conservatist is preferred, since the cost for False Positive (temporarily isolating a node for investigation) is a lot less than False Negative (allowing grayhole to consume battery powers).
Figure 7.
Precision-recall curves for FlowerSec-IDS (Top-8) model. The high average precision values achieved over both minority classes support my claim for robustness of my FlowerSec-IDS model over the problem of class imbalance.
Figure 7.
Precision-recall curves for FlowerSec-IDS (Top-8) model. The high average precision values achieved over both minority classes support my claim for robustness of my FlowerSec-IDS model over the problem of class imbalance.
6.6. Energy Consumption Estimation
Now let us compute the effect of sub millisecond latency in terms of cost of energy/inference for a standard microcontroller [20] at WSN Cluster Head (e.g., ESP32 Microcontroller). CPU (active) = 80mA 3.3V, So Power (P) = 3.3x0.080=0.264W. Now Energy is defined by PxT. In the case of, FlowerSec-IDS, E = 0.264x0.0000066 = 1.74 µJ (approximately). Thus, a Seed node will consume < 1.74 mW for security purposes whereas it parses 1000 Packets/sec. Thus the overhead of FlowerSec-IDS is less significant and hence it remains deployable in Layer 2 (On Demand) and 3 (Sleeping) paradigms.
The energy estimates are all well, but to know the exact computational overhead for using the FlowerSec-IDS model we profiled resource usage (this was done during evaluation with the 80/20 train/test split). Profiling during the inference stage over the 74,933 test packets the total host memory was seen to peak at 163.47 MB; this includes the Python interpreter instance, actual data and dependency caches and libraries, however working memory consumed (RAM Delta) during test pass for inference came in at a meagre 4.17MB! Hence, resource overheads, as far as memory and compute goes, for adopting and using FlowerSec are next to nothing.
The gradient-boosting library transparently utilized multi-threading with 4 CPU cores during the batch evaluation and finished evaluation on the whole test set in 0.527s, which is 0.0070ms per packet in average inference latency. Multicore parallelism accelerates batch processing on a typical server, but Seed nodes in FlowerSec’s architecture are low-power microcontrollers without additional parallelism resources. Serialized model takes 1.7 MB flash space on ESP32, as the architecture gets mapped onto the limited-resource setting of an ESP32. What is more, it continues to achieve sub-millisecond inference latencies with 0.0066ms per packet. This latency takes up 1.74 µJ. This study did not provide any test bed for this purpose so please treat this work carefully as mere estimations, also it is an interesting topic reserved for feature research to actually deploy the model on top of ESP32 and measure it again. It did make a point about its negligible cost in memory and power. The above figures prove that Top-8 feature model’s resource consumption falls within the extreme hardware constraints of battery-powered sensors.
6.7. Cross Dataset Methodological Validation
This means FlowerSec is not restricted to one type of dataset but its artifacts; I have applied what FlowerSec has taught, using lightgbm with SHAP as the feature selection step onto the SensorNetGuard only to again arrive at a distinct minimal features set, different than of course from WSN-FD (e.g. Data_Throughput, Error_Rate, Energy_Consumption_Rate).
The previously Top-8 Model achieved a Macro F1-score of 0.9973 with a Training Time of 0.06 seconds only. The implications are key and prove to FlowerSec is not hardcoded but a guide to carry out a robust, solution oriented towards multiple problems than one simulation as presented earlier. These results also indicate towards the ability of the FlowerSec pipeline to accommodate itself to different shapes and sizes of WSN feature spaces than being hardcoded to a single simulation using multiple independent benchmark tests.
6.8. Robustness to Sensor Degradation and Environmental Noise
Rough real world areas degrade WSN hardware, decrease battery voltage and increase electromagnetic waves; all of these causes noise in sensor readings; some selective, low importance feature in model would get confused when those specific features get disturbed. We conducted a noise injection analyze to study how well our method shrink data without broken. We added 5 to 30% of gaussian noise of the scale feature space into the test data set with standard robustness benchmarking protocols [21].
There are two findings shown in Figure 8: under noise free (0%) condition, the 16 feature model (all of the 16 original 16 feature of the dataset) wins it with a little margin (Macro F1: 0.9667 vrs 0.9494). Once noise is introduced, it is reversed. Top 8 wins and always stays ahead of 16-feature model, by about 6 to 7 Macro F1 points no matter how much amount of noise added to the data. Both at noise amount 5% (0.5215 vrs 0.4605) or 30% (0.5189 vrs 0.4496). This reversal and gain by Top 8 suggest that the features abandoned by SHAP has actually not much importance. They are pure active distractors by confuse them with noise (instead of helping if not perturbed). While Top8 stays ’clean’, only by relying on features that contains signal.
Although both decay on an absolute scale dramatically when under noise, this in this worst-case stress test is to be expected. As applied without noise-aware retraining, the noise applied is directly across the scaled feature space and so even on logical features such as Is_CH. This does illustrate the direction of further work, though, using noise-robust training as through noise injection, as it is expected that whilst the absolute robustness floor in both will increase, the advantage of the reduced feature set (relative performance in error rates) should be maintained.
6.9. Network Lifetime and Tiered ML Energy Analysis
Although in theory the energy cost of 1 inference is only be 1.74 µJ, the flowerSec works off a tiered ML activation and is in practise more efficient than calculating every inference all the time. To put numbers to this we modelled 1,000 node network in a high traffic scenario (100 packets/second) for over 600 days. Assuming that the typical 2000 mAh Li ion battery has roughly 26,640 J and it cost roughly 50 J per day of just sensing and routing.
A comparison between the conventional “Flat” network, featuring 1,000 nodes where the IDS consistently processes 100% of traffic and our three-tiered FlowerSec approach where Layer 1 (200 Seeds) processes 100% of traffic, Layer 2 (300 Seeds) processes 15% and Layer 3 (500 Seeds) only runs an ML on 1% of the data. Figure 9 shows a striking contrast in network survival. The conventional flat network experiences a catastrophic failure of all 1,000 nodes simultaneously at day 410. Instead, FlowerSec exhibits graceful degradation: when the Layer 1 Seeds exhaust their batteries at the same 410 day mark, the remaining 800 Layer 2 and Layer 3 nodes maintain operation, with the 300 Layer 2 nodes continuing until day 510, and, lastly, the Layer 3 nodes (500 of them) enduring until day 531.
Being deployed over 121 days after beyond baseline the point of failure of the flat network, the multi-layer solution validates the energy optimisation goals of the overall design, retaining some coverage and routing within what would otherwise be a dead coverage area for a further two to six months dependent on deployment location and energy source.
6.10. The Dual-Engine Detection Core: Confidence-Gated Escalation for Zero-Day Threats
Typically, a network administrator will not have a dataset of thousands of correctly labelled examples to train their network on with each new type of attack that comes out onto the internet. To test that FlowerSec would function against a brand new type of zero day attack, we tried adding a ’fallback’ model, built around an unsupervised deep learning system an AutoEncoder neural network [22,23]. We trained the AutoEncoder to expect normal traffic only, by feeding normal traffic from the training set only. When the Autoencoder was presented with malicious traffic for test-set, it simply could not learn to correctly rebuild and output the traffic, so its reconstruction score became large.
Such results can be best described as striking. While for the normal test traffic, the mean reconstruction error was just 0.0454, for the malicious attacking traffic the mean reconstruction error rocketed up to 14.6228. This presents a separation of over 300 times between the normal and the attacking traffic samples. When comparing against a 95% threshold 0.1784 based on the normal reconstruction errors, the unsupervised model gave rise to a spectacular AUC of 0.9819. As shown in the Figure 10, both of these massive geometric differences show that the FlowerSec framework is well-adapted for detecting novel behavioural anomalies in environments without available or updated labelling systems trained on previous examples.
We used an implementation with a dual engine cascade and a confidence gateway for the deployment of AutoEncoder onto resource constrained Seed node. Instead of putting both models on every packet, traffic could first be tested against an supervised lightweight LightGBM. Traffic that was classified as normal with a low prediction confidence of below 0.90 is run against AutoEncoder to see it if AutoEncoder thinks the same. This gateway caused a hit on the second engine in 10.01% of the cases and successfully recovered some of most evasive attacks (81 to 77 while incurring increase of 734 to 1114 false positives).
It used next to no power as well, 0.08 µJ per packet. This proves support for hybrid decision engine is there, tuning it will prove to be a future research problem required for dynamic layer 2 activation on demand.
| Algorithm 1 Confidence-Gated Dual-Engine Cascade at the Seed Node |
|
6.11. Zero-Day Threat Simulation: Leave-One-Attack-Class-Out
As explained, some of the attack classes were reused from previous evaluation rounds and so the value of the AutoEncoder was not put to a practical test, remained more of a theoretical [24]. We then performed a sort of strict zero-day simulation, where the supervised engine was trained on normal traffic plus all four but only specific attack types and then exposed to a fifth completely different attack. Results from Figure 11 indicates that the unsupervised engine is really the module safeguarding the network from treats previously unidentifiable by the rest of methods.
Starting with the most extreme attack, flooding; while a supervised model that has never encountered flooding will only detect 0.8% of floating traffic and largely view it as legitimate, an AutoEncoder trained only on normal traffic will detect its first sample of previously unseen flooding with 96.4% recall as the reconstruction error varies so strongly from the normal manifold. The same is the case for greyhole where supervised recall stands at 41.4% against 89.9% while at this instance being topped by the AutoEncoder and for TDMA when the supervised achieves 82.6% while the AutoEncoder remains well above it at 93.4%. Meanwhile, since the supervised generalizes from the other packet dropping attacks, blackhole is detected by the stronger cascade with an 89.4% recall - yet the AutoEncoder still trumps it by being essentially perfect with 100.0%. In all of these cases the stronger side thus enters the confidence gated cascade and, the FRR remaining at 5% budget dictated by the threshold, achieves 100.0%, 96.4%, 90.1% and 93.4% respectively.
In Figure 11, the star on each curve identifies the operating point at the threshold determined on reconstruction errors of the normal training data, i.e. 95th percentile of normal reconstruction errors. When operating, Seed does not use this threshold forever, but periodically retrains it. It slides a window on the traffic that the router checked to be normal and retrains threshold that matches the agreed budget of false positives such as 5%. The secondary engine automatically responds to drifting in the normal traffic, it needs no attack label and this is the property which a 0-day defense must have.
6.12. Federated Learning Validation of the Multi-Seed Backbone
To establish an initial baseline and with a goal for corroborating the collaborative backbone underlying the multi-Flower topology [25], a five-node federated learning environment was set up with a federated averaging protocol and expanded to heterogeneous environments [26]. The data was split with Dirichlet 0.5 - leading to strongly non-IID conditions - with one Seed having over 259,000 normal samples while another having less than 1,500. Model weights were swapped; no raw traffic left Seeds at all. Since ensembles cannot be averaged by weights, a small neural surrogate was employed for these rounds instead where novel federate boosting variants for LightGBM are an open direction.
This was despite the fact that their local heterogeneity varies drastically. Gradually the global model did improve its classification performance in cross-rounds of communications, giving a Macro F1-score rising through five stages from 0.6248 (round one) 0.8096 (round five), about 93% accuracy of center trained accuracy! The model was still rising at round five, so it could achieve better scores if given more rounds as shown in Figure 12.
We want to stress that this simulation is purely a bridge to a future work and not a contribution: it verifies the communication and privacy backbone of the multy Flower topology, but the real detection engine is SHAP-optimized LightGBM model being executed at each Seed.
6.13. Comparison with State of the Art
To contextualize the performance of FlowerSec IDS, Table 3 compares our results with recent prominent studies utilizing the WSN DS benchmark.
As depicted in Table 3, some ensemble methods do achieve slightly higher raw accuracy by making use of all 19 features, with cost to computational overhead and black box opacity. The FlowerSec IDS willingly takes a 1.15 percentage point cut from highest performing ensemble (99.99%) to 98.84% accuracy in exchange for a 50% feature dimension reduction and the SHAP driven explainability. Furthermore, to the best of our knowledge, the proposed FlowerSec IDS is the only such framework which has been evaluated specifically for sub millisecond deployment on a Cluster Head at resource constraint layer, bridging theory of ML models with practical WSN architectural challenges. FlowerSec-IDS has thus proven through the above analysis the validity and practical relevance of a layered and self-aware approach for WSNs under constrained resource environment.
6.14. Critical Analysis of Adversarial and Collaborative Dynamics
We have conducted some experience to evaluated the behaviour of the flowerSec with two special cases which is advance adversarial Evasion, multi seed collaborative consensus. We can see both the stability of machine learning in this cases as well as limit of FlowerSec physical architecture. Firstly, a deliberate attacker attempts to evasion by slightly perturb the features of the network traffic. We applies a same magnitude 5% to 20% relative perturbation to the numerical features of the known malicious samples. Both full 16 features model and lightweight Top 8 models hold incredible stable. When reaching higher perturbation of the feature vector, the rate of evasion keep is zero (<1%), the highest evasion rate is observed at 0.87% on percentage of 15 and above. This is indicates that the boundaries learned by the LightGBM models on WSN topology is stable therefore the attacker could not subtle modify his behaviour and bypass the decision of intrusion detection. Secondly, simulation of multi seed collaborative consensus protocol of flower Sec architecture where seed with low prediction confidence can query neighbouring’s seeds for their prediction. It is noted that the architecture allows Seed collaboration under the condition that a seed with low confidence during a detection (where the sum of the probabilities is near zero) can send the features of the detected traffic to other surrounding seeds and use neighbouring seeds for decision making. An interesting constraint of the current deployment was encountered, the default averaging system results in a higher uncertainty lower when subjected to the locally noisy environment. The number of False Positive went from of the single seed model 734 to 1505 within the consensus model and cause the Macro F1 drop from 0.9494 down to 0.9163 at the threshold 0.199. Due a lack of filtering out any noise within probability average the surrounding’s lightgbm model, it can pass a borderline between normal and attacked traffic as a form of attack. The result is crucial constraint of the flowersec as currently it is not capable of effective collaboration with probability average when noise is encountered. FlowerSec in the future needs to carry out noise filtering or majority only voting within the consensus protocol than an average based collaboration if it want to benefit for multi flower topology without compromising low False Positive rate of the flower itself.
6.15. Deep Learning Baseline and Latent Space Analysis
To justify that the selection of tree based model for the resource constrained Seed node is a realistic one, we deployed FlowerSec IDS and a GPU accelerated 1D Convolutional Neural Network (1D CNN) [28] and measured their relative inference time and energy for packet inspection. The use of Deep Learning models is an increasingly popular technique in Edge computing, however it comes with steep hardware cost. In the bubble chart in Figure 13, we train a 1D, single layer, single filter CNN on Top 8 feature set. We show inference time vs energy per packet in a bubble chart in Figure. 1D CNN takes orders of magnitude more time and energy to inference per packet, compared to LightGBM. A NN model on an edge GPU consuming ∼5 watts takes large energy and memory usage in MB compared to KB for the tree - based model. This mathematically justifies the design to use simple yet accurate gradient boosting at the Seed node, offloading heavier deep learning workload tasks to Base Station which has no resource constraints.
For additional visual proof of SHAP”s correctly selected High 8 features isolating malicious behavior, the test data high dimensional vectors were non-linearly projected to a two-dimensional domain using the popular tool of t-stochastic neighbor embedding (t-SNE) [29]. Figure 14 shows the 8 selected features separate the network traffic into distinct and tightly-packed clusters. Normal traffic converges into dense central core while Blackhole, Grayhole, Flooding and Scheduling attacks were pushed into cleanly-separated peripheries. Such clean separation indicates why even a basic Decision Tree could classify the traffic with such high accuracy and low latency; because the features can be readily linearly (or almost) separated without the need for extensive non-linear deep learning transformations.
6.16. Targeted Adversarial Evasion and Defense Implications
To stress test FlowerSec-IDS against a realistic and intelligent adversary, we launched the Hop-Skip-Jump black-box attack[30] against 100 targeted malicious samples. This decision-based attack[31] repeatedly queries the model’s labels and walks along the decision boundary to find the cheapest perturbation that flips an attack into the normal class. The attack succeeded in evading detection in 80 of the 100 cases, with a median L2 perturbation distance of 2.764 and a mean of 3.888, as shown in Figure 15.
To put FlowerSec-IDS in a more critical and realistic defense, Hop-Skip-Jump was conducted to attack FlowerSec-IDS using the 100 malicious samples targeted [30]. This was a decision based attack [31] where the model’s labels will be queried to "walk" along the decision boundary and look for the cheap perturbation to flip the attack into normal class. With the median L2 perturbation distance of 2.764 and mean of 3.888 as shown in Figure 15, 80 cases managed to evade detection. Further inspecting on this figures, several interesting observations are made. The Grayhold attack was accounted for 40 of these successful attacks while the Blackhole for 30 and none was found for Flooding. The volumetric features of flooding attack are hard to hide unless the attack stops. The second point is of the median L2 distance of 2.764 indicates significant increase during evasion thus degrading the effectiveness of the evasion. Hence it can be concluded that during the evasion there is potency for attack. This information will not be discouraging but a valuable piece of evidence to verify the boundaries that a single supervised model can guarantee and to verify FlowersSec is justified to adopt a layered defence approach. The perturbed normal sample that transgresses the LightsBGM decision boundary and becomes attack will still be statistically anomalous traffic. This leads into the unsupervised AutoEncoder acts as a secondary opinion that does not utilise the same decision boundaries. Combining the supervised detector and reconstruction error monitor, along with adversarial training, multi seed consensus, forms the defense plan moving forward with our project.
We further carried out adversarial training by generating 181 Hop Skip Jump adversarial examples on the training set [32] and adding them to training set with its true labels, so that we can test if the model could be tested against these targeted attacks which uses decision-based attack using the boundary instead of attacking it based on input or output like it used to. The hardened model did not suffer from catastrophic forgetting and preserved its performance over clean set well (Macro f1 decreases slightly, from 0.9494 to 0.9470). When re-evaluated with the test data with Hop Skip Jump attack on, surprisingly, its evasion rate only decreased from 82 out of 100 on the model previously did not take adversarial training to 76 on the one which did. This result is perfectly in line with existing literature and that also confirms tree ensembles are susceptible to boundary searching attacks [33]. The HopSkipJump is an adaptive, decision based blackbox attack that queries new models with samples to reconstruct the boundaries it used in decision making, meaning that, if we harden the boundary through adversarial training, an adaptive attacker simply queries the newly formed boundary in order to escape the model’s detection. This confirms the notion we mentioned in the report, that a fixed and hardened boundary provided by adversarial training is far from enough against adaptive boundary searching attacks on tree ensembles. This validates our idea that layering defense is probably a much more effective solution to evasion attacks than having one single hardened boundary. This also validates the importance of having the supervised detector work side by side together with our other module provided by the unsupervised AutoEncode to address traffic that is statistically anomalous which can slip past the decision boundary we had for our tree models.
7. Conclusion and Future Work
In this paper, we propose a novel AI enhanced WSN security framework, or FlowerSec. With a new developed topology called "Flower" that contains a central Seed node and at most four Leaf nodes. We establish a mathematically developed power efficient clustering system to naturally outline the security boundary for a following real-time IDS system.
The FlowerSec architecture has already practically proven itself as a powerful IDS with deployment of a lightweight, SHAP optimized LighGBM model on the Seed node for real-time intrusion detection. Experiment with WSN-DS has shown FlowerSec IDS model still maintained a Macro F1 score of 0.9494 on WSN-DS with only 8 key features while having inference latency as low as 0.0066ms and energy costs no more than 1.74 µ J. Cross dataset experiment with SensorNetGuard resulted in Macro F1 score 0.9973, again proving methodology adaptation on FlowerSec for WSN. Most importantly, that the leave-one-attack-class-out test shows supervised machine learning can only predict 0.8% of unseen flooding while unsupervised can achieve over 96.4%, showing that in the real world there are two types of attacks. It has provided a practical, fast, and most importantly cheap way to defend against both types of them under one roof and with the minimum overhead.
One area we have already mentioned is thermal and voltage drop effect - all energy calculations here remain careful projections based on host-level profiling; to measure actual effects, we will need to field test our deployments on the ESP32 (and other) µC platforms. Another area where greater clarity may be obtained is on federated convergence (if not FL training). Since tree ensembles cannot simply be weight-averaged, neural network models had to be used as a surrogate for our FL simulation. It is unclear where exact convergence properties of a federated LightGBM would tend. Lastly, the threshold used for detection in the AE method was based on a fixed value, determined from testing. There clearly will be some environments where normal traffic is non-stationary and it may be beneficial/necessary to dynamically recalibrate this threshold - for now the solution is only suitable for zero-day anomalies, whereas dynamic tuning makes the AE useful, as with our Supervised method, for day-to-day anomaly detection too. These issues neatly mark out the limitations of this project work and in doing so provide the roadmap for its future development. Whilst these findings clearly show the suitability of using advanced ML at the Edge it must be acknowledged that the presented work is only foundational. Moving forwards, to further develop the system into a more rounded solution we will:
- 1.
- Deploy the described components as a layered defense system as per the identified roadmap from our adversarial analysis, adding the Supervised system to the µAE in combination with multi seed consensus.
- 2.
- Extend the FL simulation for more communications rounds and use the FedProx algorithm to account for node-heterogeneity
- 3.
- Begin deployment on physical hardware platforms to obtain realistic energy measurements and show feasibility in a true IoT setting. This will also allow further modelling on the topic of thermal effects and the related issues with voltage-drop, thereby rounding out any remaining uncertainty in hardware effects.
Acknowledgments
The authors extend their appreciation to the Deanship of Scientific Research at Northern Border University, Arar, KSA, for funding this research work through the project number NBU-FFR-2026-1092-?????.
References
- Heinzelman, W.; Chandrakasan, A.; Balakrishnan, H. An application-specific protocol architecture for wireless micro sensor networks. IEEE Trans. Wirel. Commun. 2002, 1, 660–670. [Google Scholar] [CrossRef]
- Younis, O.; Fahmy, S. HEED: A hybrid, energy-efficient, distributed clustering approach for ad hoc sensor networks. IEEE Trans. Mob. Comput. 2004, 3, 366–379. [Google Scholar] [CrossRef]
- Lindsey, S.; Raghavendra, C.S. PEGASIS: Power-efficient gathering in sensor information systems. Proc. Proc. IEEE Aerosp. Conf. 2002, Vol. 3, 1125–1130. [Google Scholar] [CrossRef]
- Chen, J.; Zhang, Y.; Li, H. CREN-RLC: Clustering-Based Adaptive Security with Regression Learning for IoT-WSNs. IEEE Access 2025, 13, 112187–112206. [Google Scholar] [CrossRef]
- Niranjana, M.I.; Kumareshan, N. Energy-efficient secure routing in wireless sensor networks using fuzzy inference clustering and attention-based multi-scale deep learning. Sci. Rep. 2026, 16, 1–18. [Google Scholar] [CrossRef]
- Khraisat, A.; Gondal, I.; Vamplew, P.; Kamruzzaman, J. Anomaly intrusion detection systems: A comprehensive survey. Comput. Sci. Rev. 2019, 31, 21–40. [Google Scholar]
- Authors, M. Cluster-based wireless sensor network framework for denial-of-service attack detection based on variable selection ensemble machine learning algorithms. ScienceDirect 2024. [Google Scholar] [CrossRef]
- Authors, M. Enhanced Intrusion Detection in Wireless Sensor Networks: A Voting and Particle Swarm Optimization Approach. In Proceedings of the Proceedings of the IEEE International Conference, 2025. [Google Scholar] [CrossRef]
- Loughmari, M.; Affar, A.E. A lightweight machine learning approach for denial-of-service attacks detection in wireless sensor networks. Int. J. Electr. Comput. Eng. 2025, 15, 2089–2097. [Google Scholar] [CrossRef]
- Alamri, A.; et al. A Cross Layer Design and Flower Pollination Optimization Algorithm for Secured Energy Efficient Framework in Wireless Sensor Network. Wireless Personal Communications, 2020. [Google Scholar] [CrossRef]
- Lee, S.; et al. FLOWER: Federation with LOW inter-segment latency and Even Relay load. In Proceedings of the Proceedings of the IEEE International Conference on Communications (ICC), 2017. [Google Scholar] [CrossRef]
- Chen, T.; Guestrin, C. XGBoost: A scalable tree boosting system. In Proceedings of the Proceedings of the 22nd ACM SIGKDD International Conference on Knowledge Discovery and Data Mining, 2016; pp. 785–794. [Google Scholar]
- Ke, G.; Meng, Q.; Finley, T.; Wang, T.; Chen, W.; Ma, W.; Ye, Q.; Liu, T.Y. LightGBM: A highly efficient gradient boosting decision tree. In Proceedings of the Advances in neural information processing systems, 2017; Vol. 30. [Google Scholar]
- Lundberg, S.M.; Lee, S.I. A unified approach to interpreting model predictions. In Proceedings of the Advances in Neural Information Processing Systems, 2017; Vol. 30. [Google Scholar]
- Almomani, I.; Al-Kasasbeh, B.; Al-Akhras, M. WSN-DS: A dataset for intrusion detection systems in wireless sensor networks. J. Sens. 2016. [Google Scholar] [CrossRef]
- Sharafaldin, I.; Habibi Lashkari, A.; Ghorbani, A.A. Toward generating a new intrusion detection dataset and intrusion traffic characterization. Trans. Data Priv. 2018, 11, 109–137. [Google Scholar]
- Pedregosa, F.; Varoquaux, G.; Gramfort, A.; Michel, V.; Thirion, B.; Grisel, O.; Blondel, M.; Prettenhofer, P.; Weiss, R.; Dubourg, V.; et al. Scikit-learn: Machine learning in Python. J. Mach. Learn. Res. 2011, 12, 2825–2830. [Google Scholar]
- Kohavi, R.; et al. A study of cross-validation and bootstrap for accuracy estimation and model selection. Proc. Int. Jt. Conf. Artif. Intell. 1995, Vol. 14, 1137–1143. [Google Scholar]
- McNemar, Q. Note on the sampling error of the difference between correlated proportions or percentages. Psychometrika 1947, 12, 153–157. [Google Scholar] [CrossRef]
- Espressif Systems. ESP32 Datasheet; Espressif Systems: Shanghai, China, 2024. [Google Scholar]
- Hendrycks, D.; Dietterich, T. Benchmarking neural network robustness to common corruptions and perturbations. In Proceedings of the International Conference on Learning Representations, 2019. [Google Scholar]
- Sakurada, M.; Yairi, T. Anomaly detection using autoencoders with nonlinear dimensionality reduction. In Proceedings of the Proceedings of the MLSDA 2014 2nd workshop on machine learning for sensory data analysis, 2014; pp. 1–8. [Google Scholar]
- Chalapathy, R.; Chawla, S. Deep learning for anomaly detection: A review. ACM Comput. Surv. 2021, 54, 1–38. [Google Scholar] [CrossRef]
- Geng, Y.; Zhang, X.; Li, X. Recent advances in anomaly detection. In Proceedings of the 2021 IEEE 33rd International Conference on Tools with Artificial Intelligence (ICTAI); IEEE, 2021; pp. 1094–1101. [Google Scholar]
- McMahan, B.; Moore, E.; Ramage, D.; Hampson, S.; Arcas, B.A.y. Communication-efficient learning of deep networks from decentralized data. In Proceedings of the Artificial Intelligence and Statistics, 2017; pp. 1273–1282. [Google Scholar]
- Li, T.; Sahu, A.K.; Zaheer, M.; Sanjabi, M.; Talwalkar, A.; Smith, V. Federated optimization in heterogeneous networks. Proc. Mach. Learn. Syst. 2020, 2, 429–450. [Google Scholar]
- Almomani, I.; et al. Enhanced Intrusion Detection in Wireless Sensor Networks: A Voting and Particle Swarm Optimization Approach. In Proceedings of the Proceedings of the IEEE International Conference, 2025. [Google Scholar]
- Kiranyaz, S.; Avci, O.; Abdeljaber, O.; Ince, T.; Gabbouj, M.; Inman, D.J. 1D convolutional neural networks and applications: A survey. Mech. Syst. Signal Process. 2021, 151, 107398. [Google Scholar] [CrossRef]
- van der Maaten, L.; Hinton, G. Visualizing data using t-SNE. J. Mach. Learn. Res. 2008, 9, 2579–2605. [Google Scholar] [CrossRef]
- Chen, J.; Jordan, M.I.; Wainwright, M.J. HopSkipJumpAttack: A query-efficient decision-based attack. In Proceedings of the 2020 IEEE Symposium on Security and Privacy (SP); IEEE, 2020; pp. 1277–1294. [Google Scholar]
- Biggio, B.; Roli, F. Wild patterns: Ten years after the rise of adversarial machine learning. Pattern Recognit. 2018, 84, 317–331. [Google Scholar] [CrossRef]
- Goodfellow, I.J.; Shlens, J.; Szegedy, C. Explaining and harnessing adversarial examples. arXiv 2014, arXiv:1412.6572. [Google Scholar]
- Kantchelian, A.; Tygar, J.; Joseph, A.D. Evasion and hardening of tree ensemble models. In Proceedings of the International conference on machine learning. PMLR, 2016; pp. 2387–2396. [Google Scholar]
Figure 1.
FlowerSec Architecture - Basic Building Block. The Flower organizes sensor nodes into a central Seed (Cluster Head) and up to four Leaf member nodes. The Trust Zone/Security Domain defines the security perimeter, with bidirectional communication links enabling data reporting and command dissemination.
Figure 1.
FlowerSec Architecture - Basic Building Block. The Flower organizes sensor nodes into a central Seed (Cluster Head) and up to four Leaf member nodes. The Trust Zone/Security Domain defines the security perimeter, with bidirectional communication links enabling data reporting and command dissemination.
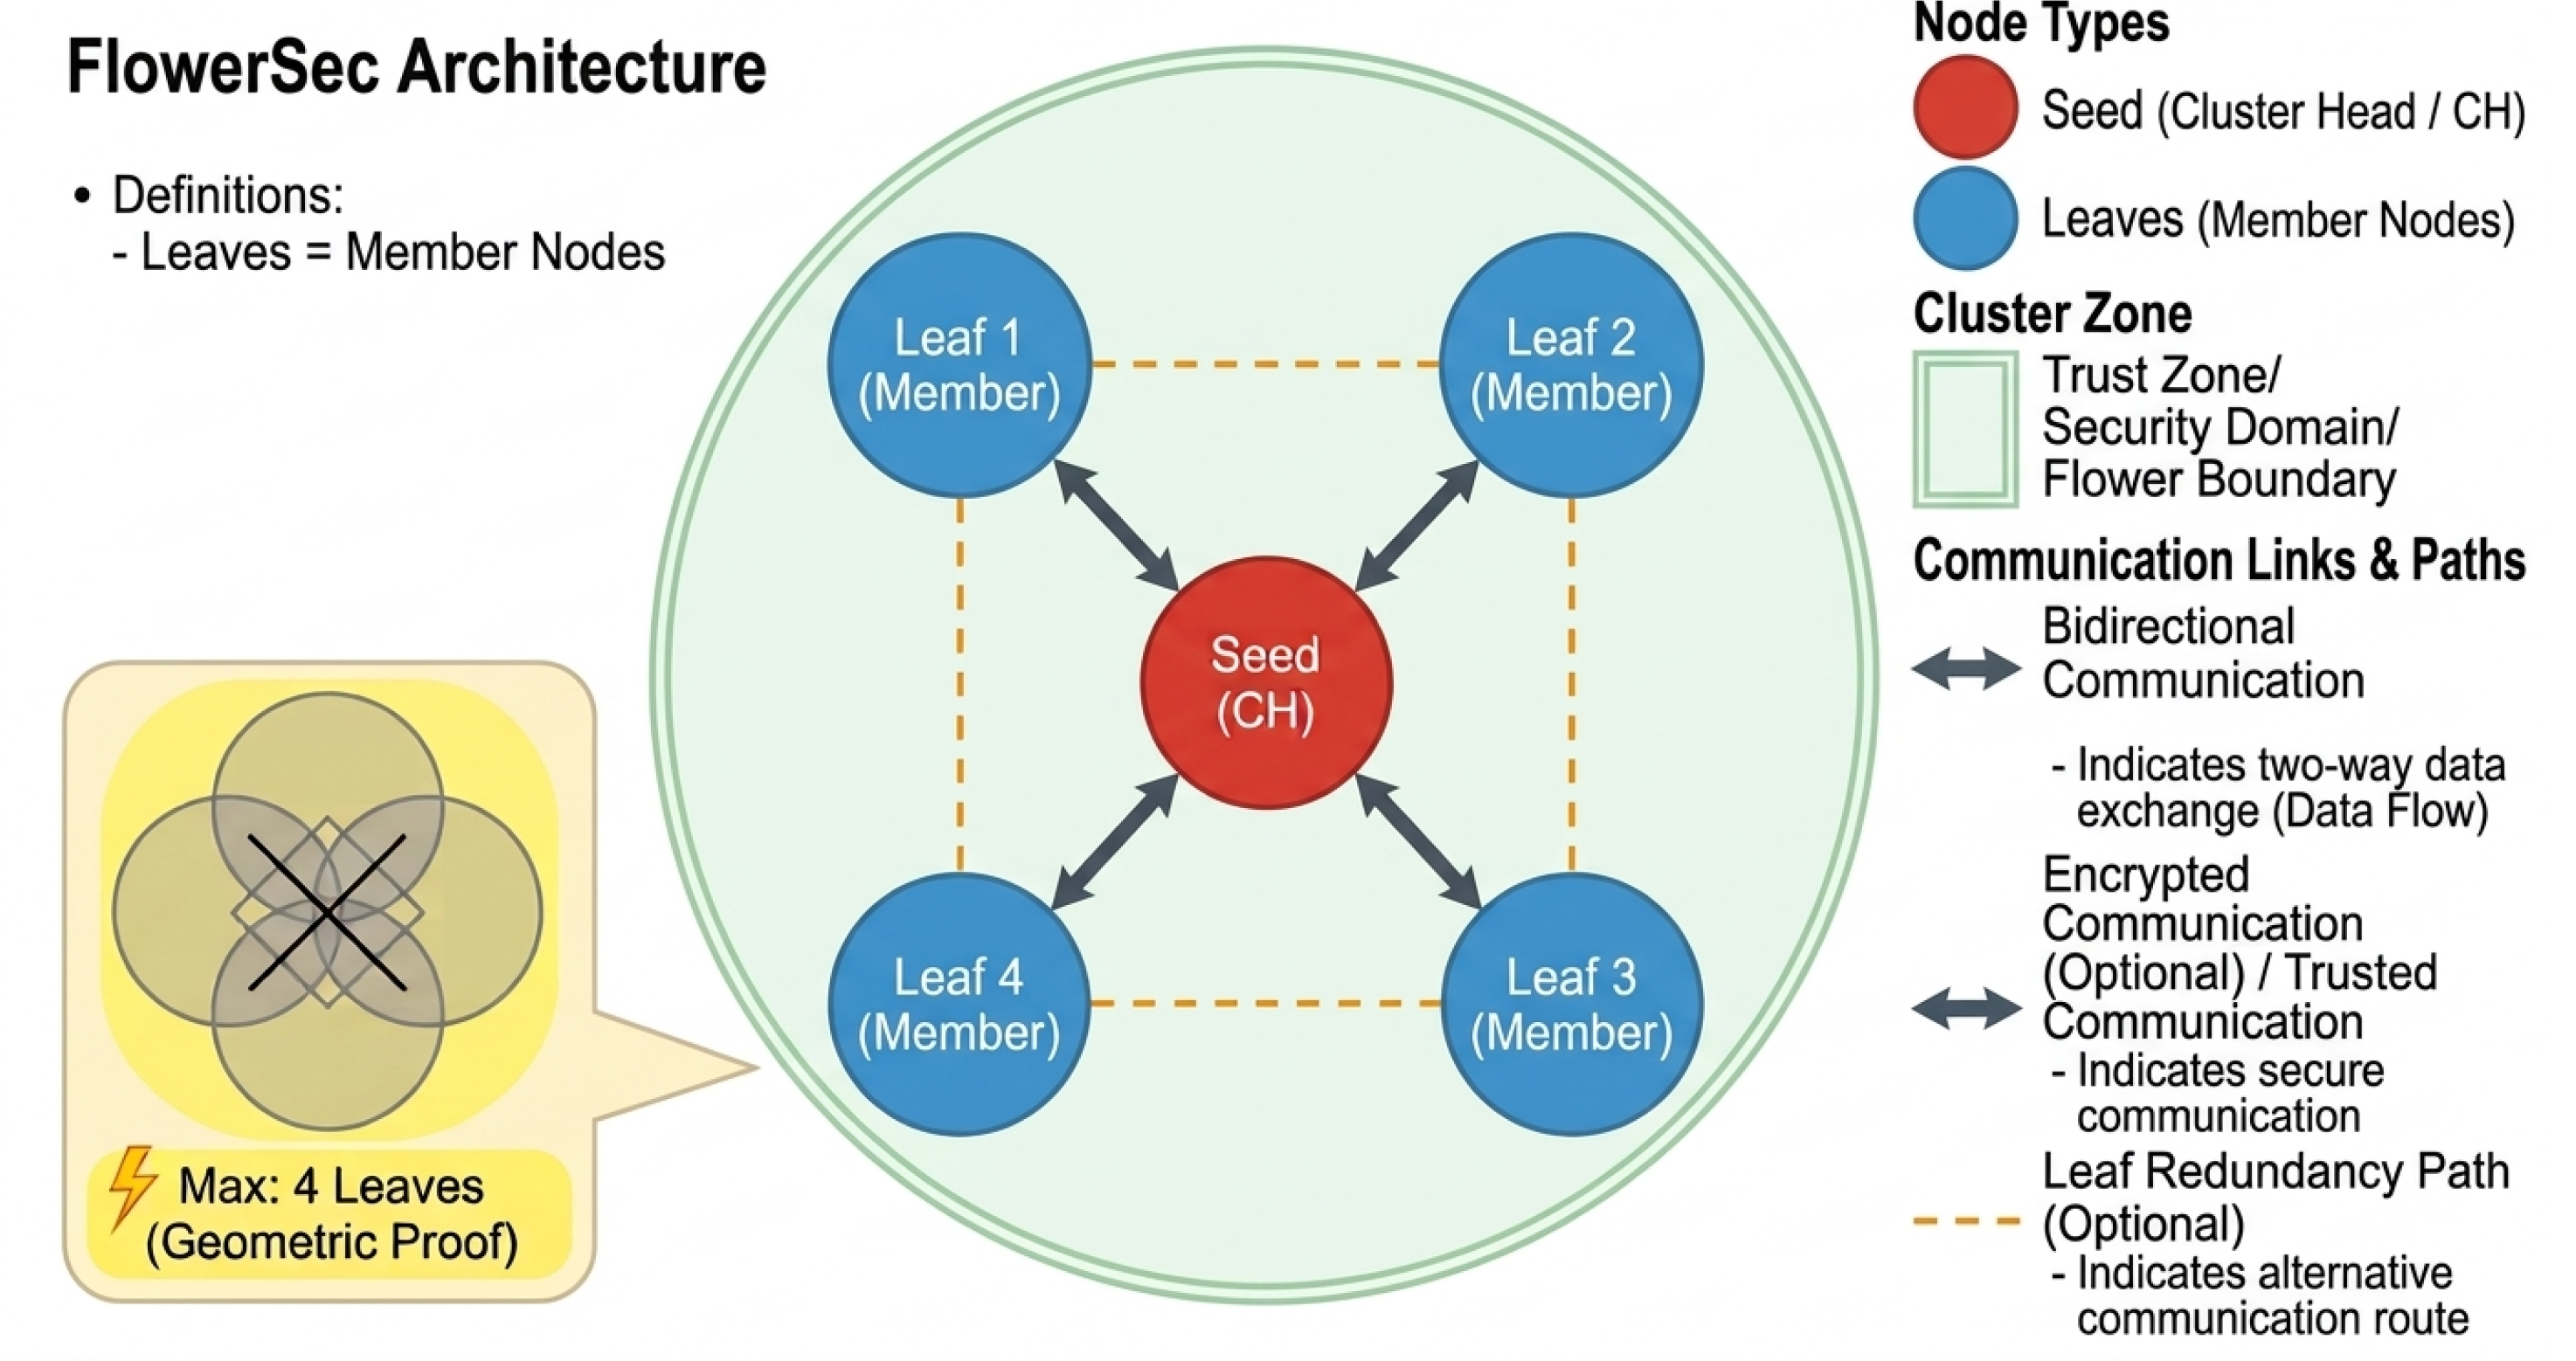
Figure 2.
Multi Flower Layer formation - (multiple flowers join together by forming a security link / inter flower communication link to create a security boundary) seed act as cluster heads and manage flowers and link with other seeds for monitoring and coordinated security.
Figure 2.
Multi Flower Layer formation - (multiple flowers join together by forming a security link / inter flower communication link to create a security boundary) seed act as cluster heads and manage flowers and link with other seeds for monitoring and coordinated security.
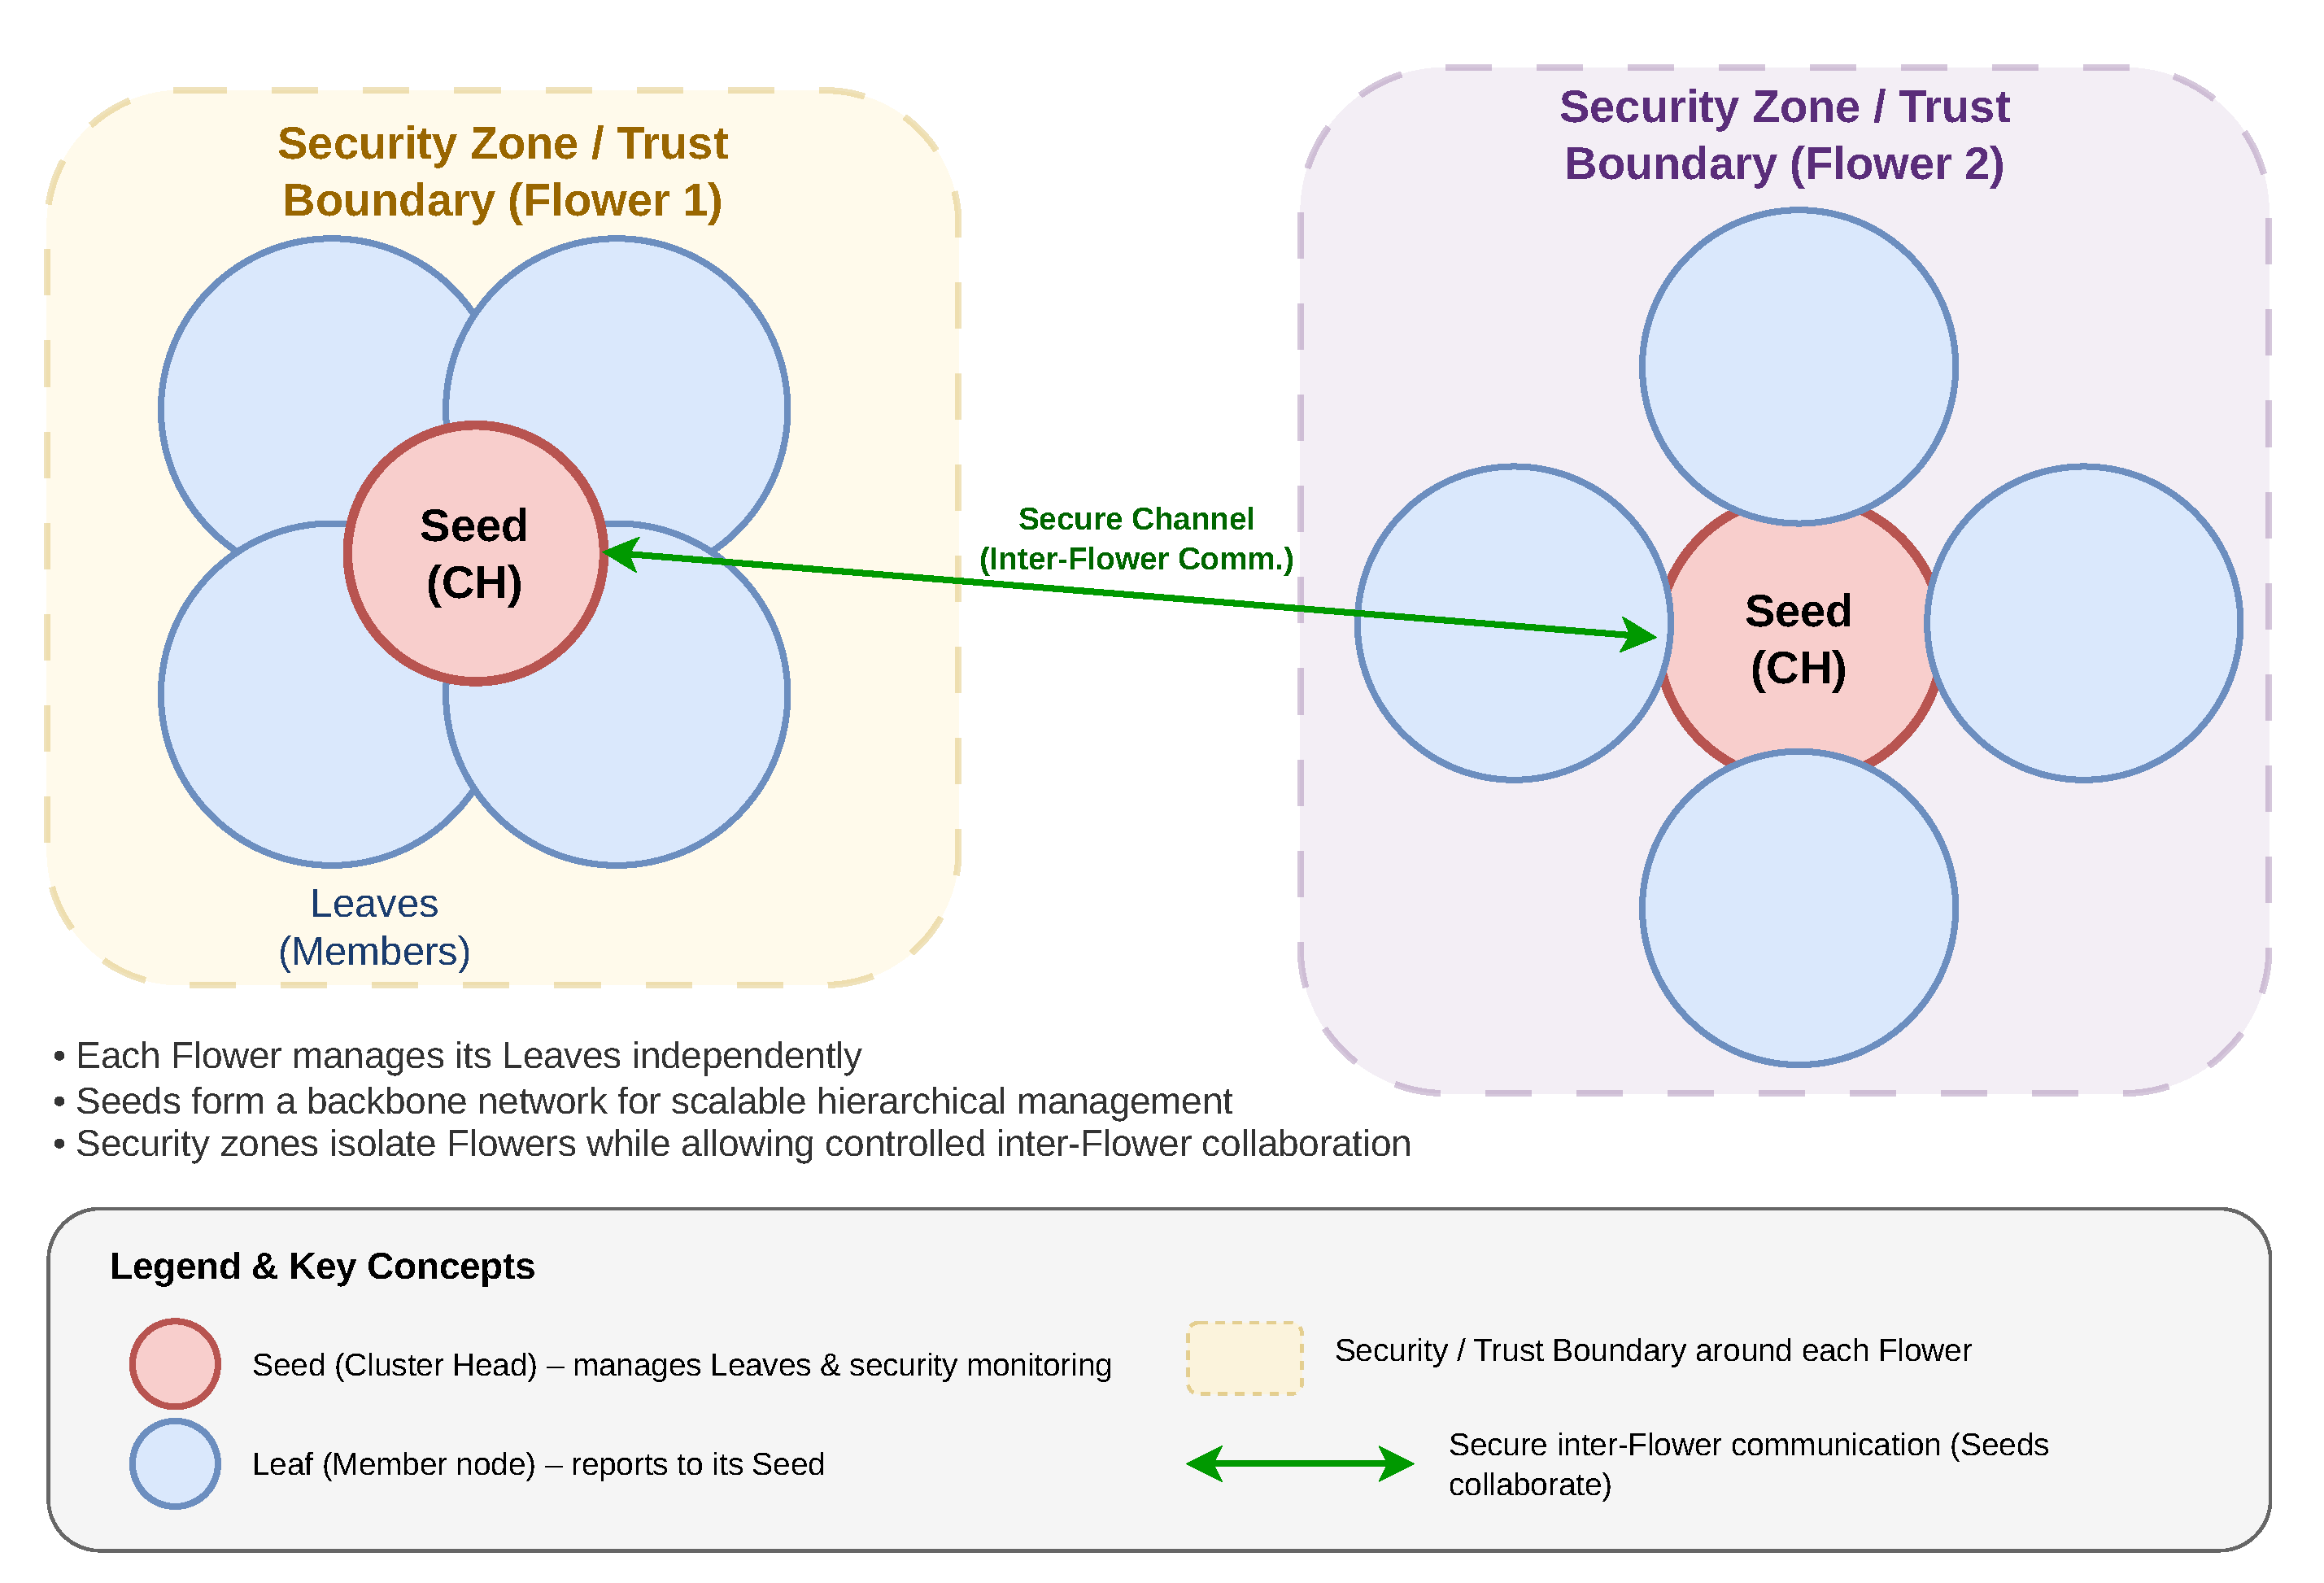
Figure 3.
FlowerSec MultiLayer Architecture includes differentiated Security, QoS & ML Optimization. Flowers are clustered on a hierarchical system based on different Security, QoS levels. While layer 1 is always active along with ML-based real-time protection, layer 2 only takes decisions on a demand basis while layer 3 goes to sleep mode and reduces energy to intelligently manage the available resources.
Figure 3.
FlowerSec MultiLayer Architecture includes differentiated Security, QoS & ML Optimization. Flowers are clustered on a hierarchical system based on different Security, QoS levels. While layer 1 is always active along with ML-based real-time protection, layer 2 only takes decisions on a demand basis while layer 3 goes to sleep mode and reduces energy to intelligently manage the available resources.
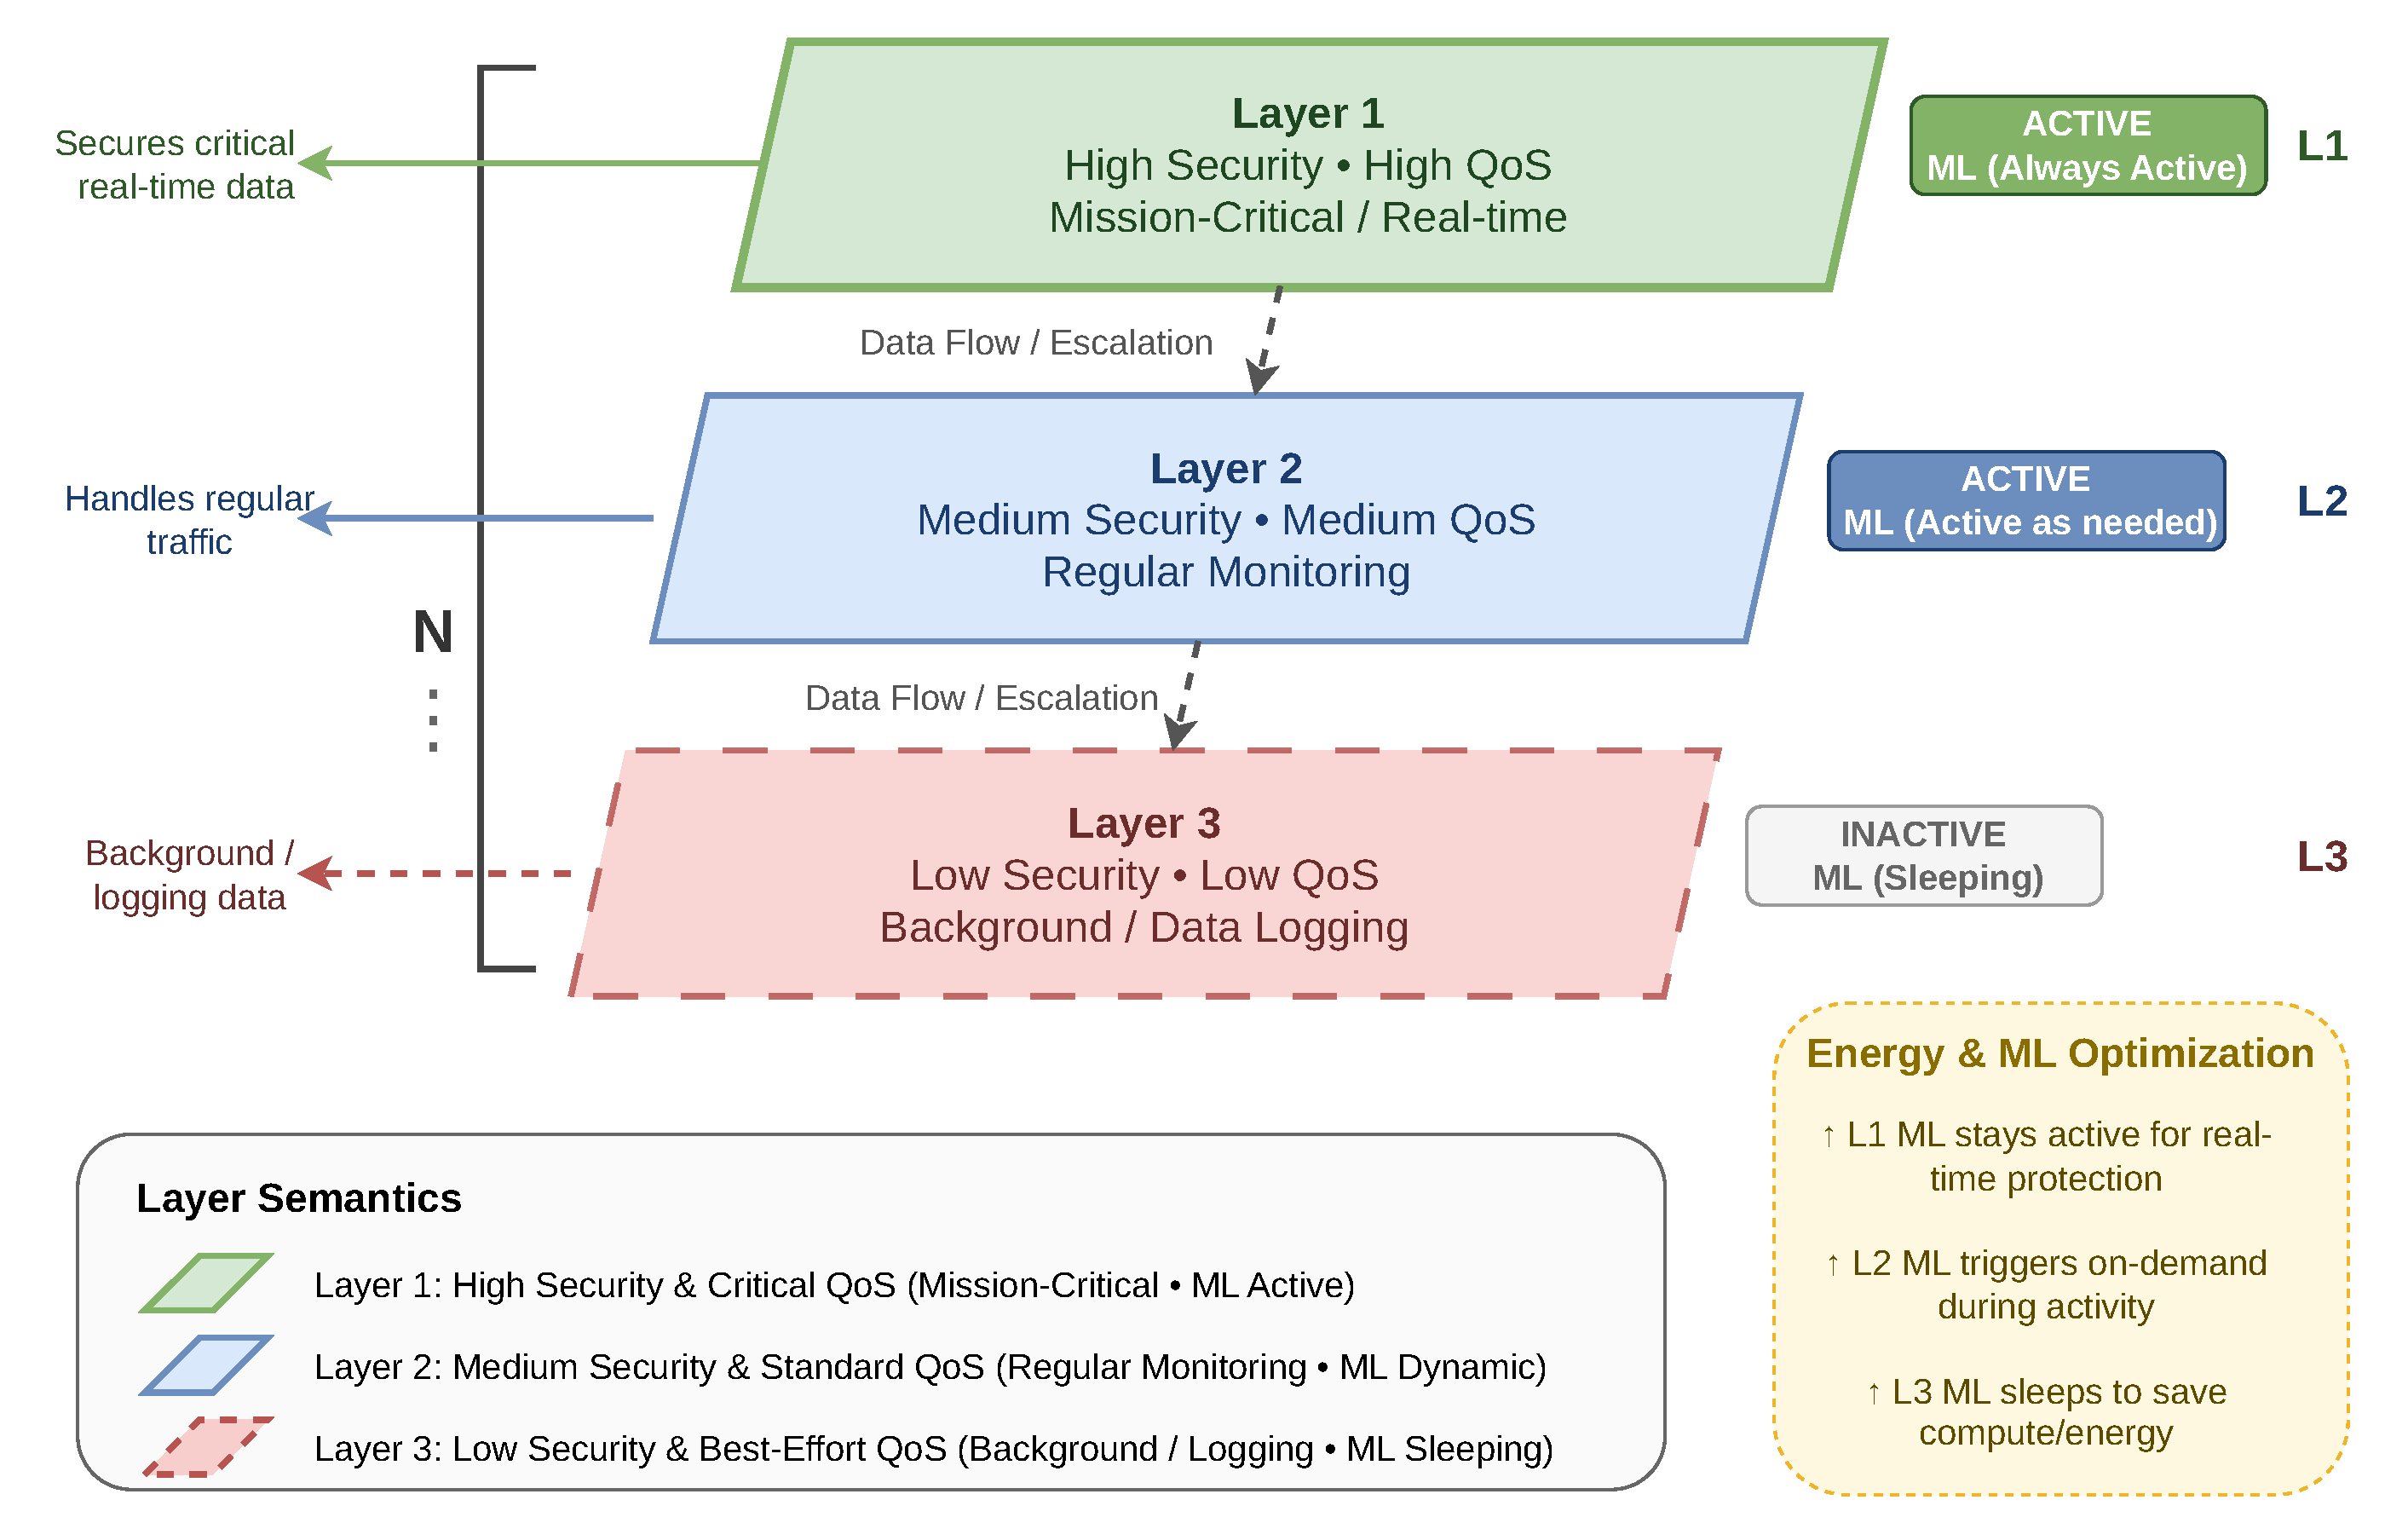
Figure 4.
FlowerSec Recovery Mechanisms. (A) Normal intra Flower routing within Trust Zone (B) Multi-layer recovery with alternative secure routing path under attack, layer 2 supporting layer 1 (C) Single-layer recovery through flower expansion, where leaves in tight cluster expand outward to maximize coverage area of layer (D) ML predicted self-healing where ML Predictive Model detects possible potential in failures and triggers pro-active local node recovery.
Figure 4.
FlowerSec Recovery Mechanisms. (A) Normal intra Flower routing within Trust Zone (B) Multi-layer recovery with alternative secure routing path under attack, layer 2 supporting layer 1 (C) Single-layer recovery through flower expansion, where leaves in tight cluster expand outward to maximize coverage area of layer (D) ML predicted self-healing where ML Predictive Model detects possible potential in failures and triggers pro-active local node recovery.
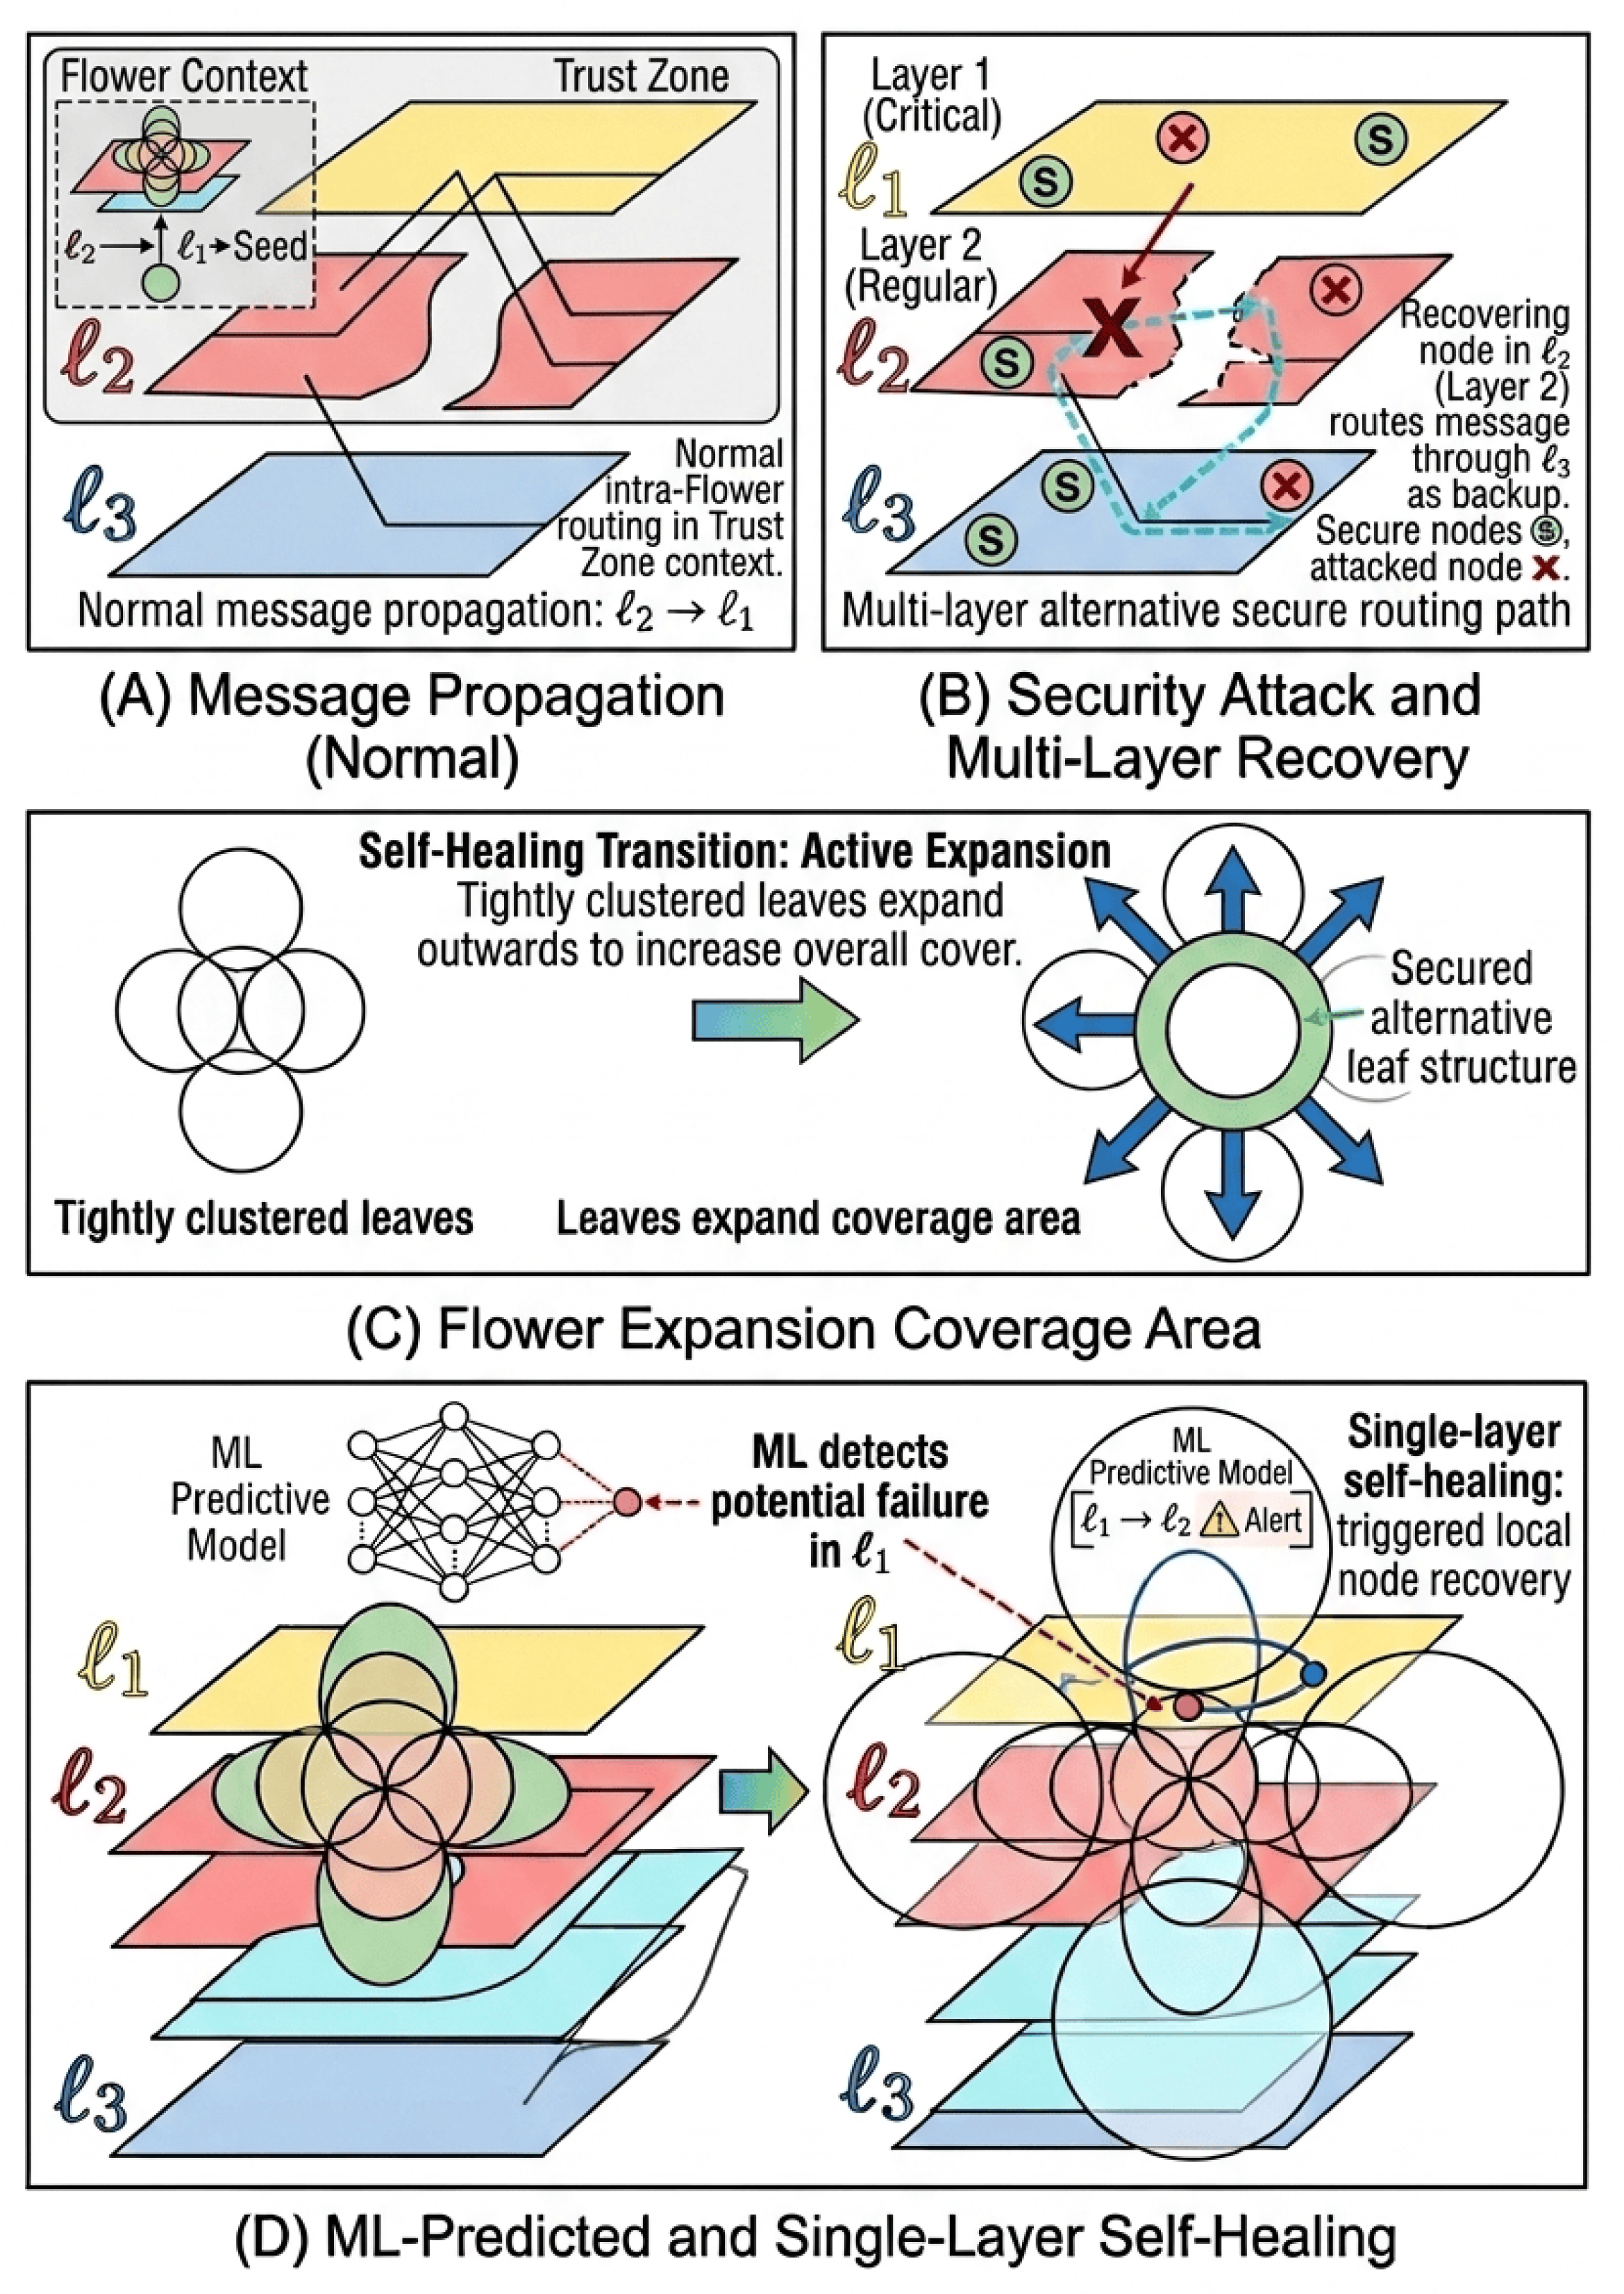
Figure 6.
Confusion Matrix of the FlowerSec-IDS (Top-8) Model on the WSN-DS Test Set.
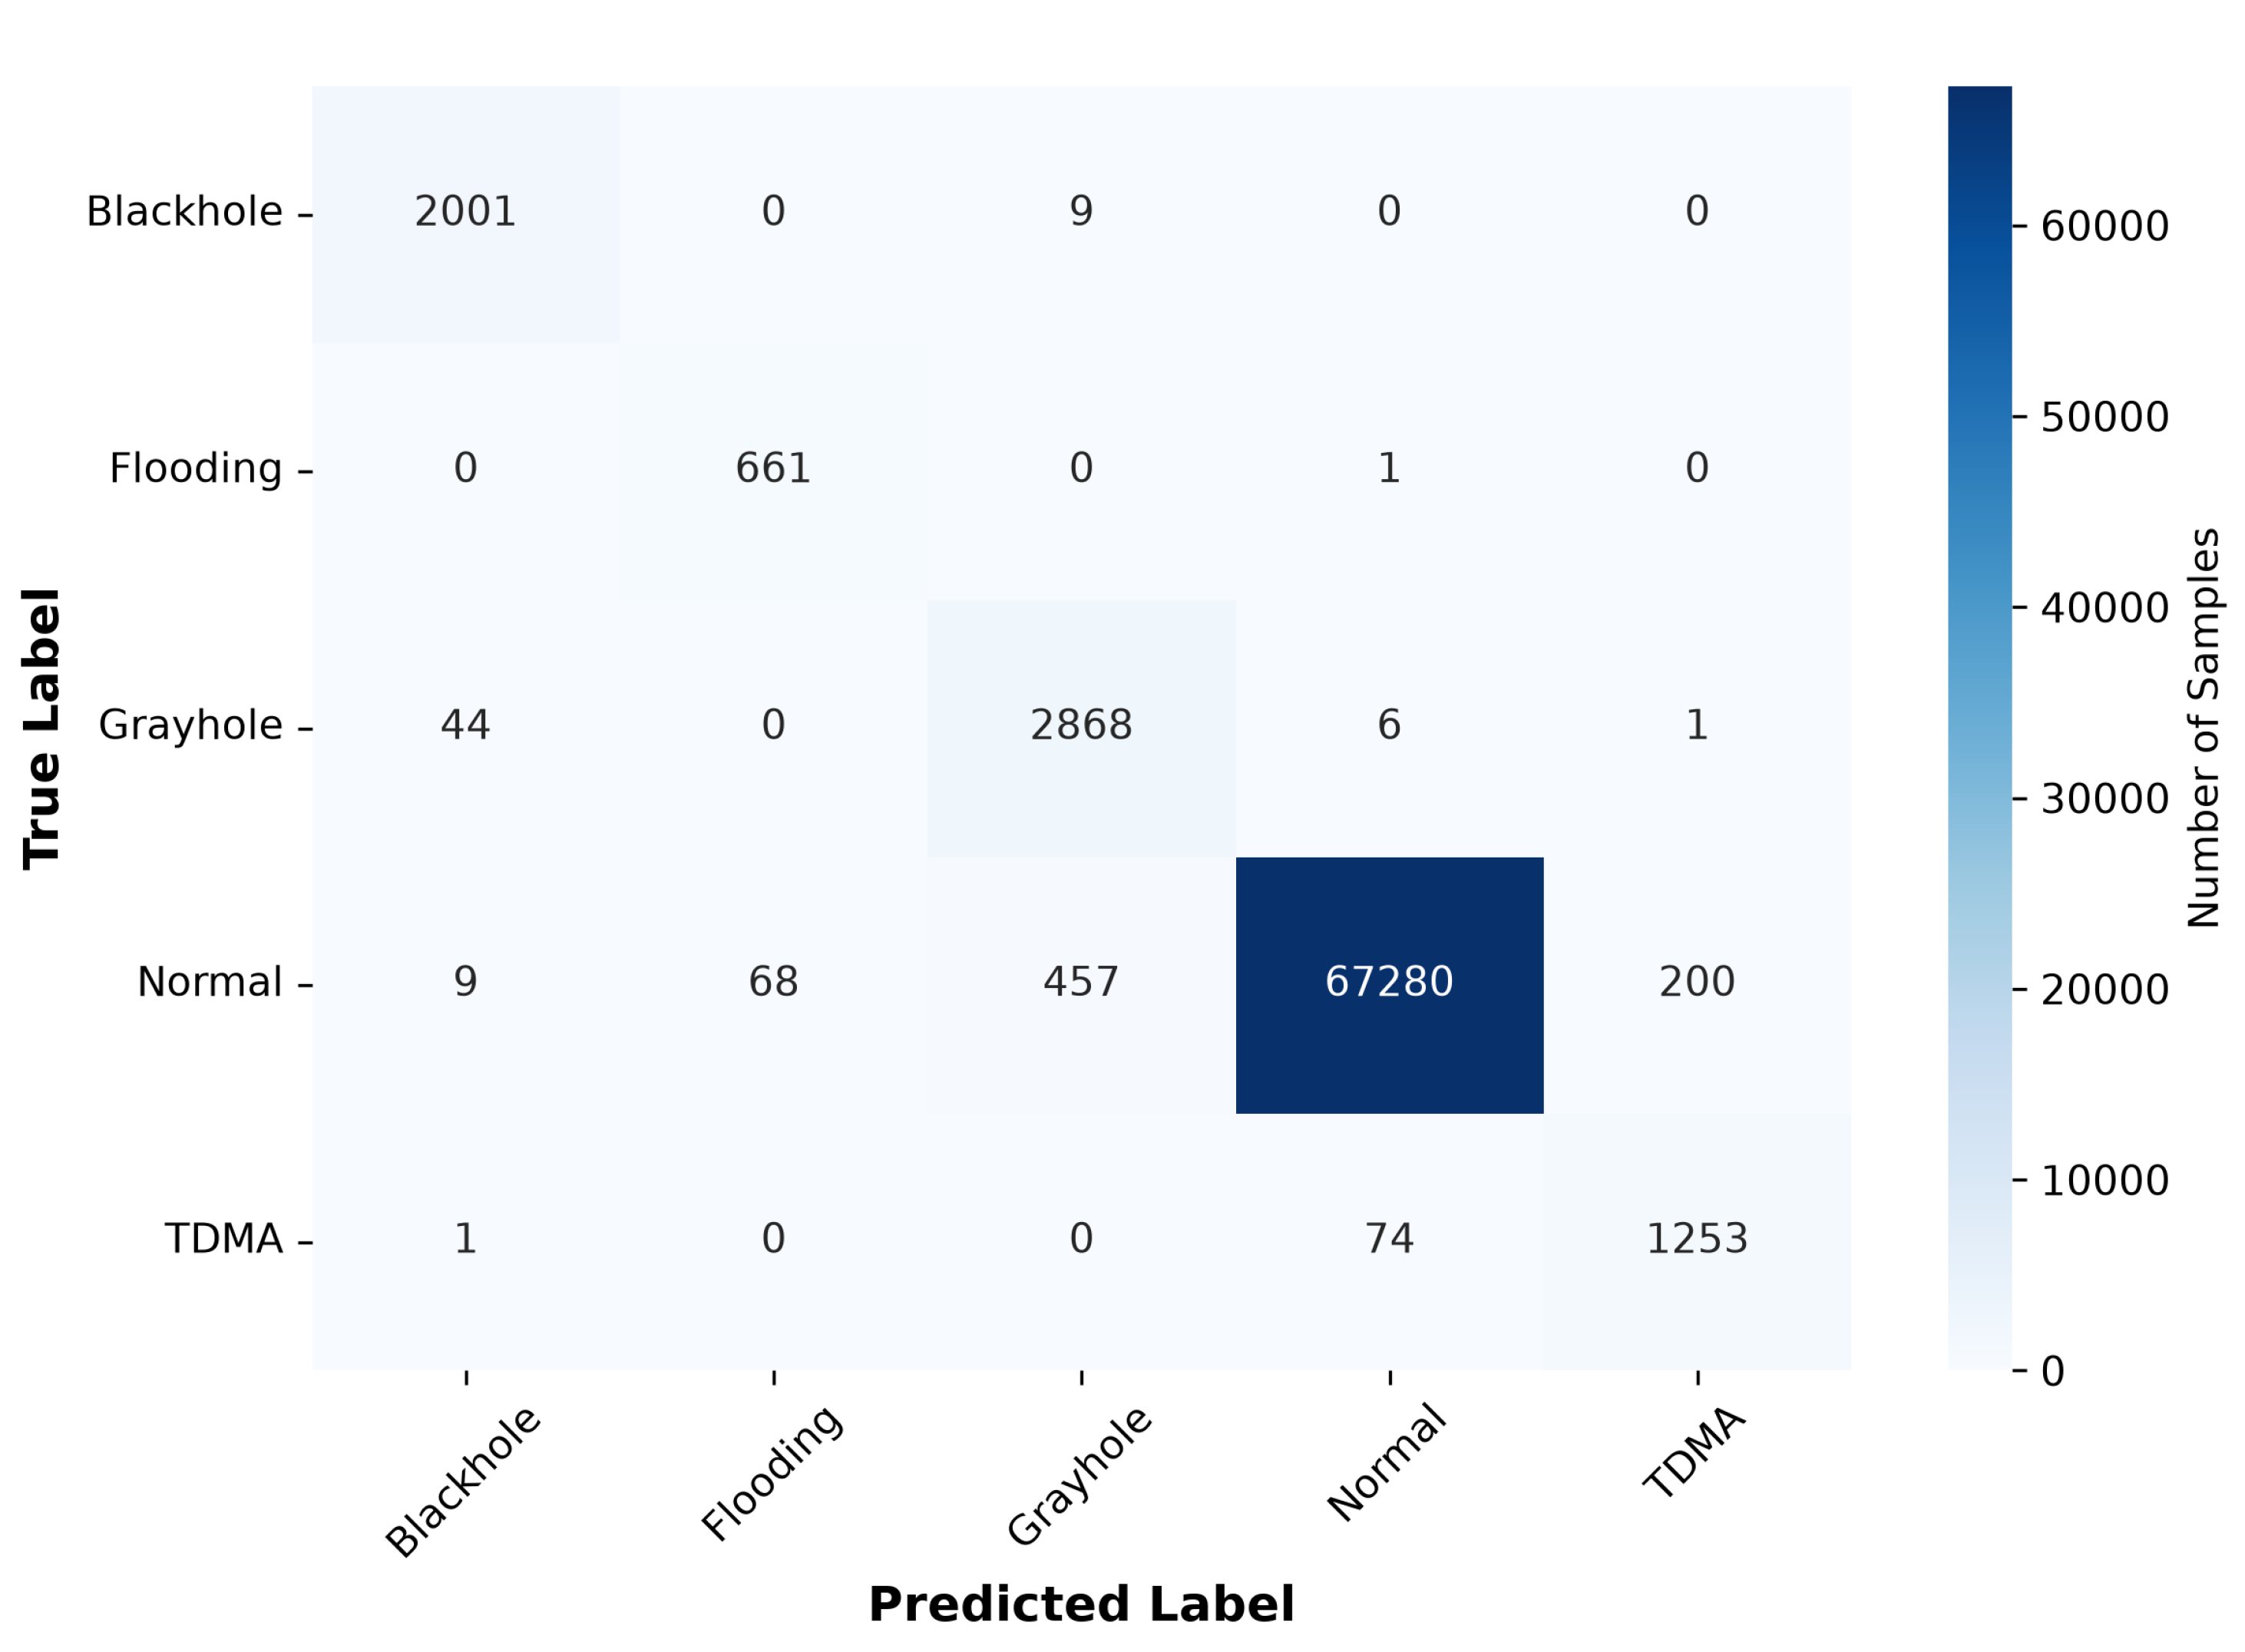
Figure 8.
Sensor noise Model robustness under sensor noise. While both models perform worse under strong noise, the Top 8 FlowerSec IDS model still performs better than the full 16-feature model by 6-7 Macro F1 points. This represents SHAP-based feature number reduction can filter out some noise-sensitive, low-importance features.
Figure 8.
Sensor noise Model robustness under sensor noise. While both models perform worse under strong noise, the Top 8 FlowerSec IDS model still performs better than the full 16-feature model by 6-7 Macro F1 points. This represents SHAP-based feature number reduction can filter out some noise-sensitive, low-importance features.
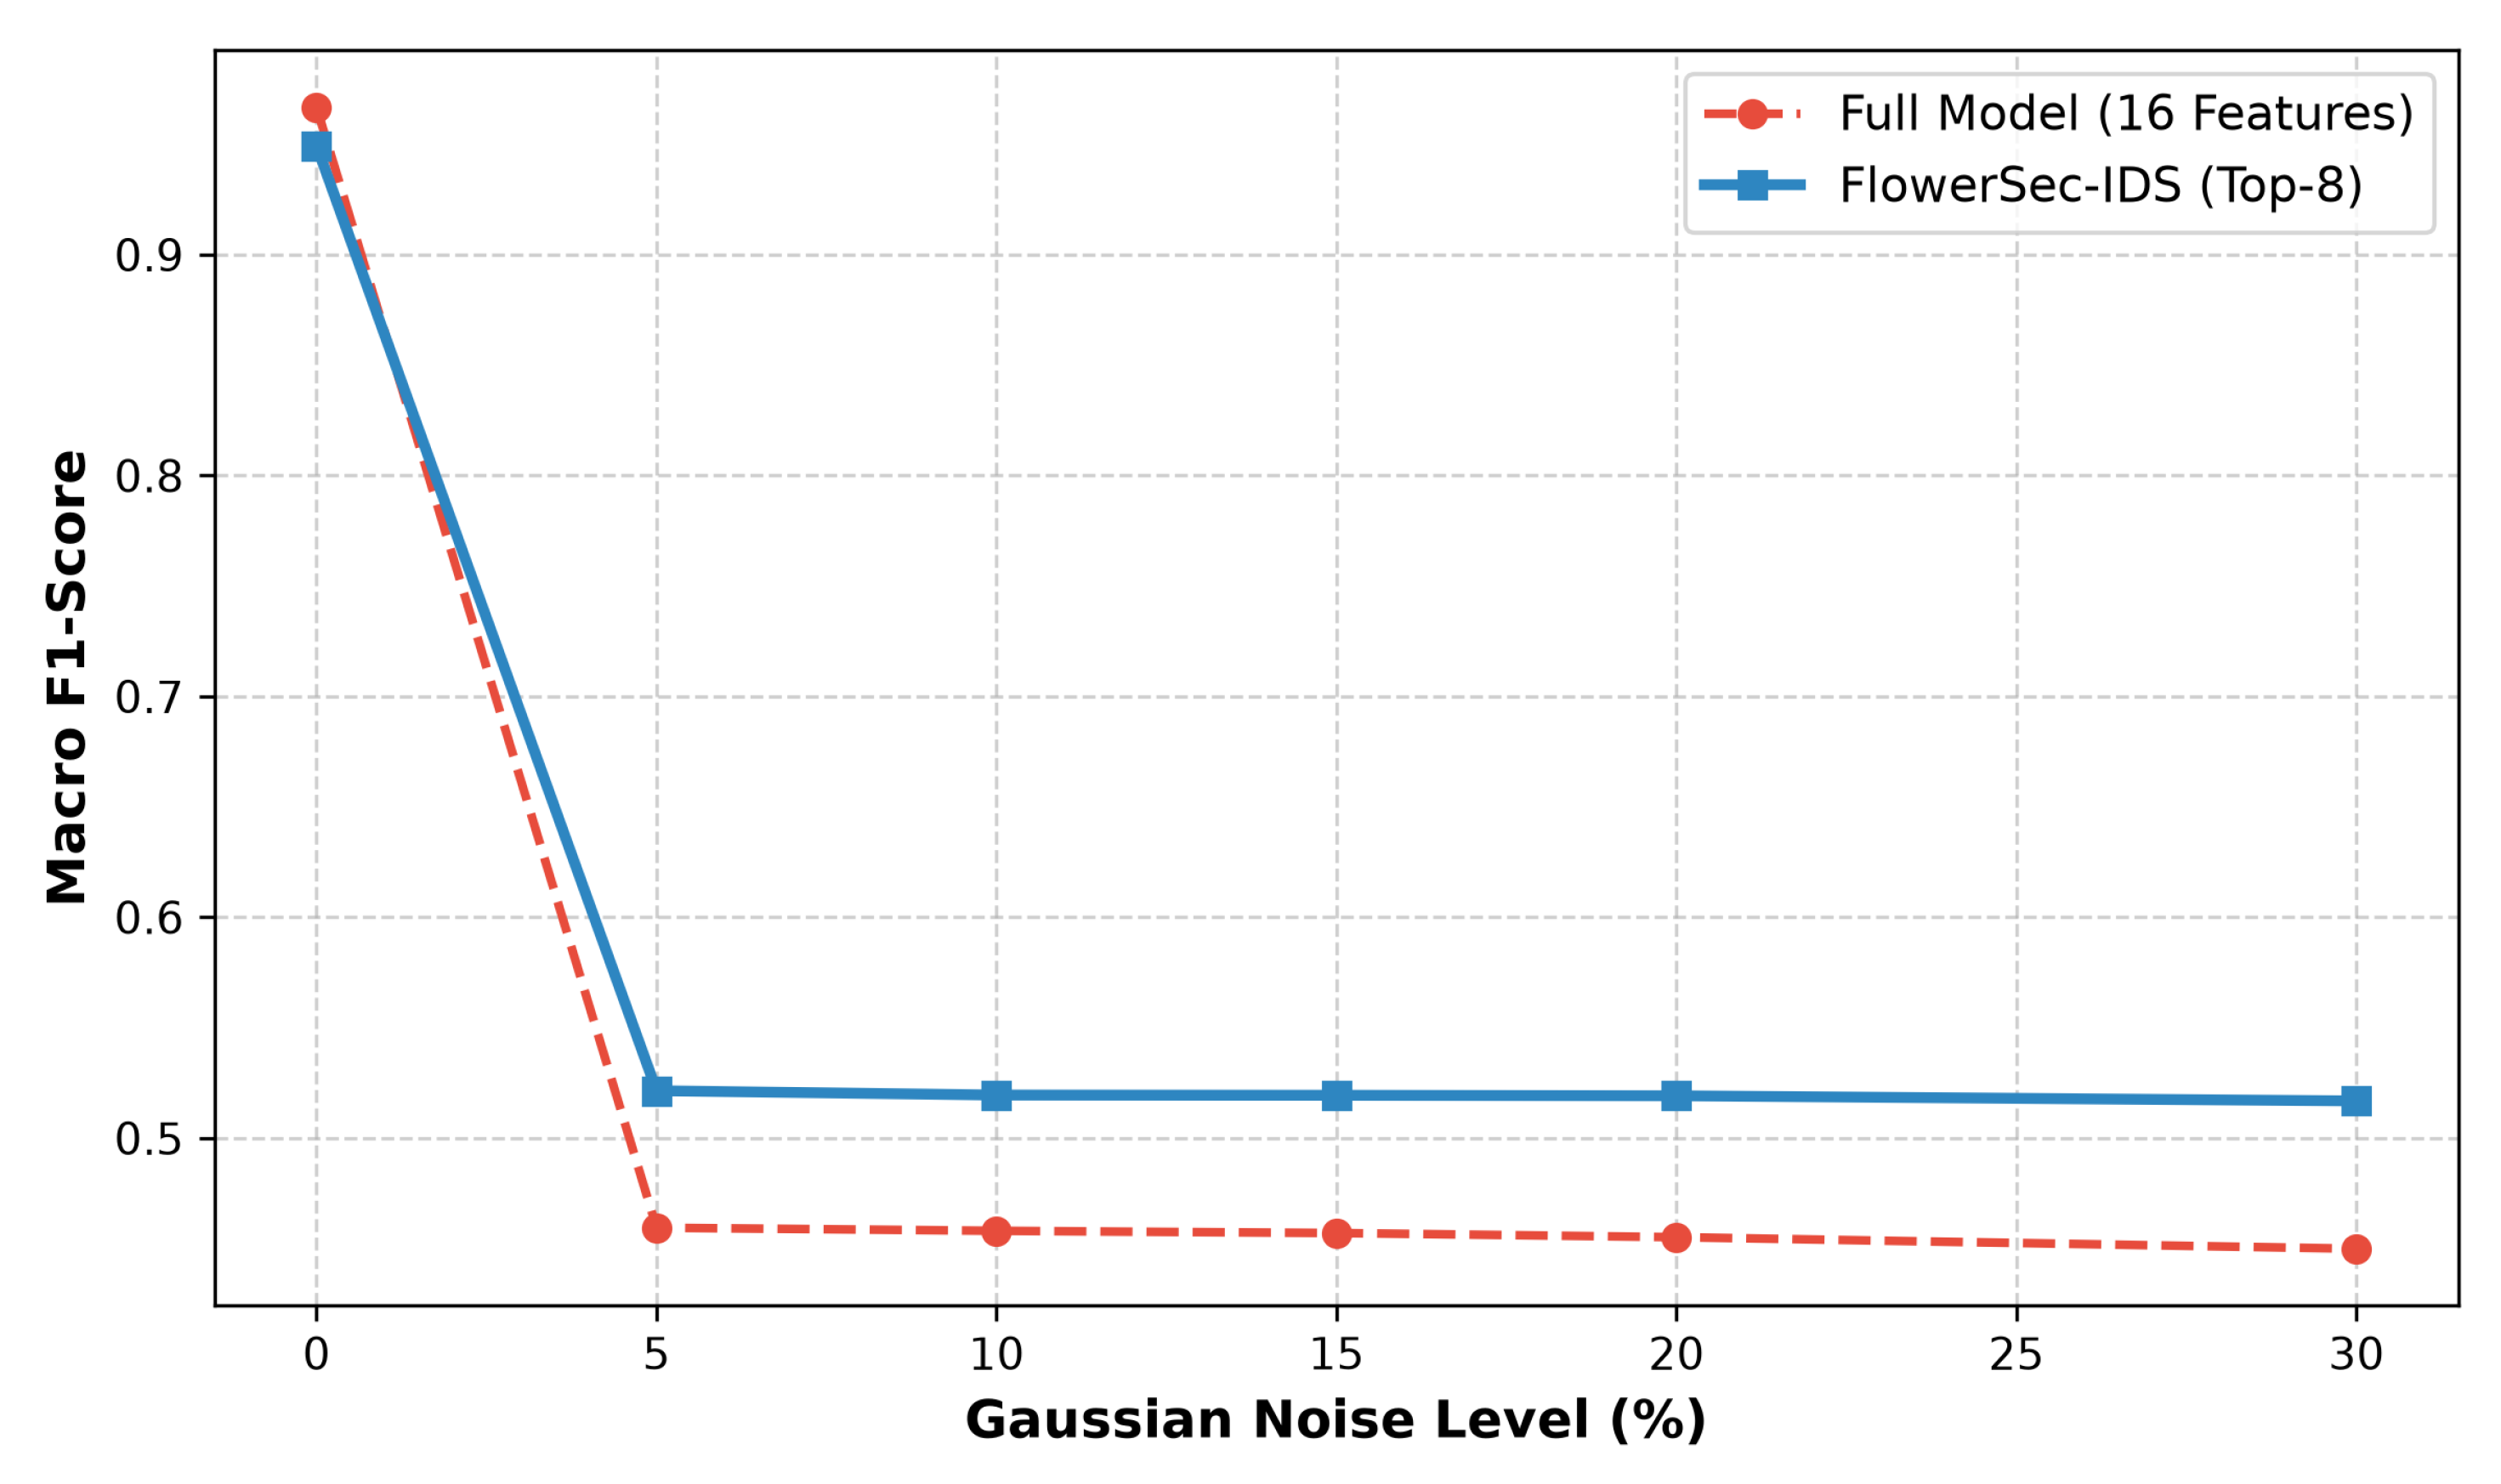
Figure 9.
Network Lifetime Simulation. The tiered ML architecture of FlowerSec exhibits greater fault-tolerance - while the flat network node stops operating after 410 days, nodes at Layers 2 and 3 stay alive until days 510 and 531, respectively.
Figure 9.
Network Lifetime Simulation. The tiered ML architecture of FlowerSec exhibits greater fault-tolerance - while the flat network node stops operating after 410 days, nodes at Layers 2 and 3 stay alive until days 510 and 531, respectively.
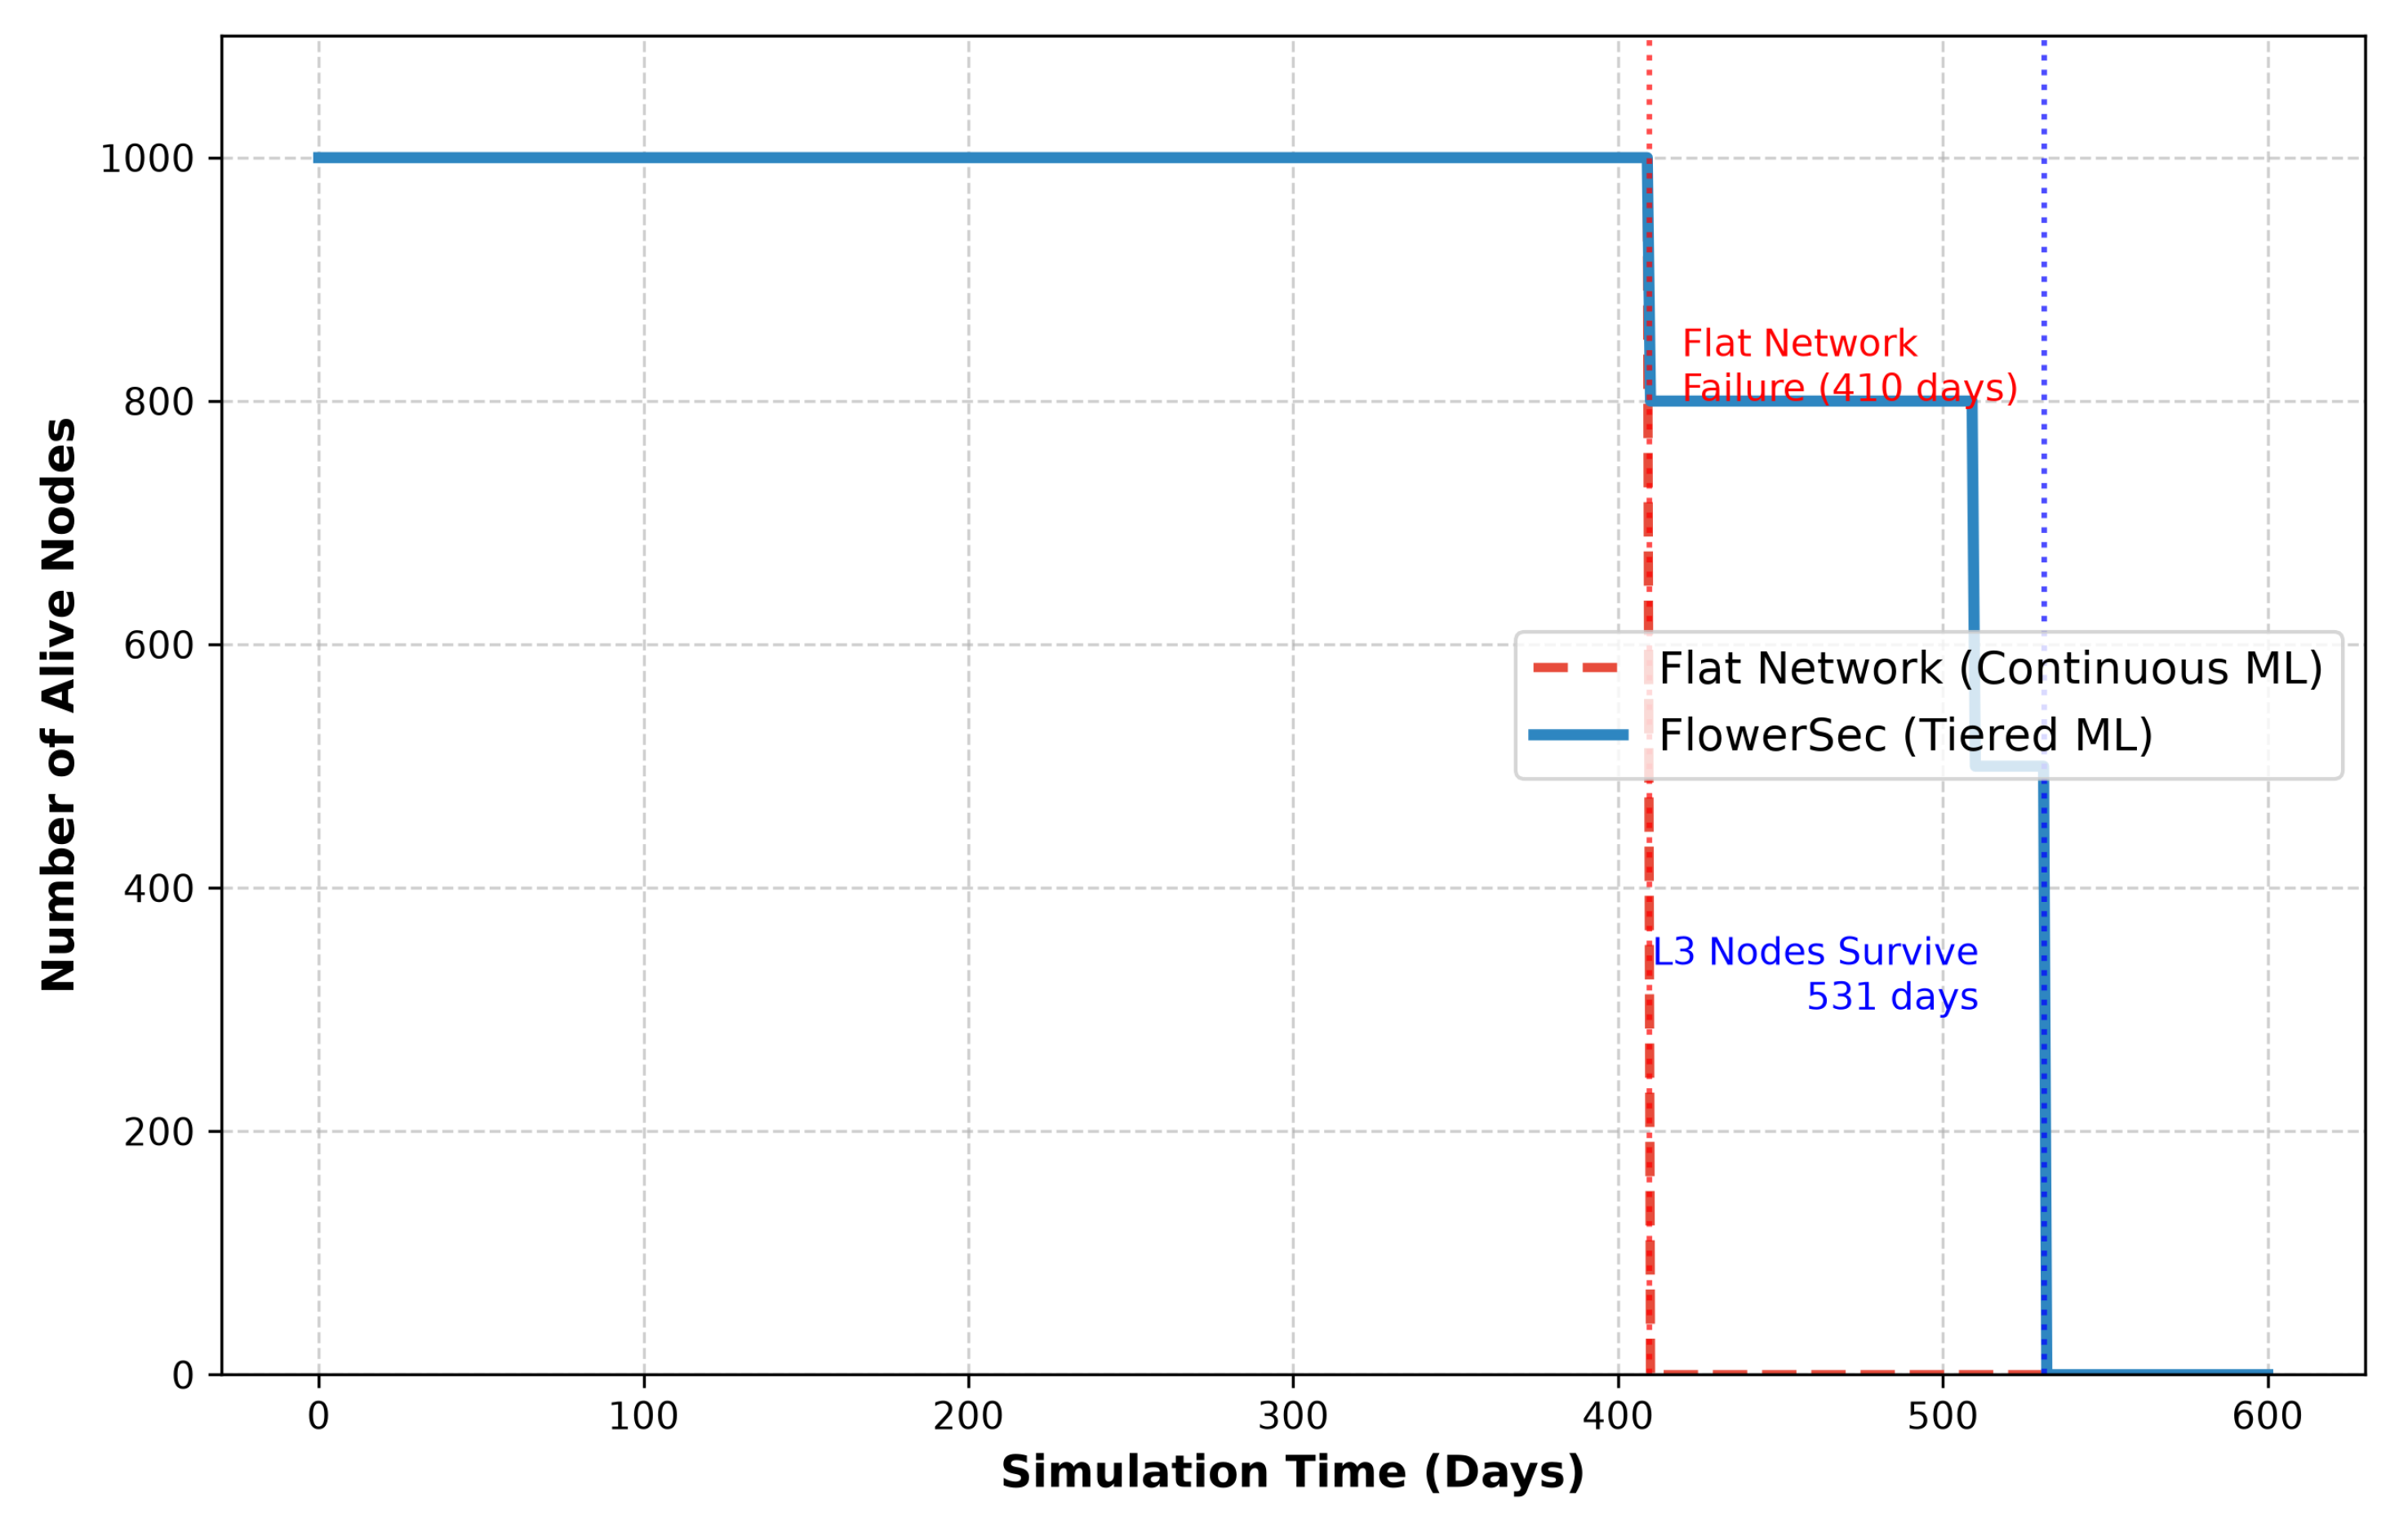
Figure 10.
Unsupervised Anomaly Detection. The histogram (left) demonstrates the massive separation in reconstruction error between normal traffic and malicious attacks, while the ROC curve (right) confirms an AUC-ROC of 0.9819, proving the model’s viability for zero-day threat detection.
Figure 10.
Unsupervised Anomaly Detection. The histogram (left) demonstrates the massive separation in reconstruction error between normal traffic and malicious attacks, while the ROC curve (right) confirms an AUC-ROC of 0.9819, proving the model’s viability for zero-day threat detection.
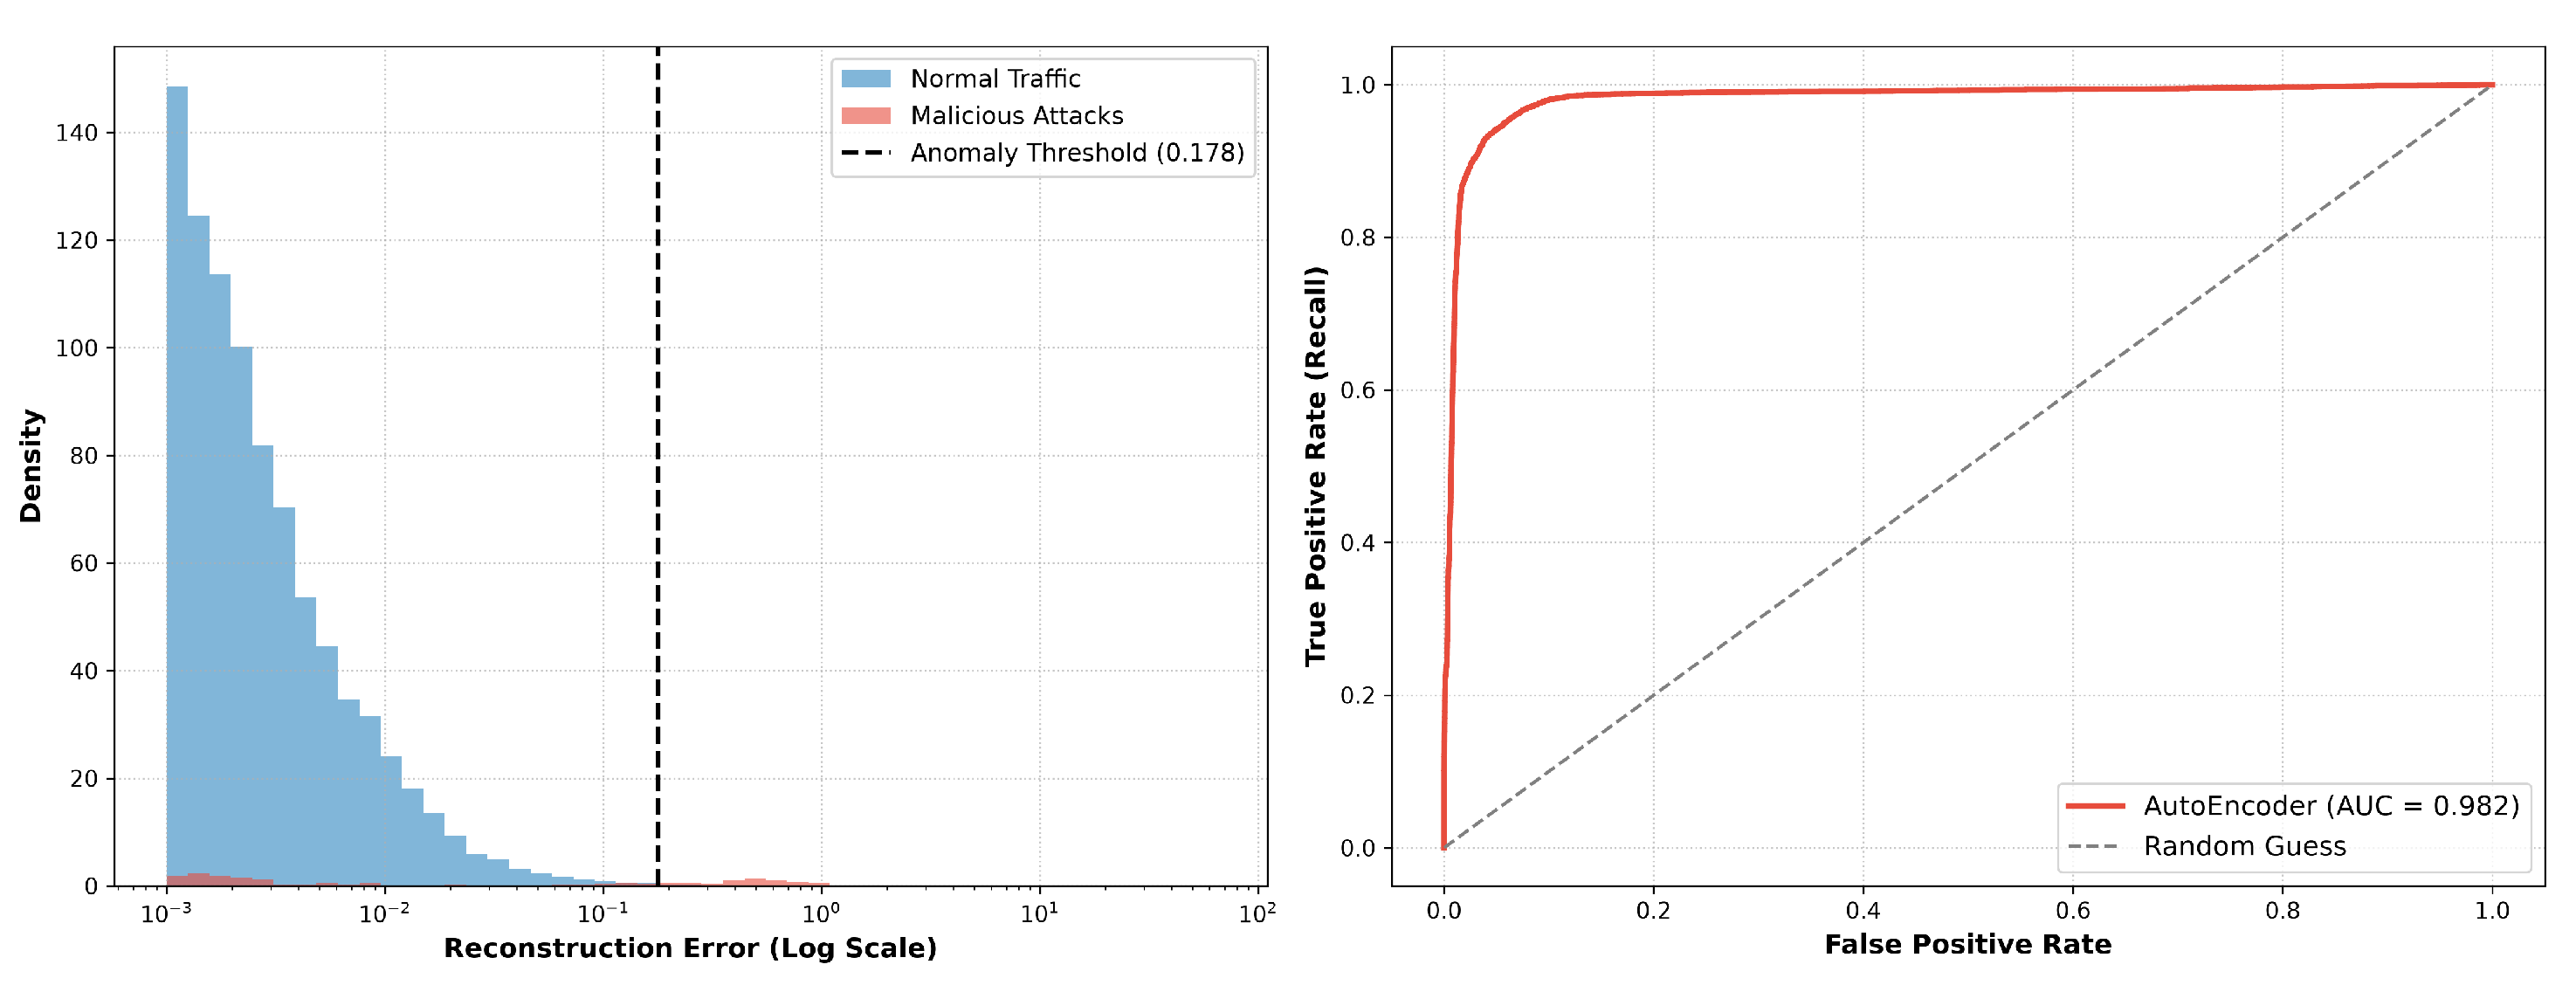
Figure 11.
Unsupervised AutoEncoder’s zero-day detection performance under leave-one-attack-class-out protocol. Each subplot shows the ROC curve of training AutoEncoder on completely unseen attack for unseen attack class. On each curve there is a STAR which denotes the operating value based on 95% percentile of the normal training of reconstruction errors.
Figure 11.
Unsupervised AutoEncoder’s zero-day detection performance under leave-one-attack-class-out protocol. Each subplot shows the ROC curve of training AutoEncoder on completely unseen attack for unseen attack class. On each curve there is a STAR which denotes the operating value based on 95% percentile of the normal training of reconstruction errors.
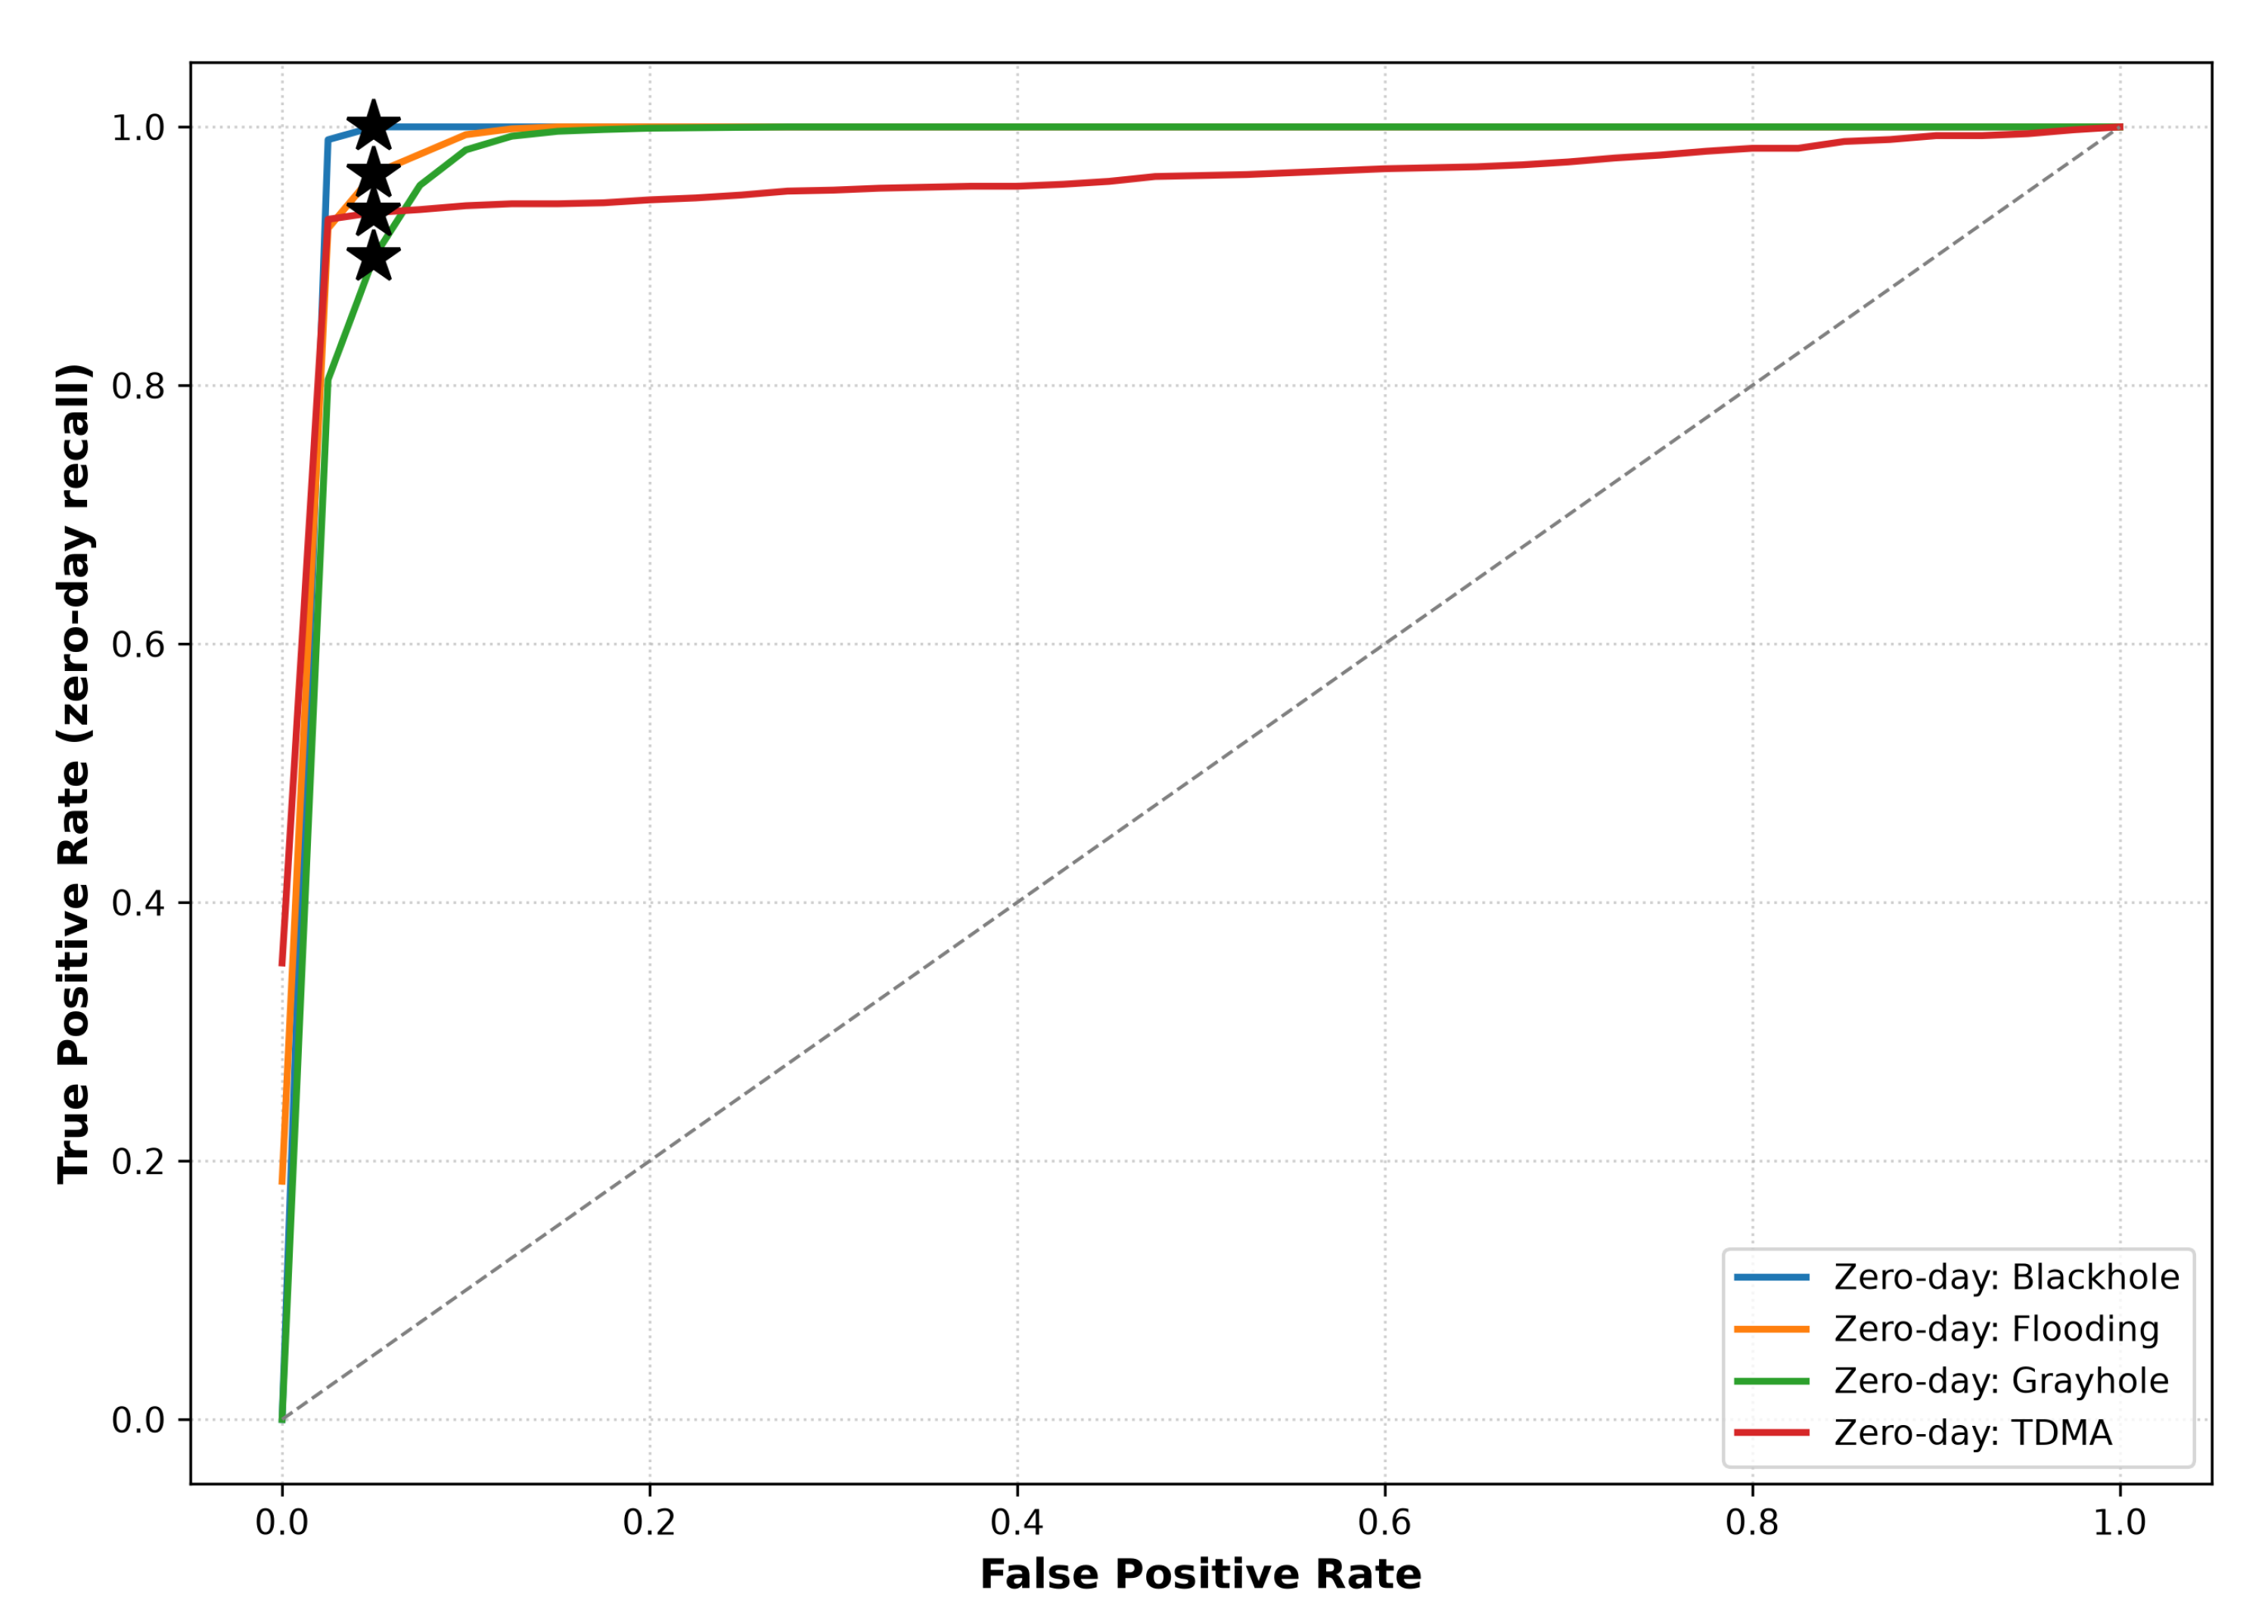
Figure 12.
Federated learning for non-IID Dirichlet split. The global model steadily improves through the 5 rounds of communication when trained via Federated Averaging and quickly reaches near-centralized baseline without ever sharing raw traffic.
Figure 12.
Federated learning for non-IID Dirichlet split. The global model steadily improves through the 5 rounds of communication when trained via Federated Averaging and quickly reaches near-centralized baseline without ever sharing raw traffic.
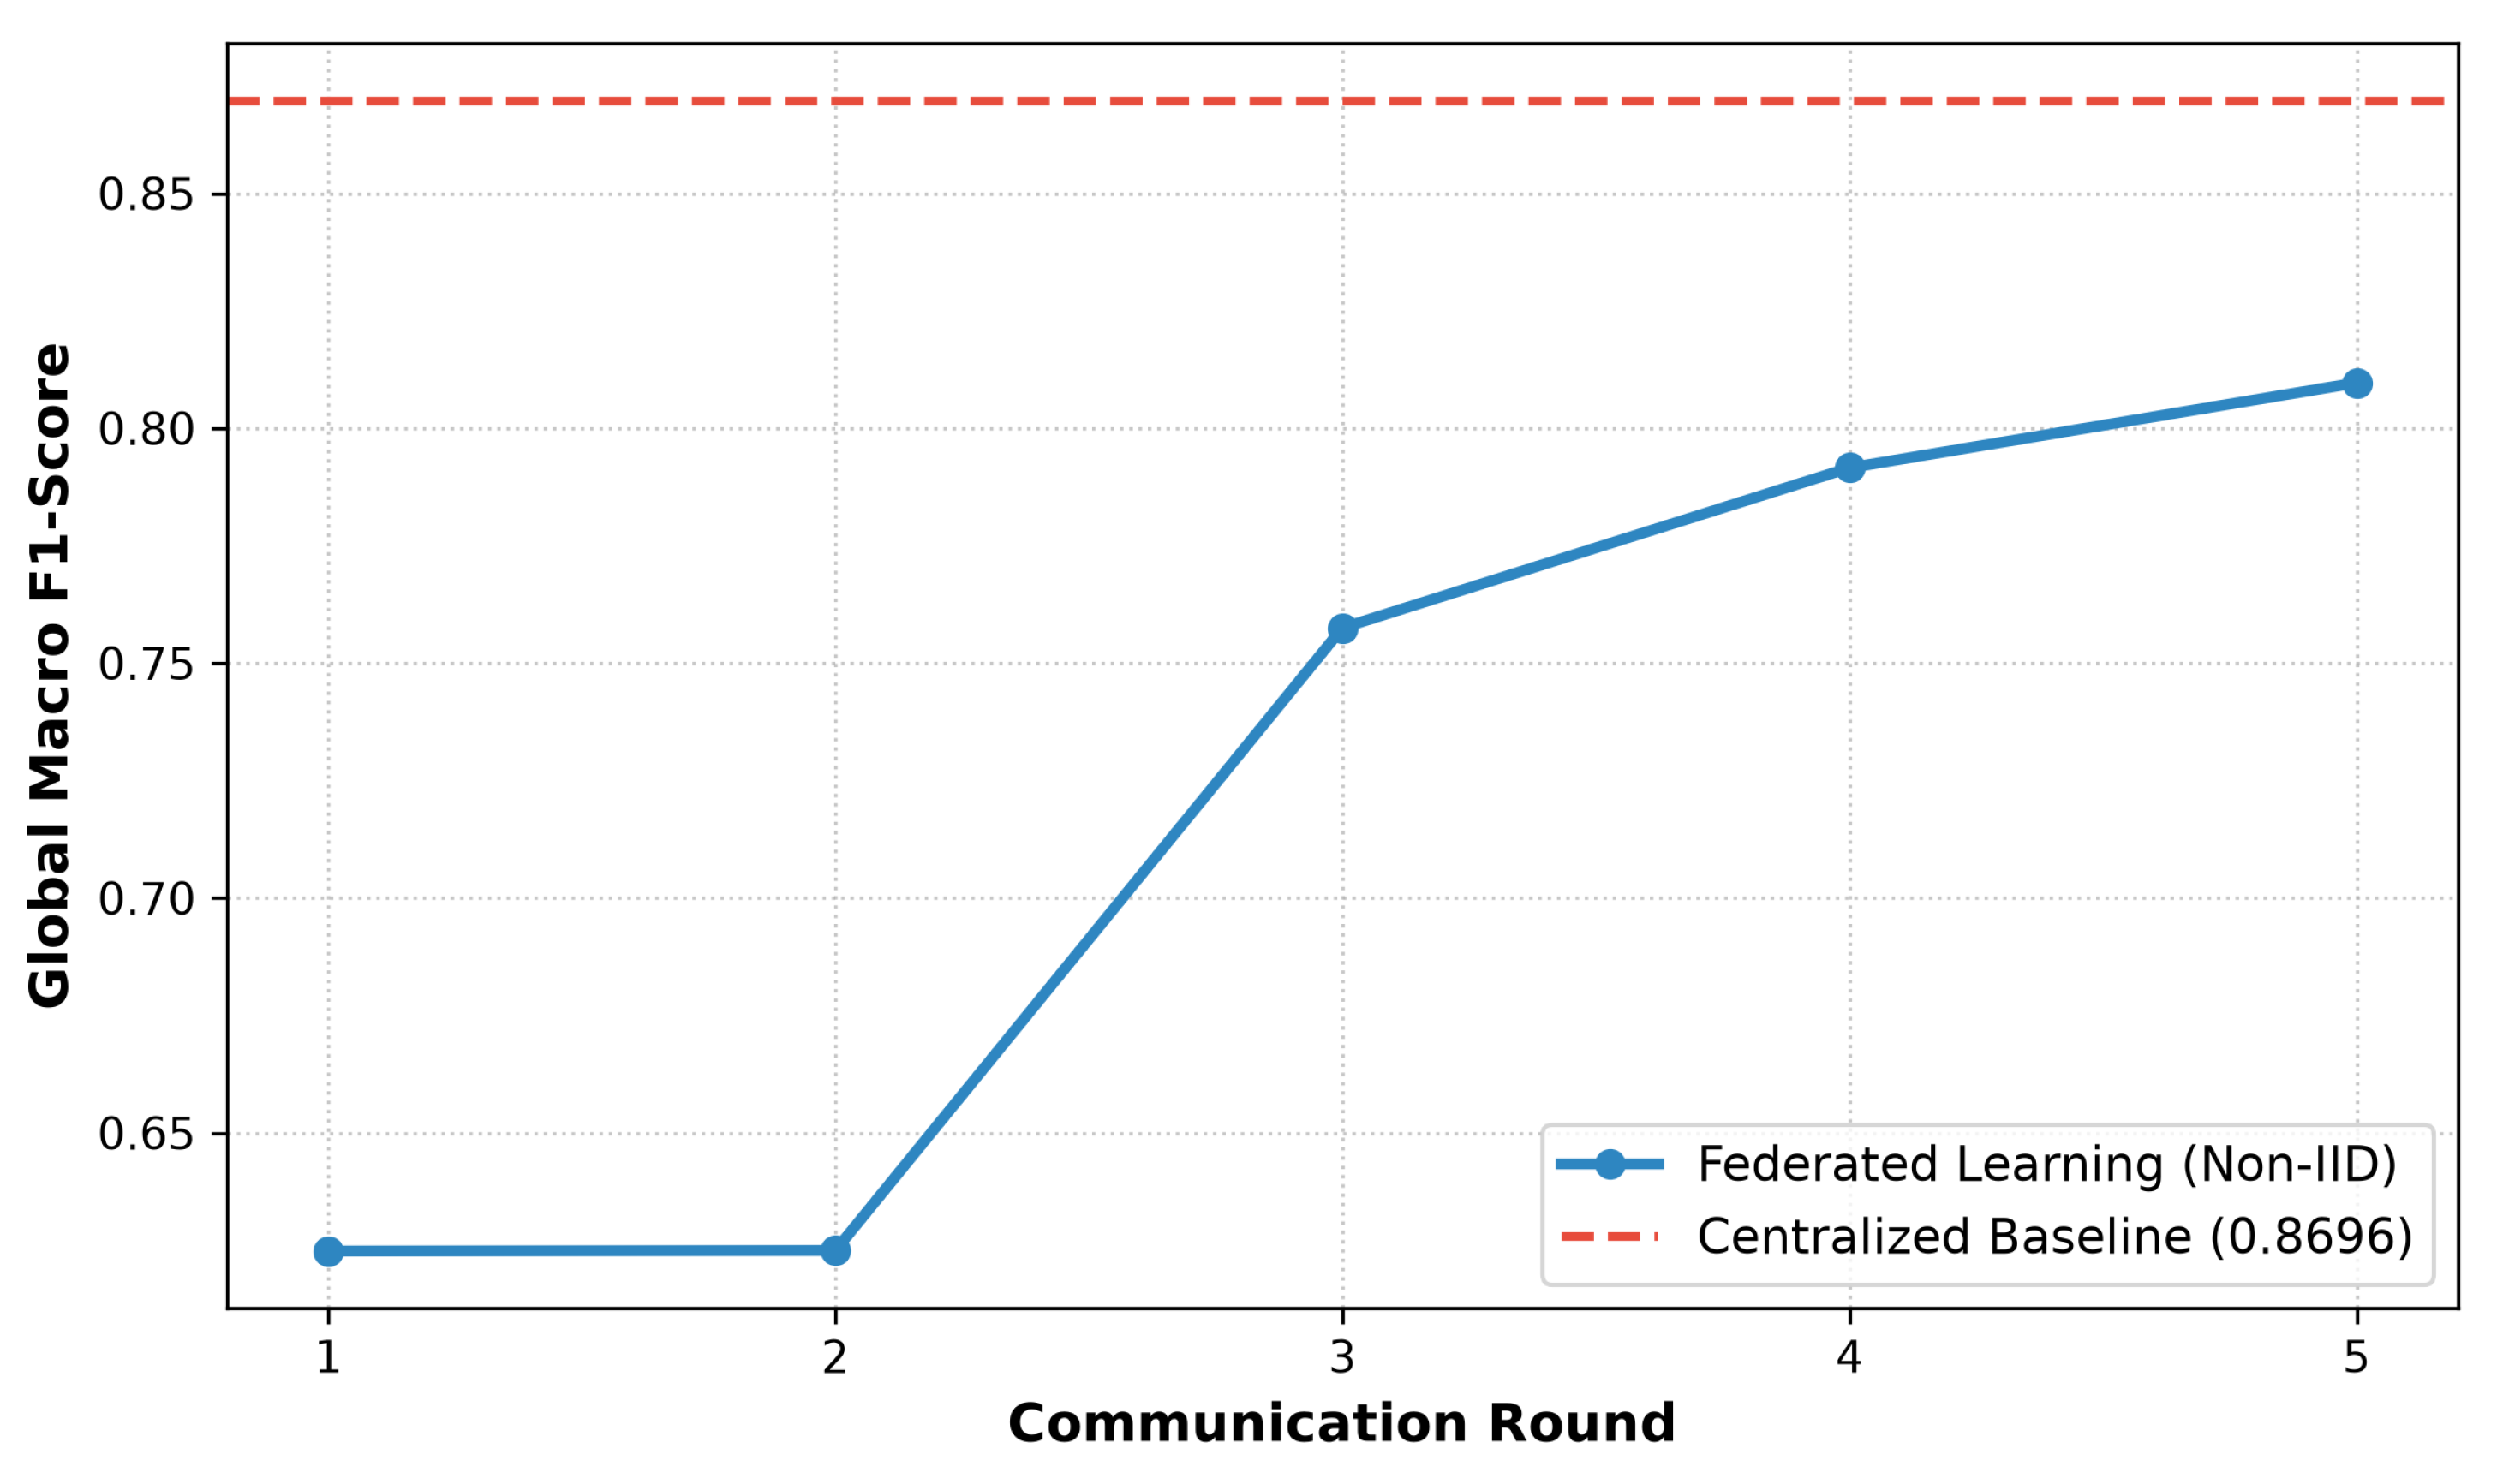
Figure 13.
Computational Cost Comparison: The bubble chart plots Inference Latency against Energy Consumption with Size of bubble representing model footprint. FlowerSec IDS (LightGBM) is in the sub-millisecond, microjoule regime and fits on the battery powered Seed node compared to 1D CNN that will require edge GPU hardware.
Figure 13.
Computational Cost Comparison: The bubble chart plots Inference Latency against Energy Consumption with Size of bubble representing model footprint. FlowerSec IDS (LightGBM) is in the sub-millisecond, microjoule regime and fits on the battery powered Seed node compared to 1D CNN that will require edge GPU hardware.
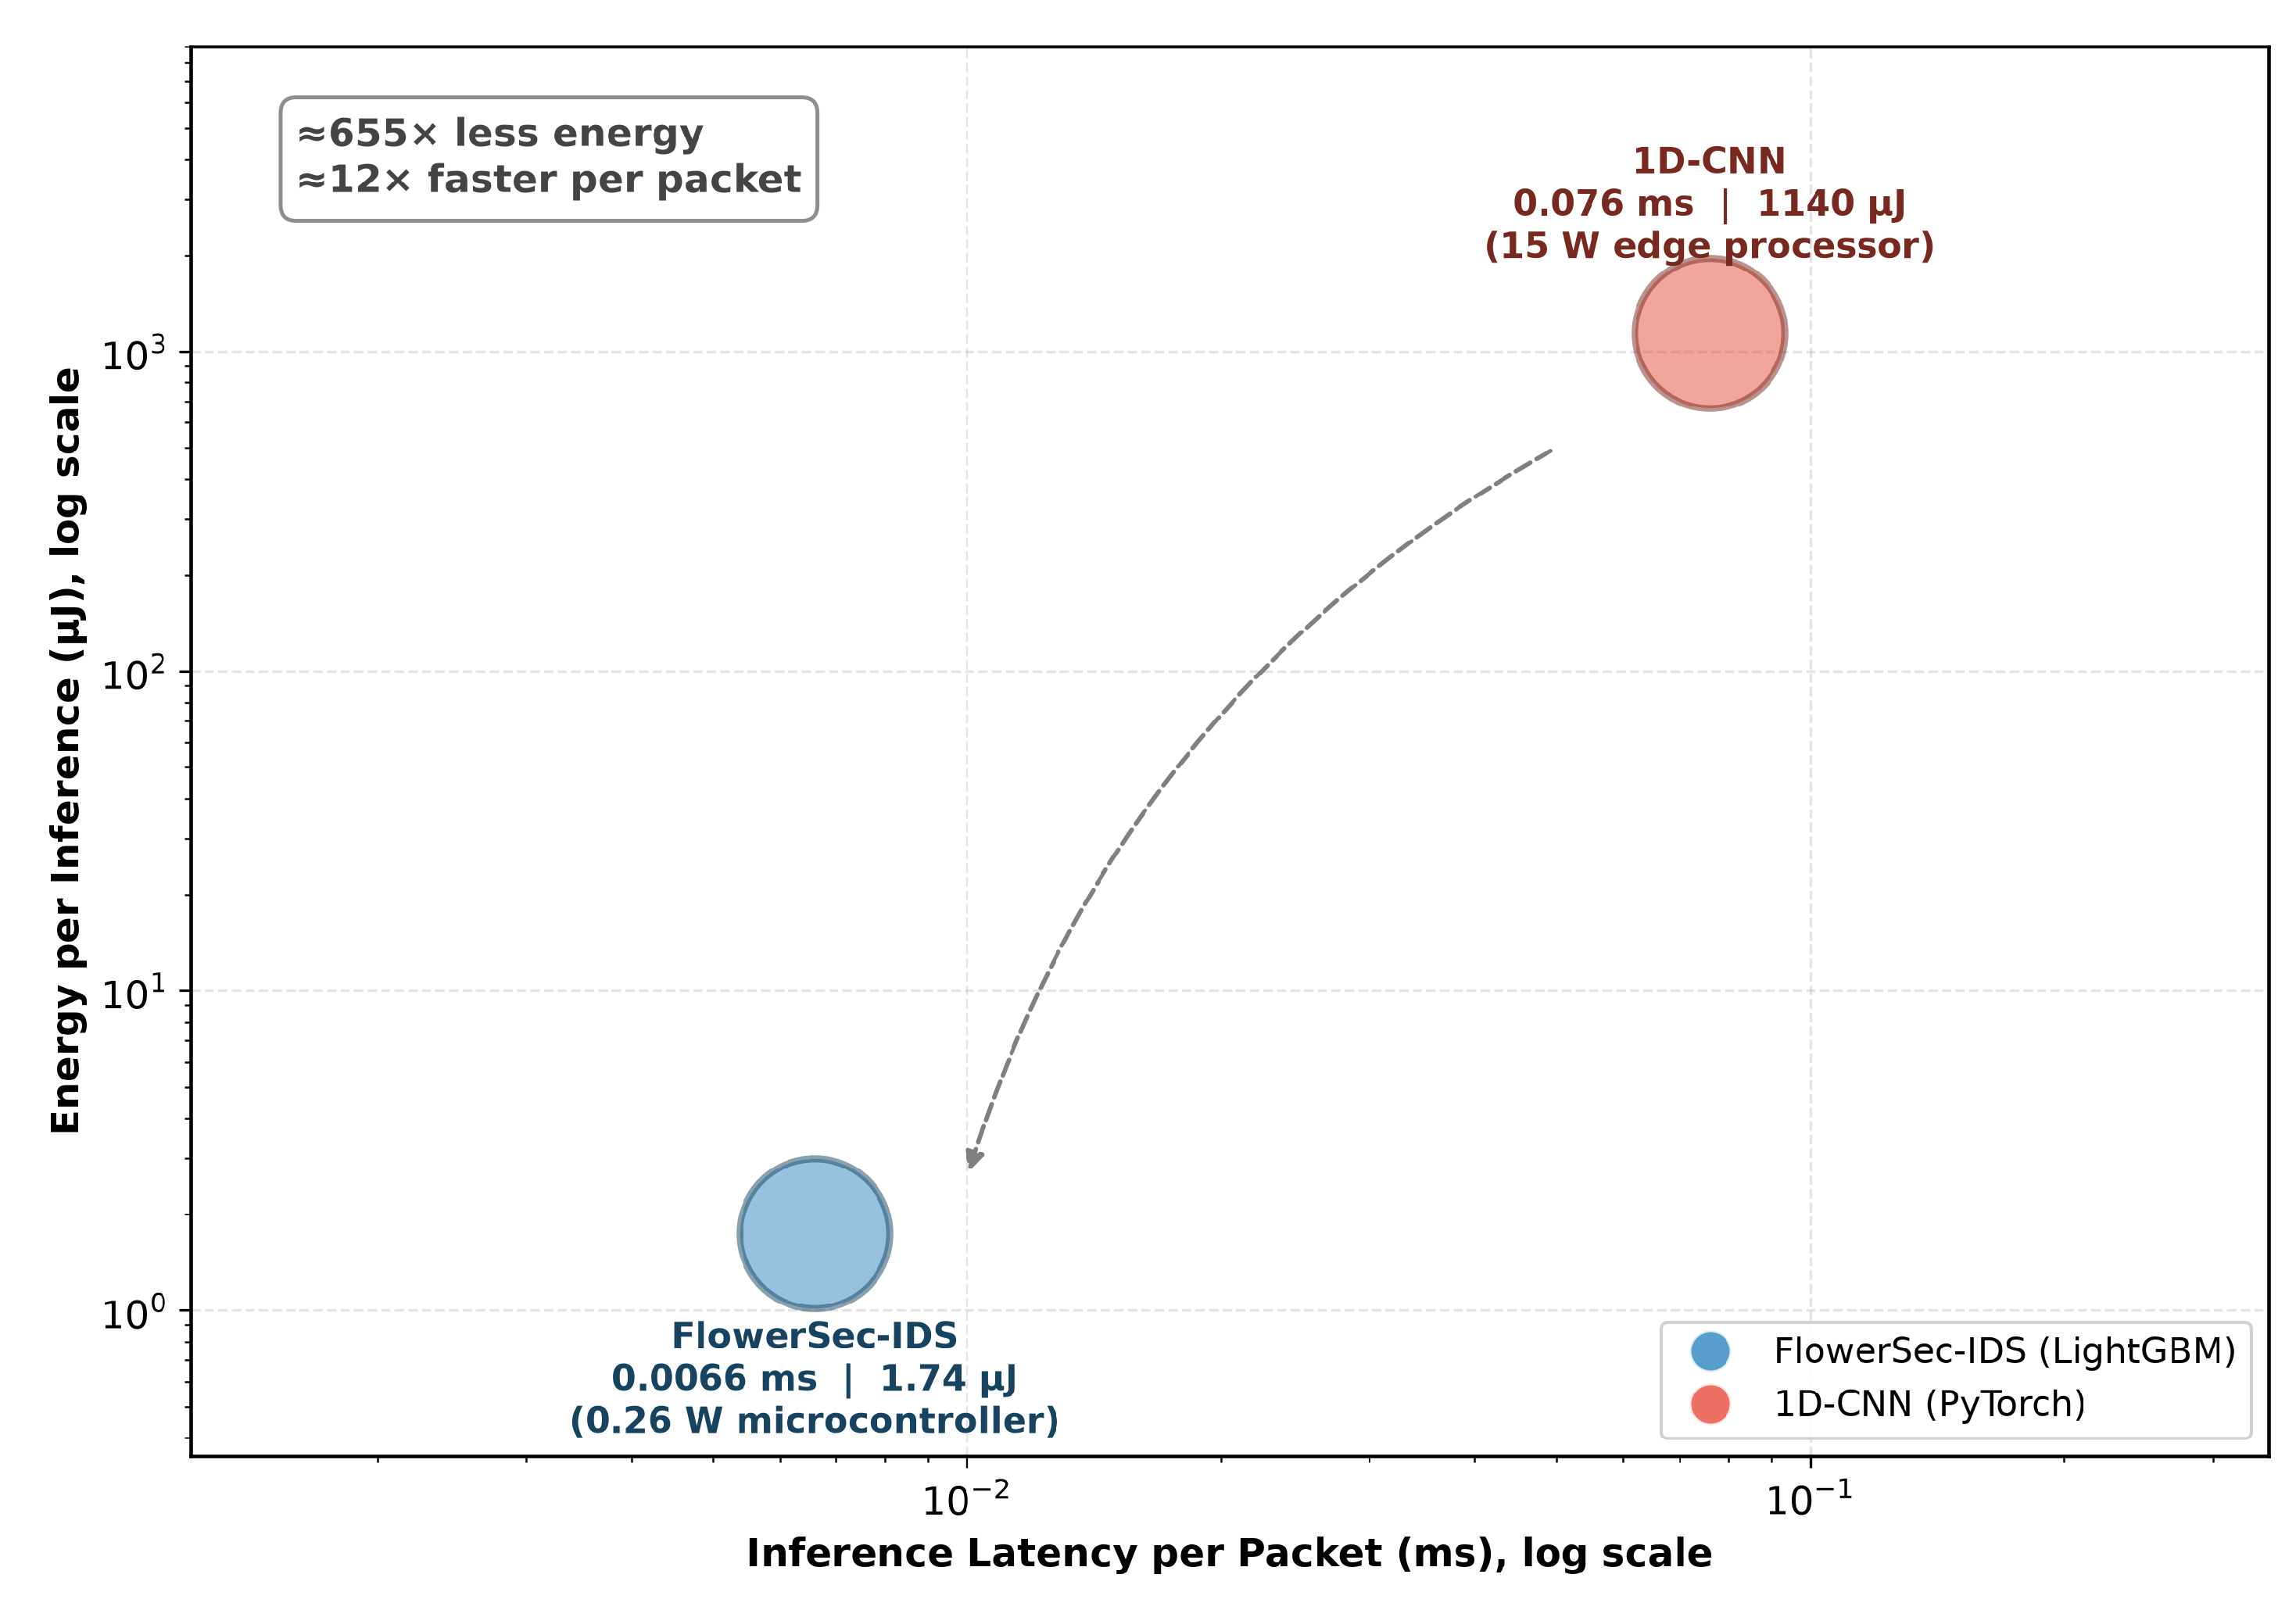
Figure 14.
Latent Space Clustering of Top 8 Features. The tSNE projection shows that the combination of the 8 SHAP selected features create separate boundaries among the five types of traffic; indicating the accuracy of the feature reduction.
Figure 14.
Latent Space Clustering of Top 8 Features. The tSNE projection shows that the combination of the 8 SHAP selected features create separate boundaries among the five types of traffic; indicating the accuracy of the feature reduction.
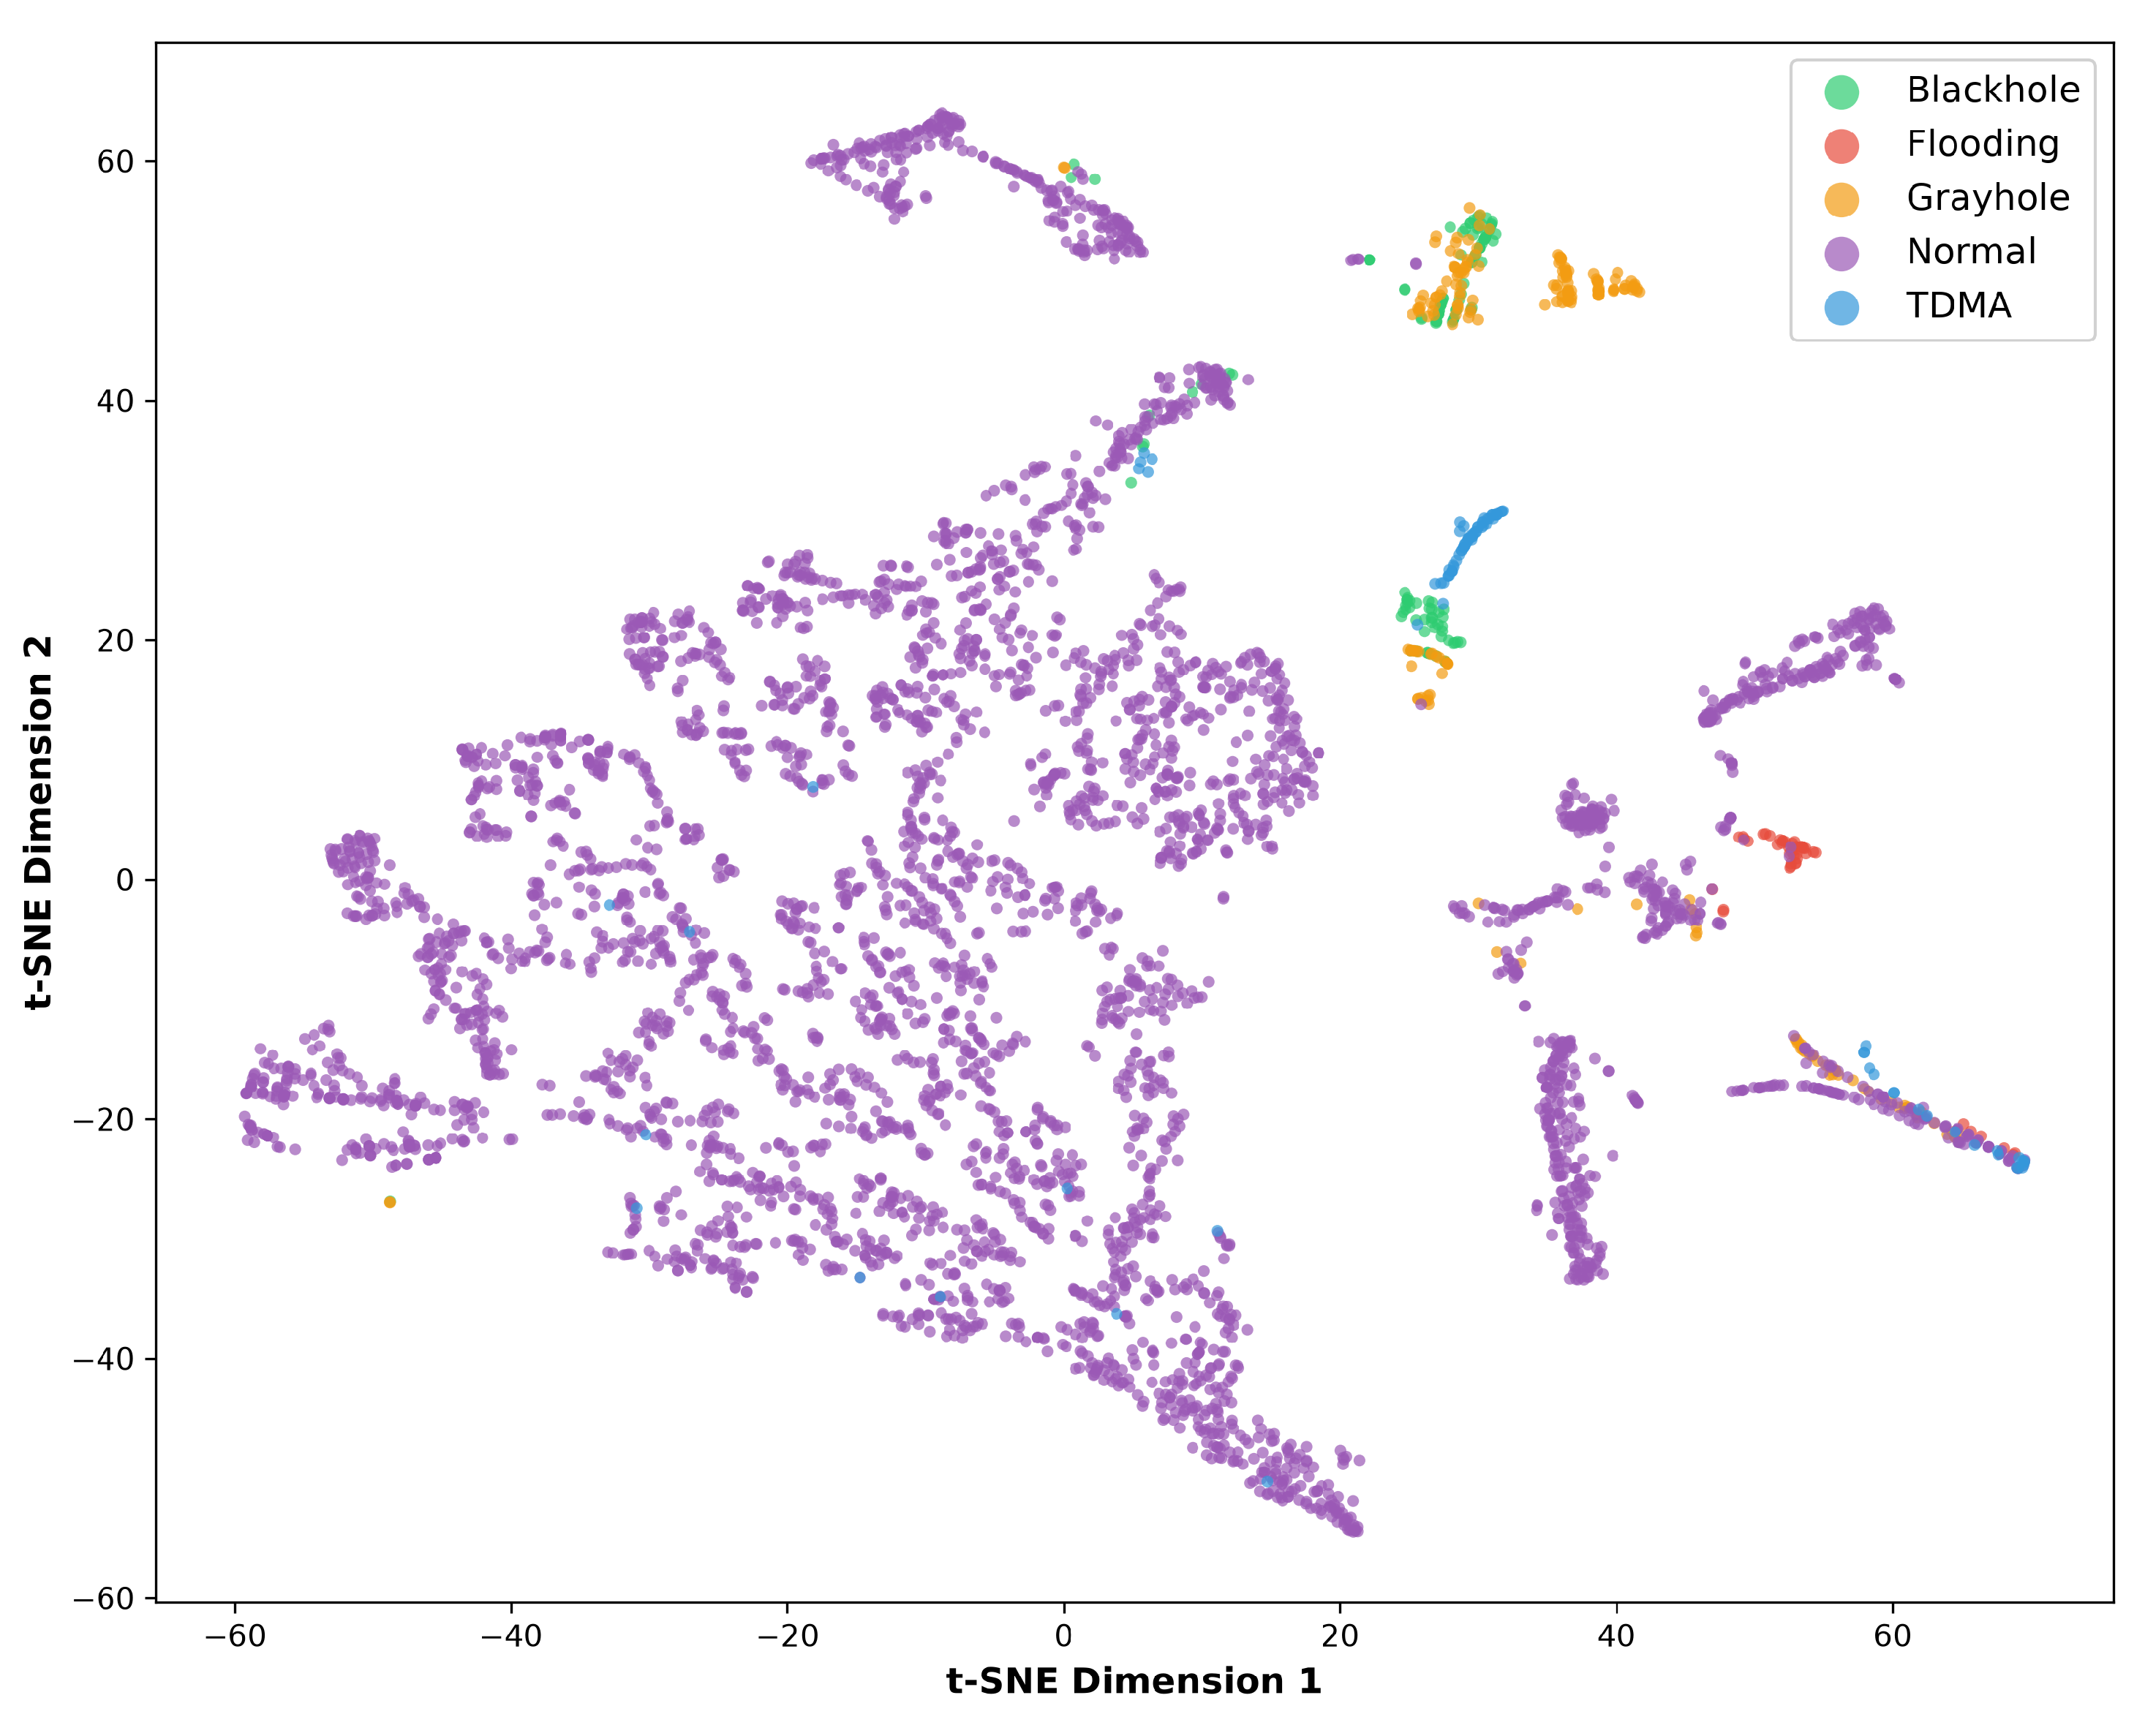
Figure 15.
L2 distance distribution, L2-perturbation-distance-distribution during successful evasions of the Hop-Skip Jump attack. The majority successfully evading traffic falls onto the class of low perturbation value, namely Blackhole and Grayhole. Only Flooding traffic remains unaffected.
Figure 15.
L2 distance distribution, L2-perturbation-distance-distribution during successful evasions of the Hop-Skip Jump attack. The majority successfully evading traffic falls onto the class of low perturbation value, namely Blackhole and Grayhole. Only Flooding traffic remains unaffected.
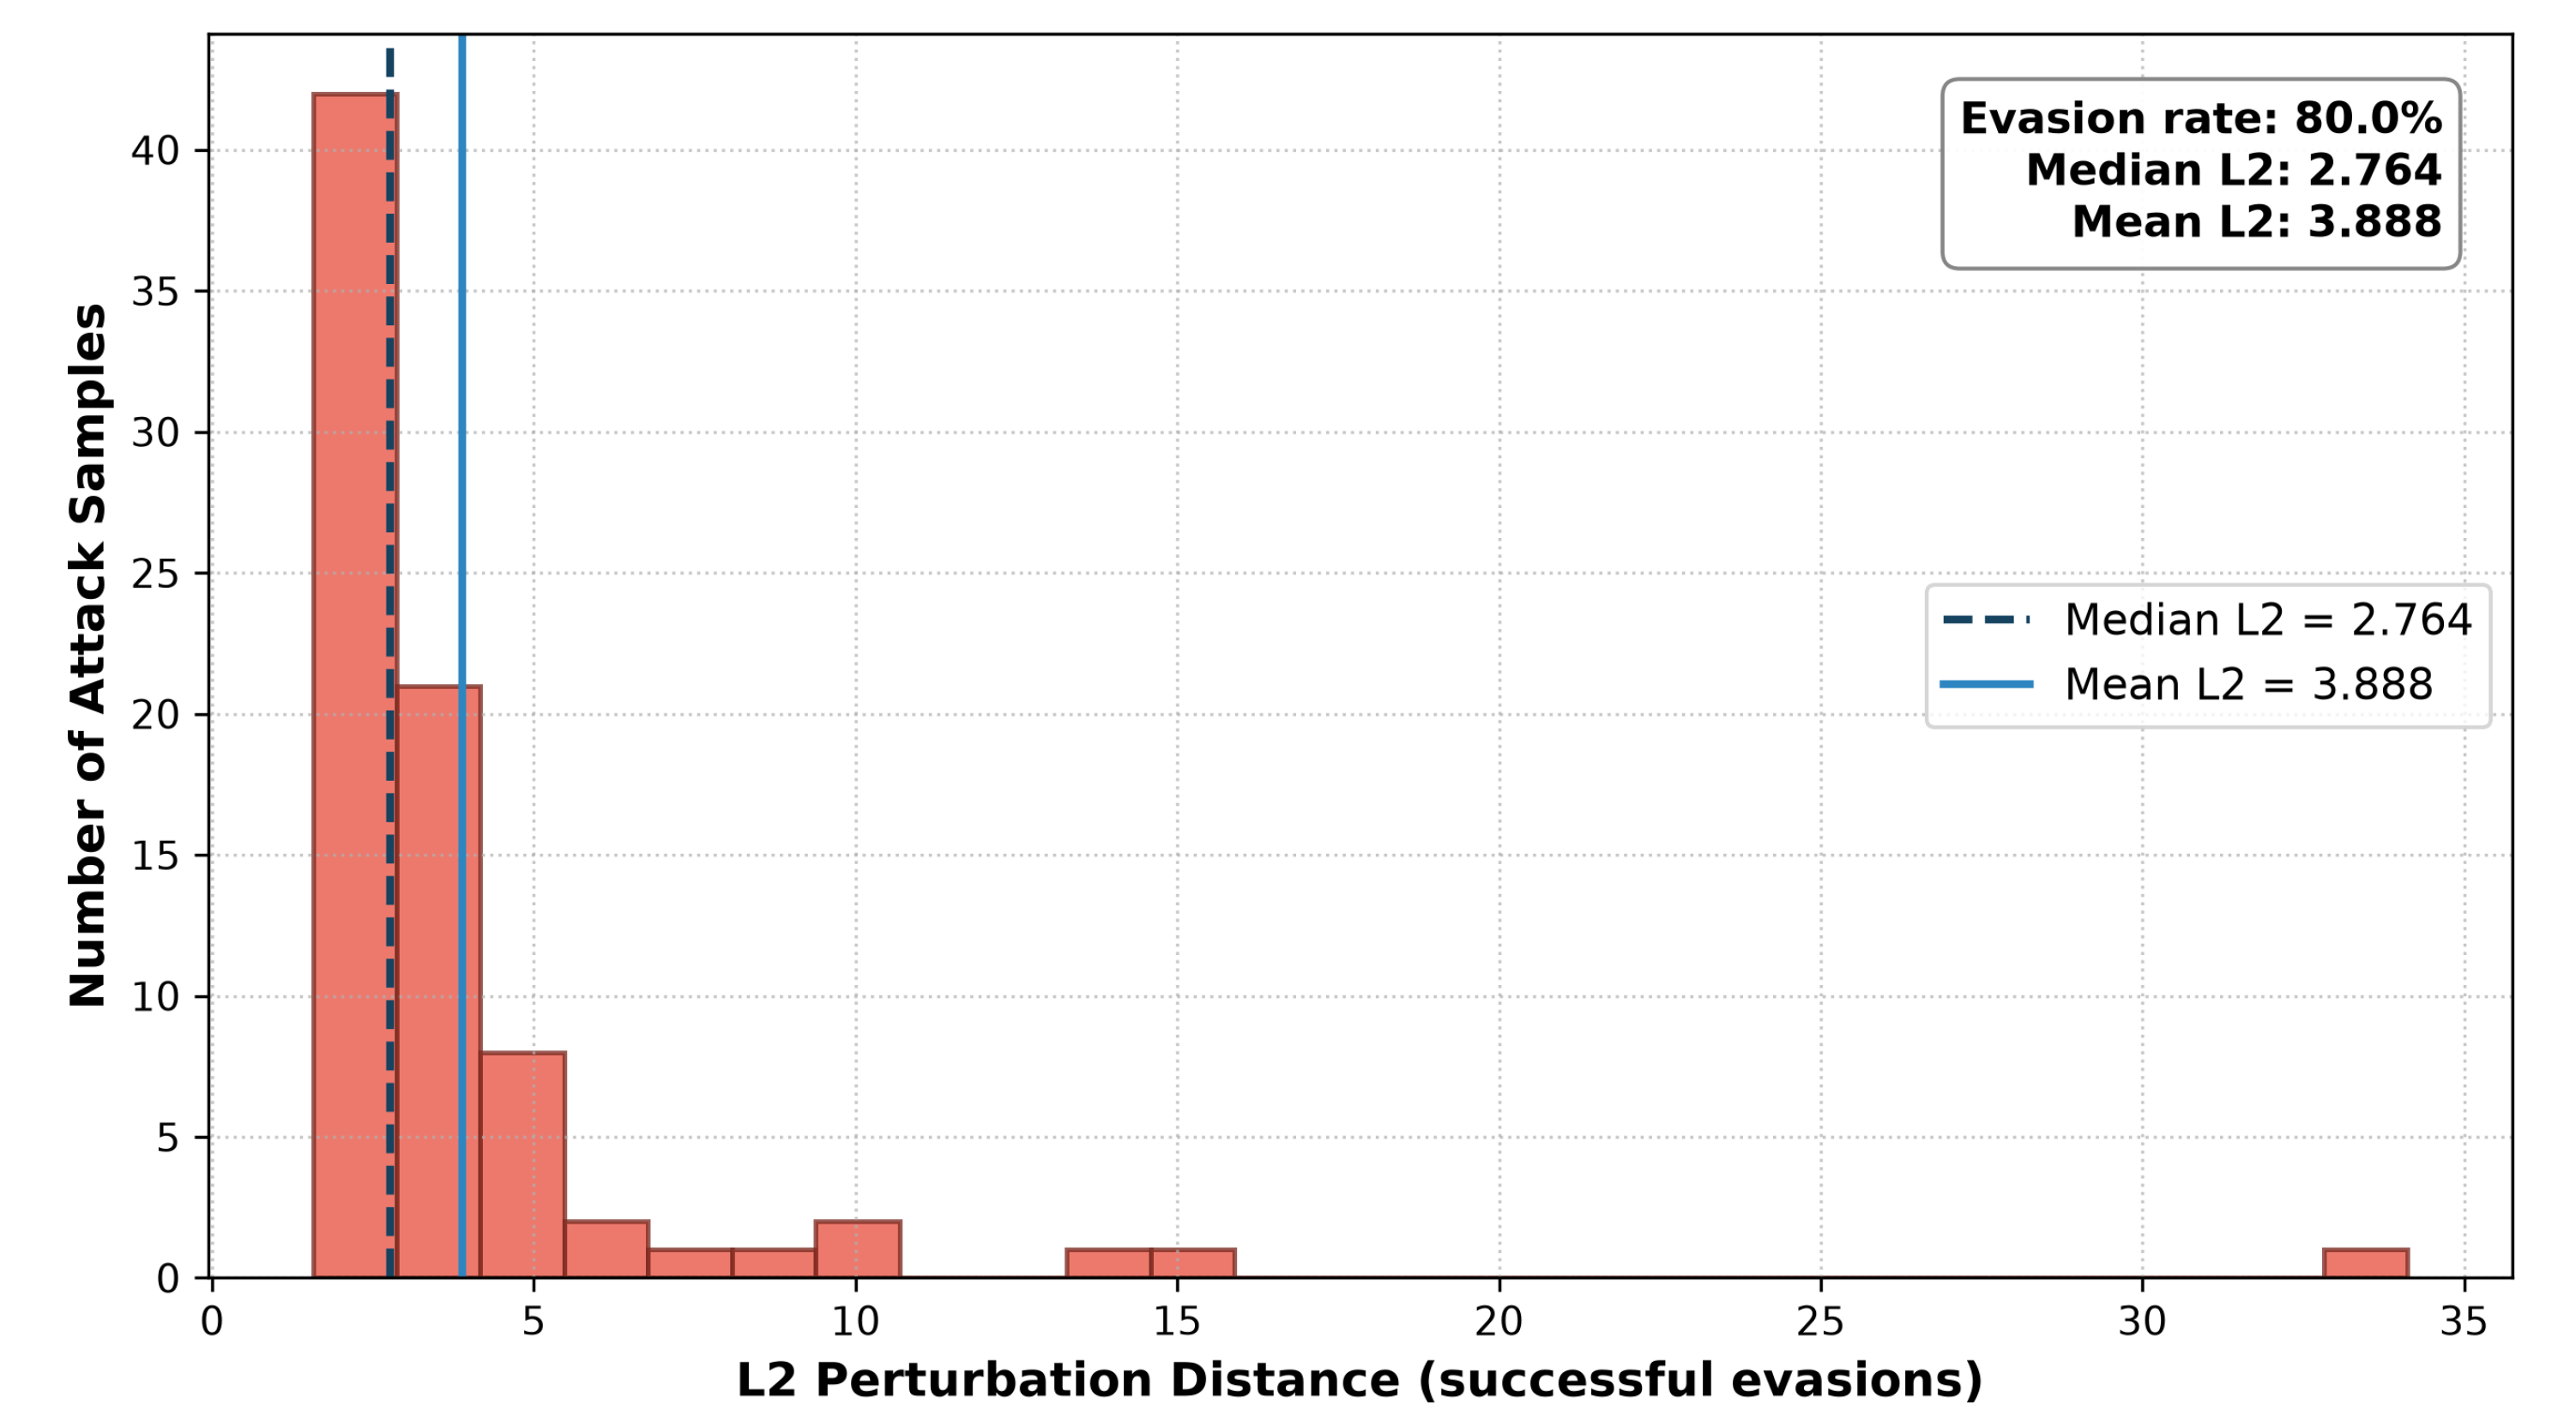

Table 1.
Feature correspondence across the investigated datasets.
| Concept | WSN-DS | SensorNetGuard | NSL-KDD | CIC-IDS2017 |
|---|---|---|---|---|
| Packet activity rate | derived from SCH_S | Packet_Rate | count | Flow Duration + Total Fwd Packets |
| Transmitted data volume | Data_Sent_To_BS | Data_Throughput | src_bytes | Total Fwd Packet Length |
| Error / loss behavior | derived drop ratio | Error_Rate,Packet_Drop_Rate | serror_rate | Fwd Packets Dropped |
| Neighbor / CH interaction | ADV_R,ADV_S | implicit | srv_count,dst_host_count | Flow IAT |
| Energy / resource state | Expanded Energy | Battery_Level,Energy_Consumption_Rate | not available | not available |
Table 2.
Performance Comparison of Intrusion Detection Models on WSN-DS Dataset.
| Model | Features | Accuracy | Macro F1 | Train Time (s) | Inference (ms) | Size (KB) |
|---|---|---|---|---|---|---|
| XGBoost (16 Features) | 16 | 0.9943 | 0.9663 | 5.57 | 0.0034 | 1140.66 |
| LightGBM (16 Features) | 16 | 0.9943 | 0.9667 | 4.89 | 0.0065 | 1718.37 |
| FlowerSec IDS (Top-8) | 8 | 0.9884 | 0.9494 | 4.10 | 0.0066 | 1715.68 |
Table 3.
Comparison with State of the Art WSN Intrusion Detection Methods on WSN DS.
| Study / Method | Features | Accuracy | Macro F1 | Inference Time | Key Distinction / Limitation |
|---|---|---|---|---|---|
| Almomani et al. (Voting + PSO) [27] | 19 (All) | 99.99% | approximately 98.5% | Not Reported | High computational overhead; lacks explainability. |
| Lightweight XGBoost [9] | 19 (All) | 99.73% | approximately 97.0% | Reduced by 68% | No architectural mapping to WSN topology. |
| FlowerSec IDS (Ours) | 8 (SHAP) | 98.84% | 94.94% | 0.0066 ms | Explainable, 50% feature reduction, mapped to Seed node architecture. |
Disclaimer/Publisher’s Note: The statements, opinions and data contained in all publications are solely those of the individual author(s) and contributor(s) and not of MDPI and/or the editor(s). MDPI and/or the editor(s) disclaim responsibility for any injury to people or property resulting from any ideas, methods, instructions or products referred to in the content. |
© 2026 by the authors. Licensee MDPI, Basel, Switzerland. This article is an open access article distributed under the terms and conditions of the Creative Commons Attribution (CC BY) license (http://creativecommons.org/licenses/by/4.0/).
Copyright: This open access article is published under a Creative Commons CC BY 4.0 license, which permit the free download, distribution, and reuse, provided that the author and preprint are cited in any reuse.