

Submitted:
31 August 2026
Posted:
01 September 2026
You are already at the latest version
Abstract
The quality of life (QoL) in social housing can be affected by many spatial and urban design features. Nevertheless, those are included in assessment models without a common quantitative model for their implementation. Therefore, a mathematical model for assessment of the contribution of spatial and urban design to QoL in Iraqi social housing was proposed. The developed model included five main indicators concerning accessibility, social sustainability and density, road network efficiency, safety and security and urban identity and social interaction. Indicator weights were estimated based on assessments by experts and residents, with indicator values normalized to a 0–1 scale. The proposed model was implemented for evaluation of three residential complexes in Mosul, Iraq. The weighting procedure involved 220 households and a multidisciplinary panel of 20 experts. The indicator with the highest integrated weight was social sustainability and urban density. Accessibility to basic facilities followed with the next highest weight. QoL estimated by the model was equal to 0.32 for Al-Khadraa, 0.42 for Al-Hadbaa and 0.50 for Al-Shurooq. The developed model produced the same ranking as the independent OPQoL assessments. The sensitivity analysis showed that ranking did not change under 50:50, 60:40 and 40:60 expert-resident weighting scenarios.
Keywords:
quality of life
; social housing
; urban design
; spatial indicators
; mathematical model
; composite index
; Iraq
1. Introduction
QoL has been a long-standing challenge in terms of its definition and measurement [1]. Its definition goes beyond the economic and healthcare concepts to encompass social, environmental, and spatial conditions [1]. The physical space becomes especially significant for residents of socially disadvantaged neighborhoods, which include social and subsidized housing [1,2]. It might have an impact on residents’ experience, feelings of belonging, well-being, and spatial justice [1,2]. There is a growing amount of research on these interconnections in urban planning, architecture, and social housing setting. Density, quality of public space, proximity of services, and diversity of functions are connected to residential satisfaction, security, and cohesion [3,4]. At the same time, there is limited integration of these urban and spatial characteristics within quantitative assessment frameworks. A number of international approaches to evaluating QoL exist, including WHOQOL and other multidimensional assessment tools [5]. They usually cover social, economic, health, environmental, and residential aspects. At the same time, spatial and urban design factors usually constitute only a part of more extensive QoL assessment frameworks. Thus, a combined contribution of these factors to residential QoL needs to be evaluated quantitatively. For this reason, this research proposes a mathematical model for assessing the contribution of spatial and urban design factors to QoL in social housing. Public spaces, density, mobility network, service proximity, safety, and other urban characteristics are taken into account in the model. Field observations, spatial measurements, experts’ and residents’ estimations become the basis for collecting information necessary for the model. Experts’ and residents’ evaluations are used to assign weights to the key urban design dimensions. Indicators are normalized and combined into a weighted mathematical model for comparison of residential environments. The model is employed in three social housing blocks in Mosul, Iraq. The overall perceived QoL (OPQoL) of the residents in the housing blocks is taken into account in order to compare their perception with the results generated through the model. The aim of this comparison is to evaluate how well the proposed model corresponds to the differences seen by the residents in the selected residential blocks. The proposed model is an attempt to quantify the contribution of urban and spatial design to residential QoL.
Research problem
Although the research on QoL in the area of housing has been increasing, a lot of it has concentrated on social or economic issues [6]. The quantitative connection between urban variables and QoL is still poorly developed especially regarding social housing. As far as the Iraqi situation is concerned, local mathematical models for objective assessment of urban conditions in terms of QoL are still scarce.
Research objective
This research attempts to evaluate QoL in existing social housing projects in Iraq using a mathematical model based on urban indicators.
2. Theoretical Background
2.1. Quality of Life in Urban Design
QoL has become an important concept in urban design, particularly in social housing and high-density residential environments. Built-environment characteristics can influence residents’ experiences, well-being, satisfaction, and sense of belonging [2,3]. Urban design indicators therefore represent important components within frameworks for evaluating QoL [6,7]. Recent approaches integrate spatial indicators and multidimensional sustainability measures to provide broader assessments of urban living conditions [4,8,9].
2.2. Accessibility and Spatial Distribution of Services
Accessibility to essential services is consistently associated with urban QoL. Research in Kuala Lumpur identified relationships between proximity to basic facilities, neighborhood satisfaction, and perceived urban QoL [10]. Planning literature also identifies accessibility as an important link between urban conditions and subjective well-being [1,6]. Universal design supports equitable access through inclusive pedestrian infrastructure, ramps, and barrier-free environments [11,12]. Access to green spaces is also associated with psychological and physiological benefits. Ulrich showed that exposure to natural views can support recovery outcomes [13]. Research in Egypt examined green-space ratios and land-use balance within sustainable residential development [14]. These findings relate to Lynch’s emphasis on paths, accessible routes, and defined spaces in shaping urban experience [15].
2.3. Density, Diversity, and Social Interaction
The relationship between density and QoL depends on its balance rather than density alone. Research in Jordan showed that spatial configuration influences social sustainability and community interaction [16]. A Baghdad study identified participation, safety, and social interaction as important factors within multifamily housing environments [17]. Research in Kuwait also associated sustainable housing design with community engagement and residential satisfaction [18]. Social sustainability research further links physical layout with social cohesion and identity [2,19]. These studies indicate a relationship between spatial design and patterns of social interaction.
2.4. Environmental Quality and Urban Health
Environmental quality is an important component of urban QoL [20]. Previous research has linked environmental conditions with human well-being [3]. Environmental psychology also identifies relationships between the built environment and mental health outcomes [20,21]. Urban analysis therefore considers pollution exposure, green-space access, and spatial inequalities as relevant environmental conditions [22]. Gruehn identified measurable relationships between urban green spaces and perceived QoL in European cities [23]. Urban Forest research also shows the role of tree canopy in reducing urban heat effects [24]. Abdelmejeed and Gruehn demonstrated relationships between urban morphology, tree distribution, and pedestrian thermal comfort [25]. These findings connect urban form and vegetation with microclimatic performance and environmental experience.
2.5. Mobility and Street Network Structure
Mobility and street networks are basic components of residential quality. Connectivity and permeability can improve access to opportunities and reduce spatial isolation [1]. Walkability studies associate sidewalk continuity, safety, and human-scale design with health, sustainability, and livability [26]. Street connectivity research also links block size and network configuration with accessibility and movement efficiency [27]. Spatial-network tools provide quantitative methods for measuring integration and connectivity [28]. Universal design also emphasizes accessibility for elderly people and persons with disabilities [11,12]. Multimodal transport assessment supports integrating walking, cycling, and public transport within equitable mobility systems [29]. These principles correspond with Lynch’s identification of paths and nodes as structural elements of urban organization [15]..
2.6. Safety, Surveillance, and Defensible Space
Safety is a basic requirement of residential environments. Jacobs associated active frontages and natural surveillance with safer street environments [30]. Newman extended this principle through defensible space and the relationship between spatial organization and territorial control [31]. CPTED research identifies lighting, visibility, enclosure, and territorial definition as spatial factors related to safety [32,33]. Research in sustainable housing also indicates that perceived safety influences residential satisfaction [34]. These findings relate to Lynch’s emphasis on spatial legibility and visibility within urban experience [15].
2.7. Identity, Place Attachment, and Belonging
Urban design can influence QoL dimensions related to identity and place attachment. European research has examined relationships between city characteristics and variations in life satisfaction [35]. Sustainable housing studies also emphasize spatial quality and satisfaction in supporting residents’ sense of belonging [20,36]. Lynch’s concept of imageability explains how landmarks, edges, and nodes contribute to spatial identity [15]. Multidimensional QoL approaches further combine physical, social, and perceptual dimensions within assessment frameworks [36].
2.8. Digital Infrastructure and Emerging Indicators
Recent QoL research increasingly considers digital systems within urban sustainability. Research in Amman identifies technological integration and governance modernization within emerging urban development strategies [37]. However, regional evidence directly connecting digital infrastructure with subjective well-being remains limited. Digital transformation research indicates relationships between technological systems, service efficiency, and institutional performance [38]. Multidimensional QoL models also consider infrastructure and governance alongside spatial and environmental indicators [36].
Research Gap
There have been numerous studies on Quality of Life in the residential environment; however, many of the studies have considered social and physical aspects of residential settings [19]. On the other hand, some studies employed spatial analysis, urban patterns metrics, and geographic information system (GIS) to evaluate different QoL indicators [9]. Such techniques do not necessarily relate to the social housing condition, planning standards, and local context. Moreover, composite indicator models have largely concentrated on socioeconomic variables rather than on urban design and morphological indicators [39,40]. In Iraq, limited empirical studies exist on the QoL in social housing despite the socio-cultural and post-conflict urban conditions prevailing in the country [41,42]. Previous approaches show limited integration of measurable urban design indicators with national housing standards [43], GIS-based measurements [44], Space Syntax indicators [45], and structured weighting techniques [46,47]. These approaches have been limitedly combined in a single model for Iraqi social housing conditions. This study develops a mathematical model for assessing the contribution of spatial and urban design factors to Quality of Life in Iraqi social housing. It is developed by integrating measurable spatial and urban design indicators within a structured quantitative approach. Spatial analysis, configurational evaluation, and weighting are utilized to compare urban conditions of selected residential complexes. Literature review highlights accessibility, social sustainability, mobility, safety, environmental quality, and urban identity as important urban QoL dimensions [1,2,3,6,7]. Table 1 lists the important urban QoL indicators based on the literature. Table 1 organizes these indicators as measurable spatial and urban design variables for the proposed model.
Table 1 synthesizes the literature into five mains urban QoL dimensions. Overlapping concepts were consolidated to avoid duplication between indicators. The resulting dimensions cover accessibility, social sustainability, mobility, safety, identity, and environmental performance. These dimensions were then operationalized into measurable sub-indicators, as presented in Table 2.
3. Scope and Delimitations
QoL is a multidimensional construct which includes various social, health, economic, environmental and other dimensions [48]. This study concentrates on quantifiable spatial and urban design indicators associated with QoL in social housing. The scope of this study consists of indicators specified in Table 2. Their choice is based on the measurability, availability and feasibility of their quantitative evaluation. The selected indicators include accessibility, density, social sustainability, mobility, safety, identity, social interaction, and environment. The chosen indicators are assessed through spatial analysis, field observations, administrative information, and resident evaluations. Other social, economic, health and psychological indicators which fall beyond the scope of urban design are not quantified. Thus, the model estimates the contribution of spatial and urban design factors to QoL but not the overall QoL. The practical application of the model is limited to three selected residential complexes in Mosul, Iraq. The weights of indicators in the model are determined by expert and resident evaluations within the framework of the current study. In this regard, the results of the study have to be understood within the geographical and contextual boundaries of selected residential complexes. Further application of the model to independent residential complexes is necessary to evaluate its external validity.

Table 2.
Classification of Spatial and Urban Design Indicators and Their Measurement Scales (Prepared by the authors).
Table 2.
Classification of Spatial and Urban Design Indicators and Their Measurement Scales (Prepared by the authors).
| Code | Main Indicator | Sub-indicator | Measurement / Description | Data / Tool | Supporting References |
|---|---|---|---|---|---|
| U1 |
Accessibility to Basic Services |
U1.1 Healthcare accessibility | Network distance to nearest healthcare facility; threshold = 800 m | GIS network analysis; Iraqi planning standards | [1,28,43] |
| U1.2 Education accessibility | Network distance to nearest school; threshold = 600 m | GIS network analysis; Iraqi planning standards | [28,43] | ||
| U1.3 Public transport accessibility | Distance to nearest public transport stop; threshold = 500 m | GIS network/service-area analysis | [28,43] |
||
| U1.4 Green-space accessibility | Distance to nearest public green/open space; threshold = 300 m | GIS service-area analysis; land-use maps | [5,43] |
||
| U1.5 Land-use mix | Distribution of land uses using a normalized entropy measure | GIS land-use/parcel analysis | [4,8] |
||
|
U2 |
Social Sustainability and Urban Density |
U2.1 Population density | Residents per hectare | Census/household data; GIS |
[2,10] |
| U2.2 Community engagement | Resident participation in community or collective activities | Resident survey | [2,17] |
||
| U2.3 Housing diversity | Distribution of housing types within the residential complex | GIS; housing records | [10,18] |
||
| U2.4 Green-space ratio | Percentage of total site area occupied by green/open spaces | GIS; land-use maps | [23,24,49] |
||
| U2.5 Environmental quality | Assessment of environmental conditions, including pollution and environmental stressors | Environmental records; field/resident assessment | [3,22] |
||
|
U3 |
Road Network Efficiency |
U3.1 Connectivity | Network connectivity based on nodes and links | Space Syntax; GIS network analysis |
[28,45] |
| U3.2 Multimodal transport integration | Integration of walking, public transport, and other available modes | GIS transport layers; field survey | [29] |
||
| U3.3 Walkability | Assessment of pedestrian accessibility and supporting physical conditions | GIS; field assessment | [26] |
||
| U3.4 Universal accessibility | Accessibility of pedestrian routes for users with different physical abilities | Field assessment; accessibility audit | [11,12] |
||
| U3.5 Block size/perimeter | Block dimensions and their relationship with network permeability | GIS spatial analysis | [27] |
||
|
U4 |
Safety and Security |
U4.1 Crime incidence | Reported crime relative to population where records are available | Police/municipal records | [31,32] |
| U4.2 Lighting and visibility | Adequacy of street lighting and visual openness | Field survey; visibility assessment | [30,32] |
||
| U4.3 Pedestrian safety | Pedestrian safety conditions and recorded incidents where available | Traffic data; field safety audit | [26,32] |
||
| U4.4 Natural surveillance | Degree of natural surveillance and territorial control | Field observation; resident assessment | [30,31] |
||
| U4.5 Street enclosure and visibility | Spatial enclosure and visibility affecting perceived security | Field/spatial assessment | [26,30] |
||
|
U5 Code |
Urban Identity, Social Interaction, and Environmental Performance Main Indicator |
U5.1 Place attachment | Resident perception of belonging and attachment | Resident survey; five-point Likert scale | [15,35] |
| U5.2 Public-space use | Observed use of public and open spaces | Field observation; pedestrian counts | [2,15] |
||
| U5.3 Community activities | Frequency and diversity of collective activities | Resident survey; community records | [2,18] |
||
| U5.4 Aesthetic quality | Perceived visual quality of buildings, streets, and public spaces | Expert and resident assessment | [15,34] |
||
| U5.5 Perceived Outdoor Thermal Comfort | Contribution of vegetation and urban form to thermal conditions | GIS; field/environmental assessment | [24,25] |
||
| Digital Infrastructure | Availability and accessibility of digital infrastructure and related services within the residential environment | Resident survey; field assessment; available service/infrastructure records | [37] |
4. Methods and Materials
In this study a quantitative approach was used to develop a mathematical model for assessing the contribution of spatial and urban design factors to QoL in social housing. The model was built on quantifiable spatial and urban design indicators revealed in literature review. The methodology of this study includes research design, case selection, data collection, indicator measurements, normalization, weighting, and mathematical aggregation.
4.1. Research Design
In this study, a quantitative approach was used in order to formulate and evaluate the QoL model that has been developed. The research method included the following steps: indicator identification, case selection, data collection, measurement, normalization, weighting, and aggregation using mathematics. Field and spatial measurements were combined with the assessment of experts and residents in the model formulation. Finally, weighted indicators were mathematically aggregated in order to measure the QoL index for every residential complex. Perceived QoL of residents (OPQoL) was also measured independently for comparison purposes with the model. Figure 1 illustrates the main stages of the research design.
4.2. Study Area
The study was carried out in Mosul city, Iraq. It includes three selected residential complexes where two complexes were established as governmental projects whereas the other one was developed as a result of private investments. The cases have different development times, planning features and residential conditions. These differences provide a comparative background for application of the proposed QoL model.
4.3. Case Studies
Three residential complexes were chosen as case studies: Al-Khadraa, Al-Hadbaa and Al-Shurooq. The cases have differences in terms of development time, planning features and establishment context. Table 3 highlights the main characteristics of the cases under investigation and the basis of comparison between them.
4.3.1. Al-Khadraa Residential Complex
Al-Khadraa is a governmental residential complex located at the left bank of Mosul. This project was constructed in 1997. It consists of 17.5 hectares where multi-story and horizontal housing units exist. The complex is also used as student housing facilities of the University of Mosul. The population of this complex is around 4,000 residents with density of 229 persons per hectare. The complex has educational, healthcare, commercial, green and road networks [41,42].
4.3.2. Al-Hadbaa Residential Complex
Al-Hadbaa is a governmental residential complex located at the left bank of Mosul. The complex was established as part of governmental housing projects after 2003. The complex includes 14.75 hectares of land that contains 504 housing units within 56 mid-rise residential buildings. The population of the complex is between 3,000 and 3,200 residents. The density of the complex is 205 persons per hectare [41,42].
4.3.3. Al-Shurooq Residential Complex
The private residential development, Al-Shurooq, is situated on the left side of Mosul. It spans about 4.5 hectares, with 612 housing units. It consists of 216 units that are horizontal and 396 units that are vertical. The estimated population of the area is about 3,060 people on the basis of 5 individuals per housing unit. Thus, its density is estimated to be about 680 people per hectare. Figure 2 presents the site plans of the three selected residential complexes
4.4. Data Collection and Weighting Procedure
of the five urban indicators. After normalization and integration of the two, the weights of the indicators were arrived at.
Experts were surveyed using the Delphi method which had two rounds [47]. There were 20 experts from six fields of architecture and urban planning. The same experts comprised the two rounds of the survey. 30% of the experts came from architectural design and urban design each. Architectural technology, interior design, environmental architecture, and architectural theory each had 10%. See Figure 3.
Experts were recruited with respect to their educational background and practical experience in the field of architecture and other urban disciplines. In the first round, experts independently assessed the importance of the five main criteria. Their responses were aggregated and submitted back in the form of anonymous feedback prior to the second round. In the second round, experts independently reassessed their assessments and changed them if necessary. Assessments from the second round were accepted as expert evaluations for weighting purposes. This allowed getting two rounds of structured expert judgments while maintaining independent assessment [47].
Resident data were gathered in the form of a structured questionnaire applied to 220 households living in three residential complexes. The sample included 70 residents of Al-Khadraa, 80 residents of Al-Hadbaa, and 70 residents of Al-Shurooq. Households were approached across the three residential complexes so that representation of each case could be ensured. Participants were volunteers, and each participating household was represented by one eligible respondent. Residents independently assessed the relative importance of the five main criteria on a five-point Likert scale. Mean resident evaluations for each of the five main criteria were computed based on 220 responses received. These mean evaluations were normalized to their total value across the 5 main criteria. Thus, resident weights with the total value of 1.00 have been obtained:
Where:: mean resident rating for indicator i., : normalized resident-derived weight of indicator i.
Residents also provided a separate Overall Perceived Quality of Life (OPQoL) assessment through a direct question. The question addressed their overall QoL within the residential complex. The mean OPQoL score was calculated separately for each complex and normalized to a 0–1 scale:
Where:
: normalized overall perceived QoL for residential complex c.
: mean resident rating for complex c.
was excluded from indicator weighting and model aggregation. It was retained only for comparison with the model-derived QoL scores.
Expert ratings were normalized using the same procedure to obtain WE,i. Both weight sets therefore summed independently to 1.00. Equal contributions were assigned to both groups. The final integrated weight was calculated as:
Wi =0.50WE, i +0.50WR, i
Where: WI: integrated weight of indicator i., WE, i: normalized expert-derived weight of indicator i., WRI: normalized resident-derived weight of indicator i.
4.5. Mathematical Model Development
This model is based on normalizing the chosen indicators for comparison. Twenty-six sub-indicators have been classified based on five main indicators which have been identified and shown in Table 2 below. Various methods have been used for measuring the indicators depending on the nature of each indicator. Normalization has been done for all sub-indicators with a scale ranging from 0 to 1. Sub-indicators within each main indicator have been combined using equal weights while weights of experts/residents have been used only for main indicators.
4.5.1. Indicator Measurement and Normalization
Accessibility to Basic Services (U1)
Main Indicator U1: Accessibility to Basic Services (5 sub-indicators)
This dimension evaluates the ease of access to essential urban services.
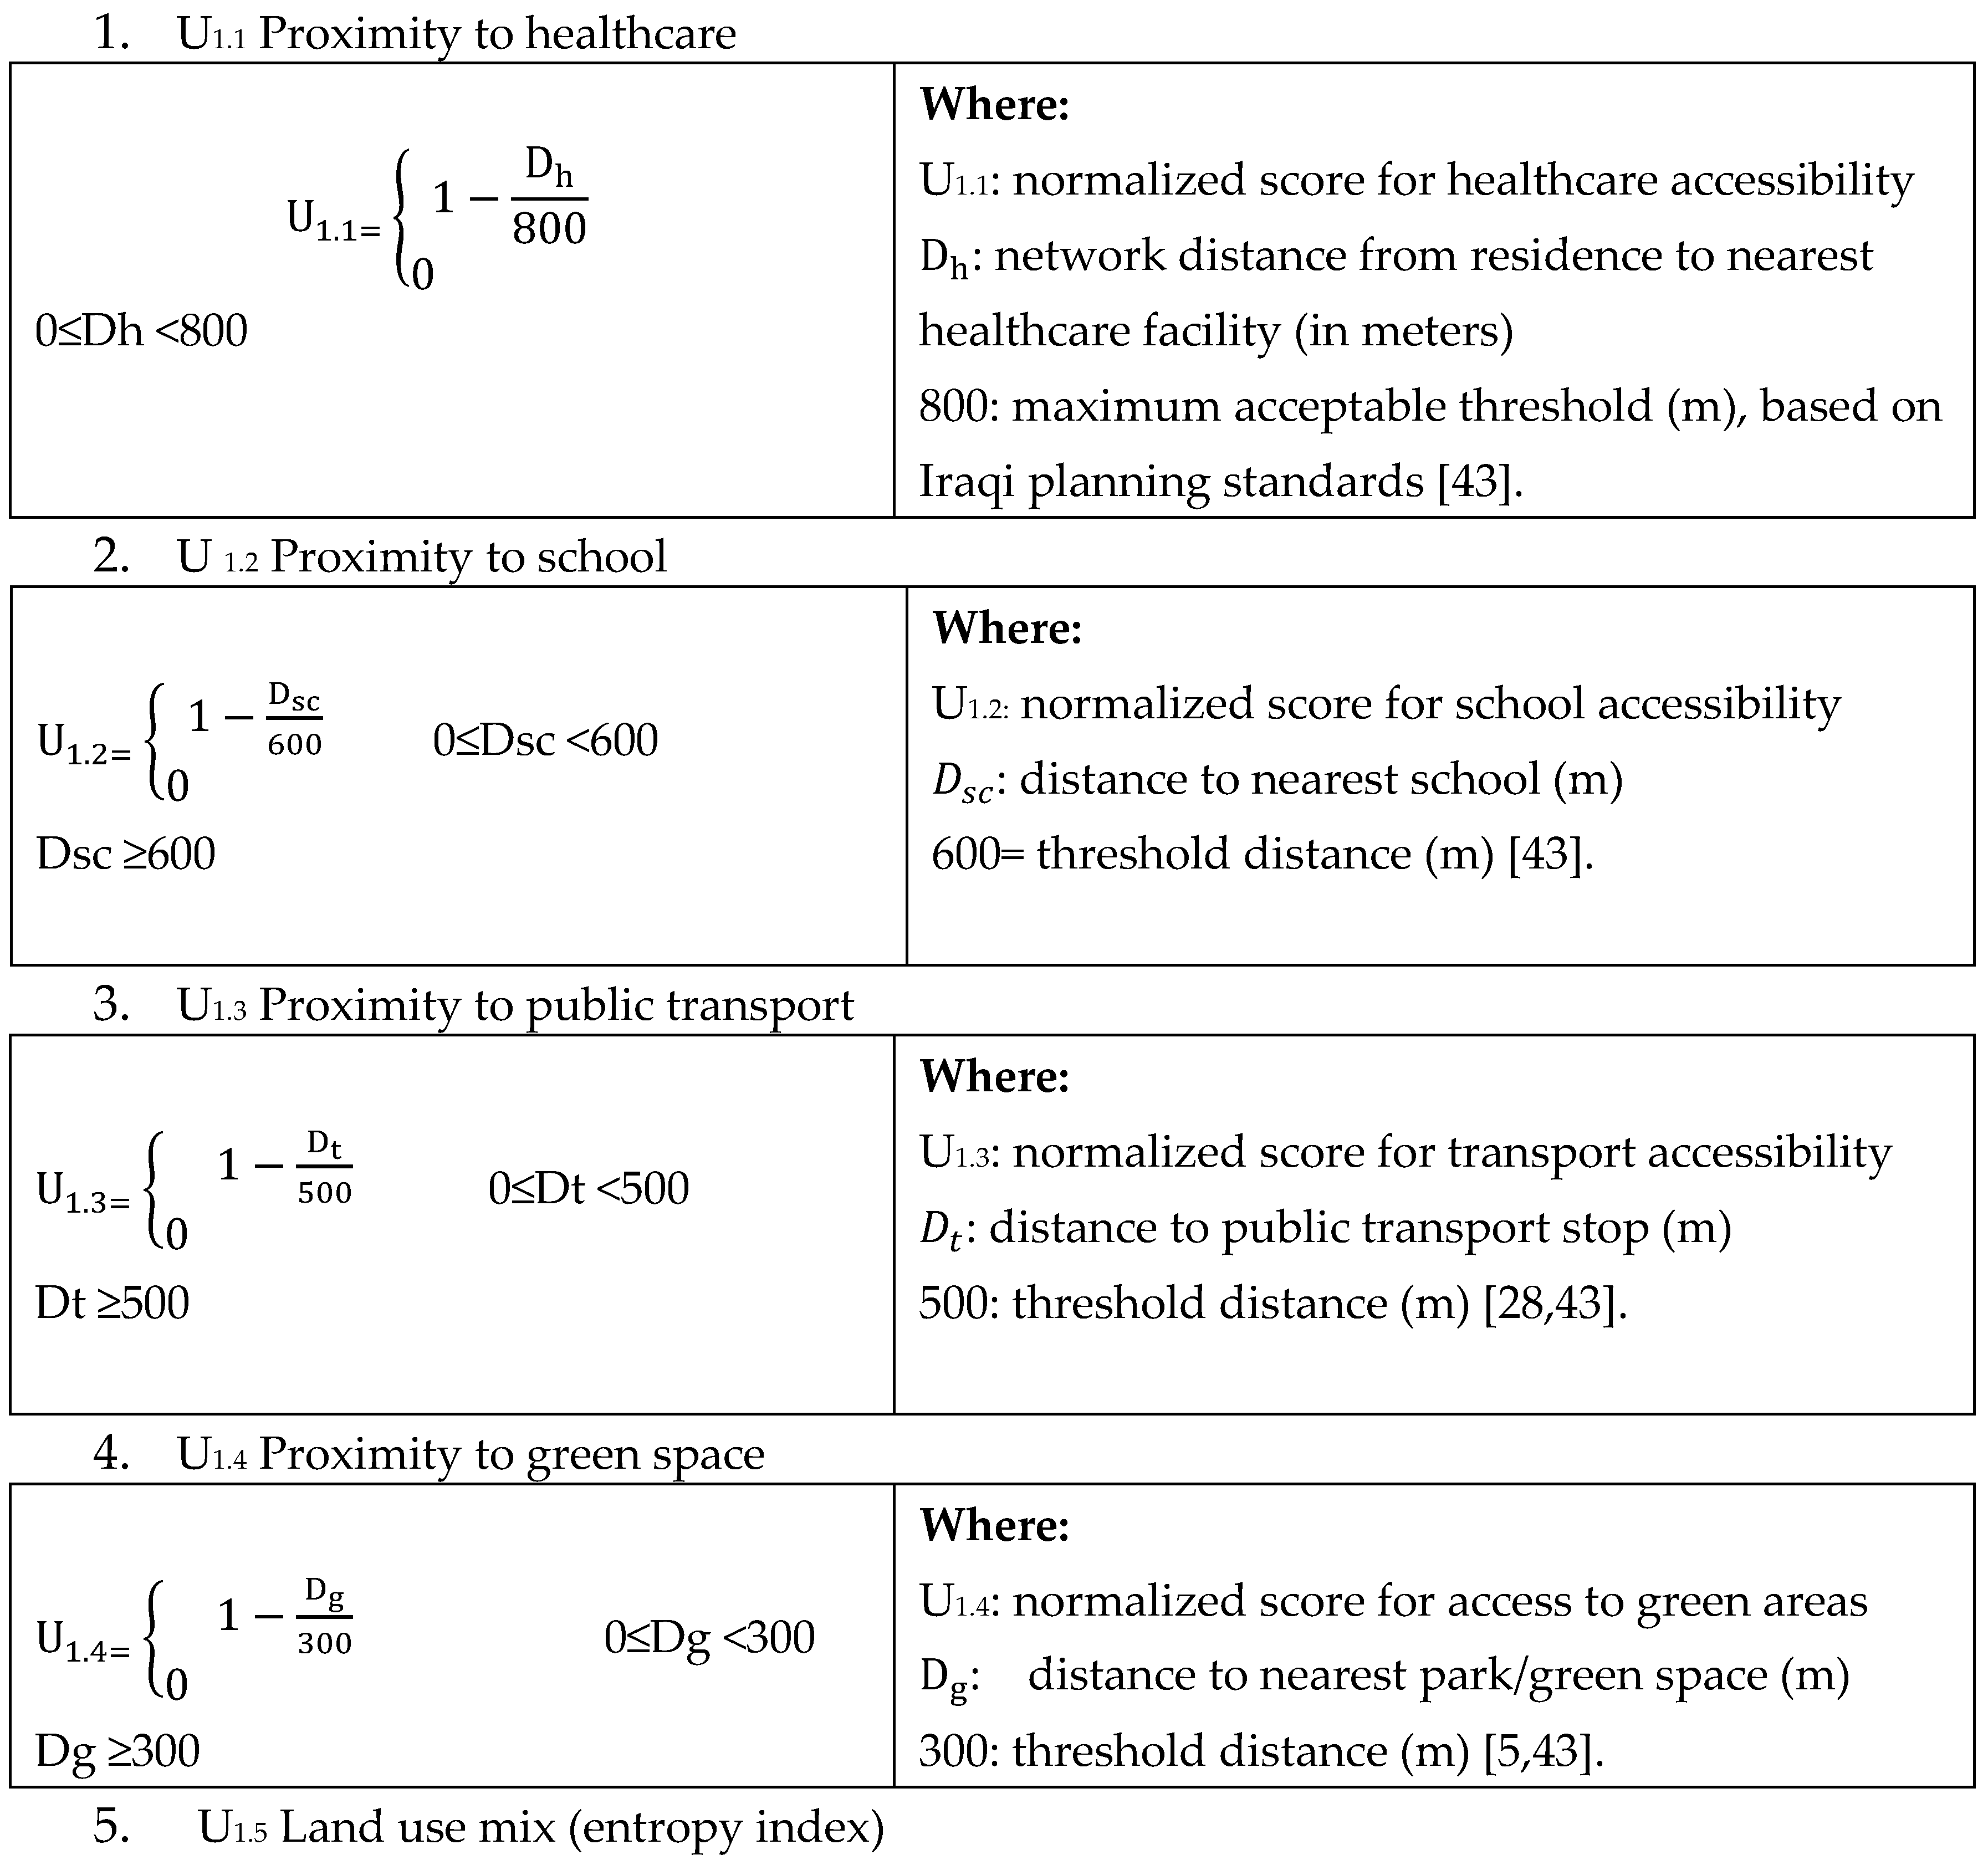
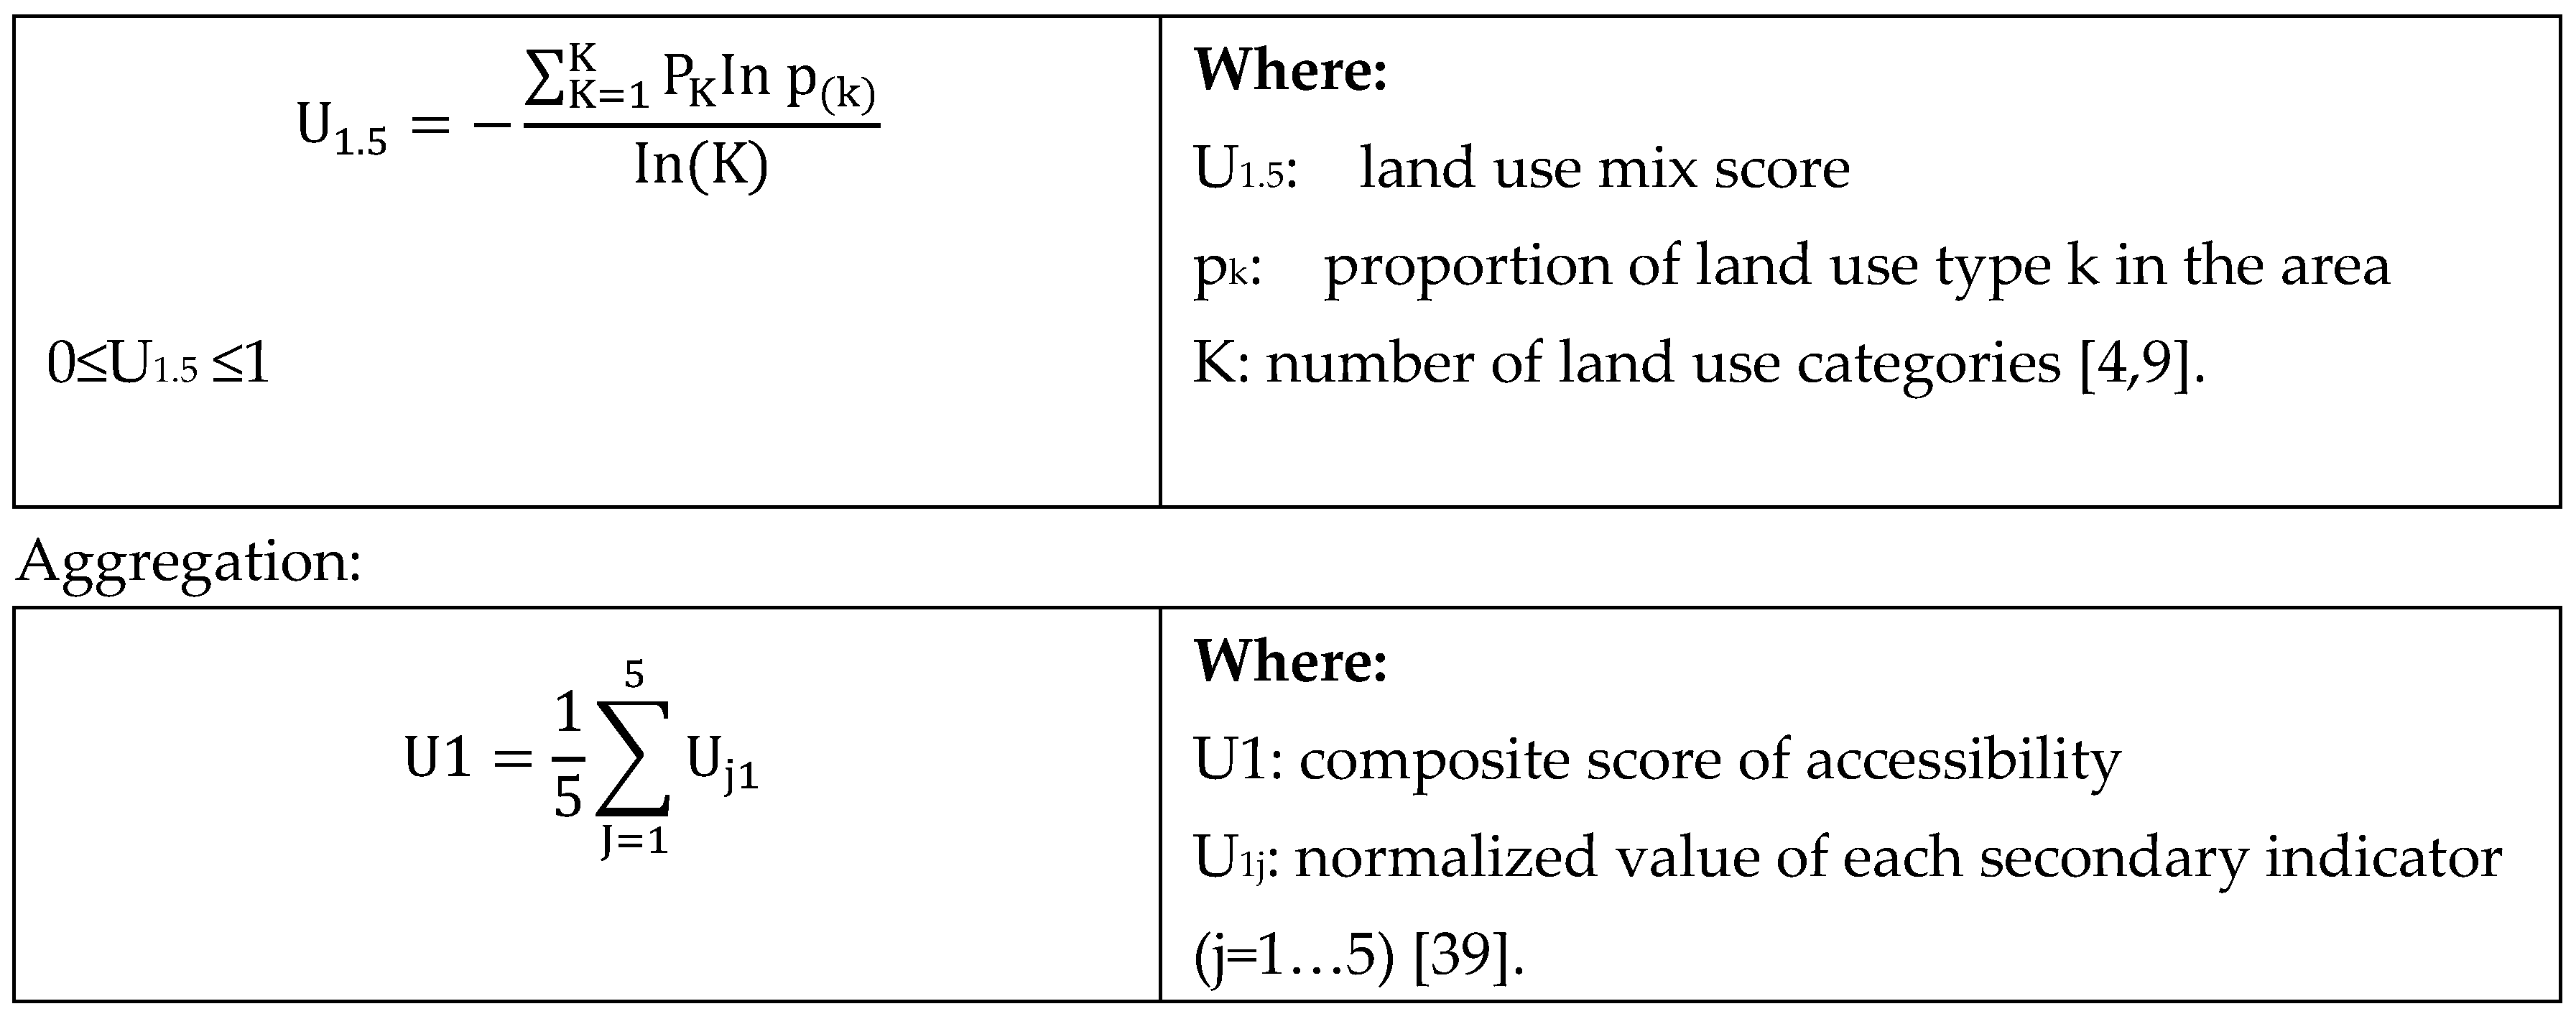
Main Indicator U2: Social Sustainability & Density (5 sub-indicators)
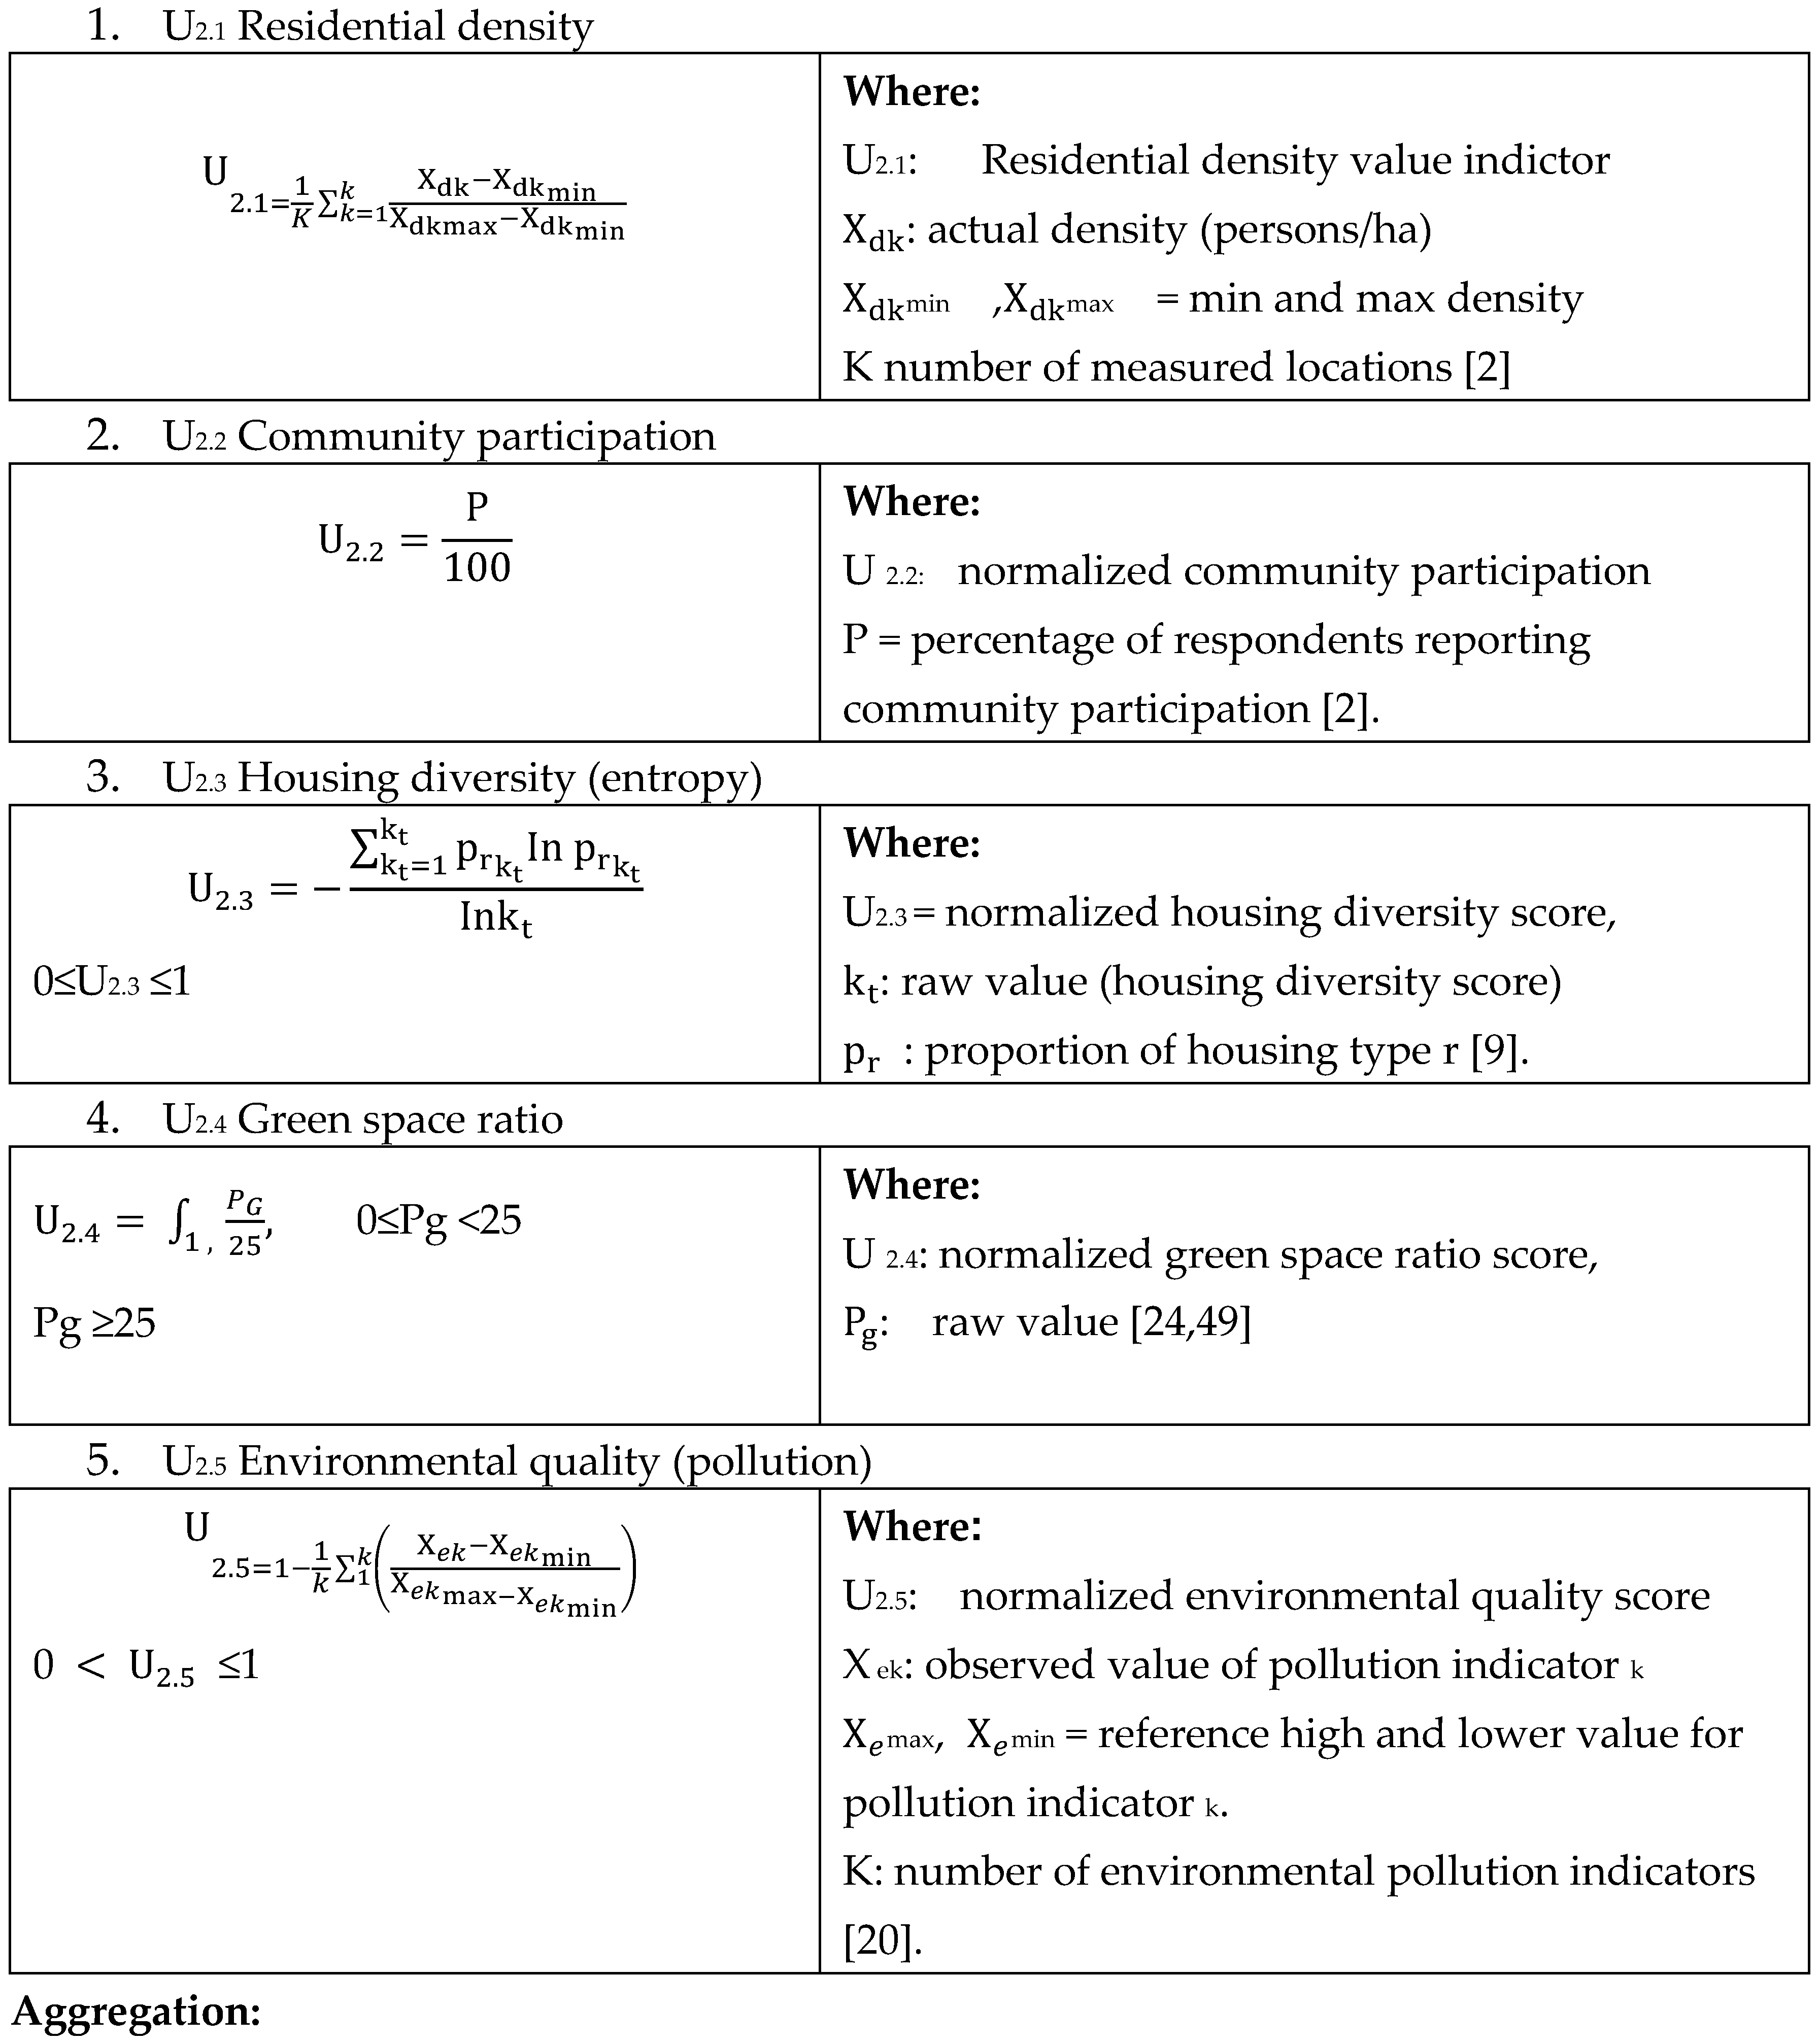

Main Indicator U3: Road Network Efficiency (5 sub-indicators)
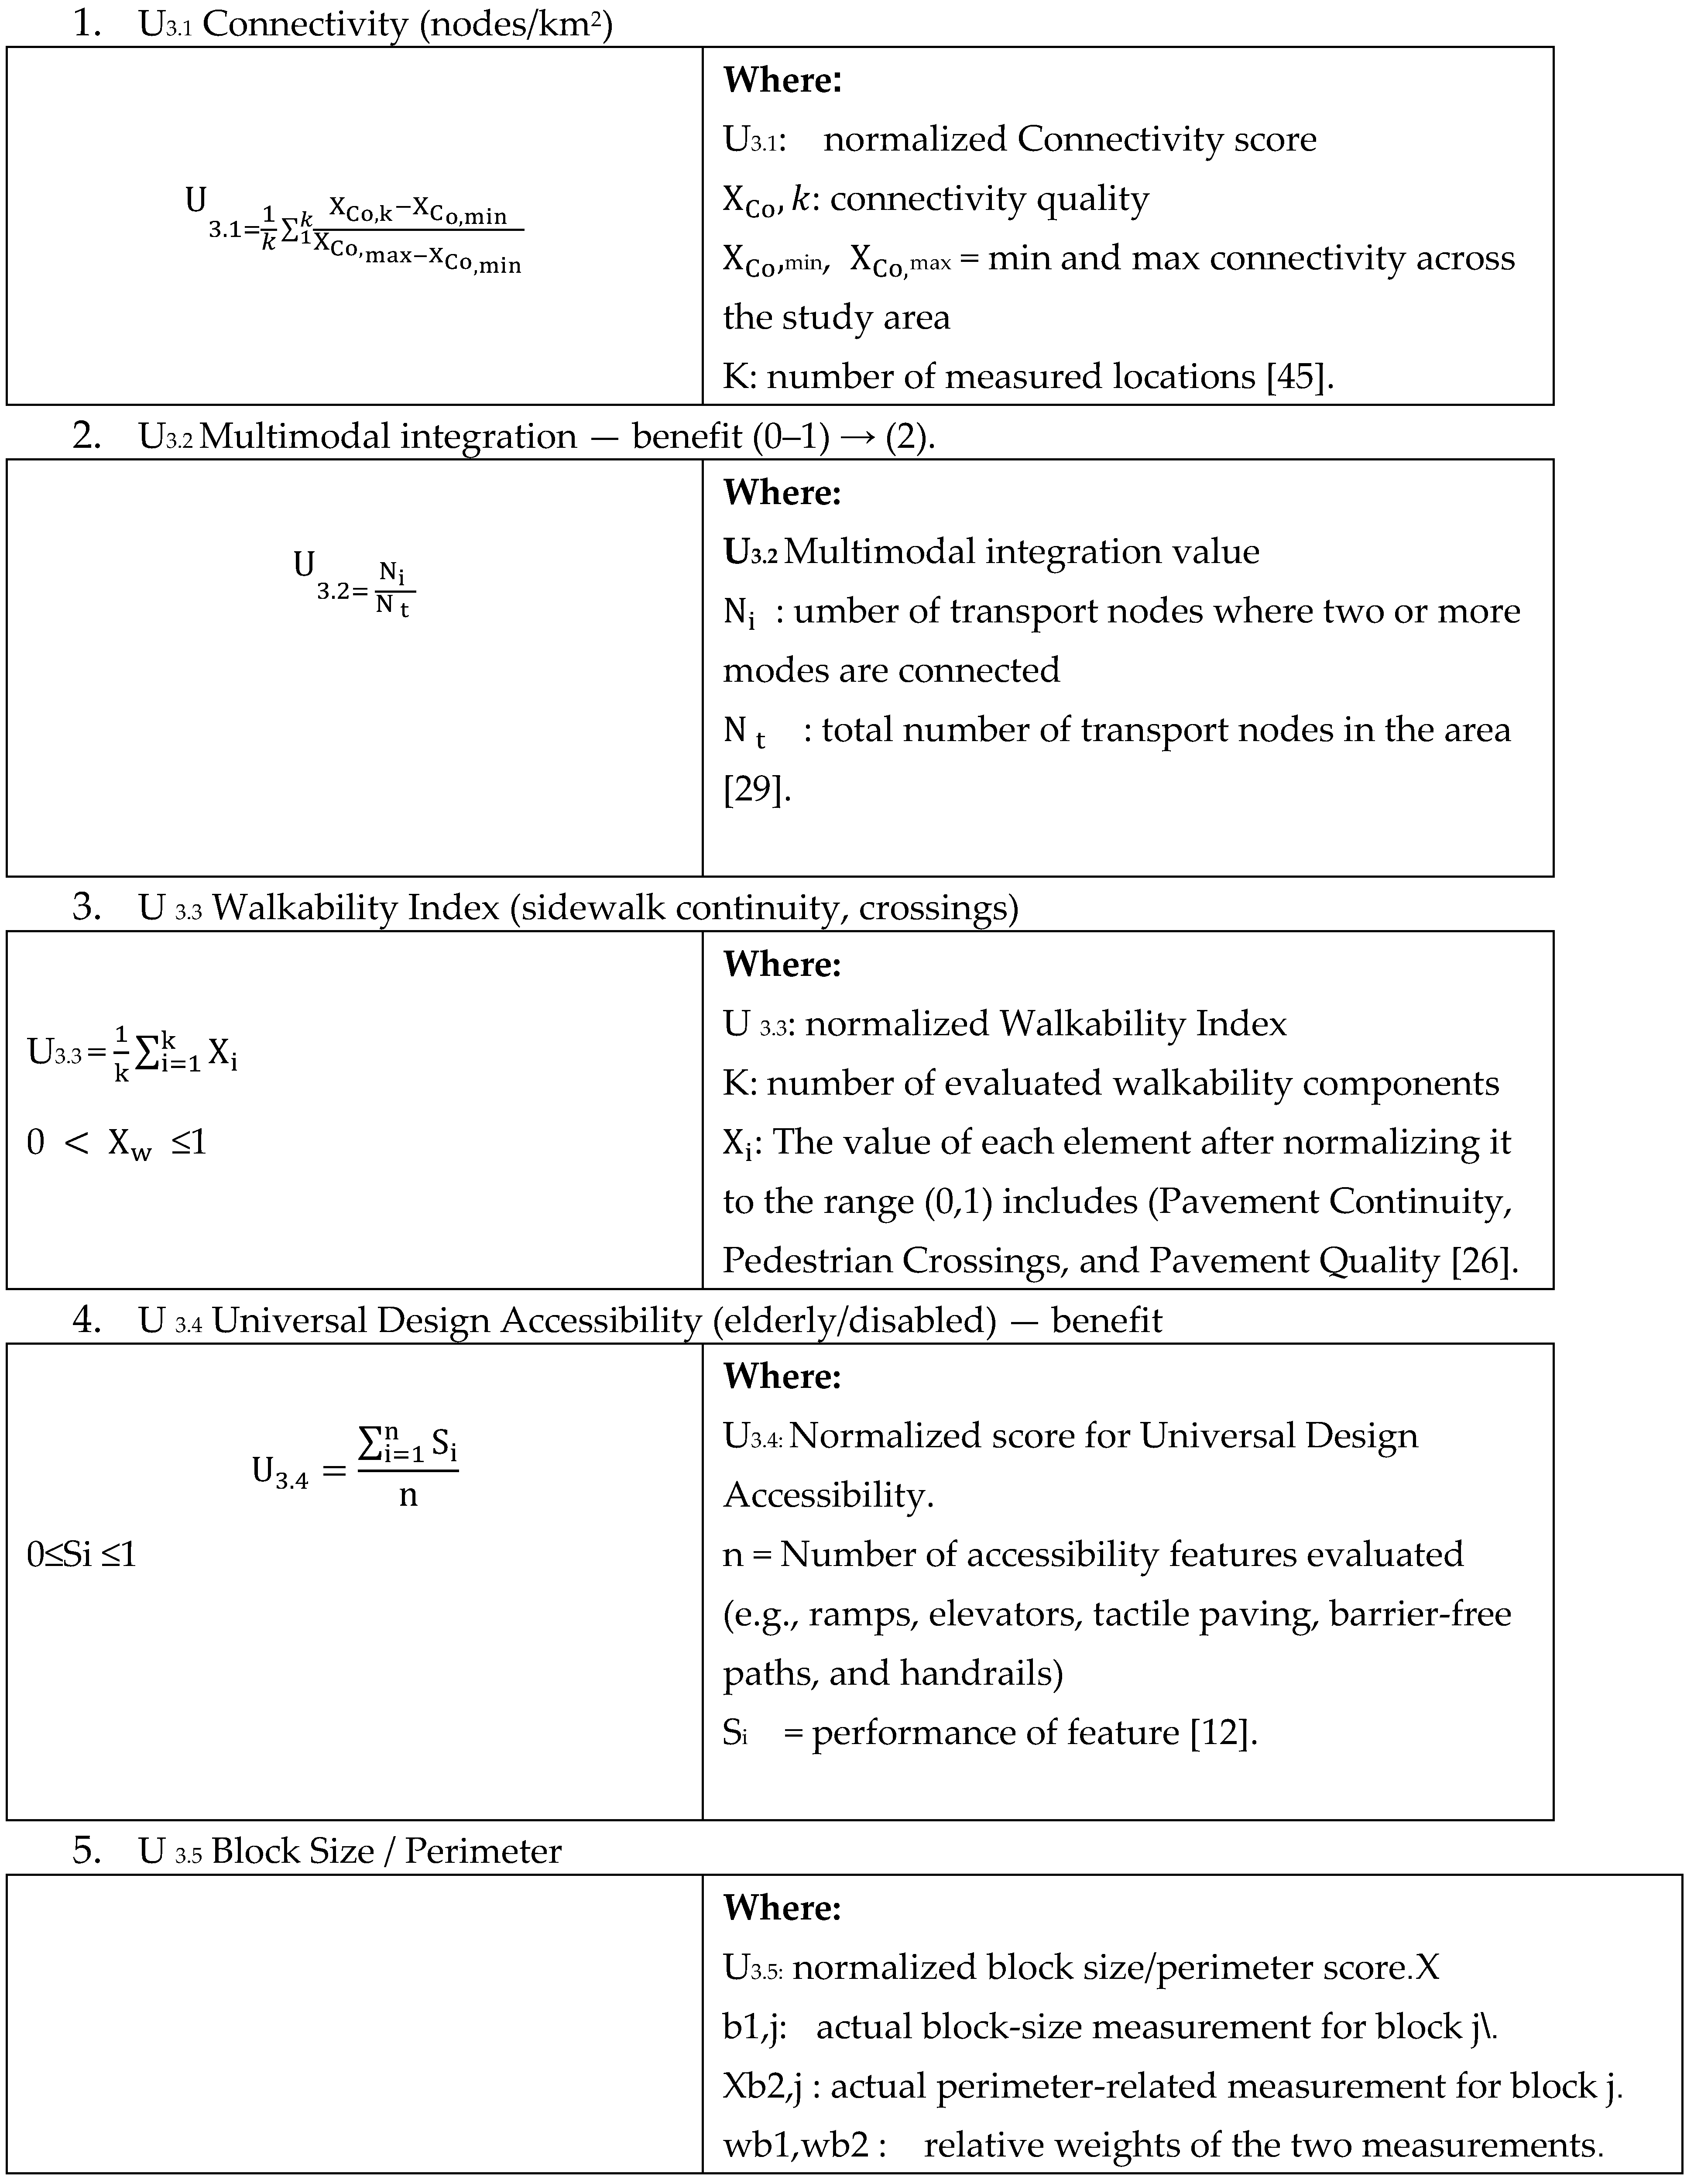
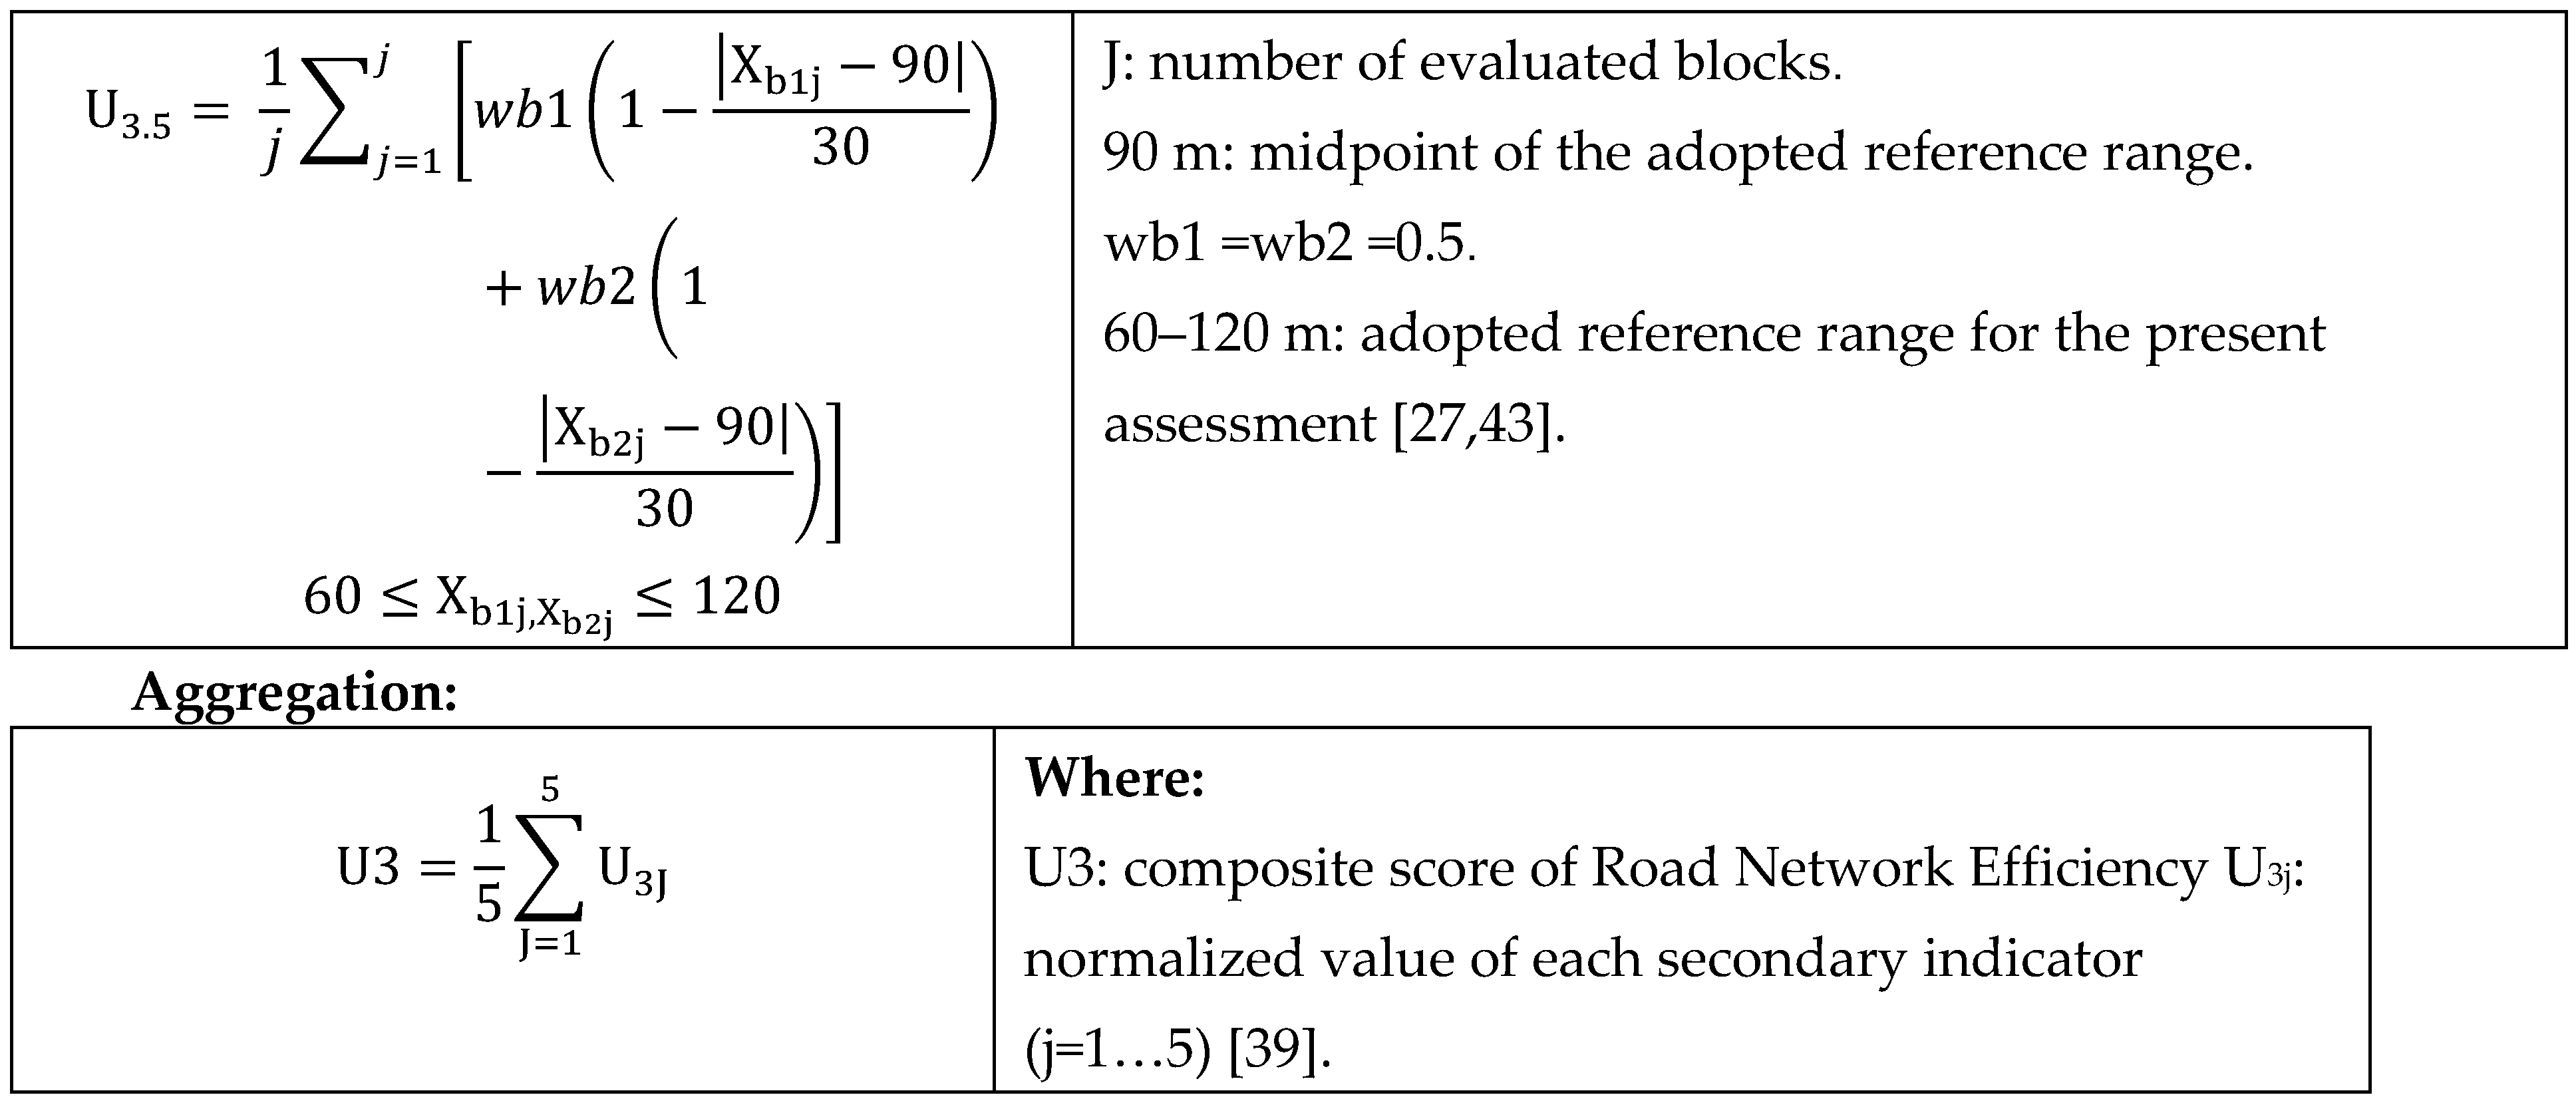
Main Indicator U4: Safety & Security (5 sub-indicators)
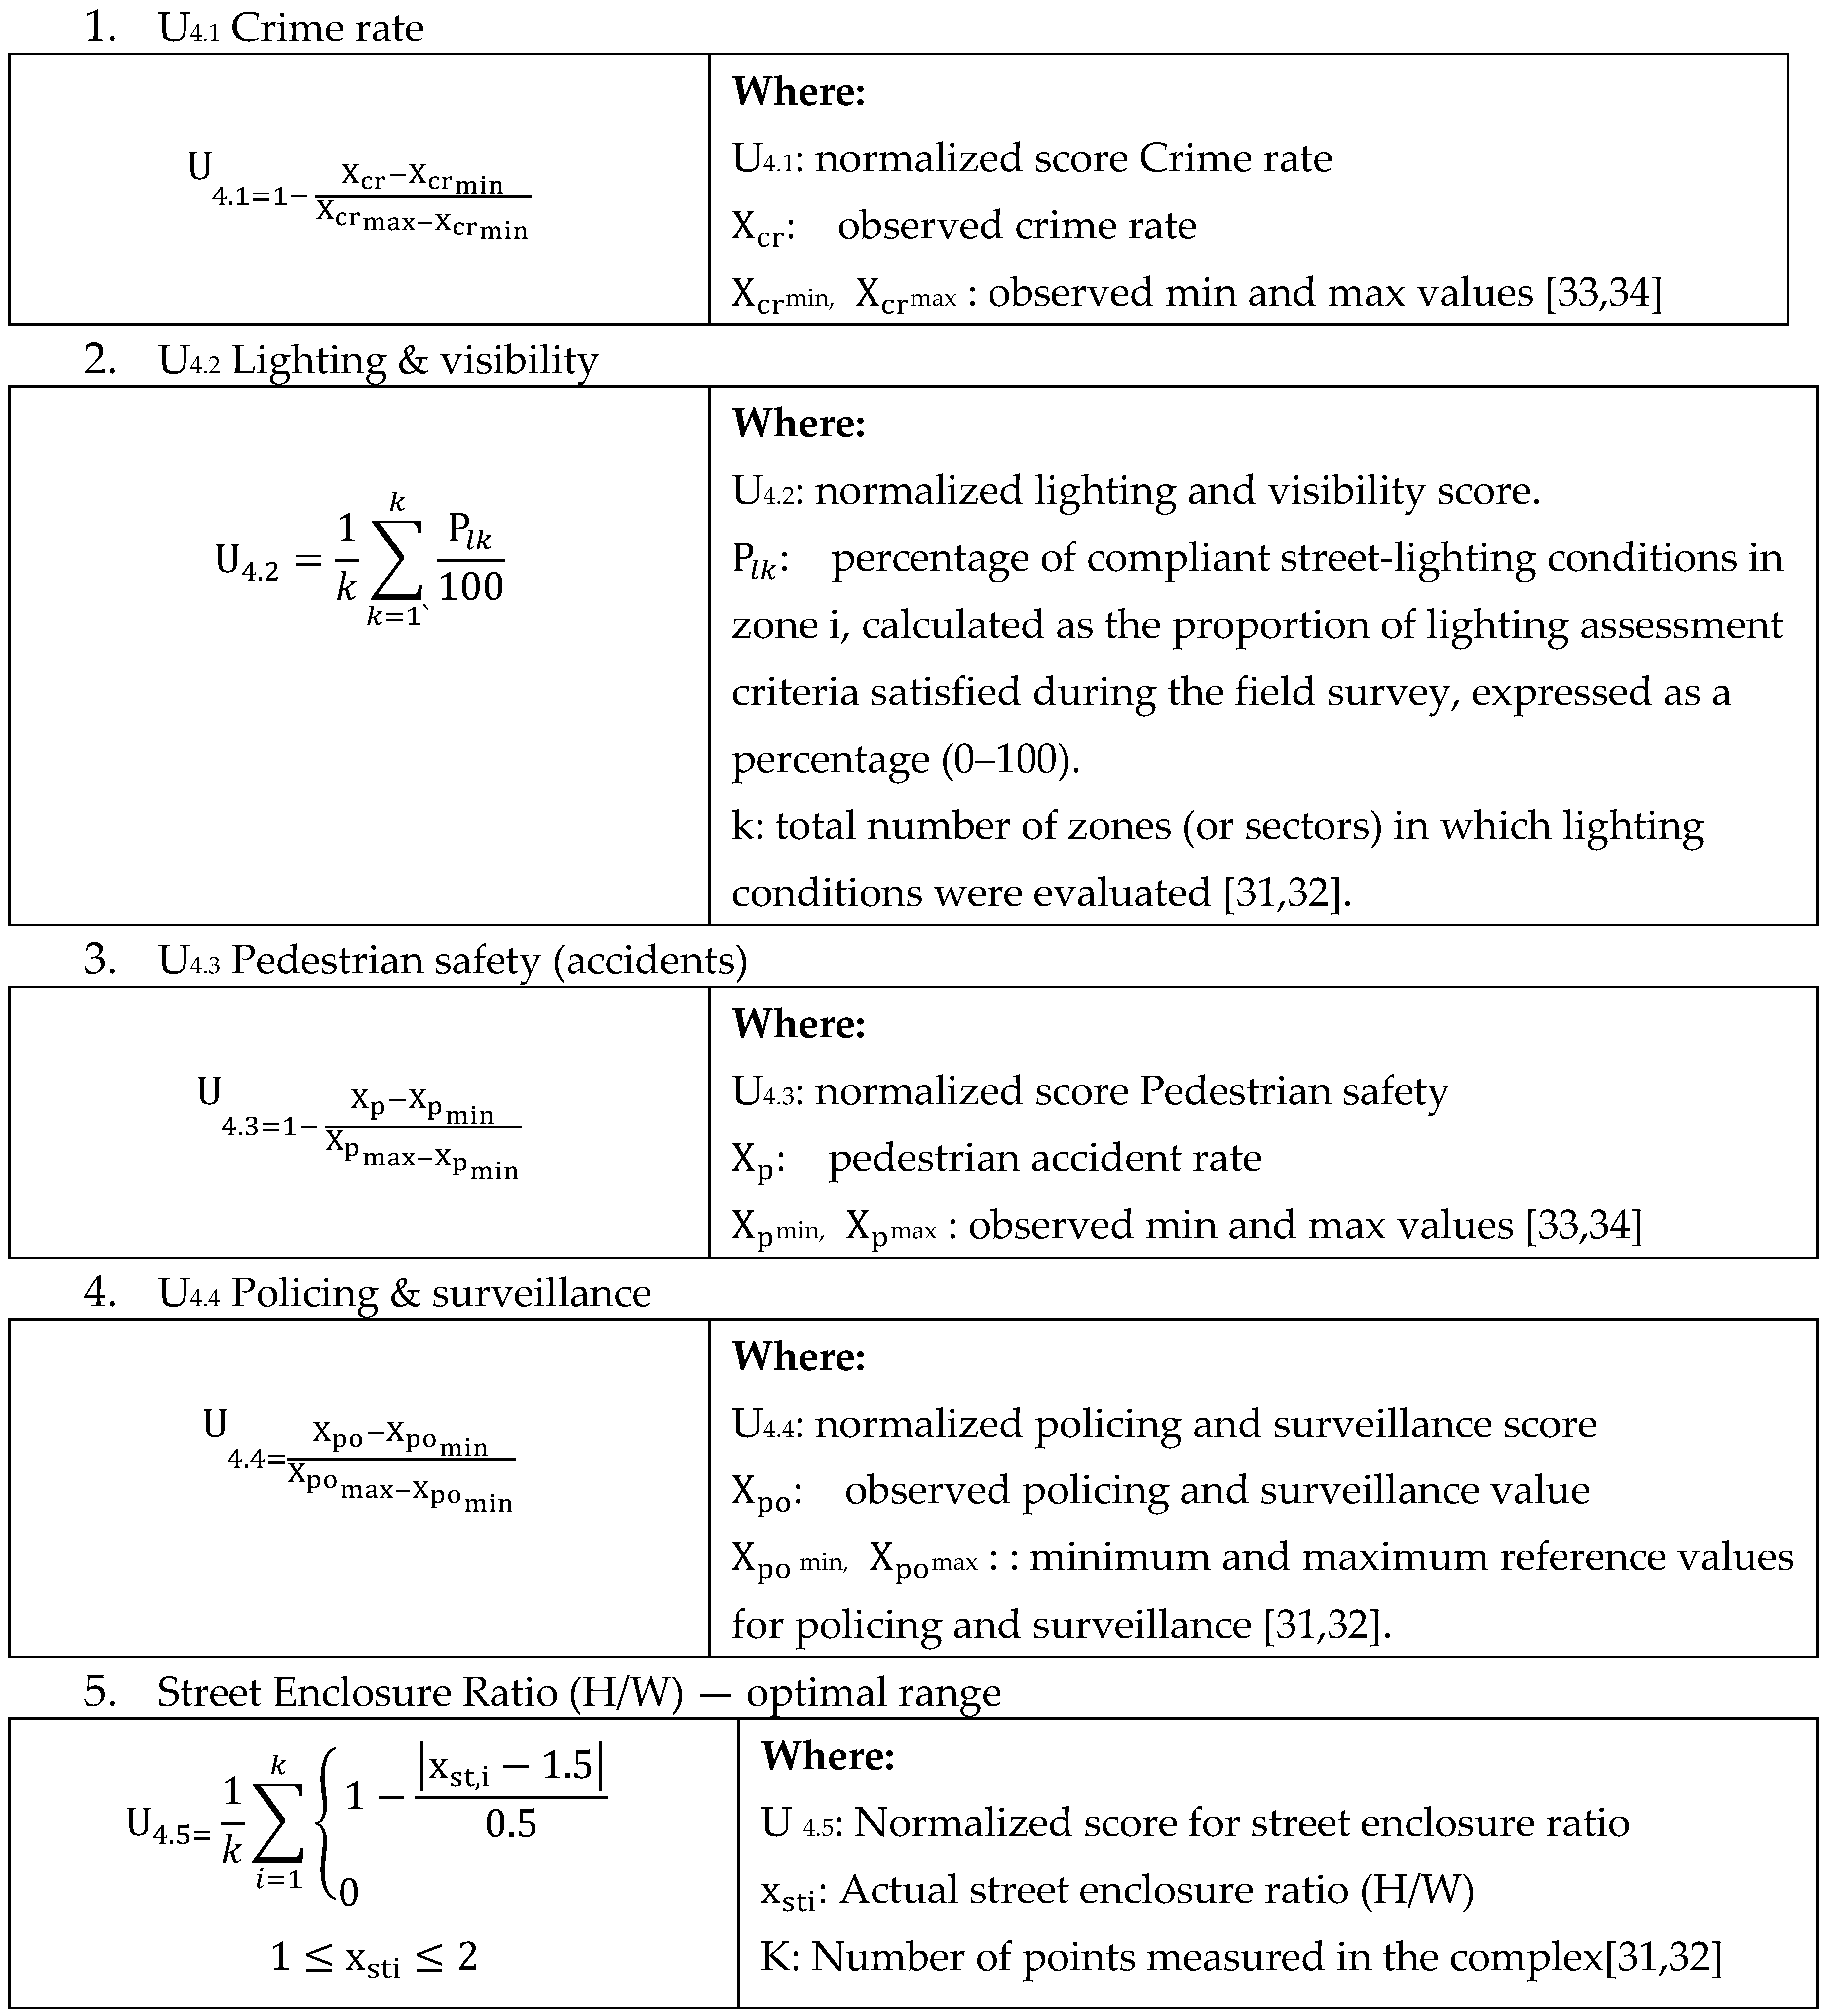

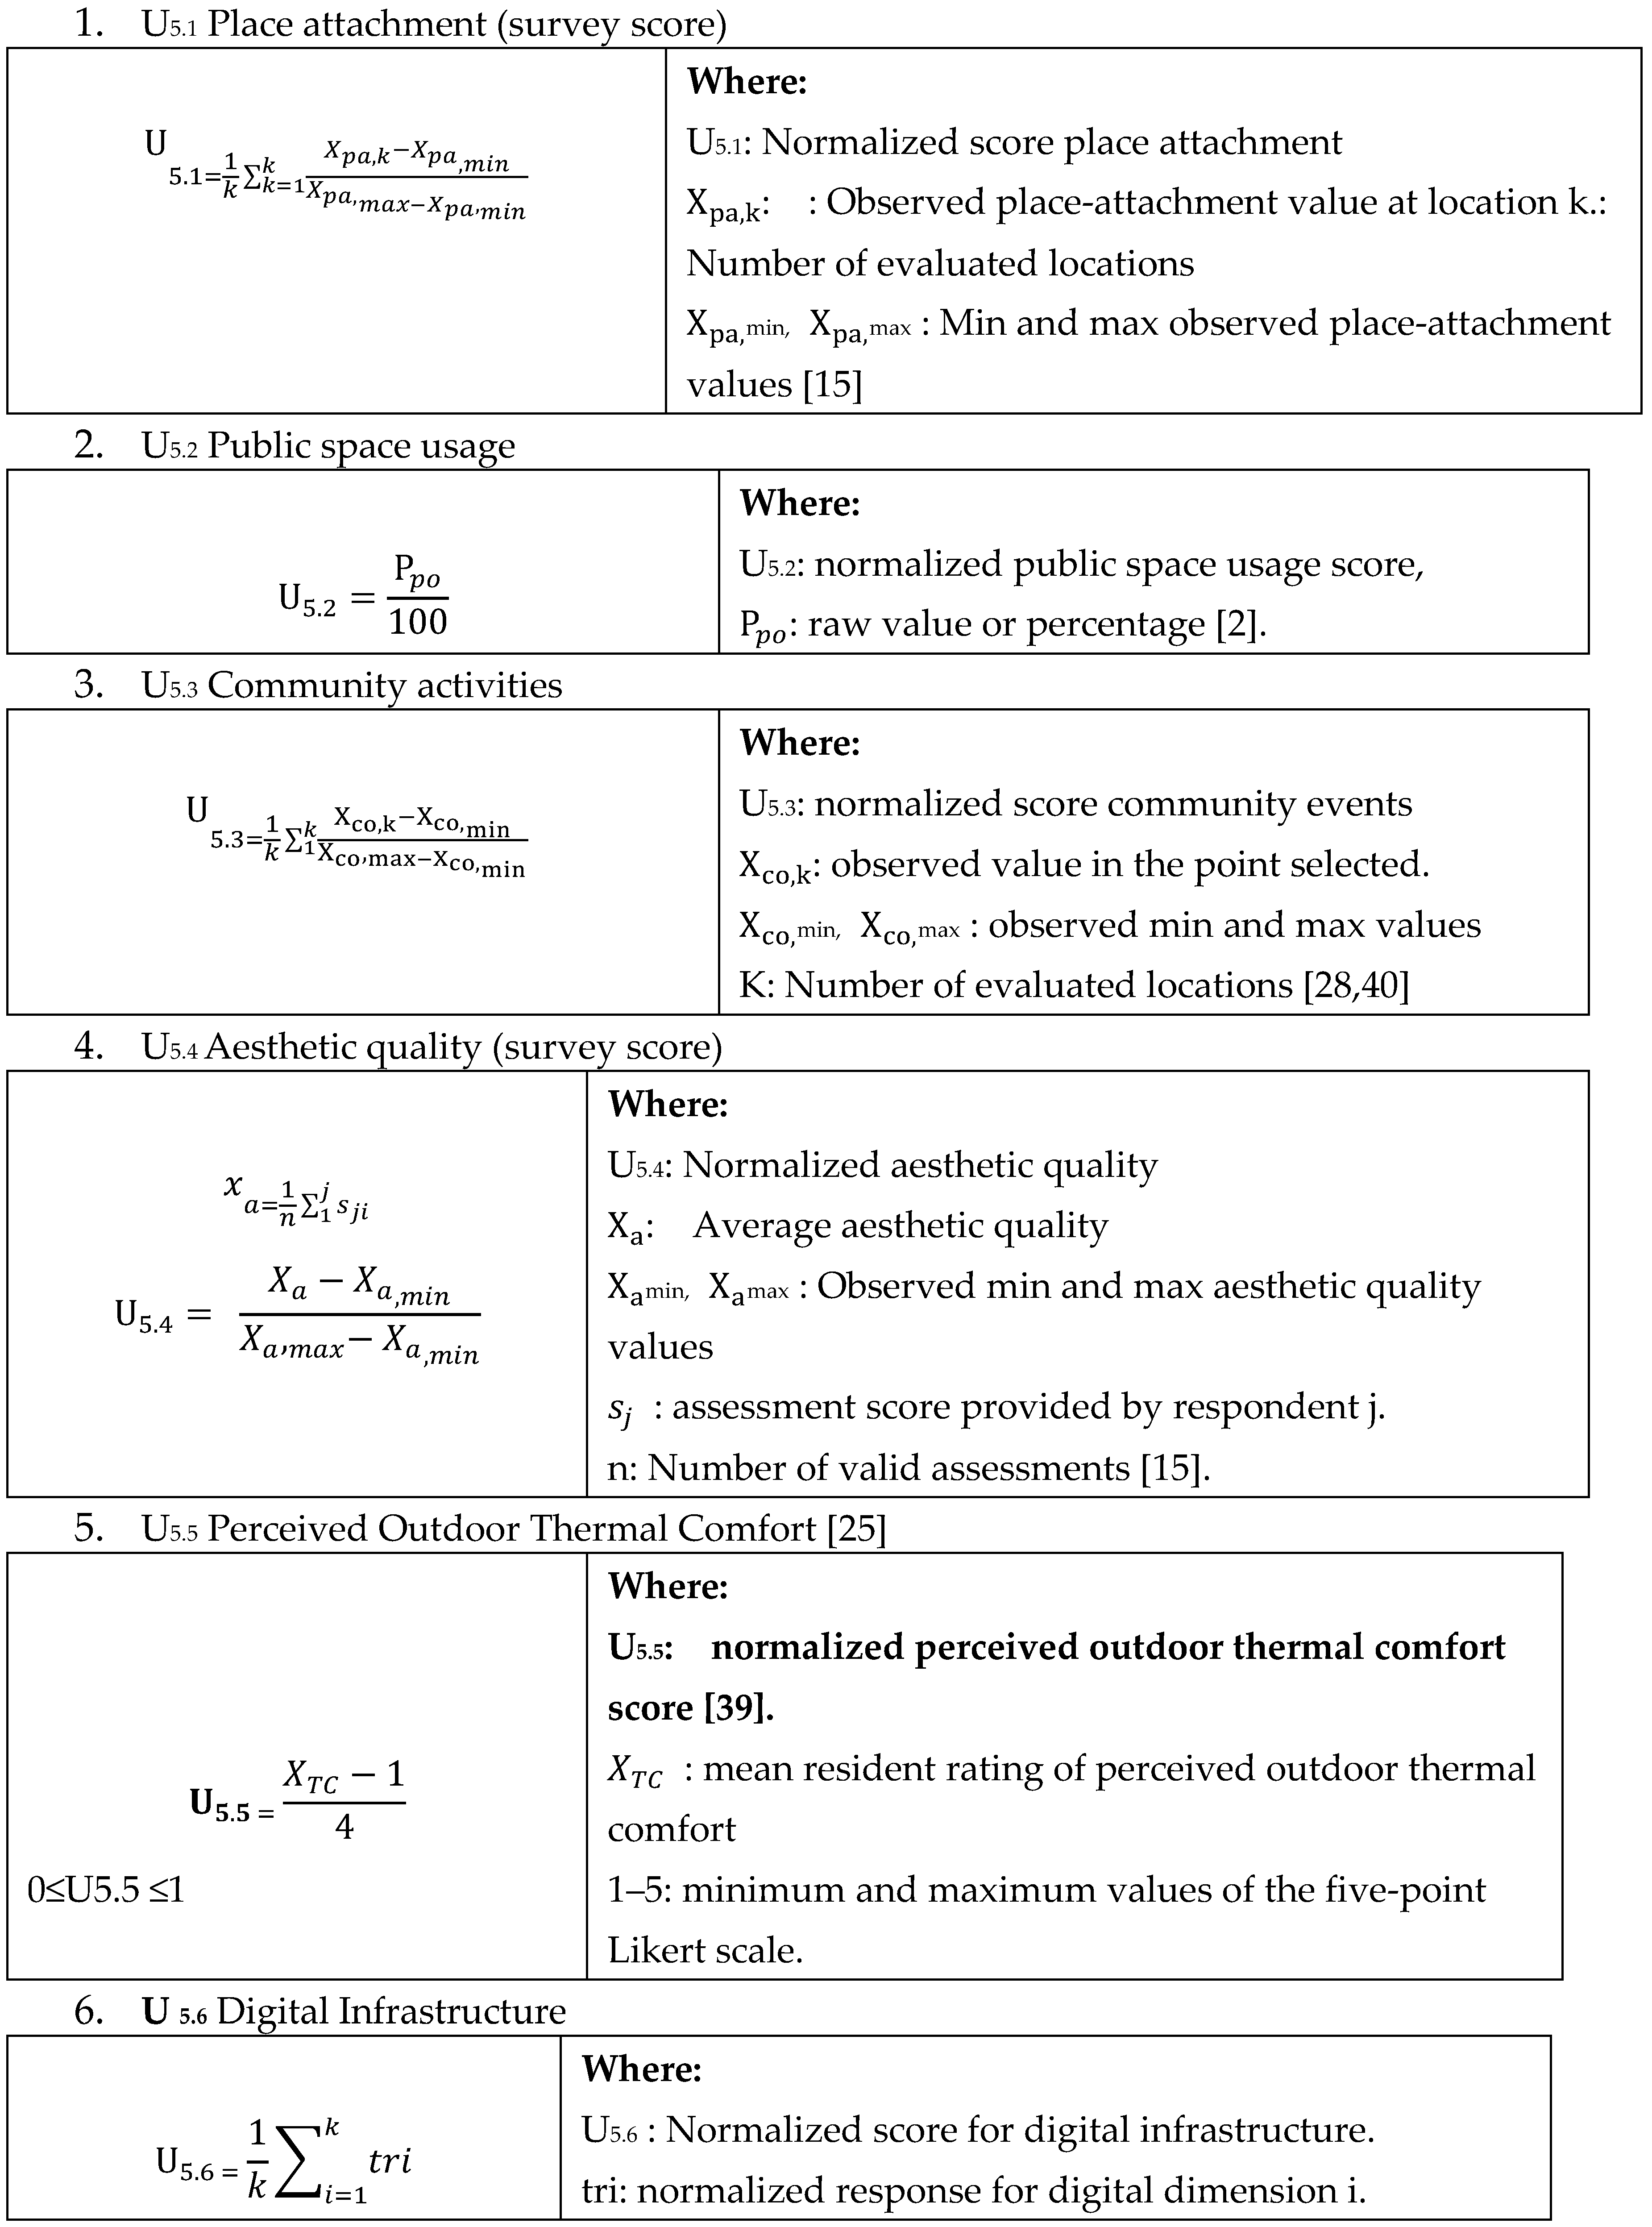
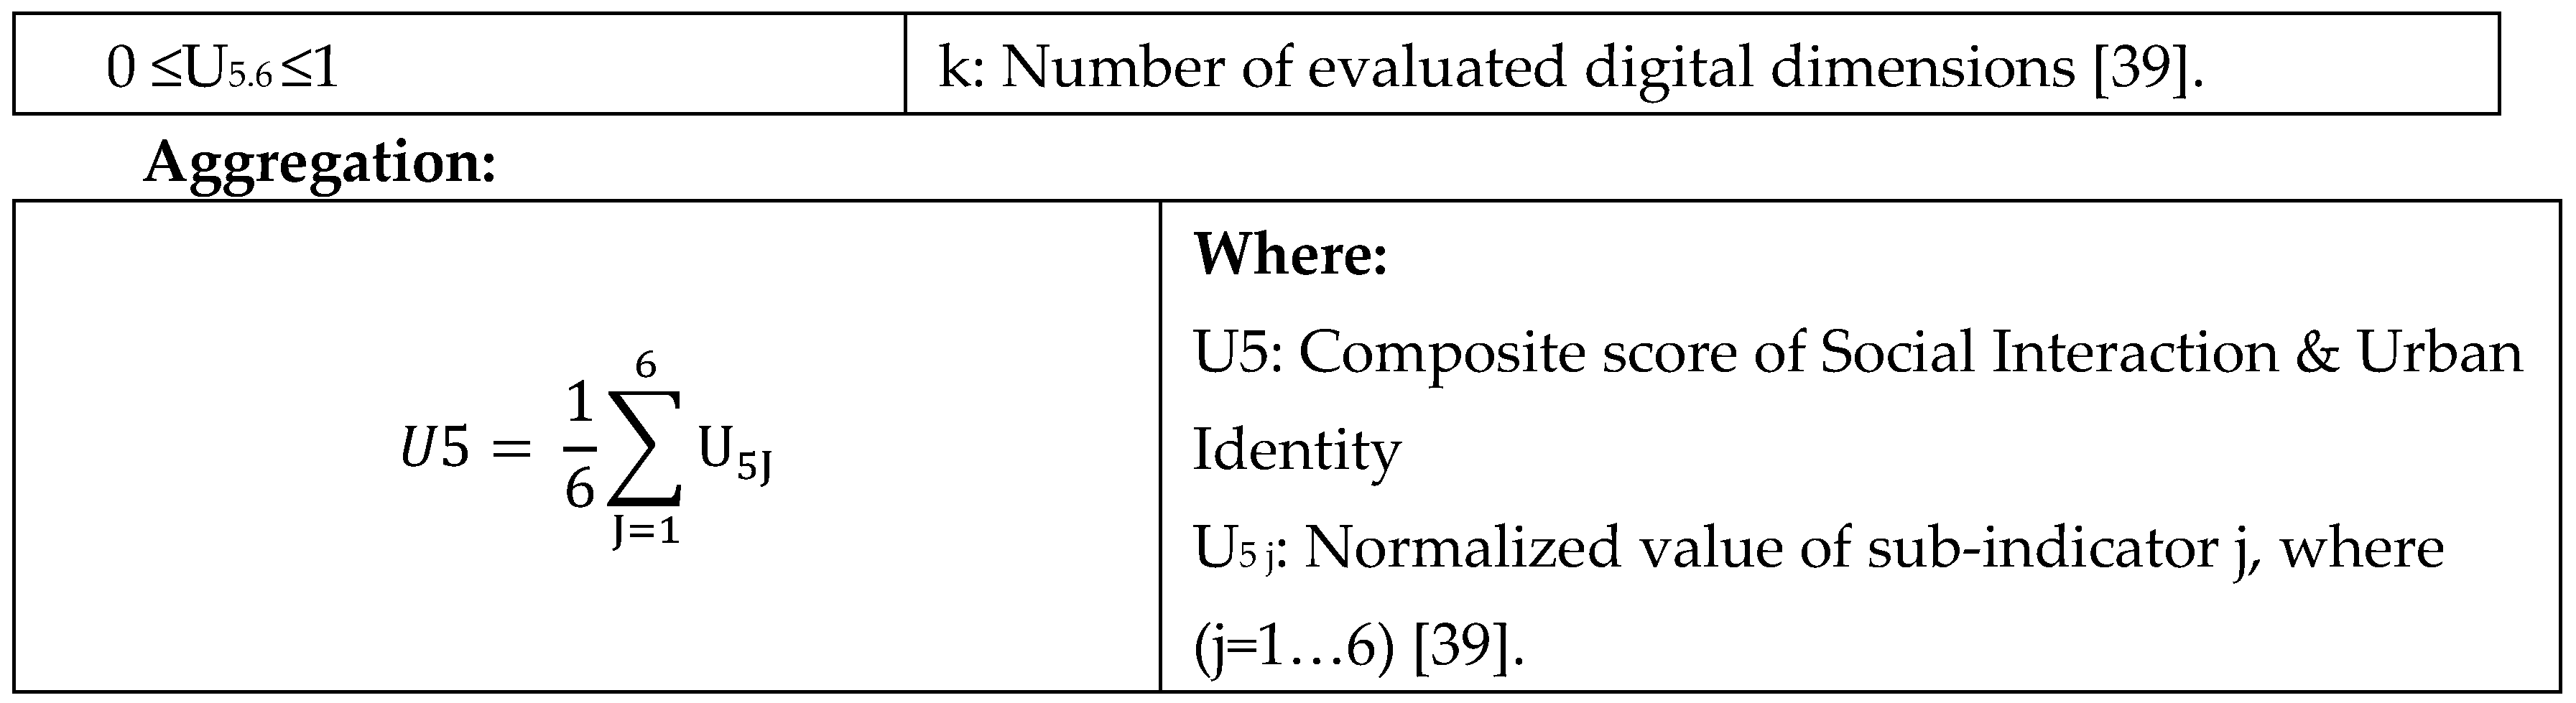
Main Indicator U5: Urban Identity, Social Interaction, and Environmental Performance (6 sub-indicators)
Final QoL Model
The five main indicators were combined to calculate the final QoL score. Each indicator was multiplied by its corresponding normalized weight before aggregation.

The weights satisfy Higher QoL values indicate better performance across the evaluated spatial and urban design dimensions.
5. Results and Discussion
This section presents the weights derived from expert and resident assessments and their integration into the proposed model. The model is then applied to the three residential complexes. The calculated QoL scores are compared with residents’ separate overall QoL assessments to examine their correspondence.
5.1. Expert and Resident Indicator Weights
Expert assessments showed relatively balanced weights across the five indicators. U1 and U2 received the highest expert weights (0.21 each), while U3 received the lowest weight (0.18). Residents assigned the highest weight to U2 (0.25), followed by U1 (0.23). U4 showed the largest difference between the two groups, receiving 0.20 from experts and 0.14 from residents. Figure 4 compares the expert- and resident-derived weights across the five indicators.
5.2. Integrated Weighting of Indicators
Comparatively similar weighing was observed between expert and resident evaluations regarding all five major indicators. However, the most substantial discrepancy was observed in regard to U4 indicator, which was assessed with higher weight by experts compared to residents. Meanwhile, similar weights were assessed by the two groups of evaluators regarding U5 indicator. Weighing sets were then integrated according to the 50:50 procedure outlined in Section 7.4.
Figure 5. Expert, resident, and integrated weights of the main urban QoL indicators.
The integrated weights were calculated: U2 (0.228), U1 (0.218), U5 (0.198), U3 (0.188), and U4 (0.169).
The mathematical model that was formulated was used in the analysis of the three residential areas. The normalized values of sub-indicators were aggregated under their respective main indicators (U1-U5). The integrated weights were then used in calculating the Quality-of-Life scores in each of the residential areas.
The mathematical model produced different QoL scores in the three case studies. Al-Shurooq had the highest QoL score of 0.50, followed by Al-Hadbaa (0.42) and Al-Khadraa having the least score of 0.32.
Al-Shurooq > Al-Hadbaa > Al-Khadraa
5.4. Correspondence between Model-Derived QoL and OPQoL
The model-derived scores were compared with the independent Overall Perceived Quality of Life (OPQoL) assessments. The OPQoL scores were 0.3053 for Al-Khadraa, 0.4900 for Al-Hadbaa, and 0.5500 for Al-Shurooq. Figure 6 compares these assessments with the corresponding model-derived scores.
The ranking of the two assessment techniques was found to be consistent for all the three case studies. The absolute values of their differences were equal to 0.0147 for Al-Khadraa, 0.0700 for Al-Hadbaa, and 0.0500 for Al-Shurooq. The consistency of the results indicates correspondence between the model-derived results and residents’ perceptions within the cases under study.
It is important to note that the analysis of the results is done on three residential complexes only and, therefore, cannot be used to prove the external validity of the model.
5.5. Sensitivity Analysis
In order to assess the sensitivity of the model to moderate changes in the ratio of experts’ to residents’ weight contribution, three different weight schemes, namely 50:50, 60:40, and 40:60 were considered. Small variations were found in the QoL values with no change in the ranking of the three residential complexes.
6. Discussion
6.1. Expert-Resident Weighting Patterns
Based on the results of weighting, it can be concluded that priorities of experts and residents are generally similar, although there were some discrepancies for particular indicators. Integrated weights for social sustainability and urban density (U2) are the highest. It indicates the perceived importance of social communication and reasonable density in social housing environment. Similar conclusions have been drawn by previous authors when studying the relation between spatial configuration, social communication, and satisfaction with housing environment [16,17,19]. Basic services accessibility (U1) also has a relatively high integrated weight. It corresponds to the findings of previous researches regarding the importance of this factor as a component of neighborhood satisfaction and urban QoL [1,6,7]. Urban identity and social interaction (U5) took intermediate positions that indicate their perceived importance within the weighting results [15,18,35]. The most pronounced discrepancy in expert-resident views was found for safety and security (U4). U4 has 0.20 weight for experts and 0.14 for residents. The reason for this discrepancy is not determined by the current study. Road network efficiency (U3) is estimated similarly by both groups.
6.2. Model Performance and Agreement with Residents’ Views on Quality of Life
Implementation of the model distinguished between the three residential areas based on their performance in terms of spatial and urban quality. Moreover, the results derived from the model showed agreement with the separate OPQoL assessment, as both methods resulted in an identical order of the three case studies. Differences between the two approaches were limited, but their magnitude differed among the three complexes. The minimum difference was detected for Al-Khadraa area, and the maximum – for Al-Hadbaa area. Thus, the model evaluates spatial and urban design aspects which show correspondence with the views of residents in general, but do not repeat them. Such discrepancies can be expected, since overall QoL perceptions might be associated not only with spatial parameters, which the model considers, but also with social, economic, psychological and personal characteristics of the resident [1,5,36]. Hence, the agreement in rankings and the observed differences in values indicate correspondence in the studied cases, not external validation.
6.3. Sensitivity of the Model and its Practical Meaning
The conducted sensitivity analysis provides an indication of model stability within the tested weighting range. Small changes in the contribution of experts and the resident have not affected the ranking of the three residential complexes. Hence, it is clear that the results of the model are not very sensitive to the selected 50:50 weighting assumption within the studied range. In terms of practical use, the model transforms diverse urban indicators into a unified 0-1 evaluation scale. Thus, it becomes possible to analyze accessibility, social sustainability, road effectiveness, safety and urban identity in one composite entity. This can be used for comparative analysis and determination of dimensions needing certain design or planning interventions. The developed computational procedure helps in uniform implementation of the model, which includes indicator normalization, weighting, aggregation and visualization of the results. However, this tool should be considered only as a decision-support tool, but not as a replacement of professional judgments and evaluations of residents.
7. Limitations and Future Research
There are several limitations associated with the present study and need to be taken into consideration. First, the empirical evaluation is limited to the case studies of three residential complexes in Mosul. Despite the fact that these cases cover different conditions of planning and development, it is obvious that they do not represent all social housing settings in Iraq. Additionally, voluntary household involvement could result in certain selection bias.
Second, the model emphasizes spatial and urban design criteria. In addition, the quality of life of residents could be determined by such aspects as socioeconomic, psychological and health factors, which are not considered in the model. It can partially explain the discrepancies between model-estimated QoL and OPQoL.
Third, the weights used in the present model are based on the assessments made by experts and residents in the studied setting. Their applicability in other residential settings needs to be investigated. In addition, sensitivity analysis includes moderate changes in the ratio of expert-resident weights.
Finally, the agreement between the model-estimated and observed quality of life was analyzed for three studied residential complexes. As a result, the obtained results do not prove the external validity of the proposed model. Further research should investigate the proposed model in other settings and using more extensive sample sizes. Different urban, cultural and socioeconomic contexts should also be included in order to test the model in relation to its transferability and possible recalibration. Testing a broader range of weighting schemes could provide further evidence regarding model robustness.
8. Conclusion
The current study has established a quantitative model for measuring the contribution of spatial and urban design to the quality of life in the case of social housing in Iraq. The model has used five major indicators along with their measurable sub-indicators in a normalized scale between zero and one. Weightings of each of the indicators have been determined through a combination of expert and resident assessments. In this regard, the integrated weight of social sustainability and urban density has become the highest, while the second priority is related to the indicator of accessibility to basic facilities. Using the suggested model, it was possible to differentiate the three residential areas under consideration. Thus, Al-Shurooq has become the area with the highest model-based QoL score, followed by Al-Hadbaa and Al-Khadraa. The results obtained using the model have shown correspondence with the independent OPQoL results. Furthermore, sensitivity analysis showed that the ranking remained unchanged under the moderate changes in weightings tested for the three residential areas under consideration.
References
- Mouratidis, K. Urban planning and quality of life: A review of pathways linking the built environment to subjective well-being. Cities 2021, 115, 103229. [Google Scholar] [CrossRef]
- Dempsey, N.; Bramley, G.; Power, S.; Brown, C. The social dimension of sustainable development: Defining urban social sustainability. Sustain. Dev. 2011, 19, 289–300. [Google Scholar] [CrossRef]
- Van Kamp, I.; Leidelmeijer, K.; Marsman, G.; de Hollander, A. Urban environmental quality and human well-being: Towards a conceptual framework and demarcation of concepts; A literature study. Landsc. Urban Plan. 2003, 65, 5–18. [Google Scholar] [CrossRef]
- Lotfi, S.; Solaimani, K. An assessment of urban quality of life by using Analytic Hierarchy Process approach (case study: Comparative study of quality of life in the North of Iran). J. Soc. Sci. 2009, 5, 123–133. [Google Scholar] [CrossRef]
- Estoque, R.C.; Togawa, T.; Ooba, M.; Gomi, K.; Nakamura, S.; Hijioka, Y.; Kameyama, Y. A review of quality of life (QOL) assessments and indicators: Towards a “QOL-Climate” assessment framework. Ambio 2019, 48, 619–638. [Google Scholar] [CrossRef] [PubMed]
- Wesz, J.G.B.; Miron, L.I.G.; Delsante, I.; Tzortzopoulos, P. Urban quality of life: A systematic literature review. Urban Sci. 2023, 7, 56. [Google Scholar] [CrossRef]
- Al-Qawasmi, J.; Saeed, M.; Asfour, O.S.; Aldosary, A.S. Assessing urban quality of life: Developing the criteria for Saudi cities. Front. Built Environ. 2021, 7, 682391. [Google Scholar] [CrossRef]
- Sapena, M.; Wurm, M.; Taubenböck, H.; Tuia, D.; Ruiz, L.A. Estimating quality of life dimensions from urban spatial pattern metrics. Comput. Environ. Urban Syst. 2021, 85, 101549. [Google Scholar] [CrossRef]
- Salavati, S.M.; Janalipour, M.; Abbaszadeh Tehrani, N. Measuring urban quality of life through spatial analytics and machine learning: A data-driven framework for sustainable urban planning and development. Sustainability 2025, 17, 4863. [Google Scholar] [CrossRef]
- Ali, M.S. Neighbourhood Satisfaction and Quality of Urban Life in a Terrace Housing Neighbourhood in Kuala Lumpur, Malaysia. Master’s Dissertation, International Islamic University Malaysia, Kuala Lumpur, Malaysia, 2013. [Google Scholar]
- Imrie, R. Universalism, universal design and equitable access to the built environment. Disabil. Rehabil. 2012, 34, 873–882. [Google Scholar] [CrossRef] [PubMed]
- Papanicolaou, M.; Katafygiotou, M.; Dimopoulos, T. Reframing urban accessibility through universal design: A critical review with case insights from Kaimakli Linear Park. Land 2025, 14. [Google Scholar] [CrossRef]
- Ulrich, R.S. View through a window may influence recovery from surgery. Science 1984, 224, 420–421. [Google Scholar] [CrossRef] [PubMed]
- Mohamed, A.N. Enhancing the green outdoor spaces towards creating sustainable residential neighborhoods in Egypt, Port Said City as a case study. J. Salut. Archit. 2025, 4, 90–111. [Google Scholar] [CrossRef] [PubMed]
- Lynch, K. The Image of the City; MIT Press: Cambridge, MA, USA, 1960. [Google Scholar]
- Ali, H.H.; Al-Betawi, Y.N.; Al-Qudah, H.S. Effects of urban form on social sustainability—A case study of Irbid, Jordan. Int. J. Urban Sustain. Dev. 2019, 11, 203–222. [Google Scholar] [CrossRef]
- Motlak, J.B. Social sustainability in vertical housing complexes/study area: Al Salam Haiy. J. Plan. Dev. 2023, 27, 92–111. [Google Scholar]
- Al-Ansari, M.; AlKhaled, S. Sustainable urban forms in the Arabian Gulf: An evidence-based analysis of Kuwaiti social housing neighborhoods at Jaber Al-Ahmed City. Front. Built Environ. 2023, 9, 1154523. [Google Scholar] [CrossRef]
- Sarkar, A.; Bardhan, R. Socio-physical liveability through socio-spatiality in low-income resettlement archetypes: A case of slum rehabilitation housing in Mumbai, India. Cities 2020, 105, 102840. [Google Scholar] [CrossRef] [PubMed]
- Evans, G.W. The built environment and mental health. J. Urban Health 2003, 80, 536–555. [Google Scholar] [CrossRef] [PubMed]
- Gifford, R.; Steg, L.; Reser, J.P. Environmental psychology. In IAAP Handbook of Applied Psychology; Wiley-Blackwell: Chichester, UK, 2011; pp. 440–470. [Google Scholar] [CrossRef]
- Ohlmeyer; Gruehn, D. M.; et al. Environmental justice in urban planning: Integrating environmental assessment into spatial planning practice—The case of Bottrop, Germany. Town Plan. Rev. 2021, 92(6), 689–710. [Google Scholar] [CrossRef]
- Gruehn, D. Economic valuation of urban open spaces and their contribution to life quality in European cities. Space–Society–Economy 2008, 8, 59–66. [Google Scholar] [CrossRef]
- Livesley, S.J.; McPherson, E.G.; Calfapietra, C. The urban forest and ecosystem services: Impacts on urban water, heat, and pollution cycles at the tree, street, and city scale. J. Environ. Qual. 2016, 45, 119–124. [Google Scholar] [CrossRef] [PubMed]
- Abdelmejeed, A.Y.; Gruehn, D. Pedestrian dynamic thermal comfort analysis to optimize using trees in various urban morphologies: A case study of Cairo City. Land 2024, 13, 1489. [Google Scholar] [CrossRef]
- Baobeid, A.; Koç, M.; Al-Ghamdi, S.G. Walkability and its relationships with health, sustainability, and livability: Elements of physical environment and evaluation frameworks. Front. Built Environ. 2021, 7, 721218. [Google Scholar] [CrossRef]
- Stangl, P. Block size-based measures of street connectivity: A critical assessment and new approach. Urban Des. Int. 2015, 20, 44–55. [Google Scholar] [CrossRef]
- Boeing, G. OSMnx: New methods for acquiring, constructing, analyzing, and visualizing complex street networks. Comput. Environ. Urban Syst. 2017, 65, 126–139. [Google Scholar] [CrossRef]
- Litman, T.A. Toward More Comprehensive and Multi-Modal Transport Evaluation; Victoria Transport Policy Institute: Victoria, BC, Canada, 2013. [Google Scholar]
- Jacobs, J. The Death and Life of Great American Cities; Random House: New York, NY, USA, 1961. [Google Scholar]
- Newman, O. Defensible Space: Crime Prevention through Urban Design; Macmillan: New York, NY, USA, 1972. [Google Scholar]
- Cozens, P.M.; Saville, G.; Hillier, D. Crime prevention through environmental design (CPTED): A review and modern bibliography. Prop. Manag. 2005, 23, 328–356. [Google Scholar] [CrossRef]
- Cozens, P.M. Urban planning and environmental criminology: Towards a new perspective for safer cities. Plan. Pract. Res. 2011, 26, 481–508. [Google Scholar] [CrossRef]
- Ibrahim, I.A. Sustainable housing development: Role and significance of satisfaction aspect. City Territ. Archit. 2020, 7, 21. [Google Scholar] [CrossRef]
- Nicolás-Martínez, C.; Pérez-Cárceles, M.C.; Riquelme-Perea, P.J.; Verde-Martín, C.M. Are cities decisive for life satisfaction? A structural equation model for the European population. Soc. Indic. Res. 2024, 174, 1025–1051. [Google Scholar] [CrossRef]
- MacLean, L.; Salama, A.M. Towards a context specific and multidimensional quality of urban life model. Open House Int. 2019, 44, 25–33. [Google Scholar] [CrossRef]
- Yin, C.; Xiong, Z.; Chen, H.; Wang, J.; Cooper, D.; David, B. A literature survey on smart cities. Sci. China Inf. Sci. 2015, 58, 1–18. [Google Scholar] [CrossRef]
- Ma, Y.; Shui, J.; Li, Y. Digital infrastructure and quality of life: A quasi-natural experimental study based on the ‘Broadband China’ pilot policy. Technol. Anal. Strateg. Manag. 2025, 37, 890–903. [Google Scholar] [CrossRef]
- Becker, W.; Saisana, M.; Paruolo, P.; Vandecasteele, I. Weights and importance in composite indicators: Closing the gap. Ecol. Indic. 2017, 80, 12–22. [Google Scholar] [CrossRef] [PubMed]
- OECD. Handbook on Constructing Composite Indicators: Methodology and User Guide; OECD Publishing: Paris, France, 2008. [Google Scholar]
- Saeed, Z.O.; Almukhtar, A.; Abanda, H.; Tah, J. Mosul City: Housing reconstruction after the ISIS war. Cities 2022, 120, 103460. [Google Scholar] [CrossRef]
- UN-Habitat. City Profile of Mosul, Iraq: Multi-Sector Assessment of a City under Siege; United Nations Human Settlements Programme: Nairobi, Kenya, 2016. [Google Scholar]
- Republic of Iraq; Ministry of Construction and Housing. Urban Housing Standards Manual; State Commission for Housing: Baghdad, Iraq, 2010. [Google Scholar]
- Fabrikant, S.I.; Reichenbacher, T.; van Kreveld, M.; Schlieder, C. (Eds.) Geographic Information Science: 6th International Conference, GIScience 2010, Zurich, Switzerland, September 14–17, 2010, Proceedings. In Lecture Notes in Computer Science; Springer: Berlin/Heidelberg, Germany, 2010; Vol. 6292. [Google Scholar] [CrossRef]
- Hillier, B.; Hanson, J. The Social Logic of Space; Cambridge University Press: Cambridge, UK, 1984. [Google Scholar] [CrossRef]
- Saaty, T.L. The Analytic Hierarchy Process: Planning, Priority Setting, Resource Allocation; McGraw-Hill: New York, NY, USA, 1980. [Google Scholar]
- Khodyakov, D.; Grant, S.; Kroger, J.; Bauman, M. Report No. TL-A3082-1; RAND Methodological Guidance for Conducting and Critically Appraising Delphi Panels. RAND Corporation: Santa Monica, CA, USA, 2023. [CrossRef]
- World Health Organization. WHO Housing and Health Guidelines; World Health Organization: Geneva, Switzerland, 2018. [Google Scholar]
- World Health Organization Regional Office for Europe. Urban Green Spaces: A Brief for Action; WHO Regional Office for Europe: Copenhagen, Denmark, 2017. [Google Scholar]
Figure 1.
QoL Model Design according to the literature review (Prepared by the authors).
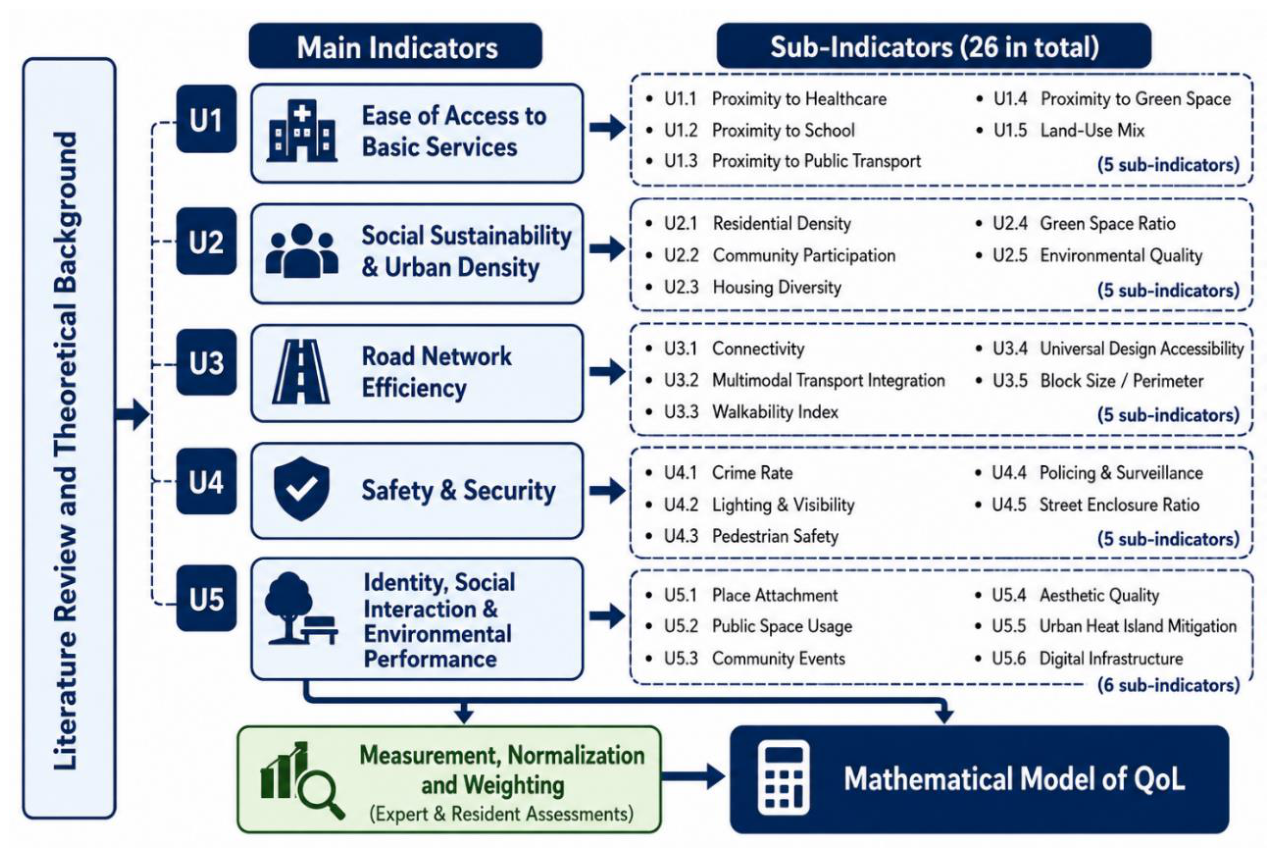
Figure 2.
the site plans of the three selected residential complexes.
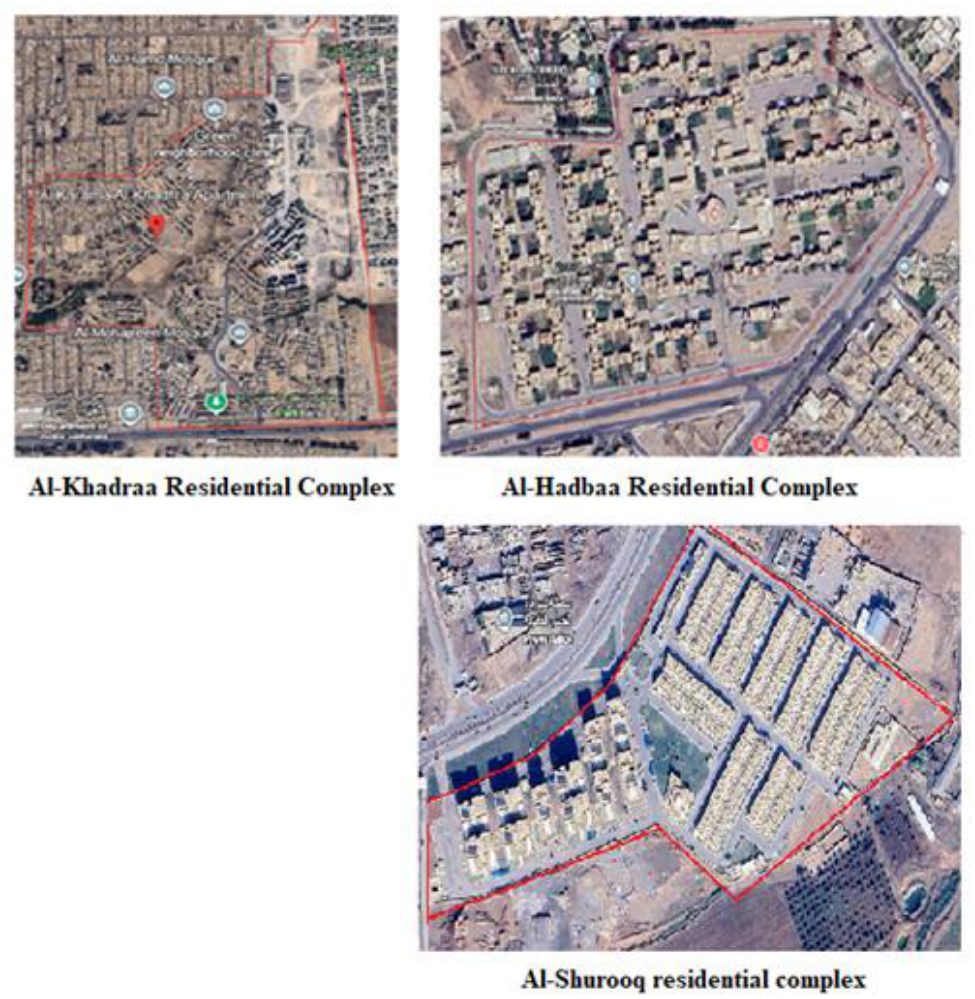
Figure 3.
Distribution of experts by discipline.
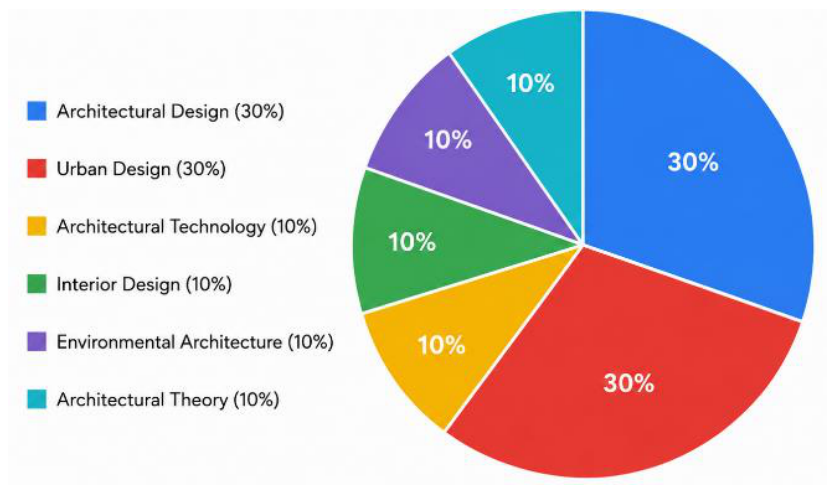
Figure 4.
Comparison of expert- and resident-derived weights across the five urban QoL indicators.
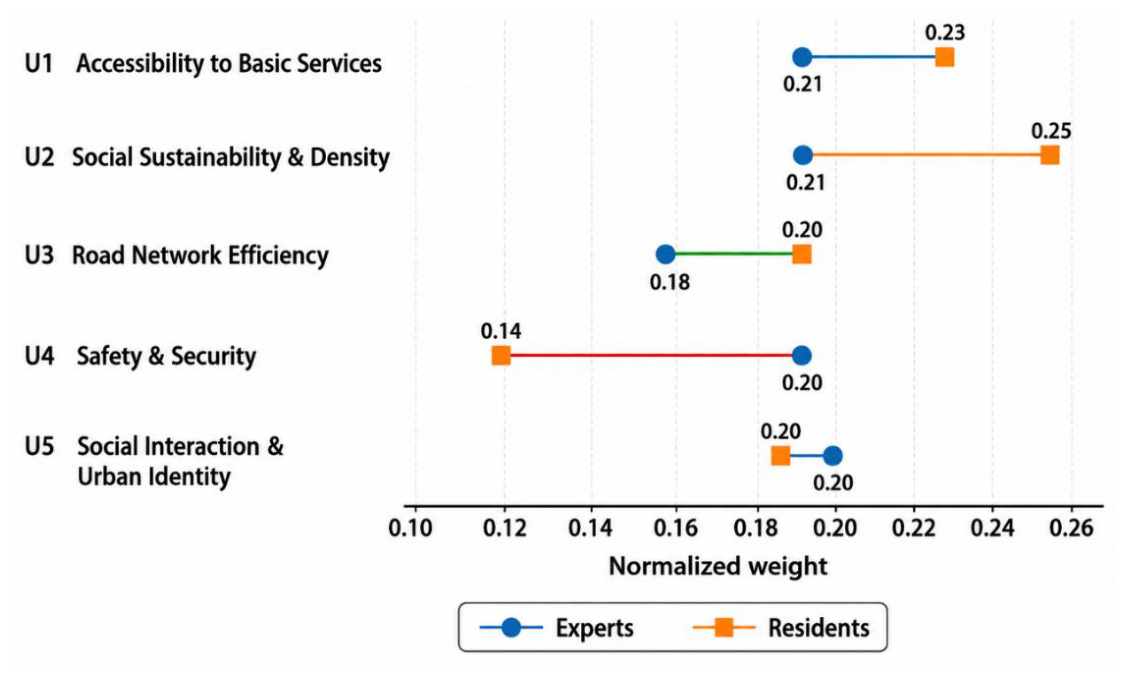
Figure 5.
Expert, resident, and integrated weights of the main urban QoL indicators.
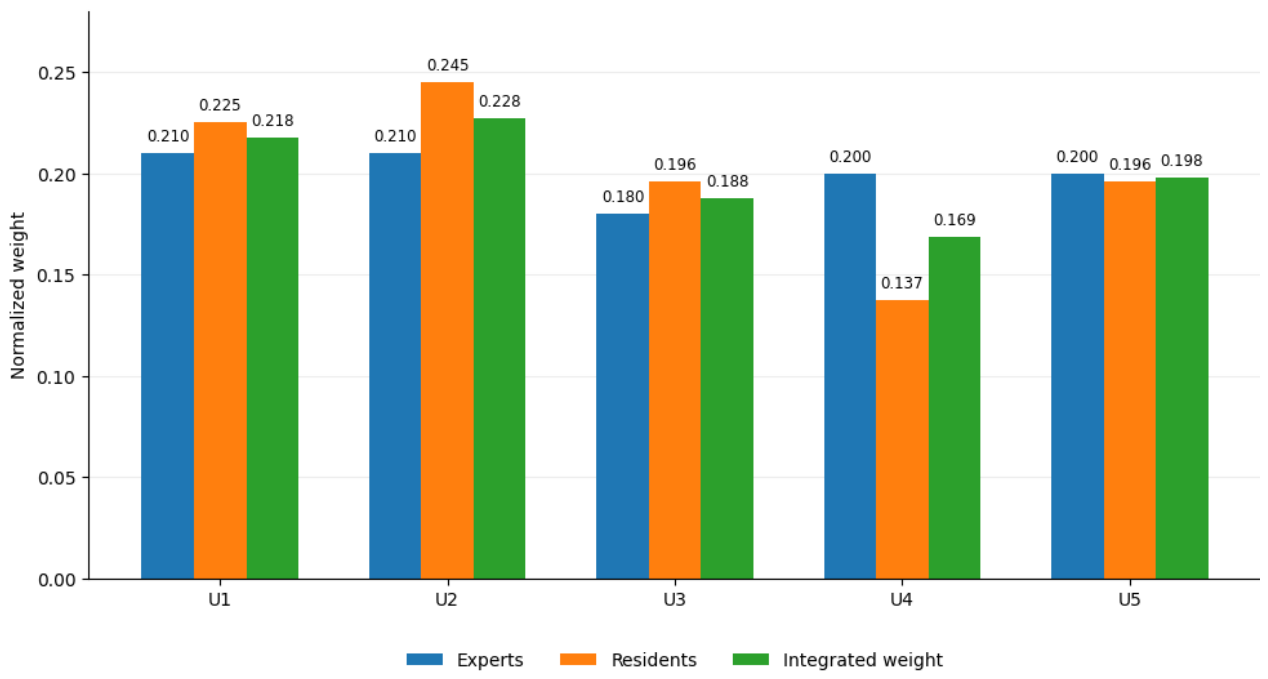
Figure 6.
Comparison between model-derived QoL and OPQoL across the three residential complexes.
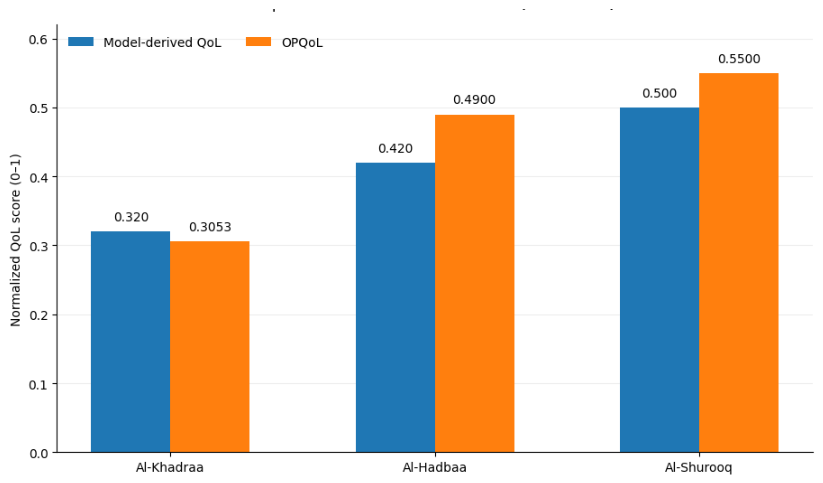
Table 1.
Urban QoL Indicators Derived from the Literature Review (Prepared by the authors).
| Urban QoL Dimension | Key Supporting References | Main Aspects Identified in the Literature | Indicators Derived for the Study |
|---|---|---|---|
| Accessibility to Basic Services | [1,28,43] | Service proximity; accessibility; spatial distribution of facilities; network-based access | Healthcare accessibility; education accessibility; public transport accessibility; green-space accessibility; land-use mix |
| Social Sustainability and Urban Density | [2,18,19] | Social cohesion; participation; density; housing diversity; socio-spatial relationships | Population density; community engagement; housing diversity; green-space ratio; environmental quality |
| Road Network Efficiency | [28,29,45] | Connectivity; permeability; walkability; multimodal mobility; spatial-network configuration | Connectivity; multimodal transport integration; walkability; universal accessibility; block size/perimeter |
| Safety and Security | [17,30,31,32] | Natural surveillance; territoriality; visibility; pedestrian safety; defensible space | Crime incidence; lighting and visibility; pedestrian safety; natural surveillance; street enclosure and visibility |
| Urban Identity, Social Interaction, and Environmental Performance | [2,23,25,35,37] | Place identity; social interaction; public-space experience; environmental quality; green infrastructure; thermal conditions; digital infrastructure | Place attachment; public-space use; community activities; aesthetic quality; Perceived Outdoor Thermal Comfort; digital infrastructure |
Disclaimer/Publisher’s Note: The statements, opinions and data contained in all publications are solely those of the individual author(s) and contributor(s) and not of MDPI and/or the editor(s). MDPI and/or the editor(s) disclaim responsibility for any injury to people or property resulting from any ideas, methods, instructions or products referred to in the content. |
© 2026 by the authors. Licensee MDPI, Basel, Switzerland. This article is an open access article distributed under the terms and conditions of the Creative Commons Attribution (CC BY) license (http://creativecommons.org/licenses/by/4.0/).
Copyright: This open access article is published under a Creative Commons CC BY 4.0 license, which permit the free download, distribution, and reuse, provided that the author and preprint are cited in any reuse.