

Submitted:
31 August 2026
Posted:
01 September 2026
You are already at the latest version
Abstract
A land register records what a parcel sold for. It does not record what may be built on it, though that is what sets its value to a developer. From 39,940 title-deed transfers in the Paphos District Land Registry, Cyprus, 8,945 arm's-length land transactions for 2019–2024 are isolated; 1,116 building plots across seven settlements carry the density analysis. Dividing transacted price by the statutory building coefficient removes four-fifths of the between-settlement variance in log price, but this restates the coefficient's monotonicity in price, and a vector built from price ranks alone compresses more. The register's second value descriptor fails independently: declared consideration falls short of accepted value by €242.0 million, and the shortfall is twice as large district-wide where no contract of sale was deposited (17.0% against 8.3%), a contrast partly compositional yet present within settlements. The published assessment procedure does not refer to deposit status, but deposit changes the evidence before the assessor, so the contrast is read as declaration behaviour, with fee-incidence and assessor-evidence channels open. Comparables and automated valuation lack the parameter that sets development value, and a reinstated property tax would inherit a base least reliable on low-value property. The failure is one of register design.
Keywords:
land value
; floor area ratio
; building coefficient
; development rights
; land administration
; cadastre
; automated valuation model
; property taxation
; price under-declaration
; Cyprus
1. Introduction
The price of land is recorded, transacted and taxed in one unit: currency per square metre of plot. Cadastres hold it, transfer duties are levied on it, mass-valuation systems calibrate to it, and automated valuation models are trained on it. Yet a developer does not buy plot area. A developer buys the right to construct a quantity of floorspace, and that quantity is set by an administrative parameter, the building coefficient (BC), known elsewhere as the floor area ratio or plot ratio. Where that parameter varies across a market, two plots transacting at the same price per square metre carry different development capacity, and the recorded descriptor and the economically relevant quantity come apart.
This paper asks what follows when they do. It asks a second question on the same data. The register carries one further value descriptor, the price the parties declare set against the value the administration accepts, and the relationship between the two is observable for every transaction. Whether that descriptor can bear the fiscal use now proposed for it is tested here; it cannot. The obvious diagnosis of the first descriptor is that regulation distorts the land market, misallocating development rights relative to value. That proposition is examined, and the evidence initially supporting it proves to be an artefact of coefficient assignment. Whether the land market prices permitted density efficiently cannot be settled on seven settlements; what can be shown is that the administrative record does not carry the parameter that determines what land is worth to the party most likely to buy it.
That distinction matters because the two diagnoses imply opposite remedies. If regulation misallocates, the remedy is planning reform. If the record omits, the remedy is register design. Valuers adjusting comparables, mass-appraisal systems, automated valuation models, and the assessment base of any recurrent property tax all draw on a descriptor that is correlated with the price-determining variable without carrying it, whether because the market capitalises permitted density or because the plan allocated density to land already valuable; the record cannot distinguish the two, and so cannot be transferred across zone boundaries or decomposed.
Three literatures bear on this and rarely meet. First, the economics of land-use regulation has established that density restrictions raise prices and constrain supply [1,2,3,4], and has measured stringency through permitted ratios and height limits [5,6]; the wedge between market price and marginal construction cost has been measured before and attributed to regulation [7,8]. That work treats regulation as a constraint on quantity and price. Second, the planning-gain and land-value-capture literature assumes a predictable relationship between permitted density and value uplift, since that relationship is what density bonuses and betterment levies monetise [9,10,11,12,13]. Third, land administration research has argued for incremental, function-led extension of the cadastral record rather than comprehensive re-survey [14,15,16], and valuation research has begun to interrogate the descriptors on which assessment depends [17,18]. Each of the three presumes what this paper tests. The regulation literature measures stringency from permitted ratios without asking whether the transaction record can be joined to them. The value-capture literature monetises a density-to-value relationship the record cannot verify. The land administration literature argues for extending the cadastre without identifying which omitted attribute would repay extension first. This paper nominates one candidate, tests what its absence costs, and shows that the deficiency is at least one of the record; that on the reading the evidence does not reject, its cost falls on the institutions consuming the record while the parties transacting the land are unaffected; and that the same register fails a second time, independently, in the one value descriptor it does carry.
The setting is Paphos, Cyprus, a secondary coastal city on a small import-dependent island under a statutory Local Plan assigning coefficients from 0.1 to 1.8 across eighteen zones. Small island economies exhibit diseconomies of scale and import dependence [19], and face a distinctive growth-volatility problem [20], and Paphos plausibly exhibits, by analogy with the tourism-gentrification markets studied elsewhere [21,22], a dual-demand structure in which foreign purchasing power influences coastal land values independently of local incomes. Transaction-level evidence from the same urban market shows that realised prices depart systematically from posted asking prices, with the degree of overpricing bearing on both time on market and final selling price [23]. The setting is useful because a steep regulatory gradient and a steep value gradient coexist within one planning authority and one labour market.
Section 2 describes the register, the filtering protocol, the zone schedule and the inference strategy. Section 3 reports the transacted market, the compression result, the test of the distortion hypothesis, the capitalisation evidence offered in its place together with the test that runs against it, the parallel failure in the register’s fiscal descriptor, and a second-order allocation through subdivision contributions. Section 4 discusses consequences for valuation practice, tax design and land administration. Section 5 concludes.
2. Materials and Methods
2.1. Study Area
Paphos District occupies the western coast of Cyprus and accommodates approximately 101,106 residents, 10.9% of the national population of 923,381 [24]. It combines a compact urban core, a coastal strip subject to foreign and tourism-linked demand, and a peri-urban belt of villages within short commuting distance. The study area is defined as a ten-minute drive-time catchment comprising seven settlements: Paphos, Geroskipou, Chlorakas, Empa, Konia, Marathounda and Agia Marinouda. Mountain villages and the Polis Chrysochous sub-region were excluded, their demand profile and tourism exposure differing materially from the catchment.
2.2. Land Transaction Data and Filtering
Primary data were obtained from the Department of Lands and Surveys (DLS), Paphos District Office, under written permission to publish derived statistics. The extract comprises 39,940 title-deed transfer records covering 2008–2024, each carrying parcel identifiers, parcel extent, fiscal property type, ownership share, transaction date, and both a declared and an accepted price. A parallel extract of 13,227 contracts of sale was obtained and used for cross-validation of transaction volumes only; it does not enter the analysis population.
Five exclusion criteria were applied, each recorded against the individual record so that the audit is reproducible. Partial ownership transfers were excluded because the recorded price does not correspond to the full parcel; transfers arising from debt restructuring or foreclosure as not arm’s-length; mortgage-related transfers as not sales; parcels carrying buildings because the consideration embeds improvement value; and antiparochi transactions, in which a landowner exchanges land for completed dwellings, because no cash consideration is recorded. Table 1 reports the audit.
Cypriot fiscal practice distinguishes two land categories. A building plot (oikopedo) has been subdivided, serviced and registered as a developable parcel. A field (chorafi) has not. The distinction is not equivalent to development potential, a field lying within a residential or village zone with adequate road frontage may obtain permission without subdivision, but subdivision is required to create separately disposable building plots, and only registered plots carry an unambiguous coefficient. Plots are analysed here; fields serve as a comparator.
Every value reported below is a lower bound. Each transaction carries a declared price, stated by the parties, and an accepted price, used by the DLS in assessing transfer fees under section 10 of the Department of Lands and Surveys (Fees and Charges) Law, Cap. 219, under which fees may be assessed on the difference between the stated price and the Director’s own valuation where the stated price is not accepted as reflecting market value. Across the 8,944 of the 8,945 filtered transactions that carry both prices, the mean declared-to-accepted ratio is 0.832; the median is 1.000; 41.7% declare below the accepted value. The construct is one-sided: the declared price exceeds the accepted price in one record, and the two are identical in 58.3%. The accepted price is best read as max(declared, assessed) rather than as an independent valuation. Two divergence measures are used below: aggregate divergence, one minus the ratio of summed declared to summed accepted consideration, value-weighted; and mean divergence, one minus the unweighted mean of the transaction-level ratio. Each is labelled where it appears. The reliability of the Department’s own mass-appraised values has itself been examined: a study of the General Valuation of 1 January 2018, combining regression analysis at quarter level in the Limassol District with a questionnaire survey of practising valuers in Cyprus, assesses the accuracy of the assessed figures and the extent to which the profession relies on them [25]. This is returned to in Section 3.6, where the divergence becomes a result rather than a caveat.
2.3. The Zone Schedule and Building Coefficients
Building coefficients were taken from the Paphos Local Plan and the published town-planning zone schedule for the Republic of Cyprus [26,27]. Each zone specifies a coefficient, permitted floors, maximum height and site coverage. Across the eighteen zones of the schedule the coefficient ranges from 0.1 to 1.8. Because a settlement typically spans several zones and the transaction extract carries no zone identifier, each settlement is assigned the range of coefficients attaching to the zones it contains, and results are given at both bounds.
The assignment is constrained in two ways. First, the range is between-zone heterogeneity within a settlement, unresolved because the extract lacks a zone field. It is not consent discretion: in Cyprus the planning zone is parcel-specific, mapped and public, and a Planning Authority certificate (Βεβαίωση Πολεοδομικής Aρχής) is obtainable before acquisition. The uncertainty is the analyst’s, not the purchaser’s. Second, zoning without a residential development right cannot govern a registered building plot, so zone G3 (BC 0.1), a countryside rather than a strictly agricultural zone (Greek zone codes are transliterated to Latin throughout), is excluded from every settlement band; the floor for peri-urban settlements is Ka10 at 0.3. Section 3.4 reports the sensitivity of results to this choice, which is material.
Provenance differs across settlements. Four settlements map to documented zone groups. Chlorakas and Marathounda have no documented mapping. Konia is assigned a Local Plan band in the plan schedule but classified peri-urban in the register’s own zone field, a contradiction that cannot be resolved from the sources available. The Paphos band pools two documented zone groups, Urban Paphos at 1.0–1.6 and Kato Paphos at 0.5–1.4; the floor is set at the urban group’s 1.0, and at the pooled floor of 0.5 the minimum-bound rank correlation in Section 3.4 rises from +0.107 to +0.321, so the choice is conservative for the conclusion drawn there. Results follow for the full catchment and for the documented subset.
2.4. Effective Land Cost per Unit of Buildable Floorspace
The effective cost of land per square metre of permitted buildable area is obtained by dividing observed plot price by the governing coefficient:
L_B = P_plot / BC (1)
where P_plot is the median transacted price per square metre of plot for the settlement. The transformation is definitional rather than estimated, since the coefficient is defined as the ratio of permitted floor area to plot area; the input coefficient, however, is assigned at settlement level, and Section 2.3 bounds what that costs. The median is used throughout: land transaction distributions are strongly right-skewed, and means exceed medians in all seven settlements.
The Cypriot coefficient governs a statutory buildable area whose treatment of verandas, parking and basements differs from the gross internal area defined by international measurement standards, so L_B is a cost per unit of permitted gross floorspace and not per unit of saleable area. And the coefficient is an upper bound. Across all eighteen zones, site coverage multiplied by permitted floors equals or exceeds the coefficient, so the coefficient, not the envelope, caps total floorspace everywhere in this plan; but the margin is not uniform, ranging from 0.93 in Ka3 down to 0.57 in Pa9 among the zones that can govern a registered building plot, with countryside zone G3, excluded from every settlement band, lower still at 0.50. The margin varies across the schedule without any systematic relation to the coefficient (rank correlation +0.05 across the eighteen zones), so realisation bias differs zone by zone rather than rising with permitted density; Section 3.4 reports the one comparison in which it matters. The test covers coverage and permitted floors only; setbacks, minimum plot dimensions and parking provision are not modelled, and on the small peri-urban plots, with mean areas of 504–540 m², any of these can bind before the coefficient does.
2.5. Inference Strategy
With seven settlements, inference is barely possible. Exact two-sided permutation over all orderings gives significance floors of |ρ| ≥ 0.786 at n = 7 and ≥ 0.886 at n = 6; at n = 4 the minimum attainable p-value is 0.083, so significance is arithmetically impossible whatever the coefficient. Settlement-level rank correlations therefore appear throughout with their exact p-values, and they describe these seven settlements rather than supporting any general claim. Ratios, spreads and variance reductions are computed on unrounded values and then rounded for presentation, so recomputing them from the rounded figures printed in the tables can differ in the last digit. Rank correlations are Pearson correlations on mid-ranks, with exact two-sided permutation p-values counted inclusively over all orderings of the settlement labels.
One consequence belongs here rather than in Section 3.3, which it bounds. The building coefficient is constant within a settlement, so converting price to cost per unit of buildable area shifts each settlement’s log values by a constant. The within-settlement sum of squares is invariant under the conversion, identically 380.1806 before and after, and only the seven group means move. A variance decomposition computed on 1,116 transactions has seven effective observations, and its F statistics and confidence intervals describe the precision of the group means, not the reliability of the seven-valued treatment. The decomposition describes; it does not estimate.
Where the data do support inference, it is used. Section 3.6 estimates at transaction level on samples of 1,116 and 8,944, using a treatment, whether a contract of sale was deposited, that varies within settlements rather than across them; its correlations with the settlement-level regressors, permitted coefficient and effective land cost, are reported as descriptive. Rank correlations use mid-ranks throughout, which matters because the coefficient takes few distinct values and a majority of declared-to-accepted ratios are exactly unity.
Because L_B is a deterministic transform of P_plot, the correlation between them is not a relationship between two measurements but a restatement of the coefficient vector. Rank movement is arithmetically entailed once coefficients vary and are correlated with price. The empirical content lies in the magnitude of the compression, in whether the converted series tracks an independent quantity better than the raw series does, and in the behaviour of the register’s second descriptor, not in the reordering itself.
2.6. Limitations
The coefficient is assigned at settlement rather than parcel level; a spatial join of parcel polygons to zone boundaries would resolve this and is the natural extension. Three of seven settlement bands are undocumented or contradicted (Section 2.3). The design is cross-sectional and identifies no causal parameter. And the declared-to-accepted divergence documented in Section 2.2 means all levels are conservative, though it biases the compared series in the same direction. Generative artificial intelligence was used to draft analysis code and to assist in preparing this manuscript; it was not used to interpret results or to make analytical judgements, and all output was verified by the authors against the source records. Its use is disclosed in full in the Acknowledgments.
3. Results
3.1. The Transacted Land Market
Table 2 reports building-plot values for the seven catchment settlements over 2019–2024. The 1,116 qualifying transactions are unevenly distributed: Paphos contributes 572 (51.3%), Marathounda 16 and Agia Marinouda 29, and results for the latter two should be read with corresponding caution.
Median values span a 3.72-fold range, from €121/m² in Marathounda to €451/m² in Paphos. The ordering is what location theory predicts: the urban core commands the highest values and value declines with distance. Means exceed medians in every settlement, confirming the right skew; in Paphos the mean of €617/m² sits 37% above the median. Fields transact at a substantial discount, with a pooled catchment median of €105/m² against €350/m² for plots, a discount that reflects zoning status as much as the subdivision contributions discussed in Section 3.7, since fields in zones carrying no residential development right are included.
3.2. Effective Land Cost per Square Metre of Buildable Floorspace
Applying Equation (1) transforms this picture. Table 3 reports the coefficient band for each settlement and the effective cost at the maximum permitted coefficient; at the minimum bound the corresponding values are 451 (Paphos), 401 (Geroskipou), 353 (Emba), 641 (Agia Marinouda), 466 (Chlorakas), 387 (Konia) and 404 (Marathounda) €/m², and band provenance is set out in Section 2.3. At the minimum bound the spread is 1.81-fold and the coefficient of variation 0.199, against 1.73-fold and 0.152 at the maximum, so the compression does not depend on which bound is used. Bands exclude countryside zone G3 (BC 0.1), which cannot govern a registered building plot. Four bands are documented, a Local Plan or zone-schedule source stating them; three of those four are additionally formula-linked, derivable from the zone-group schedule, and Konia’s is documented but contradicted by the register’s own zone field (Section 2.3). Section 3.3 reports the documented four and the formula-linked three separately.
At maximum permitted coefficient, effective cost in Paphos falls from €451/m² of plot to €282/m² of buildable area, a reduction of 37.5%, because the urban zones permit coefficients up to 1.6. In Chlorakas, where the assigned maximum is 0.8, the same operation raises effective cost from €279/m² to €349/m². Paphos land transacts at a 61% premium over Chlorakas per square metre of plot yet delivers buildable floorspace 19% more cheaply. Figure 1 isolates the regulatory mechanism across all eighteen zones, holding plot price constant.
Paphos requires a caveat. The coefficient of 1.6 belongs to mixed-use and urban zones; the highest strictly residential coefficient in the catchment is 1.4, at which Paphos effective cost is €322/m² and the contrast with Chlorakas narrows from 19% to 7.8%. The two are equal at a coefficient of about 1.29; at 1.2 the contrast reverses, Chlorakas delivering buildable floorspace 7% more cheaply than Paphos. The comparison is therefore sensitive to which zones are treated as available for residential development, and it stands as a bounded observation.
3.3. What the Conversion Removes, and What That Does Not Establish
Converting price to cost per unit of buildable area collapses the between-settlement gradient. Location explains 18.1% of the variance in log plot price but only 3.5% of the variance in log effective cost, a reduction of 80.8%. Across settlement medians the same movement appears as a fall in the spread from 3.72-fold to 1.73-fold and in the coefficient of variation from 0.384 to 0.152. Table 4 reports it, together with the benchmarks that qualify it.
What this does not establish is that the statutory schedule is doing the work. Any coefficient vector increasing in price will remove between-settlement variance, and this schedule is strongly monotone in price: the rank correlation between settlement median price and permitted coefficient is +0.879 (p = 0.014), and across the three settlements whose coefficients are formula-linked to the zone table it is exactly +1.000. That monotonicity is not incidental. The plan assigns its highest coefficients to central land that was already the most valuable, so compression of the converted series is expected under the null of no market mechanism at all, purely from the way the schedule was drawn. The cross-sectional design cannot separate that assignment from any behavioural response to it, and no reading of the compression result should be taken as though it could. The schedule is accordingly benchmarked against vectors carrying no planning information. A binary assignment of 1.6 to Paphos and 0.8 elsewhere achieves 72.0%. A tercile assignment of 1.6, 1.0 and 0.6 by price rank alone achieves 85.1%, more than the statutory schedule.
Permuting the seven coefficients across settlements, only 2 of the 420 distinct assignments (ties in the coefficient vector collapse the 5,040 orderings to 420) reach 80.8% (p = 0.005), so the schedule is not a random vector. But randomness is not the relevant alternative. Measured against a vector built from price ranks the schedule does no better, and the reduction is best read as a restatement of the coefficient’s monotonicity in price rather than as a finding about planning. Restricting to the four settlements with documented bands (n = 932) raises the reduction to 91.4%, and to the three formula-linked settlements alone (n = 903) 91.8%; but at n = 4 the smallest attainable permutation p-value is 0.083 and at n = 3 it is 1 in 3, so neither figure is distinguishable from chance and neither corroborates anything. On the documented four the rank correlation between plot price and effective cost is −0.200 at both bounds, carrying no inferential weight at that sample size either. Figure 2 shows the movement settlement by settlement.
The descriptive point stands whatever produces it: the register records a wide gradient in the price of land and a narrow one in the price of the floorspace that land can carry. Section 3.4 asks what does produce it, and finds the regulatory-distortion reading unsupported once the coefficient floor is corrected.
3.4. Testing Regulatory Distortion
The natural reading of compression is that the regulatory allocation of development rights runs counter to the value gradient, undoing it. On that reading the ordering of settlements by effective cost should be unstable, and it was initially found to be so: evaluated at the coefficient floors originally assigned, the rank correlation between plot price and effective cost was +0.429 at maximum coefficient and −0.286 at minimum, an apparent change of sign. That result does not survive scrutiny. Table 5 sets out how it fails.
The sign change exists only at floors of 0.1 and 0.2, that is only when a countryside or non-member coefficient is applied to registered building plots. At Ka10 the correlation is +0.107 and at Ka9 it is +0.429. The effect is confined to Marathounda and Agia Marinouda, which together contribute 45 of 1,116 transactions: dropping Marathounda alone moves the correlation to +0.086 at both bounds, and dropping Agia Marinouda alone raises it to +0.714 at the maximum and +0.600 at the minimum, so in neither case does the negative sign survive. On the five settlements with at least fifty transactions the correlation is +0.500 at the maximum permitted coefficient and +0.900 at the minimum, positive at both bounds. None of these values is distinguishable from zero at n = 7, and the corrected pair (+0.429, p = 0.354; +0.107, p = 0.840) cannot be distinguished from each other.
The permitted band is a property of the settlement-level assignment made here (Section 2.3), not of the market. One zone referenced by the peri-urban group, H4, is absent from the Paphos Local Plan schedule although it appears in the national zone memorandum, so the floor is the lowest of an incomplete list. The realisation margin identified in Section 2.4, though not systematically related to the coefficient across the schedule, matters for this one comparison: the Paphos–Chlorakas contrast survives only while Chlorakas schemes do not realise their permitted coefficient at a rate more than 24% above Paphos schemes. The distortion hypothesis is left without support, although at these sample sizes no version of it could have been rejected outright. Everything below is evaluated at the maximum permitted coefficient, and the band serves description rather than inference.
3.5. Testing Efficient Capitalisation
The alternative explanation is that compression is what a competitively arbitraged land market produces. Two pricing models make different predictions here. A pure residual model, in which land absorbs what remains after construction cost and profit, implies an elasticity of effective land cost to output price of roughly one over the land share, about five at the shares reported below; a constant-share model implies an elasticity of one. Across the six settlements effective land cost is more dispersed than output price, 1.32-fold against 1.17-fold, where constant shares imply roughly equal dispersion and pure residual pricing implies a spread near 2.2-fold, indistinguishable from the raw plot-price spread of 2.34-fold. The ratio of log spreads, log(1.32)/log(1.17) or about 1.8, is not a slope: the two series attain their extremes at different settlements, and the cross-settlement ordinary least squares slope of log effective land cost on log output price is +0.38 (r = +0.24, n = 6), below the constant-share benchmark of one. The dispersion comparison rules out pure residual pricing; the slope cautions against reading the compression as tight coupling. Under constant shares land should also take a stable share of built value.
This is tested using dwelling transfers from the same register as a settlement-level proxy for achievable output price: full-share, non-distressed transfers of apartments and houses over 2019–2024, priced per square metre of enclosed area, for the six settlements with at least fifteen such transactions. Table 6 reports the result, and Figure 3 plots both series against output price.
The evidence is consistent with capitalisation on one count. Output prices span 1.17-fold across the six settlements and effective land cost spans 1.32-fold, while raw plot price spans 2.34-fold: the converted series lies far closer to the output-price gradient than the recorded one, which is roughly twice as steep as either. Restricting the proxy to apartments alone, the product the coefficient most directly governs, leaves this unchanged at 1.20-fold, 1.32-fold and 2.34-fold. The benchmark applied in Section 3.3 is applied here also. Substituting coefficient vectors that carry no planning information and recomputing the spread of the converted series across the same six settlements gives 1.45-fold for the binary assignment and 2.03-fold for the price-rank tercile, against 1.32-fold for the statutory schedule. Permuting the six coefficients across the six settlements, only 2 of the 120 distinct assignments (ties collapse the 720 orderings to 120, as in Section 3.3) produce a spread at or below the observed 1.32-fold (exact p = 0.017). The caveat of Section 3.3 applies here too: the other qualifying assignment is the one in strict order of plot price, and it is tighter, 1.21-fold against 1.32-fold. The permutation shows that the schedule is nearly price-monotone; it is not independent evidence that the schedule encodes output prices.
The second test runs against the hypothesis. If land were bid to a stable share of what the permitted floorspace can realise, dividing effective land cost by output price should reduce residual between-settlement variation. It does the opposite: across the six settlements carrying an output-price proxy, location explains 3.16% of the variance in log effective cost (against 3.5% on the full seven-settlement sample reported in Section 3.3) but 5.80% of the variance in log land share, an increase of 84%. Because output price is constant within a settlement, log land share is log effective cost shifted by a settlement constant, so the within-settlement sum of squares is again invariant and this comparison, like that of Section 3.3, has six effective observations. Whatever equalises the converted series across settlements, it is not the output-price gradient, and the land-share statistic is no evidence for capitalisation.
This test has limits. The rank correlations at six settlements (+0.486 with effective cost, +0.200 with plot price) carry permutation p-values of 0.356 and 0.714, and on the apartments-only subsample the gap between them closes to +0.429 against +0.371. They are illustrative and are not relied on; the spread comparison and the variance decomposition carry the description, and none of the three supports inference at these sample sizes. The land-share stability is a between-location property only: settlement medians span 0.174–0.238, but the pooled parcel-level distribution has a coefficient of variation of 0.788, so individual sites vary a great deal even where locations do not. The proxy is drawn from second-hand stock of mixed vintage and is subject to the same accepted-price censoring as the land series. The two tests therefore disagree, and this design cannot adjudicate between them. Capitalisation is advanced as the reading the evidence does not reject, rather than as an established result.
This has a corollary that shapes the rest of the paper. If the market prices development rights correctly, then the observed compression is the signature of transmission through a variable the register does not record, and the party disadvantaged is not the purchaser, who can obtain a Planning Authority certificate, but every institution that reads the register without one.
3.6. The Fiscal Descriptor
The register carries a second value descriptor for the same event, and unlike the first it can be identified rather than merely described. The divergence between declared and accepted price is not randomly distributed. Estimated at settlement level on mid-ranks, the mean declared-to-accepted ratio correlates with median plot price at +0.929 (p = 0.007) and with the permitted coefficient at +0.879 (p = 0.014), but with effective land cost at only +0.143 (p = 0.783). The ratio rises with price, so mean divergence is smallest where prices are highest: 9.6% in Paphos against 16.7% in Marathounda and 17.6% in Agia Marinouda, the two lowest-priced settlements, though the gradient is not strictly monotone across all seven.
The mean ratio also varies by year, from 0.806 in 2023 to 0.887 in 2024, a range of 0.081 that matches the between-settlement range of 0.080, and settlements are not balanced across a window in which prices rose; the settlement gradient is conditional on that composition, and within-year re-estimation is the natural check. Run on year-adjusted ratios, demeaning by transfer year before averaging by settlement, the gradient is unchanged: the correlation with median plot price is +0.964 (p = 0.003), and the year-adjusted divergences are 9.7% in Paphos against 17.2% in both Marathounda and Agia Marinouda, so year composition does not carry the settlement gradient. Because seven settlements support little inference, the estimate is repeated at transaction level with mid-ranks. Across the 8,944 filtered land transactions district-wide that carry both prices (Section 2.2), the ratio correlates with the transaction’s own price per square metre at +0.211 (t = 20.37). Within the catchment (n = 1,116) it correlates with the transaction’s own price at +0.158 (t = 5.34), with the settlement’s permitted coefficient at +0.110, and with effective land cost at +0.076; the latter two regressors are constant within settlement, taking seven values across 1,116 transactions, so their nominal t statistics overstate precision and the pair is read as descriptive. On the mid-rank method the ordering, recorded price first, permitted density second, effective land cost last, is the same at both levels of aggregation; an alternative tie-break inverts price and density at catchment level, so little weight is placed on which of those two ranks first. Because a majority of ratios sit exactly at unity and the coefficient takes few distinct values, these estimates are sensitive to rank-tie handling; mid-ranks are used throughout, and settlement-clustered inference would attenuate the nominal t statistics without disturbing the ordering. Figure 4 plots both settlement-level relationships.
In aggregate the gap is material. Declared consideration across the analysis population totals €2,006.2 million against €2,248.2 million accepted, a difference of €242.0 million or 10.8%.
Whether this reflects declaration behaviour or administrative assessment can be settled, and the register settles it. Under the Specific Performance framework a purchaser may deposit the contract of sale with the Department in advance of transfer, and the extract records whether this occurred. Deposit creates an independently lodged record of the consideration, ordinarily within six months of execution under Law 81(I)/2011, although a 2017 amendment permits later deposit by leave of the court, so contemporaneity is the norm rather than a guarantee; a transfer without one rests on the parties’ statement at transfer. The Department’s published assessment procedure makes no reference to deposit status, but deposit alters the evidence available to the assessor: a lodged contract corroborates the stated consideration, while its absence leaves only the parties’ statement, and an assessor who overrides uncorroborated statements more often would generate the observed contrast without any declaration component. That channel cannot be closed with the present extract, and it joins fee incidence as a second alternative to the declaration reading. Table 7 reports the comparison.
The contrast is large. Across the analysis population, transfers preceded by a deposited contract diverge by 8.3% in aggregate against 17.0% for those without, with mean ratios of 0.885 and 0.779 and under-declaration rates of 33.9% and 49.4%. The contrast persists within settlements, which narrows an alternative explanation without, as the qualifications below show, disposing of it. Value added tax applies to disposals of non-developed buildable land in the course of an economic activity, and transfer fees are waived entirely where it does. Where it does not, fees have been charged at half the headline scale since the 50% reduction was made permanent on 14 July 2016; at the resulting 1.5–4% marginal rates, fees of the order of €3.6 to €9.7 million would have been forgone had the observed divergence been accepted at face value. They were not forgone: fees are levied on the accepted price, and the accepted price is max(declared, assessed) (Section 2.2), so the divergence observed here is by construction the set of declarations the Department corrected. It bounds the declaration motive; it does not measure a realised revenue loss. Fee liability nevertheless differs systematically by disposal type, and developer and trader disposals concentrate in the high-value urban core. That fee-liability gradient would generate the observed price gradient without any behavioural component. But it cannot generate a deposit effect within a single settlement, and one is present in four of the five settlements with sufficient observations, including Paphos (+0.032).
Two qualifications follow. The within-settlement differences, from 0.000 to 0.043 and averaging 0.026 across the five settlements shown, are close to the contrast on the matched catchment sample, where transfers preceded by a deposited contract average 0.898 (n = 699) against 0.876 (n = 417) without, a difference of 0.022; within the catchment, the deposit margin itself rather than composition carries the effect. The far larger district-wide contrast of 0.106 mixes land types and settlements and is predominantly compositional. And deposit is elective: it is more common for bank-financed, off-plan and foreign purchases, so the comparison is not a randomised one and selection cannot be excluded. This bears directly on the value added tax argument above. Off-plan sales are developer disposals, and developer disposals in the course of an economic activity are the transactions on which value added tax applies and transfer fees are waived. Deposit status is therefore correlated with the fee liability that drives the declaration incentive, and correlated with it within settlements as well as between them, so the within-settlement contrast does not on its own break that channel. Conditioning directly on transfer-fee exemption or vendor legal status would settle the question and is the natural next test. Subject to those, the evidence indicates that the divergence is principally declaration behaviour rather than assessment practice, a distinction the register can support and that matters for any base built on it.
3.7. Subdivision Contributions as a Second-Order Allocation
A second regulatory mechanism operates on unsubdivided land. Fields entering subdivision surrender area to road, green-space and social-facility contributions before building rights attach. Local Plan areas apply a graduated green-space deduction of 5% below 1,500 m², 10% from 1,500 to 2,500 m² and 15% above 2,500 m², subject to a Planning Authority waiver power below 800 m² and a 40% overall cap; Policy Statement countryside areas apply a flat 10% under a 35% cap [28,29]. The green deduction applies to the area net of the road contribution rather than to the gross parcel.
On a 5,000 m² field with a 12% road contribution, the Local Plan regime deducts 25.2% of gross area against 20.8% under the countryside regime. The countryside regime is the more generous in area terms, but it applies where coefficients are lowest. The suburban residential zones governing the catchment’s peri-urban fields permit a coefficient of 0.8; the countryside maximum is 0.60. The same field therefore yields 2,992 m² of buildable area under the Local Plan against 2,376 m² under the countryside regime, a 1.26-fold difference. The lighter deduction delivers the smaller capacity, of modest magnitude and not itself a test of anything.
4. Discussion
4.1. What the Record Omits
The standard monocentric account holds that land price declines with distance from the centre as accessibility falls [30,31], and the plot-price series in Table 2 conforms to it. The conversion in Table 3 shows that gradient largely absorbed once development rights are counted, because the Local Plan grants its highest coefficients to its most central land. The market prices accessibility; the plan prices it out again. Section 3.5 is consistent with transmission rather than distortion, without establishing it: the converted series tracks output prices, land does not take a stable share of built value, and what follows is conditional on the transmission reading. On that reading, land is bid towards what the permitted floorspace can carry, a parameter the register does not hold.
The distinction from the established regulation literature needs care. That literature concerns the level of regulation and its effect on quantity and price [1,2,5,6], and the decomposition of land value into extensive and intensive margins is not new [7,8]. The result here concerns neither, and the metric itself, land value per unit of permitted floorspace, is likewise established practice. The result concerns the informational content of the recorded descriptor, and what it diagnoses is administrative data rather than planning policy. Stringency measures inferred from observed building heights against land-price-implied optima [6] would not detect it, because it is a property of the record rather than of the regulation.
The magnitude is easy to overstate. Land is a minority input; Section 3.5 puts it at 17.4–23.8% of built value. The entire spread of effective land cost across the seven settlements, €147/m² of buildable area, is under 6% of the roughly €2,600/m² total development cost of new apartment floorspace reported for this market [32], and 9–11% of the median resale output prices in Table 6. The claim here is not that the land descriptor drives development economics. It is that a descriptor consumed by valuation, taxation and policy analysis omits the variable that determines its meaning.
4.2. Consequences for Valuation Practice
Comparable-based valuation of development land on a per-square-metre-of-plot basis is unreliable across zone boundaries unless adjusted for permitted density. Given the magnitudes in Figure 1, such adjustment carries most of the valuation. Valuation standards require significant adjustments to be evidenced and reasoned [33,34], but do not prescribe how a density adjustment should be derived, and the transaction record supplies no field from which it could be. Intra-metropolitan estimates of how regulation is reflected in land and housing values [35] rest on the same joined price-and-zoning evidence that valuers here lack. The adjustment is made, where it is made at all, from the valuer’s own knowledge of the zoning, which is available, but is neither recorded in the evidence nor auditable in the report. Survey evidence on valuation practice in Cyprus bears directly on how far such unrecorded judgement is relied upon in the field [25].
Automated valuation carries the difficulty further. Models trained on transacted price and location without a zoning covariate will misprice development land systematically, and worst where the regulatory gradient is steepest. The automated valuation literature has concentrated on residential units, where physical attributes are richly observed and the entitlement has already been exercised [17,18]; development land is the harder case precisely because the decisive attribute is administrative rather than physical and sits in a different dataset from the one the model is trained on. Land-focused applications are comparatively rare. An automated valuation model developed for land in Limassol from transaction-based data tests estimation accuracy across two areas of contrasting location characteristics and market conditions [36], and machine-learning work on the Department’s own General Valuation concludes that the underlying databases require enrichment with additional property characteristics before automated estimates can carry the weight placed on them [37]. The present result identifies one such characteristic, and it is the one that determines what development land is worth. A better estimator will not close this; a joined record will. Governance frameworks proposed for AI-driven automated valuation press for transparency about model inputs and their limitations [38], and a documented absence is easier to disclose than an undocumented one.
For brokerage the implication is narrower. Marketing particulars for development land in this market typically quote plot area and price without the governing coefficient, an observation from practice rather than a measured share. Where the coefficient determines what is being acquired, disclosing it would align particulars with the information valuation and lending decisions require, and would fall within the remit of the professional bodies regulating estate agency and the technical professions in Cyprus. This is a proposal, not a finding: quantifying disclosure rates in listings would require a content analysis not conducted here.
4.3. Consequences for Tax Design
The finding bears directly on the choice between area-based and value-based tax instruments, and the choice is live. Cyprus abolished its recurrent immovable property tax by Law 86(I)/2016 with effect from 1 January 2017, and reinstatement has been recommended repeatedly by the International Monetary Fund [39] and noted analytically in European Commission country-report assessments of Cyprus’s underused tax bases [40]. Any reinstatement must choose a base.
An area-based charge levied on plot extent would, in a market with heterogeneous coefficients, tax a quantity only loosely coupled to what the owner may build: two owners with identical liabilities may hold development rights differing several-fold. An ad valorem base may track development potential more closely, to the extent that permitted density is capitalised into market value as Section 3.5 indicates, but only to the extent that assessment captures zoning, which returns the problem to the valuation infrastructure. The general case for value-based systems [41,42] is strengthened here and made conditional in the same breath: a poorly assessed ad valorem base may track development capacity no better than plot area while costing considerably more to administer. Section 3.6 sharpens the point, since the fiscal descriptor already in the register diverges from assessed value most where prices and coefficients are lowest.
The tax-design implication runs deeper than the choice of base, because the register’s second descriptor is itself compromised, and compromised in a direction that matters. Section 3.6 shows mean divergence smallest where prices are highest, 9.6% in Paphos against 16.7% in Marathounda and 17.6% in Agia Marinouda, alongside €242.0 million of value-weighted aggregate shortfall. A value base calibrated on declared consideration would therefore be least reliable at the bottom of the market, producing a regressive assessment error, concentrated precisely where taxpayer capacity to contest an assessment is weakest. An assessment calibrated on accepted value fares no better in kind, since that construct is the parties’ own declaration in 58.3% of cases. Neither is a sound foundation without reform to the record. This is a concrete instance of a general point in the property-tax literature: the administrative feasibility of a value base is not a detail of implementation but a determinant of whether the base is worth adopting [41,42].
4.4. Consequences for Land Administration
The register records parcel extent, declared price and accepted price. It does not record the planning zone. Cyprus publishes zone boundaries as an open spatial layer, attributable to parcels by overlay with the equally public cadastral parcel layer, so the information exists in the administrative record; what does not exist is a link between the two at the point of transaction. The evidence base that valuers, assessors and modellers consume therefore never carries the variable that determines development value, even though the state holds it.
Adding a zone reference to the transaction record is a low-cost reform: it creates no new data collection and joins two datasets that are already public. The fit-for-purpose land administration literature argues for exactly this kind of incremental, function-led extension of the cadastral record in preference to comprehensive re-survey [14,15], and this is a clean instance. The Land Administration Domain Model supplies the conformant vocabulary for such an extension, modelling the attachment of administrative attributes to spatial units, and would accommodate a zone reference without bespoke schema design [16]. The parallel finding in Section 3.6 compounds the case: the register’s two policy-relevant value attributes are, respectively, absent and systematically divergent.
The reform has a natural sequence. A parcel-to-zone linkage carried in the transaction record would immediately support density-adjusted comparable evidence and a zoning covariate for automated valuation. A second step, recording the coefficient actually consented rather than the zone maximum, would close the permitted-versus-realised gap that Section 2.4 can only bound; that datum exists in the permitting system and is simply not carried forward to the transfer record. A third, recording the basis on which the accepted price was determined, would allow the divergence documented in Section 3.6 to be decomposed into declaration behaviour and assessment practice, which the present data cannot separate. None requires new survey, new legislation or new collection burden on transacting parties.
There is a wider point about which failures are visible. A market that misprices land produces observable symptoms: vacancy, stalled schemes, arbitrage. A register that omits a variable produces none, because the participants who need the variable obtain it elsewhere and the institutions that do not need it immediately are the ones consuming the record. The deficiency surfaces only in the accuracy of valuations, the equity of a tax base and the quality of policy analysis, none of which generates a price signal. That is a reason to expect such deficiencies to persist, and an argument for auditing administrative records against the decisions they are used to support rather than against their own internal consistency.
4.5. Transferability and Limitations
The mechanism generalises wherever development rights are allocated through a density parameter that varies across a market and is not carried in the transaction record. Those conditions are common in coefficient-based planning systems. What transfers is the diagnostic, convert recorded price to price per unit of permitted floorspace, test whether the converted series tracks output prices better, and inspect what the register omits, rather than the magnitudes, which are local. Whether comparable island markets exhibit the same pattern is an empirical question this method makes answerable.
The binding limitation is the settlement-level assignment of coefficients, compounded by three of seven bands being undocumented or contradicted (Section 2.3). A parcel-level spatial join would resolve both and would permit hedonic estimation of how far permitted density is capitalised, which Section 3.5 can only test indirectly. That this join was not performed here may appear to sit awkwardly against the reform proposed in Section 4.4, and the distinction is worth drawing. Prospectively, at the point of transaction, the join is near-costless: the zone in force is the zone the parties are transacting under. Retrospectively it is not, because the Local Plan is periodically revised and a transaction from 2019 must be matched to the boundary as it stood then rather than to the layer published now. The reform is cheap going forward precisely because the historic reconstruction is expensive, which argues for making the change now. The design is cross-sectional and cannot separate capitalisation from the allocation of density to already-valuable land; Section 3.5 tests the question two ways and the tests disagree, so capitalisation remains a reading, not a result established here. Coefficients are assigned from the Local Plan text in force at the time of writing, and whether the schedule itself was amended within the transaction window is not established here; transactions are also pooled across 2019–2024 without time controls. Re-estimating the settlement decomposition with year fixed effects gives η² 0.1711 to 0.0364, a 78.7% reduction against 80.8% pooled, so pooling does not drive the compression. Settlements are unlikely to be balanced across a window in which land values rose steeply, so differential price growth across settlements cannot be separated from the between-settlement variance attributed to zoning. Deposit of a contract of sale is elective and correlates with vendor type, which the analysis cannot observe directly; the deposit result would be settled by conditioning on transfer-fee exemption or vendor legal status, and until that is done the fee-incidence channel remains open. And permitted rather than realised density is analysed; Section 2.4 bounds the gap but does not measure it. The output-price proxy rests on second-hand stock of mixed vintage.
5. Conclusions
The Paphos register fails twice over, and the two failures are of different kinds. The first is an omission the register could remedy by carrying a field it does not carry; the second is a corruption of a field it already carries. The evidence for the second is the stronger, and its consequences are the more immediate. Dividing transacted land price by the statutory building coefficient removes roughly four-fifths of the between-settlement variation in the price of development land in the Paphos catchment (η² 0.181 → 0.035). That is a description, not a claim: the coefficient is monotone in price, a vector built from price ranks alone performs better (85.1%), and the decomposition has seven effective observations however many transactions enter it.
The natural explanation, that regulation misallocates development rights relative to value, was tested and could not be sustained. The apparent instability in the effective-cost ordering was an artefact of applying a countryside coefficient to registered building plots in two settlements contributing 45 of 1,116 transactions, and no rank correlation between plot price and effective cost is distinguishable from zero at this sample size. The converted series tracks achievable output prices at least as closely as the raw series, which is consistent with permitted density being capitalised into land price; a second test, of whether land takes a stable share of output value, runs against that reading and is set out alongside it.
What remains is a conclusion about the record rather than about the plan. Permitted density determines what land is worth to a developer; the evidence here is consistent with the market pricing it, though the design cannot establish that; the transaction record does not carry it in either case. Comparables, automated valuation models, mass appraisal and any reinstated tax base therefore draw on a descriptor correlated with the price-determining variable but not carrying it, while the participants transacting the land are not so constrained. Between-settlement differences account for 18.1% of total variance in log land price, and the conversion absorbs about four-fifths of that, taking it to 3.5%; the other 81.9% of total variance lay within settlements from the outset and is untouched by zoning at this resolution. What the conversion cannot show is that the schedule, rather than the price ordering it follows, is doing the absorbing.
The register’s second descriptor fails independently, and there the evidence is stronger. Declared consideration diverges from administratively accepted value by €242.0 million across the analysis population, and the divergence is twice as large where no contract of sale was deposited, a contrast that narrows but persists within settlements. The published assessment procedure makes no reference to deposit status, but deposit alters the evidence before the assessor, so an assessment channel cannot be excluded (Section 3.6); subject to that and to fee incidence, the divergence is read as principally a declaration phenomenon. Whether it is fee-minimisation specifically cannot be settled without a vendor-status field, because deposit correlates with the developer disposals on which value added tax applies and transfer fees are waived. The direction of the finding is unaffected either way, and it is the direction that matters for policy: a value base calibrated on declared consideration would be least reliable at the bottom of the market and most reliable at the top. That is a regressivity problem, not a technical one, and it would be inherited by any reinstated tax on the day it commenced.
Three extensions follow. A spatial join of parcel polygons to zone boundaries would replace settlement-level assignment with parcel-level precision and permit direct hedonic estimation of capitalisation. Applying the diagnostic to comparable coefficient-zoned markets would establish whether the pattern is general. And extending the transaction record with a zone identifier, a reform requiring no new data collection, only the linking of two existing public datasets, would make the analysis routine rather than exceptional.
Supplementary Materials
The following supporting information can be downloaded at the website of this paper posted on Preprints.org.
Author Contributions
Conceptualization, G.K., T.D. and M.K.; methodology, G.K. and T.D.; software, G.K.; formal analysis, G.K.; investigation, G.K.; data curation, G.K.; writing—original draft preparation, G.K.; writing—review and editing, G.K., T.D. and M.K.; visualization, G.K.; supervision, T.D. All authors have read and agreed to the published version of the manuscript.
Funding
This research received no external funding.
Institutional Review Board Statement
Not applicable.
Data Availability Statement
The derived statistics supporting the results are contained within the article. The underlying transaction records are third-party administrative data obtained from the Department of Lands and Surveys, Paphos District Office, and are available from that Department subject to its own access procedures. The filtering protocol, exclusion audit, analysis code and derived settlement-level dataset are openly available upon request.
Acknowledgments
The authors thank the Department of Lands and Surveys, Paphos District Office, for access to the transaction register. During the preparation of this manuscript the authors used Claude (Anthropic) for drafting assistance, for generating code used in the statistical analysis, and for figure preparation. The authors have reviewed and edited the output and take full responsibility for the content of this publication.
Conflicts of Interest
The authors declare the following interests. T.D. and M.K. are Guest Editors of the Special Issue to which this manuscript is submitted. Neither has had, nor will have, any role in the editorial handling, reviewer selection or peer review of this submission. The authors request that the manuscript be assigned to an independent editor from outside the Special Issue guest editorial team, and that T.D. and M.K. be recused from all editorial decisions concerning it. This manuscript derives from an MSc dissertation completed at Neapolis University Pafos by G.K. under the supervision of T.D. The authors declare no other conflict of interest.
References
- Glaeser, E.L.; Gyourko, J. The Economic Implications of Housing Supply. J. Econ. Perspect. 2018, 32, 3–30.
- Saiz, A. The Geographic Determinants of Housing Supply. Q. J. Econ. 2010, 125, 1253–1296.
- Gyourko, J.; Molloy, R. Regulation and Housing Supply. In Handbook of Regional and Urban Economics; Duranton, G., Henderson, J.V., Strange, W.C., Eds.; Elsevier: Amsterdam, The Netherlands, 2015; Volume 5, pp. 1289–1337.
- Hilber, C.A.L.; Vermeulen, W. The Impact of Supply Constraints on House Prices in England. Econ. J. 2016, 126, 358–405.
- Bertaud, A.; Brueckner, J.K. Analyzing Building-Height Restrictions: Predicted Impacts and Welfare Costs. Reg. Sci. Urban Econ. 2005, 35, 109–125.
- Brueckner, J.K.; Fu, S.; Gu, Y.; Zhang, J. Measuring the Stringency of Land Use Regulation: The Case of China’s Building Height Limits. Rev. Econ. Stat. 2017, 99, 663–677.
- Glaeser, E.L.; Gyourko, J.; Saks, R.E. Why Is Manhattan So Expensive? Regulation and the Rise in Housing Prices. J. Law Econ. 2005, 48, 331–369.
- Cheshire, P.; Hilber, C.A.L. Office Space Supply Restrictions in Britain: The Political Economy of Market Revenge. Econ. J. 2008, 118, F185–F221.
- Calavita, N.; Mallach, A. (Eds.) Inclusionary Housing in International Perspective: Affordable Housing, Social Inclusion, and Land Value Recapture; Lincoln Institute of Land Policy: Cambridge, MA, USA, 2010.
- Crook, A.D.H.; Whitehead, C.M.E. Social Housing and Planning Gain: Is This an Appropriate Way of Providing Affordable Housing? Environ. Plan. A 2002, 34, 1259–1279.
- Ingram, G.K.; Hong, Y.-H. (Eds.) Value Capture and Land Policies; Lincoln Institute of Land Policy: Cambridge, MA, USA, 2012.
- OECD; Lincoln Institute of Land Policy. Global Compendium of Land Value Capture Policies; OECD Publishing: Paris, France, 2022.
- Muñoz Gielen, D.; van der Krabben, E. (Eds.) Public Infrastructure, Private Finance: Developer Obligations and Responsibilities; Routledge: Abingdon, UK, 2019.
- Enemark, S.; Bell, K.C.; Lemmen, C.; McLaren, R. Fit-For-Purpose Land Administration; FIG Publication No. 60; International Federation of Surveyors and the World Bank: Copenhagen, Denmark, 2014.
- Williamson, I.; Enemark, S.; Wallace, J.; Rajabifard, A. Land Administration for Sustainable Development; ESRI Press: Redlands, CA, USA, 2010.
- International Organization for Standardization. ISO 19152-1:2024 Geographic Information—Land Administration Domain Model (LADM)—Part 1: Generic Conceptual Model; ISO: Geneva, Switzerland, 2024.
- Kok, N.; Koponen, E.-L.; Martínez-Barbosa, C.A. Big Data in Real Estate? From Manual Appraisal to Automated Valuation. J. Portf. Manag. 2017, 43, 202–211.
- d’Amato, M.; Kauko, T. (Eds.) Advances in Automated Valuation Modeling: AVM after the Non-Agency Mortgage Crisis; Springer: Cham, Switzerland, 2017.
- Briguglio, L. Small Island Developing States and Their Economic Vulnerabilities. World Dev. 1995, 23, 1615–1632.
- Armstrong, H.W.; Read, R. The Phantom of Liberty? Economic Growth and the Vulnerability of Small States. J. Int. Dev. 2002, 14, 435–458.
- Cocola-Gant, A. Tourism Gentrification. In Handbook of Gentrification Studies; Lees, L., Phillips, M., Eds.; Edward Elgar: Cheltenham, UK, 2018; pp. 281–293.
- Wachsmuth, D.; Weisler, A. Airbnb and the Rent Gap: Gentrification through the Sharing Economy. Environ. Plan. A 2018, 50, 1147–1170.
- Nikiforou, P.; Dimopoulos, T.; Sivitanides, P. Identifying How the Time on the Market Affects the Selling Price: A Case Study of Residential Properties in Paphos (Cyprus) Urban Area. J. Eur. Real Estate Res. 2022, 15, 368–386.
- Statistical Service of Cyprus (CyStat). Census of Population and Housing 2021: Final Results; Republic of Cyprus: Nicosia, Cyprus, 2024.
- Dimopoulos, T.; Ioakim, V. A Discussion on Mass Appraisals: Case Study on Land Plots, Views of Local Appraisers and the Future in Property Valuations. J. Prop. Tax Assess. Adm. 2024, 21, 5–20.
- Department of Town Planning and Housing. Υπόμνημα Πολεοδομικών Ζωνών [Town Planning Zones Memorandum]; Republic of Cyprus: Nicosia, Cyprus, 2024. [EXACT EDITION AND data.gov.cy URL WITH ACCESS DATE TO BE INSERTED BEFORE SUBMISSION].
- Department of Town Planning and Housing. Local Plan for Paphos, Approved Text; Republic of Cyprus: Nicosia, Cyprus, 2021.
- Department of Town Planning and Housing. Παραρτήματα Τοπικών Σχεδίων [Local Plan Appendices], Appendix B, §§3.1–3.7; Republic of Cyprus: Nicosia, Cyprus, 2011 (approved 2012).
- Department of Town Planning and Housing. Policy Statement for the Countryside, Consolidated Text; Republic of Cyprus: Nicosia, Cyprus, 2014 (as amended; current consolidated text 14 June 2024).
- Alonso, W. Location and Land Use: Toward a General Theory of Land Rent; Harvard University Press: Cambridge, MA, USA, 1964.
- Brueckner, J.K. The Structure of Urban Equilibria: A Unified Treatment of the Muth-Mills Model. In Handbook of Regional and Urban Economics; Mills, E.S., Ed.; Elsevier: Amsterdam, The Netherlands, 1987; Volume 2, pp. 821–845.
- Kalaitsidis, G.; Dimopoulos, T.; Katafygiotou, M. The Affordable Ceiling and the Functional Floor: Dwelling Size, Construction Cost and Family Housing in a Constrained Land Market. Land 2026, under review. [MANUSCRIPT ID TO BE INSERTED ON SUBMISSION].
- Royal Institution of Chartered Surveyors. RICS Valuation – Global Standards, effective 31 January 2025; RICS: London, UK, 2024.
- International Valuation Standards Council. International Valuation Standards, effective 31 January 2025; IVSC: London, UK, 2024.
- Kok, N.; Monkkonen, P.; Quigley, J.M. Land Use Regulations and the Value of Land and Housing: An Intra-Metropolitan Analysis. J. Urban Econ. 2014, 81, 136–148.
- Apostolidis, S.; Dimopoulos, T. Developing an Automated Valuation Model for Estimating Land Values in Limassol. In Proceedings of the Ninth International Conference on Remote Sensing and Geoinformation of the Environment (RSCy2023), Ayia Napa, Cyprus, 3–5 April 2023; Proc. SPIE 12786, 127860I. [CrossRef]
- Dimopoulos, T.; Bakas, N. Sensitivity Analysis of Machine Learning Models for the Mass Appraisal of Real Estate. Case Study of Residential Units in Nicosia, Cyprus. Remote Sens. 2019, 11, 3047.
- Renigier-Biłozor, M.; Ache, P.; Dimopoulos, T.; Janowski, A. The Future of Property Valuation: AVMs and CAMAs in the Era of AI. Econ. Environ. 2026, 96, 974.
- International Monetary Fund. Cyprus: 2024 Article IV Consultation, Staff Report; IMF Country Report; International Monetary Fund: Washington, DC, USA, 2024.
- European Commission. Country Report, Cyprus; European Commission: Brussels, Belgium, 2024.
- Slack, E.; Bird, R.M. How to Reform the Property Tax: Lessons from around the World; IMFG Papers on Municipal Finance and Governance No. 21; University of Toronto: Toronto, ON, Canada, 2015.
- Norregaard, J. Taxing Immovable Property: Revenue Potential and Implementation Challenges; IMF Working Paper WP/13/129; International Monetary Fund: Washington, DC, USA, 2013.
Figure 1.
Effective land cost by Paphos Local Plan zone, holding plot price constant at €400/m². Labels above bars give the building coefficient. Zone codes are transliterated from the Greek (Κα → Ka, Πα → Pa, Εα → Ea, Εβ → Eb, ΚΓ → KG, H → H, Γ → G). The range shown, from €222/m² at BC 1.8 to €4,000/m² at BC 0.1, follows arithmetically from the span of coefficients and is presented to illustrate the transformation rather than as a result. Zone G3 (BC 0.1) is a countryside zone and cannot govern a registered building plot; it is retained here only to show the full span of the schedule and is excluded from every settlement band (Section 2.3).
Figure 1.
Effective land cost by Paphos Local Plan zone, holding plot price constant at €400/m². Labels above bars give the building coefficient. Zone codes are transliterated from the Greek (Κα → Ka, Πα → Pa, Εα → Ea, Εβ → Eb, ΚΓ → KG, H → H, Γ → G). The range shown, from €222/m² at BC 1.8 to €4,000/m² at BC 0.1, follows arithmetically from the span of coefficients and is presented to illustrate the transformation rather than as a result. Zone G3 (BC 0.1) is a countryside zone and cannot govern a registered building plot; it is retained here only to show the full span of the schedule and is excluded from every settlement band (Section 2.3).
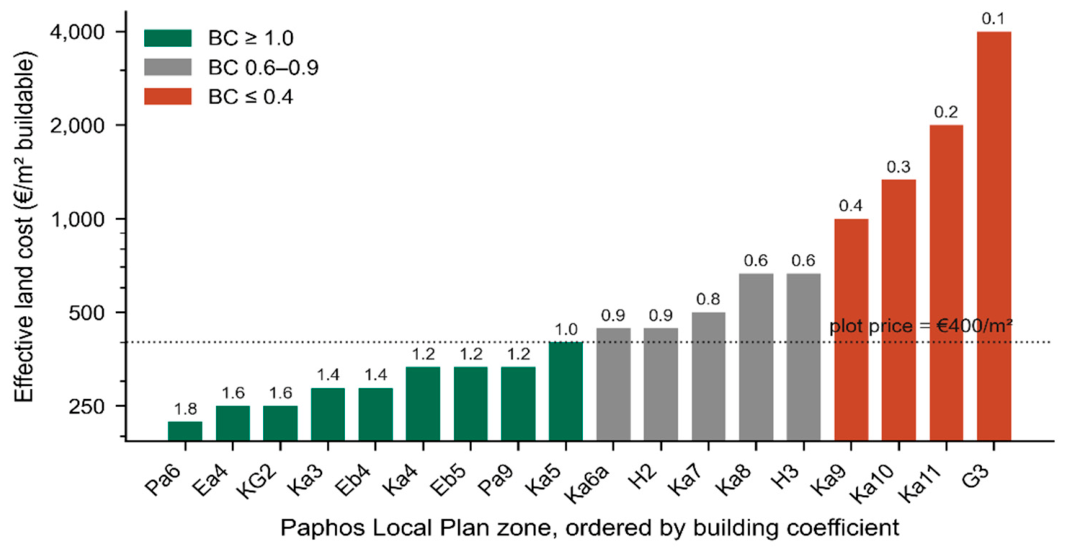
Figure 2.
Median plot price (€/m² of plot) and effective land cost (€/m² of permitted buildable area) for the seven catchment settlements, 2019–2024, ordered by plot price. Each settlement’s pair is joined. Only Paphos moves left; every other settlement moves right, and the narrowing of the range between the two columns is the compression. Effective cost is evaluated at the maximum permitted building coefficient.
Figure 2.
Median plot price (€/m² of plot) and effective land cost (€/m² of permitted buildable area) for the seven catchment settlements, 2019–2024, ordered by plot price. Each settlement’s pair is joined. Only Paphos moves left; every other settlement moves right, and the narrowing of the range between the two columns is the compression. Effective cost is evaluated at the maximum permitted building coefficient.
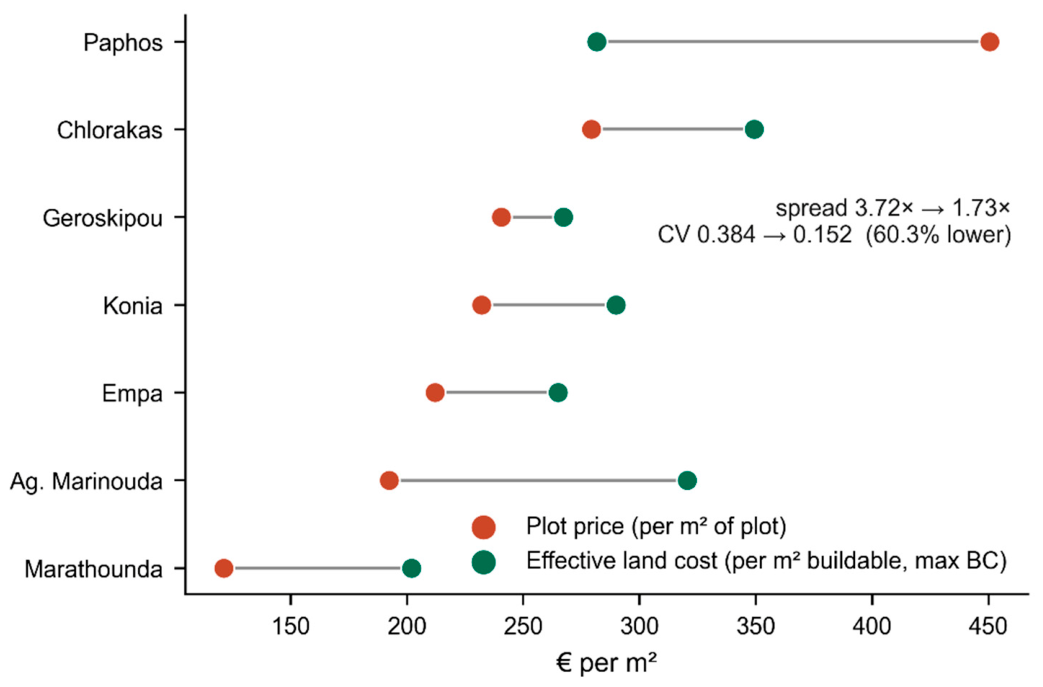
Figure 3.
Achievable output price against the recorded descriptor (panel a) and against the converted one (panel b), six settlements. Output price is the median accepted price per square metre of enclosed area for full-share, non-distressed dwelling transfers, 2019–2024. Rank correlations carry exact permutation p-values and are illustrative only at n = 6.
Figure 3.
Achievable output price against the recorded descriptor (panel a) and against the converted one (panel b), six settlements. Output price is the median accepted price per square metre of enclosed area for full-share, non-distressed dwelling transfers, 2019–2024. Rank correlations carry exact permutation p-values and are illustrative only at n = 6.
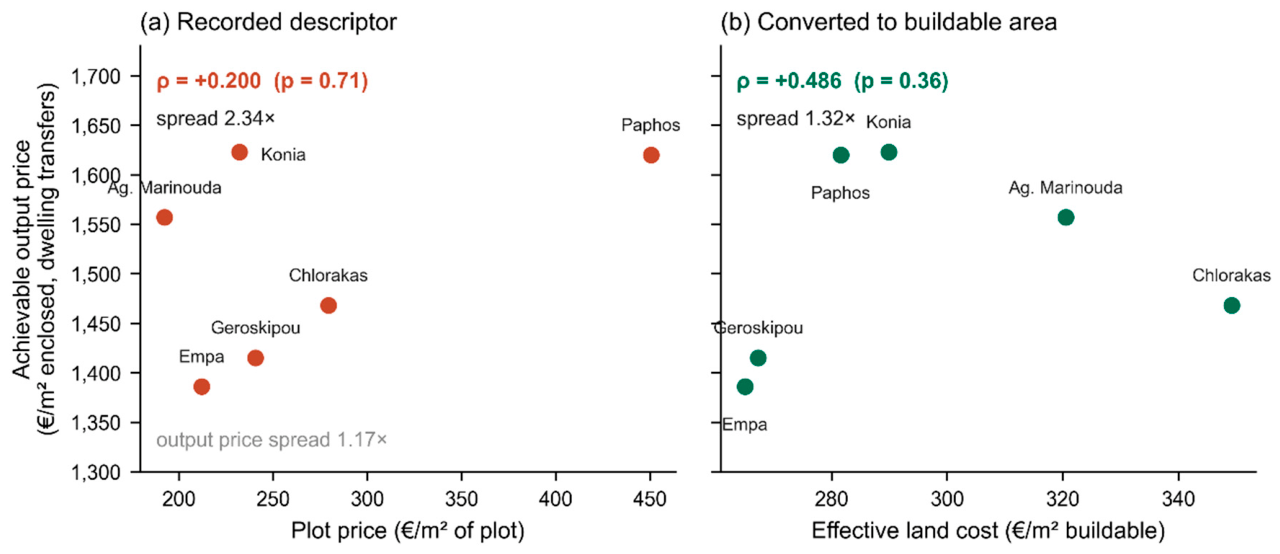
Figure 4.
Mean declared-to-accepted price ratio by settlement, against the recorded descriptor (panel a) and against effective land cost (panel b), seven catchment settlements, 2019–2024. The ratio tracks recorded price closely (ρ = +0.929, p = 0.007) and effective land cost barely at all (ρ = +0.143, p = 0.783); the correlation with permitted density, +0.879, is not plotted and is reported in Section 3.6.
Figure 4.
Mean declared-to-accepted price ratio by settlement, against the recorded descriptor (panel a) and against effective land cost (panel b), seven catchment settlements, 2019–2024. The ratio tracks recorded price closely (ρ = +0.929, p = 0.007) and effective land cost barely at all (ρ = +0.143, p = 0.783); the correlation with permitted density, +0.879, is not plotted and is reported in Section 3.6.
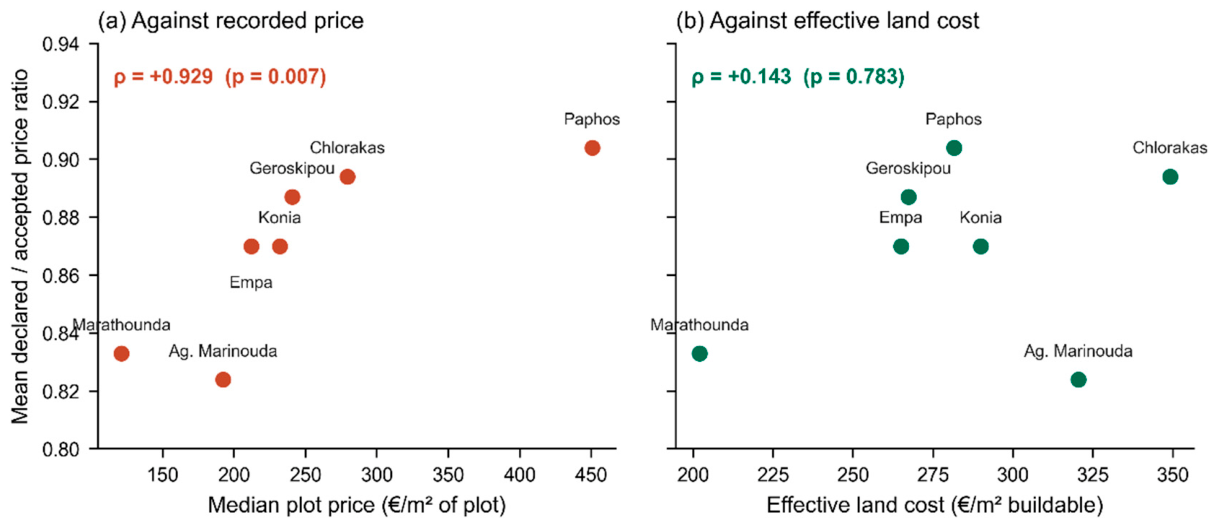

Table 1.
Construction of the analysis population from the Paphos District Land Registry title-deed extract.
Table 1.
Construction of the analysis population from the Paphos District Land Registry title-deed extract.
| Stage | Records | Basis |
| Title-deed transfers extracted, 2008–2024 | 39,940 | DLS Paphos register |
| Excluded: partial ownership share | 3,293 | Price not for full parcel |
| Excluded: restructuring or foreclosure | 3,672 | Not arm’s-length |
| Excluded: mortgage-related transfer | 697 | Not a sale |
| Excluded: buildings present on parcel | 620 | Consideration embeds improvements |
| Excluded: antiparochi (land-for-units) | 2 | No cash consideration |
| Valid land transfers, all years | 32,264 | Net of exclusions |
| Restricted to 2019–2024 | 8,945 | Analysis population |
| of which building plots (oikopedo) | 2,614 | Subdivided, development-ready |
| of which fields (chorafi) | 5,114 | Unsubdivided |
| of which other land categories | 1,217 | Residual and mixed categories: 482 field-typed, 19 plot-typed, 436 unspecified and 212 building-typed records, with 68 others; the building-typed records carry no buildings-on-land exclusion flag and are retained. Excluding every building-typed record from the analysis population (318 of 8,944 district-wide) moves the aggregate divergence from 10.8% to 10.9% and the deposit contrast from 17.0% and 8.3% to 17.3% and 8.4%, so no conclusion changes |
| Catchment building plots, 7 settlements | 1,116 | Primary analysis sample |
Exclusion categories are not mutually exclusive; records meeting more than one criterion are counted under each, so the listed exclusions exceed their net effect. Contracts of sale are held separately and do not enter this population.
Table 2.
Building plot (oikopedo) values by catchment settlement, arm’s-length transactions, 2019–2024.
Table 2.
Building plot (oikopedo) values by catchment settlement, arm’s-length transactions, 2019–2024.
| Settlement | n | Mean (€/m²) | Median (€/m²) | Q1 (€/m²) | Q3 (€/m²) | Mean plot area (m²) |
| Paphos | 572 | 617 | 451 | 333 | 693 | 607 |
| Geroskipou | 192 | 367 | 241 | 214 | 431 | 566 |
| Chlorakas | 55 | 428 | 279 | 197 | 520 | 963 |
| Empa | 139 | 370 | 212 | 196 | 515 | 538 |
| Konia | 113 | 401 | 232 | 221 | 540 | 685 |
| Marathounda | 16 | 165 | 121 | 117 | 181 | 504 |
| Agia Marinouda | 29 | 297 | 192 | 162 | 230 | 540 |
| Catchment (pooled) | 1,116 | 497 | 350 | 230 | 594 | 614 |
Values are accepted prices. Source: DLS Paphos register, filtered per Table 1.
Table 3.
Building coefficient (BC) bands and effective land cost per square metre of permitted buildable area, evaluated at the maximum permitted coefficient.
Table 3.
Building coefficient (BC) bands and effective land cost per square metre of permitted buildable area, evaluated at the maximum permitted coefficient.
| Settlement | n | Median plot (€/m²) | BC band | Effective land cost (€/m² buildable) |
| Paphos | 572 | 451 | 1.00–1.60 | 282 |
| Geroskipou | 192 | 241 | 0.60–0.90 | 267 |
| Empa | 139 | 212 | 0.60–0.80 | 265 |
| Agia Marinouda | 29 | 192 | 0.30–0.60 | 321 |
| Chlorakas | 55 | 279 | 0.60–0.80 | 349 |
| Konia | 113 | 232 | 0.60–0.80 | 290 |
| Marathounda | 16 | 121 | 0.30–0.60 | 202 |
| Spread (max ÷ min) | , | 3.72× | , | 1.73× |
| Coefficient of variation | , | 0.384 | , | 0.152 |
Table 4.
Between-settlement variance in the price of development land, before and after conversion, with benchmark coefficient vectors and a documented-subset restriction.
Table 4.
Between-settlement variance in the price of development land, before and after conversion, with benchmark coefficient vectors and a documented-subset restriction.
| Coefficient vector applied | Planning content | η² log plot price | η² log converted | Variance reduction |
| Statutory Local Plan schedule | Full | 0.181 | 0.035 | 80.8% |
| Tercile by price rank (1.6 / 1.0 / 0.6) | None | 0.181 | 0.027 | 85.1% |
| Binary (Paphos 1.6, others 0.8) | None | 0.181 | 0.051 | 72.0% |
| Permutation of the statutory vector | , | , | , | 2 of 420 reach 80.8% (p = 0.005) |
| Documented settlements only (n = 932) | Full | 0.167 | 0.014 | 91.4% (best p = 0.083) |
η² from a one-way decomposition of log price by settlement, 1,116 transactions across seven settlements; the final row is 932 transactions across four. The within-settlement sum of squares is invariant under the conversion (Section 2.5), so the comparison has seven effective observations.
Table 5.
Sensitivity of the settlement rank correlation to the coefficient floor assigned to peri-urban settlements.
Table 5.
Sensitivity of the settlement rank correlation to the coefficient floor assigned to peri-urban settlements.
| Coefficient floor applied to peri-urban settlements | Zone | ρ at that floor | Exact permutation p |
| 0.10 (originally applied) | G3, countryside | −0.286 | 0.556 |
| 0.20 | Ka11, not in the group | −0.286 | 0.556 |
| 0.30 (adopted) | Ka10 | +0.107 | 0.840 |
| 0.40 | Ka9 | +0.429 | 0.354 |
Exact two-sided permutation p-values over all 5,040 orderings at n = 7. Zone G3 is a countryside zone and cannot govern a registered building plot. Zone Ka11 is a rural residential zone that is not a member of the peri-urban group and was therefore never a candidate floor. Ka10 (0.3) is the lowest coefficient attaching to a listed group member; zone H4 is referenced by the group but absent from the Paphos schedule (Section 3.4).
Table 6.
Achievable output price, effective land cost and land share of built value.
| Settlement | n dwelling transfers | Median output price (€/m² enclosed) | Apartments only (€/m²) | Effective land cost (€/m² buildable) | Land share of built value |
| Paphos | 3,432 | 1,620 | 1,611 | 282 | 0.174 |
| Geroskipou | 315 | 1,415 | 1,348 | 267 | 0.189 |
| Empa | 150 | 1,386 | 1,339 | 265 | 0.191 |
| Konia | 161 | 1,623 | 1,600 | 290 | 0.179 |
| Chlorakas | 612 | 1,468 | 1,429 | 349 | 0.238 |
| Agia Marinouda | 73 | 1,557 | 1,498 | 321 | 0.206 |
| Spread (max ÷ min) | , | 1.17× | 1.20× | 1.32× | CV 0.109 |
Output price proxied by median accepted price per square metre of enclosed area for full-share, non-distressed dwelling transfers, 2019–2024. Marathounda is omitted, having fewer than fifteen qualifying transactions. The apartments-only column restricts the proxy to the product the building coefficient most directly governs. Land share divides cost per square metre of permitted buildable area by price per square metre of enclosed area; the denominators differ (Section 2.4), so the share indicates relative magnitude rather than an accounting ratio.
Table 7.
Declared-to-accepted divergence by contract-of-sale deposit status.
| Group | n | Mean declared/accepted | % declaring below | Aggregate divergence (value-weighted) |
| Contract of sale deposited | 4,443 | 0.885 | 33.9% | 8.3% |
| No contract deposited | 4,501 | 0.779 | 49.4% | 17.0% |
| Pooled (as Section 2.2) | 8,944 | 0.832 | 41.7% | 10.8% |
| Paphos, deposited | 376 | 0.915 | , | , |
| Paphos, not deposited | 196 | 0.883 | , | , |
| Chlorakas, deposited | 32 | 0.912 | , | , |
| Chlorakas, not deposited | 23 | 0.869 | , | , |
| Empa, deposited | 71 | 0.886 | , | , |
| Empa, not deposited | 68 | 0.854 | , | , |
| Konia, deposited | 85 | 0.875 | , | , |
| Konia, not deposited | 28 | 0.854 | , | , |
| Geroskipou, deposited | 113 | 0.887 | , | , |
| Geroskipou, not deposited | 79 | 0.887 | , | , |
Analysis population, 2019–2024. The pooled row reproduces the figures from Section 2.2. Within-settlement rows are restricted to catchment settlements with at least twenty transactions in each group.
Disclaimer/Publisher’s Note: The statements, opinions and data contained in all publications are solely those of the individual author(s) and contributor(s) and not of MDPI and/or the editor(s). MDPI and/or the editor(s) disclaim responsibility for any injury to people or property resulting from any ideas, methods, instructions or products referred to in the content. |
© 2026 by the authors. Licensee MDPI, Basel, Switzerland. This article is an open access article distributed under the terms and conditions of the Creative Commons Attribution (CC BY) license (http://creativecommons.org/licenses/by/4.0/).
Copyright: This open access article is published under a Creative Commons CC BY 4.0 license, which permit the free download, distribution, and reuse, provided that the author and preprint are cited in any reuse.