

Submitted:
30 August 2026
Posted:
01 September 2026
You are already at the latest version
Abstract
Research on small-firm profitability has organised itself around capital structure, leaving the operating model largely unexamined. This paper places both in one specification and estimates it three times—by panel methods, unsupervised partitioning and machine-learning regression—on 14,913 Italian firms observed between 2014 and 2025 across three regulatory regimes. Three findings emerge. The operating model dominates: the labour share of value added is stable across specifications, invariant across four clusters recovered from accounting data alone, and carries most of the out-of-sample predictive content. The capitalisation coefficient is not identified, changing sign across specifications; instrument failure traces to profit persistence. And the structure of profitability determination differs across the three populations, contradicting the common-mechanism premise underlying certification schemes.
Keywords:
firm profitability
; capital structure
; labour share
; innovative start-ups
; specification uncertainty
1. Introduction
Why some firms earn more than others has been answered, in the literature on small and medium enterprises, almost entirely in financial terms. Capital structure is the organising variable: Adair and Adaskou (2015), Balios et al. (2016), Dalci (2018), D’Amato (2019), Bui et al. (2021), Boshnak (2023) and Arhinful et al. (2025) estimate the association between leverage and profitability across national panels and report with remarkable consistency that the two move in opposite directions. Recent work extends the covariate set—Agliardi et al. (2024), Gutiérrez-Ponce (2024), Abdalla et al. (2025)—without reopening the question of whether financial structure is the right organising variable.
It may not be. Return on assets is a joint product of how a firm is financed and how it operates, and the operating side—the share of value added absorbed by labour, the intensity of bought-in production, the reliance on leased rather than owned assets—has been left almost entirely outside the discussion. Cost structure is studied at sectoral or macroeconomic level, where Canarella et al. (2013), Grau and Reig (2021) and Bradfield et al. (2023) locate it, and enters firm-level models as an unexamined control if at all. The two explanations have never been placed in competition inside a single specification. That is the gap, and the research question follows from it: when financial structure and operating model are estimated jointly on the same firms, which determines profitability, and how much of the answer survives the choice of estimator?
Posing the question this way exposes a second problem. The equity ratio and return on assets share a component: net worth contains current-year profit, and return on assets is computed on that same profit, so part of any contemporaneous association is an accounting identity. Campello (2006) recognised the joint determination of financing and performance, and a substantial literature—Bharati and Jia (2018), Iqbal et al. (2022), Adem and Dsouza (2024), Dsouza et al. (2025)—addresses endogeneity through system GMM or lagged instruments. But endogeneity is treated as a nuisance corrected in a robustness column, not as a threat to whether the parameter is recoverable at all.
A third literature, developed in parallel without contact with the other two, completes the argument. Firm profits are persistent and mean-reverting: Glen et al. (2001), Goddard et al. (2006), Bartoloni and Baussola (2009), Maury (2018) and Eklund and Lappi (2019) establish the regularity across settings. Its implication for identification has not been drawn. If profitability at t is substantially predicted by profitability at t−2, any lagged financial ratio embedding past profit is correlated with the current error, and the internal instruments the endogeneity literature relies on are invalid by construction.
The setting is the Italian population of certified innovative firms with a matched control group of conventional SMEs: 14,913 firms observed between 2014 and 2025. Decree-law 179/2012 created certified innovative start-ups with a statutory life of sixty months; Decree-law 3/2015 added innovative SMEs as an intermediate category. Evaluations by Caselli et al. (2019), Biancalani et al. (2022), Aiello et al. (2024) and Albanese and Bronzini (2026) estimate average effects while presuming the mechanism through which certification operates—a relaxed financial constraint—without measuring it. Three populations drawn from one accounting framework differ in the financial instruments available to them.
The originality lies in estimating it three times over, by methods answering different questions. Panel estimation asks what the average association is and whether it survives the estimator. Unsupervised partitioning asks whether one coefficient vector describes every firm and, unlike the taxonomy work of Chu et al. (2014), Ayadi et al. (2021) and Uddin et al. (2024), re-estimates the relationship inside each group. Machine-learning regression asks whether the linear form is adequate and, unlike the prediction-oriented work of Jones (2023), D’Amato et al. (2024) and Mekelburg and Strauss (2024), uses the same firm-demeaned data as the panel estimator, so the comparison is like-for-like and the residual gap can be decomposed. Convergence among methods with different assumptions is what makes the conclusion durable.
The contribution is fourfold: it measures the relative weight of financial and operating determinants within one specification; it shows that the capitalisation coefficient is not identified by accounting data of this kind and diagnoses why the instruments fail; it establishes that the structure of profitability determination differs across regulatory populations, which bears on the premise of the certification scheme; and it demonstrates a diagnostic rather than competitive use of machine learning.
The article continues as follows. Section 2 reviews the four literatures the paper draws on—capital structure and small-firm performance, endogeneity and identification, profit persistence, and the evaluation of certification schemes—and locates the gap the study addresses. Section 3 describes the data, the construction of the variables and the three estimation strategies. Section 4 reports the panel estimates and the specifications through which the capitalisation coefficient is traced. Section 5 partitions firms on the variables of the equation and re-estimates it within each group. Section 6 tests the adequacy of the linear functional form by machine-learning regression. Section 7 positions the findings relative to the existing literature, Section 8 draws the policy implications, Section 9 sets out the limitations, and Section 10 concludes. Four appendices report the full estimation tables, the instrumental-variable attempts, the clustering battery and the machine-learning diagnostics.
2. Literature Review
Capital structure and profitability in small firms. Whether the way a firm is financed shapes what it earns is among the most heavily worked questions in the empirical literature on small and medium enterprises, and its central result is unusually stable across settings: leverage and profitability are negatively associated. Adair and Adaskou (2015) establish the pattern for French SMEs, Balios et al. (2016) for Greek firms under crisis conditions, Banga and Gupta (2017) and Gnanaprasuna et al. (2025) for Indian samples, Dalci (2018) for Chinese manufacturers, D’Amato (2019) for Italian SMEs, Agyei et al. (2020) for Ghanaian banks and Bui et al. (2021) for Vietnam. Boshnak (2023), Mansour et al. (2023), Mahmood et al. (2023), Kambi and Kasoga (2024) and Arhinful et al. (2025) extend the finding to further national panels, while more recent work enlarges the covariate set rather than reopening the question: Agliardi et al. (2024) introduce dynamic optimisation, Gutiérrez-Ponce (2024) sustainability reporting, Abdalla et al. (2025) family ownership and Marozva (2026) macro-financial conditions. The consistency of the sign conceals a real disagreement about why it holds. Under pecking-order reasoning, profitable firms accumulate retained earnings and borrow less, so causality runs from performance to structure and the negative coefficient describes financing behaviour rather than its consequences. Under trade-off and agency reasoning, leverage disciplines managers and lowers the cost of capital, and the negative sign becomes a puzzle to be resolved by appeal to distress costs. Kenourgios et al. (2020), Amini et al. (2021) and Duppati et al. (2023) each report evidence compatible with more than one mechanism, and the designs employed cannot separate them, because a single contemporaneous correlation is consistent with all of them. A smaller set of studies reports the opposite sign or a conditional one, typically in samples of young or capital-constrained firms, and the divergence is generally attributed to institutional differences or sample composition rather than to specification. Three features of this literature bear on what follows. The modal design is a national panel of a few hundred to a few thousand firms observed over five to ten years, estimated by fixed effects or system GMM with contemporaneous regressors. The equity or debt ratio is almost always the focal variable, and cost-structure variables, where they appear at all, enter as controls without discussion. And the mechanical relationship between dependent variable and focal regressor is rarely acknowledged: net worth contains current-year profit, and return on assets is computed on that same profit, so part of any contemporaneous association is an accounting identity rather than an economic relationship. Campello (2006) is among the few to treat financing and performance as jointly determined, and that position has not become standard practice in the work that followed.
Endogeneity and what identification is used for. A methodologically self-aware body of work addresses the problem directly. Bharati and Jia (2018), Canarella and Miller (2018), Ahmed et al. (2022), Iqbal et al. (2022), Adem and Dsouza (2024), Chauhan et al. (2024), Choi et al. (2024), Dsouza et al. (2025), Li et al. (2025), Essel (2025, 2026), Alwadeai and Abideen (2026) and Islam et al. (2026) all confront endogeneity explicitly, typically through system GMM or lagged internal instruments, while Camuffo and Poletto (2024) move towards experimental identification. Yet endogeneity is generally treated as a nuisance to be corrected rather than as evidence in its own right, and the correction appears as a robustness column beside a preferred estimate. What is almost never done is to trace the focal coefficient across the full range of estimators and treat disagreement among them as the substantive finding. Where instruments fail—as internal lags must whenever the dependent variable is persistent—the failure tends not to be reported. The tools are present in this literature; they are used to defend an estimate rather than to test whether any estimate is defensible.
Profit persistence. A separate and theoretically mature line of work establishes that firm profits are persistent and mean-reverting. Glen et al. (2001) document the pattern in emerging markets, Goddard et al. (2006) in European manufacturing, Bartoloni and Baussola (2009) in Italy, Hirsch and Gschwandtner (2013) and Hirsch and Hartmann (2014) in food processing, and Eklund and Lappi (2019) across European regions. Maury (2018) and Wibbens (2019) connect persistence to competitive advantage, Hirsch et al. (2021), Jaisinghani and Sekhon (2022) and Opstad et al. (2022) extend it to more recent samples, Fairfield et al. (2009) tie it to accounting measurement and Agliardi et al. (2026) to refinancing decisions. The implication for the two preceding literatures is direct and largely unexploited. If profitability at t is substantially predicted by profitability at t−2, then any lagged financial ratio embedding past profit is correlated with the current error through persistence alone. Persistence therefore does not merely complicate estimation: it invalidates the internal instruments on which identification routinely relies. Each literature is well developed, and each cites the other rarely.
Innovative firms and public support. Public support for innovative and young firms has generated a dense empirical literature, and the Italian case is among the most closely studied. Decree-law 179/2012 created a certified category of innovative start-ups with a statutory life of sixty months, granting tax relief, free access to a public credit guarantee, exemption from ordinary insolvency procedures and relief from company-law rules on capital maintenance; Decree-law 3/2015 added innovative SMEs as an intermediate category, with eligibility thresholds on research spending, graduate employment and intellectual property. Caselli et al. (2019), Antonietti and Gambarotto (2020), Barboza and Capocchi (2020), Cavallo et al. (2020, 2021), Accetturo (2022), Biancalani et al. (2022), Colombelli et al. (2023), Agstner (2024), Aiello et al. (2024), Banfi et al. (2024), Bottai et al. (2024), Anderloni and Harasheh (2025), Barboza and Braga (2025), Colombelli and Tubiana (2025) and Albanese and Bronzini (2026) between them examine financing, employment, survival, location and innovation output. Two limitations recur. Evaluations estimate average treatment effects on outcomes while treating the mechanism as given: certification is presumed to operate by relaxing a financial constraint, and the constraint itself is not measured. And the comparison is almost always between certified firms and a matched control, leaving the internal heterogeneity of the certified population unexamined, even though that population contains firms at very different stages of operational development. The setting is well suited to addressing both, since the scheme defines three populations drawn from a single national accounting framework, which makes a comparison of coefficient structure across them meaningful in a way cross-country comparisons are not.
Firm taxonomies and machine learning. Two methodological literatures complete the picture. Work on firm taxonomies partitions firms by financial or business-model characteristics: Chu et al. (2014) in design industries, Musile Tanzi et al. (2018), Ayadi et al. (2021) and Zarutska et al. (2022, 2024) in banking, Pieroni et al. (2020) in circular-economy models, and Panchal and Krishnamoorthy (2020), Shpak et al. (2023), Siddiqui and Rivera (2024), Uddin et al. (2024), Amit et al. (2025) and Antunes Marante et al. (2025) in more recent applications. The recurring weakness is selection: partitions are chosen on a single validity index, most often silhouette, which rewards isolating a few extreme observations; stability under resampling is seldom tested; and the partition is rarely used to re-estimate the substantive model within groups. Applications of machine learning to firm-level financial data have expanded rapidly. Manogna and Mishra (2021), Jones (2023), D’Amato et al. (2024), Mekelburg and Strauss (2024), Lin and Lin (2025), Romero Martínez et al. (2025) and Xu et al. (2025) apply ensemble learners to distress prediction, valuation and rating, and a substantial recent cohort extends the approach further. Almost all frame the exercise as prediction and evaluate it on accuracy. Few use flexible learners diagnostically—to ask whether the linear form imposed by a companion econometric model is adequate, which variables carry information under the same fixed-effects transformation, and whether any shortfall can be repaired parametrically. Where comparisons with linear models appear, they frequently set a levels-based machine-learning R² beside a within-transformed econometric R², which is not a like-for-like comparison. Neither literature has been used for the purpose adopted here: taxonomies describe groups without re-estimating a structural relationship inside them, and machine learning measures predictive superiority without characterising the shortfall of the parametric model it displaces.
The gap. Cost structure has been left almost entirely outside this discussion. Canarella et al. (2013), Grau and Reig (2021), Bradfield et al. (2023) and Akgün and Günay (2026) are among the few firm-level treatments. The labour share of value added, the intensity of purchased services and reliance on leased rather than owned assets are studied at sectoral or macroeconomic level, and enter firm-level profitability models as controls if they enter at all. The literature on SME profitability has organised itself around financing, and the operating model has not been posed as its competitor within a single specification. This study places both blocks in one equation and measures their relative weight by three independent routes on the same sample. It treats the instability of the capitalisation coefficient across estimators as the finding rather than concealing it, and diagnoses why the instruments fail rather than omitting them. It selects a partition of firms on a composite of eleven validity indices with bootstrap stability testing and re-estimates the equation within each group. And it applies machine learning to the same firm-demeaned data as the panel estimator, so that the comparison is like-for-like, then asks how far parametric enrichment closes the remaining gap. Two boundaries apply throughout: no design available identifies a causal effect, since there is no exogenous variation in financial structure and the regulatory populations are self-selecting; and the cost ratios are fragile for firms whose production approaches zero, a problem addressed by sample restriction rather than by rescaling on total assets, which would place them in an accounting identity with the dependent variable. See Table 1.
All figures in the final column refer to the estimating sample of 91,756 firm-year observations on 14,913 firms described in Section 3. Full bibliographic details for the studies cited are given in the reference list.
3. Data and Methodology
The panel is assembled from thirty-one AIDA extractions covering the universe of Italian certified innovative start-ups and innovative SMEs, together with a matched set of conventional small and medium enterprises. AIDA reports harmonised statutory accounts for Italian companies and has been the standard source for firm-level work on this population, including Caselli et al. (2019), Biancalani et al. (2022), Aiello et al. (2024) and Anderloni and Harasheh (2025). Each extraction contains 137 distinct accounting variables replicated over ten financial years; the reference year of each column is reconstructed from the balance-sheet closing date, which is serialised differently across extractions and requires format-specific conversion. Regulatory status and sector codes are merged from the business register maintained by the Ministry of Enterprise, matched on fiscal code.
The estimating sample comprises 91,756 firm-year observations on 14,913 firms between 2014 and 2025. It is identical across all three methods and all four appendices: the same observations enter the panel estimates, the firm-level partitioning and the machine-learning comparison, so that differences between the three sets of results are attributable to method rather than to sample. See Table 2.
The panel is unbalanced in a way correlated with regulatory status: start-ups file meaningful accounts in roughly one year in three against more than nine in ten for conventional SMEs, a pattern consistent with the reporting behaviour documented by Bottai et al. (2024). Conventional SMEs therefore contribute close to two thirds of the observations while accounting for under half the firms, and the weighting schemes reported in Appendix A establish how much this matters.
The dependent variable is return on assets. The regressors are organised into two blocks. The financial block comprises the equity ratio, the liquidity ratio, capital turnover and the logarithm of total assets—the variables around which the small-firm literature of Adair and Adaskou (2015), Dalci (2018) and Boshnak (2023) is organised. The operating block comprises the labour cost share of value added, purchased services and materials as proportions of the value of production, and payments for leased assets on the same basis. All continuous variables are winsorised at the first and ninety-ninth percentiles within year.
Two measurement decisions require justification, and both determine the sample. Cost ratios expressed against the value of production become uninformative where production approaches zero: before restriction, purchased services reach 92,344 per cent of output at the ninety-ninth percentile. The sample is therefore confined to observations with positive value of production, positive value added, and value of production of at least one per cent of total assets. The restriction removes 8.8 per cent of observations, but it is not neutral across populations—29.3 per cent of start-up observations against 1.0 per cent of conventional SME observations—because pre-operating firms are concentrated among the certified. The estimates consequently describe firms with genuine operating activity, a limitation returned to in Section 9.
Rescaling the cost ratios on total assets is not an alternative, because return on assets carries assets in its denominator and the rescaled ratios would stand in an accounting identity with it: regressing ROA on turnover and the four asset-scaled ratios in levels yields an R² of 0.488 with all four coefficients between −0.48 and −0.64, against 0.088 for the output-scaled versions. And no ratio constructed from depreciation enters as a regressor, since the operating result is computed net of depreciation.
The equation is estimated three times, by methods that interrogate different assumptions. Panel estimation establishes the average conditional association and tests whether it survives the estimator: pooled OLS, between, one-way and two-way fixed effects, random effects with Hausman and Breusch–Pagan tests, weighted least squares under two weighting schemes, and a dynamic specification following Anderson and Hsiao. Five instrument sets are examined and reported with first-stage and overidentification diagnostics, in the spirit of the endogeneity treatments of Bharati and Jia (2018), Iqbal et al. (2022) and Dsouza et al. (2025), but with failures reported rather than omitted. Standard errors are clustered by firm throughout. The lagged and dynamic specifications necessarily lose observations at the start of each firm’s series, reducing the sample to 76,261 and 64,031 respectively; all other panel specifications use the full 91,756.
Unsupervised partitioning tests whether one coefficient vector describes every firm. The 14,913 firms are summarised by decade medians of the nine variables, standardised, and thirty-one configurations across six algorithm families are scored on eleven validity criteria. Selection is by composite rank rather than by any single index, avoiding the reliance on silhouette alone that characterises the taxonomies of Chu et al. (2014), Ayadi et al. (2021) and Uddin et al. (2024); stability is verified across fifty bootstrap resamples. The equation is then re-estimated within each group on the same observations, and equality of coefficient vectors tested pairwise.
Machine-learning regression tests the adequacy of the linear form. Thirteen algorithms are fitted to the same 91,756 observations with five-fold cross-validation grouped by firm, so that no firm appears in both training and test partitions. Unlike the prediction-oriented applications of Jones (2023), D’Amato et al. (2024) and Mekelburg and Strauss (2024), the learners are applied to the same firm-demeaned data as the fixed-effects estimator, making the comparison like-for-like, and the residual gap is decomposed by parametric enrichment, permutation importance and partial dependence to establish what kind of structure the linear form omits. See Figure 1.
4. Panel Estimation Results
The F test on the null that individual effects are jointly zero equals 5.60 and rejects beyond any conventional threshold, so pooled OLS is inconsistent. The Breusch–Pagan multiplier, at 25,011.2, confirms through a different route that the variance of the individual component is non-zero, and the Hausman statistic of 117.01 on eight degrees of freedom rejects the consistency of random effects. Two-way fixed effects is the reference specification. See Table 3.
All eight regressors are significant at the one per cent level, and the within R² of 0.4232 indicates that the specification accounts for a substantial share of the variation in profitability that occurs inside firms over time. Because the regressors are measured on incompatible scales, Figure 2 rescales every coefficient to the effect of a one-standard-deviation increase, which is the only way to compare them directly. See Figure 2.
Capital turnover dominates under every estimator, and the labour share follows. Rescaled, a one-standard-deviation increase in turnover is worth roughly four points of ROA and a comparable increase in the labour share costs close to four; capitalisation is worth about three; purchased services, materials and leased assets between one and two points each. Liquidity is negligible throughout. The two blocks therefore contribute on the same order of magnitude, which the unrescaled coefficients conceal. See Figure 3.
Comparing the between and within estimators is more informative than any single coefficient, and it is the diagnostic least often reported. On the labour share and on purchased services the two agree closely, indicating relationships that hold both cross-sectionally and over time. On size they diverge sharply, so within-firm asset growth operates differently from the advantage of being structurally large. Capitalisation is higher within than between, which is consistent with the accounting identity discussed below rather than with a stronger structural effect.
The positive capitalisation coefficient faces an elementary objection: net worth contains current-year profit and ROA is computed on the same profit, so part of the correlation is an accounting identity. Lagging every regressor by one year reverses the sign, from +0.177 to −0.068. Modelling persistence instead—Anderson and Hsiao in first differences, with ROA(t−2) instrumenting the lagged difference, an autoregressive coefficient of 0.271 and a first-stage F of 18,230—returns it to positive and larger, at +0.228. Five instrument sets were then tried, and all five produce negative estimates. See Figure 4.
The figure is the finding. Static estimators cluster between +0.10 and +0.20; lagging moves the coefficient below zero; the dynamic specification moves it back to +0.23; every instrumental-variable specification places it between −0.12 and −0.28. These are not overlapping confidence intervals but qualitatively different answers. The instruments themselves fail: specification (2), which uses the second and third lags, rejects the Hansen test with a statistic of 77.18, and the mechanism is identifiable—with ROA persistent at 0.271, the equity ratio at t−2 mechanically embeds profit at t−2, which predicts profit at t through persistence alone. The instrument with a defensible exclusion restriction, net external equity injections, has a within-firm correlation with the regressor of 0.103, so any violation of exclusion is amplified roughly tenfold (Appendix B).
The sign of the capitalisation coefficient is therefore not identified by these data, and that instability is itself the result. It bears on a literature that routinely reports a positive contemporaneous association between capitalisation and SME profitability without addressing the accounting identity that generates much of it. The operating coefficients, by contrast, keep their sign and rough magnitude across every specification in Figure 4 and Appendix A: the labour share ranges only between −0.115 and −0.141 across seven of the eight estimators.
The panel is unbalanced in a way correlated with regulatory status. Weighting each firm equally rather than each observation raises capitalisation from 0.177 to 0.199 and size from 0.646 to 0.855, so the relationship is somewhat stronger among firms observed briefly. Weighting by total assets instead, to recover the effect relevant for the economic aggregate rather than the median firm, halves capitalisation to 0.099 while raising capital turnover from 5.29 to 6.89 and materials from −0.114 to −0.149. In large firms, which carry the aggregate, the operating model matters more and financial structure less. The two answers address different questions, which is why both are reported. See Figure 5.
Wald tests reject equality of the coefficient vectors: 87.18 between start-ups and innovative SMEs, 181.94 between start-ups and ordinary SMEs, and 138.08 between the two SME categories, all with p below 10⁻⁴ on eight degrees of freedom. This is not a difference in the level of profitability, which fixed effects absorb, but in the structure of determination. Certification schemes rest on the premise that innovative firms face tighter financial constraints; evaluations customarily measure average effects on growth or employment while treating the constraint as given. The evidence here shows the constraint is measurable, varies across the very populations the schemes distinguish, and survives every specification attempted.
5. Unsupervised Structure
The panel estimates impose a restriction the data have not been asked to confirm: that one coefficient vector describes every firm. The restriction can be tested without leaving the equation, by partitioning firms on its own variables and re-estimating within each partition. The exercise identifies no causal effect. It bears on whether the pooled coefficients mean what they appear to mean, or whether they average structures that differ.
Each firm is summarised by the decade median of the nine variables entering the equation, standardised, on the same sample as Section 4. Regulatory status is withheld from the procedure and used only afterwards as an external check. Thirty-one configurations were evaluated—k-means, Ward agglomerative, Gaussian mixture and fuzzy c-means for k between two and seven, density-based clustering across a grid of radii, and random-forest proximity clustering—each scored on eleven validity criteria reported in Appendix C.
Selecting on a single index misleads, and the direction of the error is systematic. Silhouette falls monotonically in k for every partitional method, so on that criterion alone the two-cluster solution always wins; Calinski–Harabasz behaves the same way, while partition R² and the Dunn index move in the opposite direction. The two density-based solutions attain the highest silhouette values in the whole battery while classifying between four and thirty-three per cent of firms as noise. Averaging ranks across all nine directional indices selects k-means at k = 4, which places first on partition R² among balanced solutions and keeps its smallest group at 14.9 per cent of firms. Fifty bootstrap resamples at eighty per cent give a mean adjusted Rand index of 0.9375, with a minimum of 0.6167. The neighbouring three-cluster solution ranks close behind and was verified to leave the coefficient pattern of Table 4 qualitatively intact. See Figure 6.
Cluster 0, a third of firms, is labour-intensive: a labour share of 89.6 per cent of value added, the lowest capitalisation at 17.3 per cent, and a median return of 3.03. Cluster 1, twenty-seven per cent, is materials-intensive and largest in scale, with materials at 47.4 per cent of output and median log assets of 9.75. Cluster 2, twenty-four per cent, comprises micro service firms: purchased services at 57.4 per cent of output, a labour share of 0.63 per cent, the smallest scale, and a median return of 7.36. Cluster 3, fifteen per cent, is the only group defined financially rather than operationally, with capitalisation of 70.1 per cent, a liquidity ratio of 3.70, the lowest turnover and the highest median return at 10.23. See Table 4.
Two features of the separation matter. The variables that distinguish the groups most sharply are the labour share, scale and capital turnover; liquidity separates them least. And capitalisation, although it defines Cluster 3, contributes less to the overall separation than the labour share—0.70 of a standard deviation between the extreme groups against 1.44. Financial structure characterises one archetype; it does not organise the partition. See Figure 7.
Compared afterwards with regulatory status, partition and register correspond strongly without coinciding, with Cramér’s V of 0.4780. Ordinary SMEs concentrate in the two established operating archetypes, 46.0 and 46.9 per cent, with only 7.1 per cent elsewhere. Innovative start-ups distribute almost inversely, 53.1 per cent in the micro-service group and 24.2 per cent in the capitalised one. Innovative SMEs spread across all four, consistent with a category reached either by graduation from start-up status or by direct entry from conventional activity.
Pairwise Wald tests reject equality of the coefficient vectors for all six pairs, with statistics between 84.45 and 374.34 on eight degrees of freedom. See Table 5.
Capital turnover carries 3.09 in the labour-intensive group and 13.16 in the capitalised one, a fourfold range. Leased assets range from −0.191 to −0.494 and purchased services from −0.098 to −0.285. The equity ratio varies less, between 0.102 and 0.231, and its ordering is informative: weakest in the materials-intensive group of larger firms, strongest in the labour-intensive group of smaller ones, which is the pattern a financing-constraint interpretation predicts.
Two further features distinguish this partition from the pooled estimate. The labour-share coefficient is stable across all four groups, between −0.132 and −0.140, so it is the one relationship the pooled specification represents faithfully. And liquidity is insignificant in three of four groups, confirming from an independent direction the inertness already visible in Section 4. The implication is specific: the pooled vector is an adequate summary in two of eight dimensions and a poor one in the remaining six.
6. Machine-Learning Regression
The second assumption of the panel specification is that each regressor enters linearly and additively. Testing it requires a comparison frequently made incorrectly. The fixed-effects estimator explains variation within firms, after removing firm means; a learner fitted to raw levels also has the between-firm variation available, so setting a within R² against a levels R² attributes to functional form what mostly reflects a different variance decomposition. Cross-validation is five-fold and grouped by firm, so no firm contributes to both training and testing. See Table 6.
The three rows answer the same question under three different treatments of between-firm variation, and reading them together is what makes the comparison interpretable. The first row gives the learner access to differences between firms as well as within them; the second removes firm means, replicating exactly what the fixed-effects estimator does; the third restores the between-firm information to the linear model in the form of firm means, following Mundlak. Comparing the first and third rows isolates how much of the linear model’s disadvantage on levels is simply unmodelled firm heterogeneity, and comparing the second with either isolates what remains attributable to functional form. Figure 8 plots the three side by side.
On raw levels the non-linear model is 1.69 times more accurate; on firm-demeaned data, which is what the fixed-effects estimator uses, the ratio falls to 1.29 and the absolute gap from 0.325 to 0.121. The linear specification recovers 0.415 of within-firm variance against 0.536 attainable. Supplying the linear model with firm means in the manner of Mundlak raises it only from 0.473 to 0.480. See Figure 9.
The figure shows the ordering; the table gives the quantities behind it and adds two columns the plot cannot carry. The first is the number of terms, which turns each specification into a price: sixteen terms buy 13.7 per cent of the gap, forty-four buy 20.6, and one hundred and sixty-four buy nothing at all. The second is the cross-fold standard deviation, which explains why the cubic expansion fails rather than merely recording that it does. Reading the two together converts a ranking of fits into a statement about the kind of structure the linear specification omits, which is the point of the exercise. See Table 7.
Partly, but not mostly. Squared terms recover 13.7 per cent of the gap, pairwise interactions 16.7, and both together 20.6. A full cubic expansion in 164 terms performs worse than the original eight-regressor model, with a cross-fold standard deviation of 0.189 against 0.013, because it overfits the tails of a heavy-tailed dependent variable. Roughly four fifths of what the learner captures is therefore not polynomial: it is local structure—thresholds, saturation, regions where a variable matters and regions where it does not. Friedman H-statistics are correspondingly small, the strongest pair reaching 0.042, so the residual structure is univariate curvature rather than pairwise interaction. See Table 8.
The labour share alone accounts for 63.5 per cent of predictive content, capital turnover for 13.3 and purchased services for 9.6: the operating block carries roughly ninety per cent of the information against 6.5 per cent for the equity ratio and 1.1 for liquidity. This is a sharper hierarchy than the panel coefficients suggest, and it corroborates the clustering result that the labour share is the variable whose relationship with profitability is both strongest and most stable. See Figure 10.
The shapes explain the residual parametric failure. The labour share declines steeply and then flattens; capital turnover rises and saturates; purchased services are flat over most of their range before bending. The equity ratio is close to monotone and mild, consistent with the modest positive fixed-effects coefficient rather than with the negative instrumental-variable estimates of Section 4.2. See Figure 11.
In the bottom decile of demeaned ROA, where the realised mean is −16.5 points, the linear model predicts −7.9; in the top decile, realised at +16.6, it predicts +6.6. The linear model compresses the distribution towards its centre by roughly a factor of two at the extremes, and gradient boosting by a factor of 1.8. In the middle six deciles both are well calibrated, with biases below 1.7 points, so essentially the whole difference arises in the tails.
Two conclusions follow for the panel section. Its coefficients are local linear approximations to a mildly curved surface and should be described as average slopes rather than constant marginal effects. And the ranking of variables they imply is corroborated rather than overturned by an independent measure of predictive content: both place the operating block first, and the machine-learning measure does so by a wider margin.
7. Discussion
Read against the literature, the results divide into three groups: those that confirm what is already established, those that contradict a widely held presumption, and those that address a question the literature has not posed.
The confirmatory group is the smallest but it anchors the rest. The static fixed-effects estimate reproduces the negative leverage–profitability association reported by Adair and Adaskou (2015), Balios et al. (2016), Dalci (2018), D’Amato (2019), Bui et al. (2021) and Boshnak (2023) across a wide range of national settings. The autoregressive coefficient of 0.271 sits within the range documented by Goddard et al. (2006), Bartoloni and Baussola (2009) and Eklund and Lappi (2019), and confirms that the mean-reverting behaviour those studies establish for larger or older firms extends to a population dominated by young and certified enterprises, where the shorter operating history might have been expected to produce faster reversion. That the estimates behave as expected where the literature is settled is what licenses the weight placed on the results where it is not.
The contradictory group concerns not a coefficient but its stability. The literature summarised in Section 2 reports the capitalisation coefficient as a parameter to be estimated, with attention devoted to controls and sample rather than to whether the parameter is recoverable at all. Estimated here under thirteen specifications, it moves from +0.18 under static fixed effects to −0.07 with lagged regressors, back to +0.23 once persistence is modelled, and to between −0.12 and −0.28 across five instrument sets. Campello (2006) anticipated the joint determination of financing and performance, but the practice that followed treats endogeneity as a correction rather than as a threat to identification. The finding is that the sign is not identified by observational accounting data of this kind, which is a stronger and less comfortable claim than the conditional or heterogeneous effects reported by Kenourgios et al. (2020) and Duppati et al. (2023). Its force comes from the contrast with the operating coefficients, which hold their sign and magnitude throughout: the labour share ranges only between −0.115 and −0.147 across the same thirteen specifications.
A second contradiction concerns policy evaluation. Studies of the Italian scheme by Caselli et al. (2019), Biancalani et al. (2022), Aiello et al. (2024), Anderloni and Harasheh (2025) and Albanese and Bronzini (2026) estimate average effects while presuming a financial-constraint mechanism common to certified firms. Wald tests reject a common coefficient vector across the three regulatory populations, with statistics of 87.18, 181.94 and 138.08 on eight degrees of freedom, and pairwise tests reject it again for all six pairs of the four clusters recovered without reference to the register, with statistics between 84.45 and 374.34. The presumed mechanism is not shared by the population it is presumed to govern.
The third group is where the contribution lies. Placing financial structure and operating model in one specification, three independent methods converge on the labour share of value added: a coefficient of −0.137 stable across specifications, between −0.132 and −0.140 across all four clusters, and 63.5 per cent of out-of-sample predictive content against 6.5 per cent for capitalisation. The invariance is the striking part. Every other coefficient varies substantially across the partition—capital turnover by a factor of four, leased assets by a factor of two and a half—while the labour share does not, which is what a structural rather than compositional relationship would look like. The literature on cost structure—Canarella et al. (2013), Grau and Reig (2021), Bradfield et al. (2023), Akgün and Günay (2026)—has not been brought into contact with the financing literature, and the comparison has not previously been made inside one equation.
Two methodological results follow the same pattern. Diagnosing instrument failure through profit persistence connects two literatures—Glen et al. (2001), Maury (2018), Wibbens (2019) on one side, Bharati and Jia (2018), Iqbal et al. (2022), Dsouza et al. (2025) on the other—that have developed in parallel without citation: persistence at 0.271 implies that the equity ratio at t−2 embeds profit at t−2, and therefore correlates with the current error by construction. And applying machine learning to the same firm-demeaned data as the panel estimator yields a like-for-like ratio of 1.29, against 1.69 on levels; since squared terms recover 13.7 per cent of the residual gap and pairwise interactions 16.7, with both together reaching only 20.6, the shortfall is local rather than polynomial, which the prediction-oriented applications of Jones (2023), D’Amato et al. (2024) and Mekelburg and Strauss (2024) do not measure. See Table 9.
8. Policy Implications
Italy’s productive structure is dominated by firms that do not grow. The size distribution is compressed towards the bottom, the share of employment in firms above the small-enterprise threshold is among the lowest in western Europe, and the number of firms that make the transition from micro to medium scale in any given decade is small. This is not a recent development and it is not primarily a financing phenomenon, although it is habitually treated as one. The evidence assembled here bears on that diagnosis directly, and its implications run against the design of the instruments currently in use.
The first implication concerns what certification schemes are for. Italy’s Start-up Act, like most European equivalents, is built on the premise that innovative firms are constrained by access to capital, and it responds with tax relief on equity investment, free access to a public credit guarantee, and relief from company-law rules on capital maintenance. Evaluations by Caselli et al. (2019), Biancalani et al. (2022), Aiello et al. (2024) and Albanese and Bronzini (2026) confirm that these instruments reach their targets and improve financing outcomes. What the present results add is that the constraint they relieve is not the binding one. Capitalisation accounts for a small and non-identified share of the variation in profitability, while the operating model—and above all the share of value added absorbed by labour—accounts for the large majority of it. A firm whose cost structure leaves it no margin does not become profitable because equity is cheaper.
The second implication concerns the sixty-month horizon. Certification expires by statute five years after incorporation, which presumes that firms reach a stable operating configuration within that window. The taxonomy recovered here suggests otherwise: a substantial fraction of certified start-ups remain in a micro-service configuration with almost no employment and negligible turnover of invested capital, and the coefficient structure governing their profitability differs sharply from that of operating firms. A fixed horizon applied to a heterogeneous population withdraws support from firms at very different stages of development. Bottai et al. (2024) and Anderloni and Harasheh (2025) document that certified firms take longer to reach profitability than their conventional peers; the implication is that the instrument’s duration is calibrated to a trajectory most of its recipients do not follow.
The third implication concerns listing and the supply of external equity. Italian firms remain overwhelmingly bank-financed and rarely access public markets, and the policy response has been to lower the cost of equity through fiscal channels—the notional-interest deduction for corporate equity, tax credits for investors in innovative firms, and simplified crowdfunding regimes. These instruments operate on the price of external capital. If profitability is determined predominantly by operating structure, the price of capital is not the margin on which the listing decision turns: firms do not list because they lack the scale and the earnings trajectory that public markets require, and neither is produced by cheaper equity. Antonietti and Gambarotto (2020) and Colombelli and Tubiana (2025) reach compatible conclusions from the innovation side.
The fourth implication concerns research and development. Eligibility is established through thresholds on research spending, graduate employment or intellectual property, which makes qualification a matter of input accounting rather than of capability. Firms with almost no operating activity satisfy these thresholds readily, since the ratios have small denominators. The certified population is therefore shaped by the measurement of eligibility as much as by innovative intent.
Taken together these results argue for reweighting rather than for withdrawal. Instruments that act on the cost of capital should be complemented by instruments that act on operating capability—managerial capacity, workforce composition, and the productivity of labour employed—since it is there that the variation in performance is concentrated. And eligibility criteria expressed as ratios to output should be reconsidered for firms whose output is negligible, because at that margin the criterion measures the denominator rather than the activity it is intended to capture.
9. Limitations
The most consequential limitation is that none of the designs employed identifies a causal effect. There is no exogenous variation in financial structure in these data: firms choose their capitalisation, and the regulatory populations compared are self-selected, since certification is voluntary and conditional on criteria correlated with unobserved characteristics. Lagging the regressors, modelling persistence and instrumenting all attenuate simultaneity without removing it, and Section 4 shows that instrumentation performs worse than the estimator it is meant to correct. The results should be read as conditional associations that survive or fail specification, not as magnitudes with a causal interpretation. The literature reviewed in Section 2 shares this limitation, but that is a reason for caution rather than an excuse, and the appropriate response is the one adopted by Manaresi and Menon in related work: to seek institutional discontinuities rather than statistical corrections.
A second limitation concerns sample composition. Innovative start-ups file meaningful accounts in roughly one year in three, against more than nine in ten for ordinary SMEs, and the restriction imposed to obtain interpretable cost ratios removes a further 29.3 per cent of start-up observations against 1.0 per cent of ordinary SME observations. Both selections are correlated with treatment status, and both remove firms at the pre-operating end of the distribution. The estimates therefore describe firms with genuine operating activity and are silent about the population the certification scheme most distinctively contains. Modelling that selection, whether through a Heckman-type correction or through bounds of the kind Manski proposes, remains to be done.
Third, sector controls are incomplete. Sector codes are available from the business register for the certified populations but for only one per cent of the control group, so the specifications with sector-by-year fixed effects rest on a subsample composed almost entirely of certified firms. The coefficients are stable across those specifications, which is reassuring, but the test is not conducted on the full sample and the possibility that operating coefficients partly capture sectoral composition in the control group cannot be excluded. Obtaining sector codes for ordinary SMEs would settle the question.
Fourth, the measurement of cost intensity remains imperfect. Ratios to the value of production are fragile where production approaches zero, and rescaling on total assets is not an alternative because it places the cost ratios in an accounting identity with the dependent variable. Sample restriction addresses the problem but does not eliminate the underlying issue, which is that firm-level accounting data measure operating structure with error concentrated in exactly the firms of greatest policy interest. The sectoral literature on the labour share—Canarella et al. (2013), Grau and Reig (2021)—avoids this by aggregating, at the cost of the heterogeneity this study exploits.
Fifth, standard errors are clustered by firm alone. Work on profit persistence documents cross-sectional dependence in firm profitability, and two-way or spatially corrected inference might widen the intervals reported here, though it would be unlikely to alter conclusions resting on statistics several orders of magnitude above conventional thresholds. Finally, the analysis is confined to a single country and a single certification regime, and the extent to which the dominance of operating structure over financial structure generalises to economies with different firm-size distributions and financing systems is an open question.
A further caveat applies to the unsupervised results. The partition is descriptive: it establishes that regulatory groups occupy distinguishable regions of the accounting space and that the boundaries are stable to resampling, but not why firms occupy the region they do. A firm may sit in the micro-service archetype because certification placed it there, because it was already there before certifying, or because both reflect an unobserved third factor. The composite selection procedure also involves discretion—the weighting of validity indices and the five per cent floor on cluster size are defensible but not unique—and the neighbouring three-cluster solution, although it leaves the coefficient pattern intact, is close enough in composite rank to warrant reporting.
10. Conclusions
This study asked which of two explanations of firm profitability carries more weight when both are placed in the same specification: the way a firm is financed, or the way it operates. The question was put to a panel of Italian firms spanning three regulatory regimes and answered three times over, by panel estimation, by unsupervised partitioning and by machine-learning regression applied to the same variables and the same sample. The three methods answer different questions about the equation—what the average conditional association is, whether one coefficient vector describes every firm, and whether the linear form is adequate—and their agreement is what makes the conclusion durable.
The answer is that the operating model dominates. The share of value added absorbed by labour carries a coefficient that is stable across estimators, essentially invariant across four otherwise heterogeneous groups of firms, and responsible for the large majority of out-of-sample predictive content. Capitalisation, the variable around which the small-firm finance literature is organised, contributes little and contributes it unreliably.
That unreliability is the study’s second conclusion, and it is a negative result stated deliberately. The coefficient on capitalisation changes sign depending on whether regressors enter contemporaneously or with a lag, changes sign again when persistence is modelled, and takes large negative values under every instrument that can be constructed from these data. The instruments themselves fail, and they fail for a reason that can be identified rather than merely suspected: profitability is persistent, so any lagged financial ratio embedding past profit is correlated with the current error. A literature that reports this coefficient as a stable parameter is reporting, in substantial part, an accounting identity between a numerator and a denominator that share the same profit figure.
The third conclusion concerns heterogeneity. The three regulatory populations do not merely differ in the level of their performance; they differ in the structure that determines it, and tests reject a common coefficient vector in every pairwise comparison. A partition built from accounting data alone, without any reference to the register, recovers four operating archetypes and reproduces the regulatory classification closely, and the equation estimated within each archetype differs again. Policy instruments premised on a single mechanism operating uniformly across certified firms are premised on something the data do not support.
Methodologically, the study makes a narrower point that may be of wider use. Comparisons between econometric and machine-learning models are frequently made on incompatible variance decompositions, setting a levels-based fit against a within-transformed one; correcting the comparison substantially reduces the apparent superiority of flexible learners. And when the remaining gap is decomposed, most of it proves irreducible by polynomial terms, which identifies the shortfall of the linear model as local rather than global structure. Used this way, machine learning becomes a diagnostic instrument for specification rather than a competitor to it.
What the study cannot claim is causality. No exogenous variation in financial structure exists in these data, and the comparison across regimes is between self-selected groups. The natural continuation is to seek that variation in the institutional features of the regime itself—the statutory expiry of certification, the eligibility thresholds, and the fiscal instruments whose rates have changed repeatedly by legislation. Those discontinuities would allow the associations documented here to be given the causal interpretation that the present design must withhold.
Acknowledgments
This research was supported by the project “LUtech Campus Ecosystem—LUCE” (Project Code: 22ROJB5), funded under a subsidized financing scheme of the Puglia Region within the framework of a Program Agreement (Contratto di Programma). The authors gratefully acknowledge this financial support, which made this study possible.
Appendix A—Panel Estimation Tables
Table A1 sets the five estimators side by side. Reading across a row shows how much of each coefficient survives the choice of estimator, and the contrast between blocks is the point. The labour share ranges only between −0.137 and −0.147 across all five columns, purchased services between −0.118 and −0.184, and materials between −0.085 and −0.114: the operating coefficients are stable. The equity ratio ranges from 0.121 to 0.177 and size changes sign between the between and within columns, from −0.136 to +0.646. The R² row is not comparable across columns—the between figure refers to cross-firm variance and the within figure to over-time variance—and should not be read as a ranking of fit.

Table A1.
Estimator comparison. Dependent variable: ROA (%).
| Regressor | Pooled OLS | Between | FE (firm) | FE (firm+year) | Random effects |
|---|---|---|---|---|---|
| Equity ratio (%) | 0.1250*** (0.0030) | 0.1210*** (0.0043) | 0.1629*** (0.0047) | 0.1766*** (0.0049) | 0.1548*** (0.0021) |
| Liquidity ratio | 0.2821*** (0.0512) | 0.4492*** (0.0742) | -0.2263*** (0.0597) | -0.2474*** (0.0597) | -0.1187*** (0.0316) |
| Capital turnover | 4.8555*** (0.0910) | 5.3101*** (0.1139) | 5.1750*** (0.1324) | 5.2871*** (0.1347) | 5.1585*** (0.0594) |
| ln(Total assets) | 0.0216 (0.0336) | -0.1359*** (0.0410) | -0.1997** (0.0797) | 0.6463*** (0.1005) | -0.2254*** (0.0283) |
| Labour cost / Value added (%) | -0.1569*** (0.0022) | -0.1473*** (0.0017) | -0.1373*** (0.0026) | -0.1365*** (0.0026) | -0.1406*** (0.0008) |
| Purchased services / Output (%) | -0.1083*** (0.0036) | -0.1184*** (0.0042) | -0.1806*** (0.0068) | -0.1840*** (0.0069) | -0.1612*** (0.0023) |
| Materials / Output (%) | -0.1010*** (0.0037) | -0.0845*** (0.0040) | -0.1066*** (0.0122) | -0.1143*** (0.0130) | -0.1049*** (0.0026) |
| Leased assets / Output (%) | -0.1497*** (0.0097) | -0.1481*** (0.0139) | -0.2869*** (0.0183) | -0.2833*** (0.0182) | -0.2457*** (0.0077) |
| Observations | 91,756 | 14,913 | 91,756 | 91,756 | 91,756 |
| Firms | 14,913 | 14,913 | 14,913 | 14,913 | 14,913 |
| R² | 0.4746 | 0.4911 | 0.4161 | 0.4232 | — |
Note. Firm-clustered standard errors in parentheses. *** p<0.01, ** p<0.05, * p<0.10. Pooled OLS, FE (firm+year) and random effects include year dummies. Between is estimated on firm means.
The three specification tests below test different nulls, and their agreement is not automatic. The F test asks whether firm effects exist at all; Breusch–Pagan whether their variance is non-zero; Hausman whether they are correlated with the regressors. Rejecting the first two without the third would have licensed random effects, which are more efficient. Rejecting all three closes that option and fixes two-way fixed effects as the reference specification.
Table A2.
Panel structure tests.
| Test | Statistic | p | Conclusion |
|---|---|---|---|
| F(uᵢ = 0), two-way FE | 5.60 | < 0.0001 | Pooled OLS rejected |
| Breusch–Pagan LM | 25,011.2 | < 0.0001 | Individual variance present |
| Hausman (FE vs. RE) | 117.01 | < 0.0001 | Random effects inconsistent |
| First-stage F (Anderson–Hsiao) | 18,229.8 | — | Instrument strong |
Table A3 collects the four robustness specifications. Columns 1 and 2 differ only in weighting, and the comparison identifies who each estimate is about: weighting firms equally describes the typical firm, weighting by assets describes the typical euro of capital. Column 3 shows the sign reversal on capitalisation under lagging while the labour share retains its sign; column 4 shows the recovery once persistence is modelled. The autoregressive coefficient of 0.2710 in column 4 is worth reporting in its own right: profitability in this population reverts to the mean at roughly 27 per cent per year.
Table A3.
Robustness: weighting, lags, dynamic specification.
| Regressor | WLS (firm weights) | WLS (asset weights) | FE, lagged X | Anderson–Hsiao |
|---|---|---|---|---|
| Equity ratio (%) | 0.1986*** (0.0062) | 0.0992*** (0.0081) | -0.0683*** (0.0055) | 0.2283*** (0.0085) |
| Liquidity ratio | -0.2685*** (0.0739) | -0.0541 (0.1003) | -0.2726*** (0.0767) | -0.3969*** (0.0865) |
| Capital turnover | 5.1222*** (0.1718) | 6.8851*** (0.2759) | 1.5756*** (0.1472) | 5.6483*** (0.2143) |
| ln(Total assets) | 0.8546*** (0.1205) | 0.6324*** (0.2126) | -2.1600*** (0.1276) | 3.1083*** (0.2090) |
| Labour cost / Value added (%) | -0.1256*** (0.0029) | -0.1149*** (0.0052) | -0.0346*** (0.0023) | -0.1299*** (0.0034) |
| Purchased services / Output (%) | -0.1935*** (0.0112) | -0.1780*** (0.0117) | -0.0142** (0.0062) | -0.2446*** (0.0110) |
| Materials / Output (%) | -0.1027*** (0.0155) | -0.1490*** (0.0101) | -0.0064 (0.0067) | -0.1209*** (0.0230) |
| Leased assets / Output (%) | -0.2602*** (0.0248) | -0.2415*** (0.0403) | -0.0828*** (0.0199) | -0.3657*** (0.0308) |
| ROA (t−1) | — | — | — | 0.2710*** (0.0109) |
| Observations | 91,756 | 91,756 | 76,261 | 64,031 |
| Firms | 14,913 | 14,913 | 12,750 | 11,172 |
Note. Columns 1–2: two-way fixed effects weighted respectively by the inverse of the number of observations per firm and in proportion to total assets. Column 3: fixed effects with all regressors at t−1. Column 4: Anderson–Hsiao, first differences, ROA(t−2) instrumenting ΔROA(t−1).
Figure A1.
Weighting sensitivity, rescaled to one-standard-deviation effects.
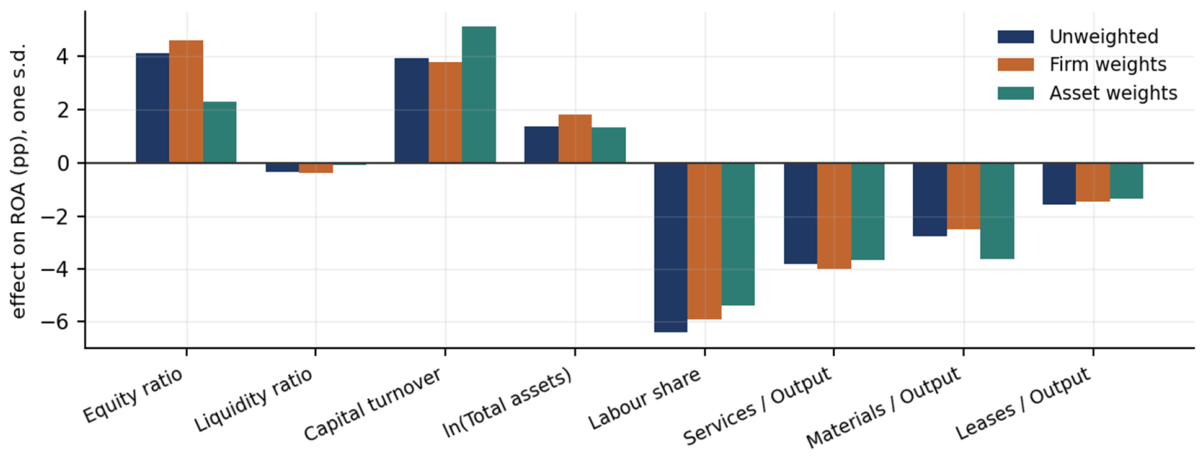
Plotted on a common scale, the weighting choice is visibly not a technicality: under asset weights capital turnover gains and capitalisation loses roughly half its magnitude, while the operating cost shares are almost unmoved. A referee asking which weighting is correct is asking the wrong question, since the two answer different questions, and a paper about SME performance needs both.
The regime-specific estimates below are the input to the Wald tests. Two patterns stand out. Capital turnover carries a larger coefficient among start-ups than among ordinary SMEs, consistent with turnover being the binding margin for firms that have not reached scale. And liquidity is insignificant or marginal in all three populations, worth stating explicitly because it is frequently included in this literature as a control and rarely reported as inert.
Table A4.
Separate estimation by regulatory regime. Two-way fixed effects.
| Regressor | Innovative start-ups | Innovative SMEs | Ordinary SMEs |
|---|---|---|---|
| Equity ratio (%) | 0.2317*** (0.0126) | 0.1589*** (0.0081) | 0.1626*** (0.0074) |
| Liquidity ratio | -0.2120* (0.1275) | -0.2353*** (0.0898) | -0.2130** (0.0909) |
| Capital turnover | 7.0189*** (0.3735) | 7.3493*** (0.3224) | 4.1749*** (0.1530) |
| ln(Total assets) | 3.4757*** (0.3297) | 0.8554*** (0.1934) | 0.4339*** (0.1402) |
| Labour cost / Value added (%) | -0.1311*** (0.0054) | -0.1170*** (0.0037) | -0.1632*** (0.0050) |
| Purchased services / Output (%) | -0.2357*** (0.0160) | -0.1902*** (0.0093) | -0.1493*** (0.0084) |
| Materials / Output (%) | -0.0926*** (0.0285) | -0.1499*** (0.0125) | -0.1137*** (0.0082) |
| Leased assets / Output (%) | -0.2608*** (0.0334) | -0.3029*** (0.0326) | -0.2653*** (0.0297) |
| Observations | 12,864 | 19,565 | 59,327 |
| Firms | 5,173 | 2,756 | 6,995 |
| Within R² | 0.4231 | 0.4439 | 0.4430 |
Table A5.
Wald tests of coefficient equality across regimes.
| Comparison | χ² | df | p |
|---|---|---|---|
| Innovative start-ups vs. Innovative SMEs | 87.18 | 8 | < 0.0001 |
| Innovative start-ups vs. Ordinary SMEs | 181.94 | 8 | < 0.0001 |
| Innovative SMEs vs. Ordinary SMEs | 138.08 | 8 | < 0.0001 |
Note. Wald statistic on the difference between estimated vectors, with variance equal to the sum of the two clustered matrices. Eight degrees of freedom.
Appendix B—Instrumental Variable Attempts
The equity ratio is the regressor most exposed to simultaneity. Five instrument sets were tested within the two-way fixed effects framework, with the equity ratio treated as endogenous and the remaining seven regressors as exogenous.
Table B1.
Two-stage least squares with firm fixed effects. Coefficient on the equity ratio.
| Instrument set | β (equity) | s.e. | First-stage F | Hansen J | p(J) | Obs. |
|---|---|---|---|---|---|---|
| FE, no instruments (benchmark) | 0.1766*** | (0.0049) | — | — | — | 91,756 |
| (1) Equity ratio (t−2) | -0.2769*** | (0.0307) | 2,326.5 | — | — | 64,557 |
| (2) Equity ratio (t−2, t−3) | -0.2644*** | (0.0344) | 862.3 | 77.18 | 0.000 | 53,386 |
| (3) Province-year peer mean | -0.1227 | (0.2482) | 24.4 | — | — | 91,534 |
| (4) Net equity injections (t−1) | -0.2346*** | (0.0411) | 1,073.9 | — | — | 64,656 |
| (5) Injections (t−1) + equity (t−2) | -0.2579*** | (0.0225) | 2,224.0 | 1.02 | 0.313 | 64,557 |
Note. Firm-clustered standard errors. All specifications include firm and year fixed effects. Hansen J is reported only for overidentified specifications.
Figure B1.
Instrument strength and overidentification.
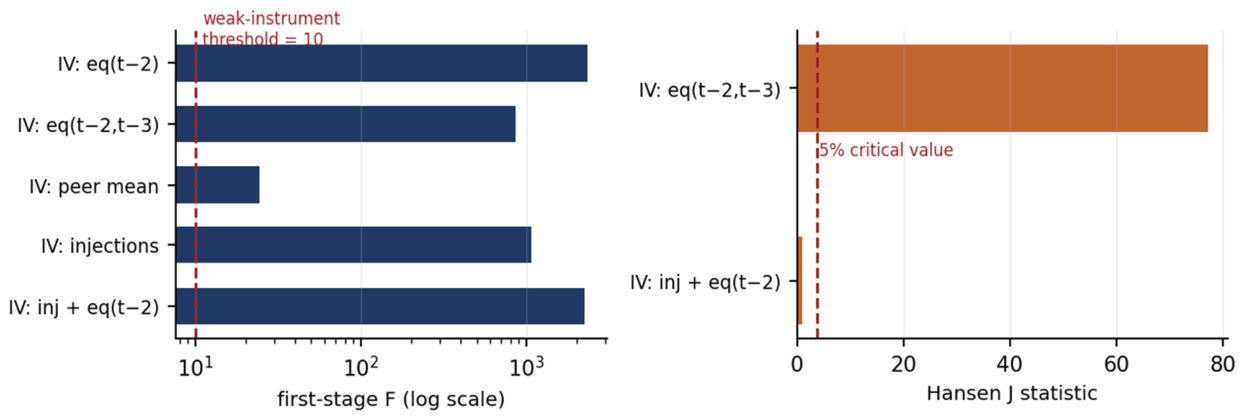
The figure separates the two diagnostics that matter and are routinely conflated. On the left, four of the five instrument sets clear the conventional weak-instrument threshold by two orders of magnitude, the province peer mean by a factor of two. On the right, the specification using the second and third lags exceeds the five per cent critical value by a wide margin. Strength and validity are independent properties, and these instruments have the first without the second.
Why the instruments fail
First, overidentification is rejected where it can be tested. Specification (2), using the second and third lags of the equity ratio, returns a Hansen J of 77.18 with p below 0.001. Specification (5), which combines injections with the second lag, does not reject at 1.02, but its point estimate of −0.258 lies within the same range as the specifications that do reject, so passing the test does not distinguish it substantively.
Second, the mechanism of failure is identifiable rather than merely suspected. The autoregressive coefficient of ROA is 0.271, so profitability at t is substantially predicted by profitability at t−2. Since the equity ratio at t−2 mechanically embeds profit at t−2, lagged capitalisation is correlated with the current error through persistence alone. This is a direct violation of the exclusion restriction, and no lag length escapes it while ROA remains persistent.
Third, the one instrument whose exclusion restriction is defensible on economic grounds—net external equity injections, reconstructed as the change in net worth less current profit, which enter the balance sheet without passing through the income statement—is too weakly related to the endogenous regressor to be usable. Its within-firm correlation with the equity ratio is 0.103. Because the asymptotic bias of two-stage least squares stands to that of least squares roughly as the correlation between instrument and error stands to the correlation between instrument and regressor, a correlation of 0.103 amplifies any violation of exclusion by a factor of about ten. The first-stage F of 1,073.9 reflects sample size rather than instrument strength in the sense that matters here.
These data therefore contain no valid instrument for financial structure. Reporting the attempt with its diagnostics is more useful than omitting it, both because it forecloses an obvious referee request and because the pattern of failure is informative: the persistence of profitability, the same feature that makes the dynamic specification necessary, is what destroys the internal instruments.
Appendix C—Clustering
Reading down the silhouette column of Table C1 shows why no single index can decide. Silhouette falls monotonically in k for every partitional method, so on that criterion alone k = 2 always wins, and Calinski–Harabasz behaves the same way; partition R² and the Dunn index move in the opposite direction. The two density-based configurations attain high silhouette while assigning between four and thirty-three per cent of firms to noise, and are excluded on that ground rather than on their index values.
Table C1.
Full validity battery, thirty-one configurations.
| Algorithm | k | Silh. | CH | DB | Dunn | MaxDiam | MinSep | γ | Entropy | HHI | R² | BIC | Min % |
|---|---|---|---|---|---|---|---|---|---|---|---|---|---|
| k-means | 2 | 0.210 | 3472 | 1.851 | 0.0186 | 25.66 | 0.478 | 0.305 | 0.668 | 0.525 | 0.189 | — | 38.8 |
| Ward | 2 | 0.167 | 2731 | 2.110 | 0.0175 | 25.66 | 0.449 | 0.232 | 0.690 | 0.503 | 0.155 | — | 46.2 |
| Gaussian mix. | 2 | 0.115 | 1631 | 2.716 | 0.0135 | 25.66 | 0.345 | 0.154 | 0.683 | 0.510 | 0.099 | 316,325 | 43.0 |
| Fuzzy c-means | 2 | 0.198 | 3377 | 1.902 | 0.0134 | 25.66 | 0.344 | 0.281 | 0.690 | 0.504 | 0.184 | — | 45.7 |
| k-means | 3 | 0.172 | 2880 | 1.836 | 0.0161 | 21.65 | 0.348 | 0.281 | 1.091 | 0.338 | 0.278 | — | 28.4 |
| Ward | 3 | 0.146 | 2149 | 2.145 | 0.0180 | 21.58 | 0.389 | 0.285 | 1.043 | 0.369 | 0.224 | — | 19.6 |
| Gaussian mix. | 3 | 0.120 | 1460 | 3.324 | 0.0122 | 25.66 | 0.314 | 0.243 | 1.089 | 0.340 | 0.164 | 282,504 | 27.9 |
| Fuzzy c-means | 3 | 0.146 | 2503 | 2.217 | 0.0147 | 23.15 | 0.340 | 0.277 | 1.088 | 0.340 | 0.251 | — | 26.7 |
| k-means | 4 | 0.172 | 2601 | 1.784 | 0.0159 | 21.55 | 0.342 | 0.316 | 1.347 | 0.269 | 0.343 | — | 14.9 |
| Ward | 4 | 0.154 | 1965 | 1.804 | 0.0180 | 21.58 | 0.389 | 0.313 | 1.130 | 0.358 | 0.283 | — | 3.2 |
| Gaussian mix. | 4 | 0.077 | 1227 | 3.300 | 0.0097 | 25.66 | 0.249 | 0.272 | 1.331 | 0.275 | 0.198 | 273,297 | 13.2 |
| Fuzzy c-means | 4 | 0.108 | 1909 | 2.841 | 0.0118 | 22.44 | 0.264 | 0.271 | 1.285 | 0.292 | 0.277 | — | 8.3 |
| k-means | 5 | 0.177 | 2518 | 1.654 | 0.0162 | 21.55 | 0.348 | 0.366 | 1.460 | 0.247 | 0.403 | — | 3.5 |
| Ward | 5 | 0.148 | 1935 | 1.921 | 0.0180 | 21.58 | 0.389 | 0.344 | 1.439 | 0.257 | 0.342 | — | 3.2 |
| Gaussian mix. | 5 | 0.065 | 1284 | 3.335 | 0.0101 | 25.66 | 0.260 | 0.256 | 1.562 | 0.217 | 0.256 | 262,697 | 9.9 |
| Fuzzy c-means | 5 | 0.077 | 1557 | 5.071 | 0.0118 | 22.01 | 0.260 | 0.265 | 1.441 | 0.258 | 0.294 | — | 5.1 |
| k-means | 6 | 0.179 | 2453 | 1.533 | 0.0162 | 21.55 | 0.348 | 0.403 | 1.572 | 0.229 | 0.451 | — | 3.4 |
| Ward | 6 | 0.141 | 1855 | 1.691 | 0.0180 | 21.58 | 0.389 | 0.358 | 1.553 | 0.243 | 0.383 | — | 3.2 |
| Gaussian mix. | 6 | 0.059 | 1101 | 3.129 | 0.0102 | 25.54 | 0.260 | 0.246 | 1.749 | 0.180 | 0.269 | 257,268 | 8.2 |
| Fuzzy c-means | 6 | 0.053 | 1225 | 10.733 | 0.0118 | 22.01 | 0.260 | 0.262 | 1.430 | 0.264 | 0.291 | — | 0.9 |
| k-means | 7 | 0.169 | 2357 | 1.508 | 0.0159 | 20.63 | 0.329 | 0.393 | 1.758 | 0.190 | 0.487 | — | 3.1 |
| Ward | 7 | 0.086 | 1716 | 1.799 | 0.0150 | 20.74 | 0.311 | 0.304 | 1.777 | 0.189 | 0.408 | — | 3.2 |
| Gaussian mix. | 7 | 0.050 | 994 | 3.052 | 0.0063 | 25.66 | 0.163 | 0.258 | 1.868 | 0.165 | 0.286 | 241,245 | 7.9 |
| Fuzzy c-means | 7 | 0.076 | 1065 | 8.066 | 0.0180 | 21.59 | 0.389 | 0.263 | 1.521 | 0.239 | 0.300 | — | 0.2 |
| DBSCAN (ε=0.6) | 5 | -0.176 | 269 | 1.409 | 0.1504 | 3.98 | 0.598 | -0.078 | 0.725 | 0.608 | 0.083 | — | 1.1 |
| DBSCAN (ε=0.8) | 4 | -0.075 | 270 | 2.092 | 0.1192 | 7.04 | 0.840 | 0.065 | 0.096 | 0.969 | 0.067 | — | 0.3 |
| RF proximity | 2 | 0.202 | 911 | 1.957 | 0.0167 | 23.82 | 0.398 | 0.299 | 0.600 | 0.591 | 0.154 | — | 28.7 |
| RF proximity | 3 | 0.161 | 652 | 2.263 | 0.0160 | 23.82 | 0.382 | 0.345 | 0.942 | 0.437 | 0.207 | — | 13.3 |
| RF proximity | 4 | -0.043 | 439 | 2.649 | 0.0160 | 23.82 | 0.382 | 0.334 | 0.990 | 0.426 | 0.209 | — | 0.9 |
Note. γ is the Pearson gamma between pairwise distances and the co-membership indicator. Entropy and the Herfindahl–Hirschman index measure balance across clusters. BIC is defined only for the Gaussian mixture. Min % is the share of firms in the smallest cluster. Indices requiring pairwise distances are computed on a random subsample of 5,000 firms.
Figure C1.
Validity indices across algorithms and number of clusters. Note. Density-based and random-forest proximity configurations are excluded from the panels for legibility and reported in Table C1.
Figure C1.
Validity indices across algorithms and number of clusters. Note. Density-based and random-forest proximity configurations are excluded from the panels for legibility and reported in Table C1.
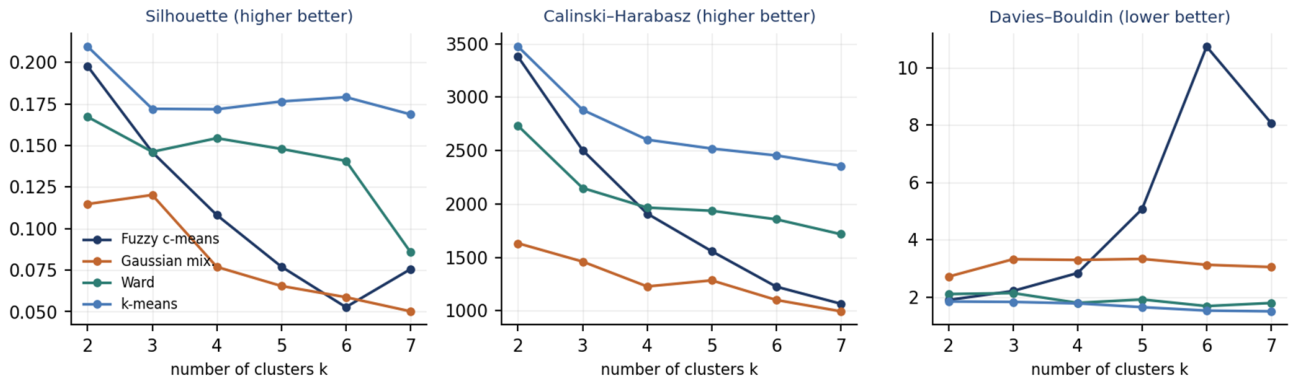
The composite ranking separates k = 4 from its nearest rival by a narrow margin, and the two leading configurations were therefore both examined. At k = 3 the labour-intensive and materials-intensive groups are unchanged and the micro-service and capitalised groups merge; the coefficient pattern of Table C5 survives, with capital turnover still ranging by a factor of three across groups and the labour share still invariant. Fuzzy c-means at k = 2 and k = 3 rank immediately behind k-means, which is reassuring rather than redundant: the same partition is reached by a procedure that does not impose hard assignment.
Table C2.
Composite ranking (mean rank across nine directional indices; lower is better).
| Algorithm | k | Composite rank |
|---|---|---|
| k-means | 4 | 4.00 |
| k-means | 3 | 4.67 |
| k-means | 2 | 5.72 |
| Ward | 3 | 6.11 |
| Fuzzy c-means | 3 | 8.11 |
| Fuzzy c-means | 2 | 8.17 |
| RF proximity | 2 | 8.28 |
| RF proximity | 3 | 8.28 |
Note. Configurations with a smallest cluster below five per cent of firms are excluded, as are density-based solutions classifying more than five per cent of firms as noise.
Table C3 reports medians, interpretable in original units, alongside standardised means, which show each variable’s contribution to the separation. The two columns tell different stories about capitalisation: in medians Cluster 3 is four times as capitalised as Cluster 0, 70.1 against 17.3, but in standardised terms that gap is 1.92 deviations against 2.13 for the labour share between
Table C3.
Cluster profiles, medians and standardised means.
| Variable | C0 med. | C1 med. | C2 med. | C3 med. | C0 std. | C1 std. | C2 std. | C3 std. |
|---|---|---|---|---|---|---|---|---|
| ROA (%) | 3.03 | 4.72 | 7.36 | 10.23 | -0.43 | -0.06 | 0.30 | 0.60 |
| Equity ratio (%) | 17.29 | 33.22 | 34.71 | 70.10 | -0.60 | 0.01 | 0.01 | 1.33 |
| Liquidity ratio | 1.22 | 1.08 | 1.31 | 3.70 | -0.27 | -0.39 | -0.27 | 1.76 |
| Capital turnover | 1.23 | 1.03 | 0.69 | 0.59 | 0.38 | 0.11 | -0.31 | -0.56 |
| ln(Total assets) | 7.58 | 9.75 | 4.79 | 5.60 | 0.16 | 0.93 | -0.94 | -0.53 |
| Labour cost / Value added (%) | 89.63 | 67.55 | 0.63 | 35.23 | 0.71 | 0.06 | -0.80 | -0.44 |
| Purchased services / Output (%) | 29.94 | 18.88 | 57.35 | 34.94 | -0.13 | -0.72 | 0.92 | 0.08 |
| Materials / Output (%) | 3.04 | 47.43 | 0.81 | 0.82 | -0.42 | 1.29 | -0.54 | -0.50 |
| Leased assets / Output (%) | 3.69 | 1.95 | 0.68 | 1.15 | 0.39 | -0.20 | -0.25 | -0.13 |
| Firms | 5,067 | 4,023 | 3,615 | 2,224 | ||||
| Share of sample (%) | 33.9 | 26.9 | 24.2 | 14.9 |
Table C4.
Contingency of partition with regulatory status (row percentages).
| Regulatory population | C0 labour | C1 materials | C2 micro service | C3 capitalised |
|---|---|---|---|---|
| Innovative SMEs | 35.7 | 15.5 | 27.4 | 21.3 |
| Ordinary SMEs | 46.0 | 46.9 | 1.6 | 5.5 |
| Innovative start-ups | 16.7 | 6.1 | 53.1 | 24.2 |
Note. chi2(6) = 6,821.9, p < 0.0001, Cramer V = 0.4780 The partition uses accounting variables only; regulatory status enters no stage of the procedure.
The full within-cluster estimates appear below, with coefficients plotted on two scales because turnover and size are an order of magnitude larger than the cost shares. Three features deserve attention. Liquidity is insignificant in three of four groups. Materials are insignificant in the capitalised cluster, where the median materials share is 0.82 per cent of output and the variable has little variation to exploit. And the labour share is the only coefficient whose confidence intervals overlap across all four groups.
Figure C2.
Equation coefficients re-estimated within each cluster. Note. Two-way fixed effects, firm-clustered standard errors, 95 per cent intervals.
Figure C2.
Equation coefficients re-estimated within each cluster. Note. Two-way fixed effects, firm-clustered standard errors, 95 per cent intervals.
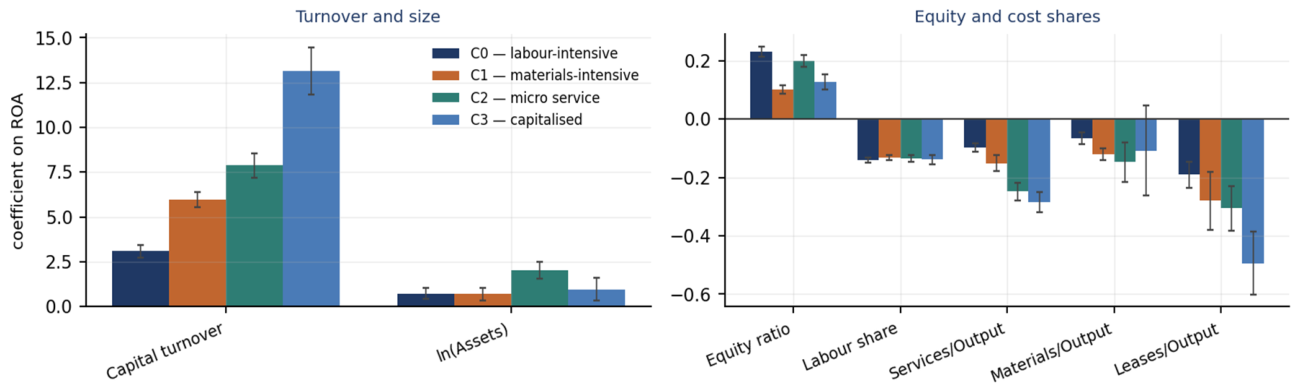
Table C5.
Equation re-estimated within each cluster. Dependent variable: ROA (%).
| Regressor | C0 labour | C1 materials | C2 micro service | C3 capitalised |
|---|---|---|---|---|
| Equity ratio (%) | 0.2314*** (0.0091) | 0.1015*** (0.0069) | 0.2002*** (0.0104) | 0.1280*** (0.0136) |
| Liquidity ratio | 0.1279 (0.1163) | 0.0756 (0.1081) | 0.0015 (0.1311) | -0.1909* (0.1025) |
| Capital turnover | 3.0860*** (0.1742) | 5.9623*** (0.2216) | 7.8726*** (0.3498) | 13.1552*** (0.6774) |
| ln(Total assets) | 0.7229*** (0.1583) | 0.6971*** (0.1736) | 2.0210*** (0.2450) | 0.9727*** (0.3274) |
| Labour cost / Value added (%) | -0.1403*** (0.0038) | -0.1317*** (0.0047) | -0.1347*** (0.0061) | -0.1383*** (0.0084) |
| Purchased services / Output (%) | -0.0980*** (0.0075) | -0.1510*** (0.0139) | -0.2475*** (0.0155) | -0.2852*** (0.0176) |
| Materials / Output (%) | -0.0646*** (0.0105) | -0.1205*** (0.0104) | -0.1466*** (0.0347) | -0.1081 (0.0789) |
| Leased assets / Output (%) | -0.1909*** (0.0234) | -0.2800*** (0.0505) | -0.3051*** (0.0390) | -0.4937*** (0.0545) |
| Observations | 34,377 | 34,632 | 12,804 | 10,062 |
| Firms | 5,060 | 4,019 | 3,612 | 2,223 |
| Within R² | 0.4293 | 0.4955 | 0.4420 | 0.4759 |
Table C6.
Pairwise Wald tests of coefficient equality across clusters.
| Comparison | χ² | df | p |
|---|---|---|---|
| Cluster 0 vs Cluster 1 | 264.42 | 8 | < 0.0001 |
| Cluster 0 vs Cluster 2 | 262.68 | 8 | < 0.0001 |
| Cluster 0 vs Cluster 3 | 374.34 | 8 | < 0.0001 |
| Cluster 1 vs Cluster 2 | 125.42 | 8 | < 0.0001 |
| Cluster 1 vs Cluster 3 | 153.27 | 8 | < 0.0001 |
| Cluster 2 vs Cluster 3 | 84.45 | 8 | < 0.0001 |
Note. Eight degrees of freedom. Variance equal to the sum of the two clustered matrices.
Appendix D—Machine-Learning Regression
The algorithm comparison is reported on raw levels, as such comparisons are conventionally presented; the like-for-like within-transformed figures in Section 6.1 are those comparable with the panel estimates. Two columns beyond the headline deserve attention. The cross-fold standard deviation separates stable from unstable learners: the leading methods sit between 0.0066 and 0.0082 while AdaBoost reaches 0.1250, meaning its accuracy depends heavily on which firms land in the test partition. And the timing column matters for replication, since histogram gradient boosting attains the best accuracy in 3.3 seconds against 120.5 for random forest.
Table D1.
Algorithm comparison, raw levels.
| Model | R² (out of sample) | SD across folds | RMSE | MAE | Seconds |
|---|---|---|---|---|---|
| Hist gradient boosting | 0.7978 | 0.0070 | 5.932 | 3.476 | 3.3 |
| Neural network (MLP) | 0.7875 | 0.0082 | 6.082 | 3.613 | 52.5 |
| Random forest | 0.7786 | 0.0078 | 6.209 | 3.646 | 120.5 |
| Extra trees | 0.7650 | 0.0076 | 6.397 | 3.803 | 19.4 |
| Gradient boosting | 0.7195 | 0.0072 | 6.989 | 4.299 | 95.7 |
| k-nearest neighbours | 0.6945 | 0.0069 | 7.293 | 4.472 | 10.7 |
| Decision tree | 0.6436 | 0.0066 | 7.877 | 4.893 | 2.3 |
| Lasso | 0.4730 | 0.0112 | 9.578 | 6.210 | 0.2 |
| Ridge | 0.4730 | 0.0112 | 9.578 | 6.212 | 0.2 |
| Linear regression | 0.4730 | 0.0112 | 9.578 | 6.212 | 0.2 |
| Elastic net | 0.4730 | 0.0111 | 9.578 | 6.208 | 0.2 |
| Linear SVM | 0.4551 | 0.0108 | 9.740 | 6.065 | 1.8 |
| AdaBoost | 0.2060 | 0.1250 | 11.714 | 8.510 | 25.7 |
Note. Dependent variable ROA (%), same eight regressors and same sample as the panel estimates. Five-fold cross-validation grouped by firm.
Figure D1.
Out-of-sample accuracy by algorithm, raw levels.
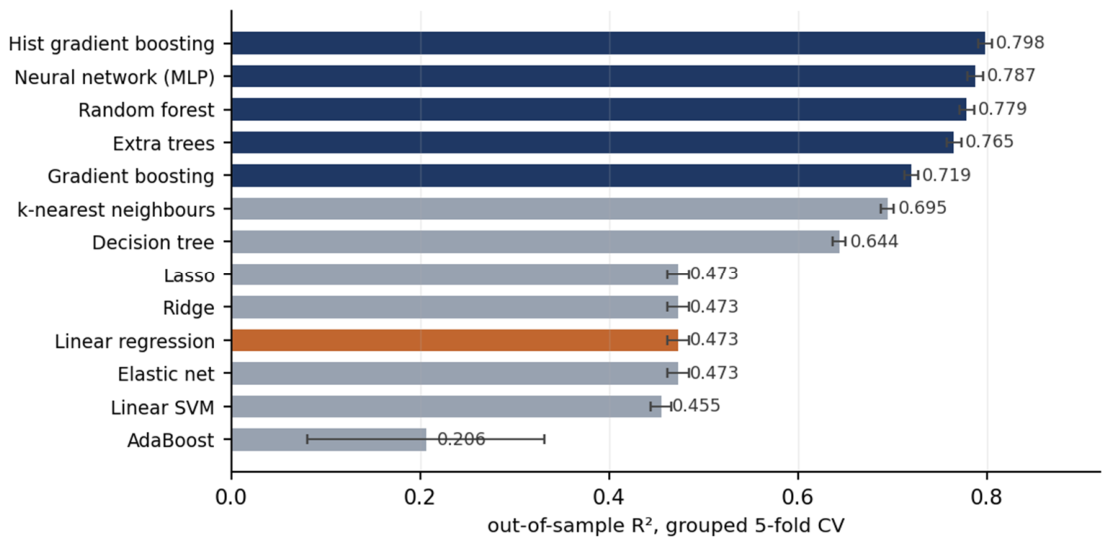
Three bands emerge rather than a continuum: tree ensembles and the neural network above 0.72, k-nearest neighbours and the decision tree between 0.64 and 0.70, and the linear family with AdaBoost below 0.48. The bands correspond to what each family can represent—thresholds and interactions, smooth local structure, and additive linearity. AdaBoost is the one clear failure, its exponential reweighting chasing the tails of a heavy-tailed target, and its failure characterises the distribution rather than the specification.
The learning curve settles whether the remaining gap is an artefact of sample size. The gradient-boosting test score rises little over the final two-thirds of the data while its training score falls towards it, which is the signature of a model that has stopped memorising rather than one starved of observations. The linear model is flat almost from the start: more data will not help it, because what it lacks is form, not information.
Figure D2.
Learning curves, firm-demeaned data.
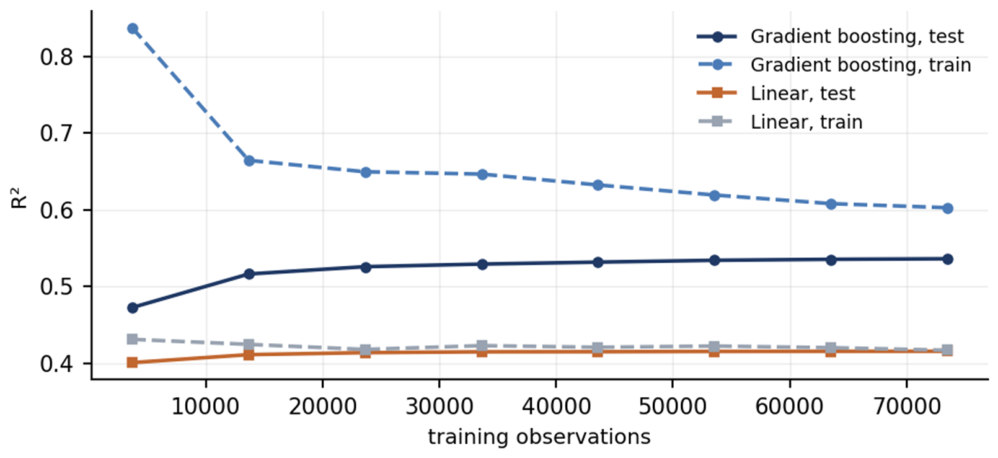
Table D2.
Learning curve values.
| Training observations | Linear, train | Linear, test | Boosting, train | Boosting, test |
|---|---|---|---|---|
| 3,675 | 0.4309 | 0.4005 | 0.8372 | 0.4724 |
| 13,650 | 0.4243 | 0.4110 | 0.6642 | 0.5161 |
| 23,624 | 0.4177 | 0.4136 | 0.6494 | 0.5257 |
| 33,600 | 0.4227 | 0.4146 | 0.6463 | 0.5290 |
| 43,575 | 0.4206 | 0.4148 | 0.6322 | 0.5316 |
| 53,550 | 0.4222 | 0.4151 | 0.6191 | 0.5340 |
| 63,525 | 0.4200 | 0.4153 | 0.6079 | 0.5353 |
| 73,500 | 0.4167 | 0.4153 | 0.6025 | 0.5360 |
The strongest interaction is between the equity ratio and capital turnover, at an H-statistic of 0.042—real but second-order. A purely additive surface would show parallel contours in the right-hand panel, and the curvature visible there is what that magnitude looks like in practice. This corroborates the parametric result from the other direction: interactions recovered 16.7 per cent of the gap against 13.7 for squared terms alone, so neither dominates and both leave four fifths unexplained.
Figure D3.
Interaction strength and joint dependence for the strongest pair.
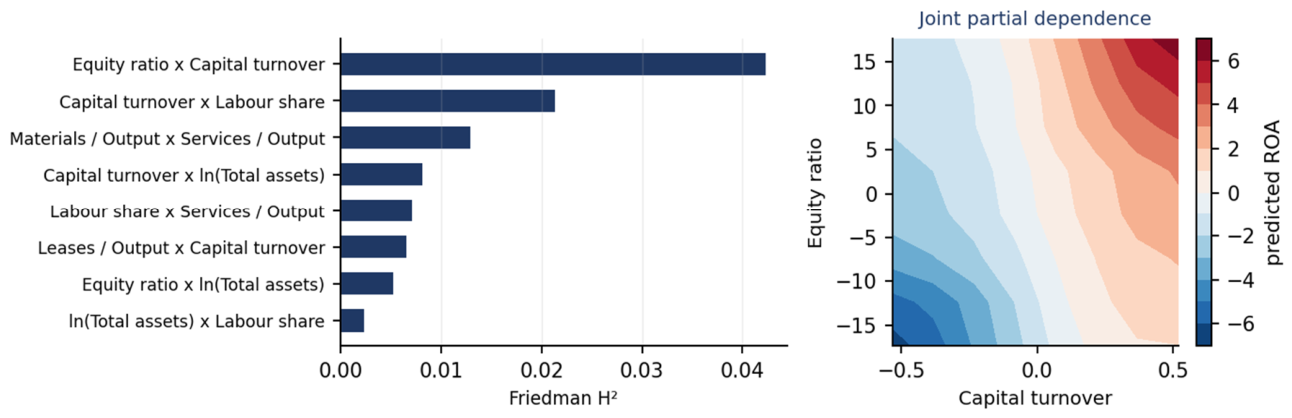
Table D3.
Friedman H-statistic by pair.
| Pair | H² |
|---|---|
| Equity ratio x Capital turnover | 0.0423 |
| Capital turnover x Labour share | 0.0213 |
| Materials / Output x Services / Output | 0.0129 |
| Capital turnover x ln(Total assets) | 0.0082 |
| Labour share x Services / Output | 0.0070 |
| Leases / Output x Capital turnover | 0.0065 |
| Equity ratio x ln(Total assets) | 0.0053 |
| ln(Total assets) x Labour share | 0.0023 |
Note. H² is the share of the joint partial-dependence variation attributable to interaction rather than to the two separate effects. Computed on a 3,000-observation subsample of the held-out fold.
Permutation importance is computed on held-out data, so it measures contribution to genuine prediction rather than in-sample fit. The error bars are small relative to the gap between the labour share and everything else, so the ordering is not a sampling artefact. The four lowest predictors together account for 6.9 per cent, which means the equation could be reduced to four regressors with modest predictive loss—though not without losing controls the panel specification requires.
Table D4.
Permutation importance, firm-demeaned data.
| Predictor | Drop in R² | SD | Share of total (%) |
|---|---|---|---|
| Labour share | 0.6247 | 0.0132 | 63.5 |
| Capital turnover | 0.1309 | 0.0034 | 13.3 |
| Services / Output | 0.0946 | 0.0017 | 9.6 |
| Equity ratio | 0.0642 | 0.0010 | 6.5 |
| Materials / Output | 0.0257 | 0.0018 | 2.6 |
| Leases / Output | 0.0187 | 0.0010 | 1.9 |
| ln(Total assets) | 0.0137 | 0.0007 | 1.4 |
| Liquidity ratio | 0.0110 | 0.0011 | 1.1 |
Figure D4.
Permutation importance, firm-demeaned data.
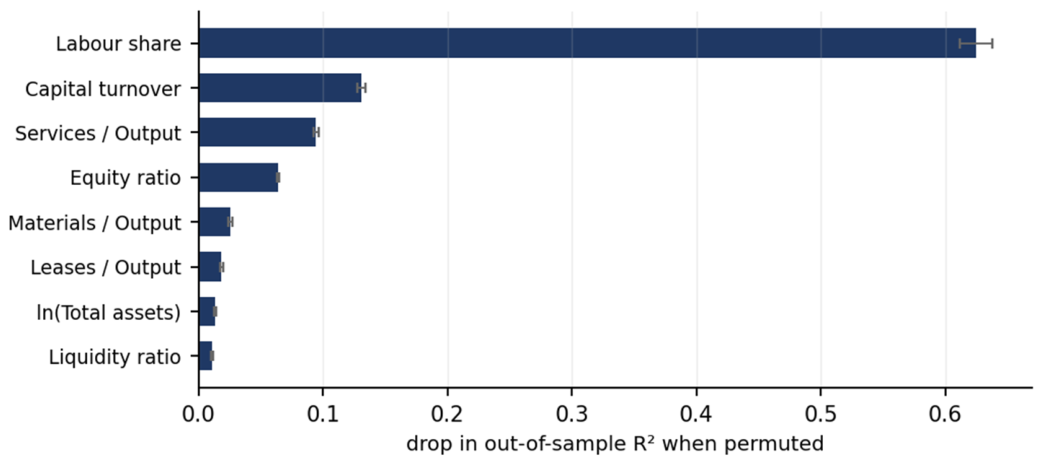
Accuracy by subgroup is reported against both partitions used in the paper. The gap between linear and non-linear fits is widest in the materials-intensive cluster and narrowest in the micro-service one, where the linear form is nearly adequate. The absolute levels matter too: between 38 and 43 per cent of within-firm variation is linearly predictable across every subgroup, a much more even picture than the untrimmed data gave, and one that sets a realistic ceiling for any specification of this equation.
Table D5.
Out-of-sample accuracy by subgroup, firm-demeaned data.
| Subgroup | Observations | Linear R² | Boosting R² | Gap |
|---|---|---|---|---|
| Innovative SMEs | 19,576 | 0.4215 | 0.5238 | 0.1023 |
| Ordinary SMEs | 59,435 | 0.4291 | 0.5829 | 0.1537 |
| Innovative start-ups | 12,864 | 0.3830 | 0.4723 | 0.0893 |
| Cluster 0 | 34,377 | 0.4004 | 0.5336 | 0.1331 |
| Cluster 1 | 34,632 | 0.4752 | 0.6218 | 0.1466 |
| Cluster 2 | 12,804 | 0.4106 | 0.4710 | 0.0604 |
| Cluster 3 | 10,062 | 0.3988 | 0.5436 | 0.1447 |
Figure D5.
Out-of-sample accuracy by subgroup.
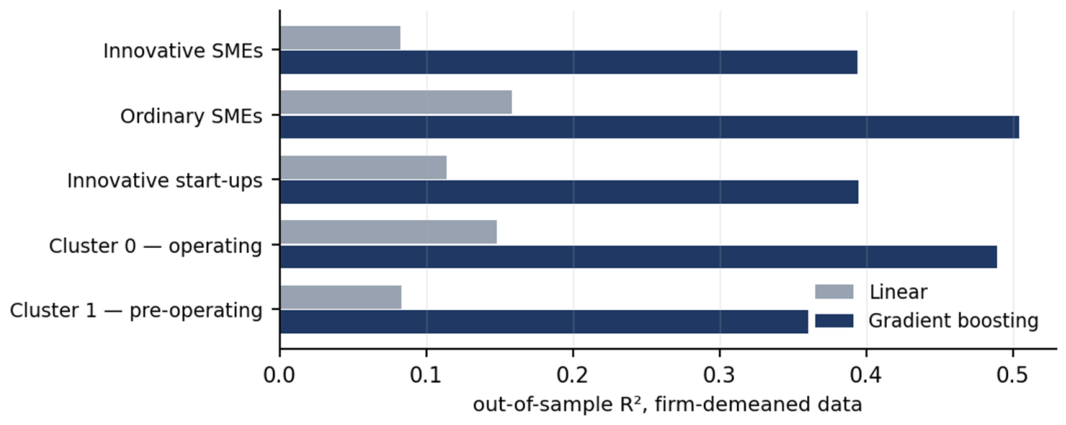
Finally the decile calibration underlying Figure 11. Reading down the two bias columns shows that both models are well calibrated in the middle six deciles and that essentially all of the difference between them arises in the two deciles at each end. A study that trimmed the tails would find the two specifications nearly equivalent, which is worth stating explicitly since it identifies exactly which observations drive the result.
Table D6.
Prediction bias by decile of realised profitability.
| Decile | Actual mean | Linear mean | Boosting mean | Linear bias | Boosting bias |
|---|---|---|---|---|---|
| 1 | -16.46 | -7.86 | -9.02 | +8.60 | +7.43 |
| 2 | -5.70 | -2.73 | -4.28 | +2.97 | +1.42 |
| 3 | -3.09 | -1.42 | -2.63 | +1.66 | +0.45 |
| 4 | -1.55 | -0.74 | -1.57 | +0.82 | -0.02 |
| 5 | -0.48 | -0.22 | -0.59 | +0.26 | -0.11 |
| 6 | 0.26 | 0.23 | 0.22 | -0.04 | -0.04 |
| 7 | 1.34 | 1.04 | 1.57 | -0.30 | +0.22 |
| 8 | 3.04 | 1.90 | 2.76 | -1.14 | -0.28 |
| 9 | 6.04 | 3.22 | 4.59 | -2.82 | -1.45 |
| 10 | 16.59 | 6.58 | 8.88 | -10.01 | -7.71 |
Note. Firm-demeaned ROA on the held-out fold. Bias is predicted minus actual, so positive values indicate over-prediction.
References
- Abdalla, Y.A.; Ahmed, I.E.; Jafeel, A.Y. Family businesses in the GCC: What drives their capital structure? Borsa Istanbul Review 2025, 25(6), 1128–1136. [Google Scholar] [CrossRef]
- Abdalla, Y.A.; Jafeel, A.Y.; Al Mahameed, M. ESG, gender diversity and market stability: how sustainable governance reduces stock volatility in FTSE 100 firms. Journal of Financial Reporting and Accounting 2026, 1–32. [Google Scholar] [CrossRef]
- Accetturo, A. Subsidies for innovative start-ups and firm entry. Industrial and Corporate Change 2022, 31(5), 1202–1222. [Google Scholar] [CrossRef]
- Adair, P.; Adaskou, M. Trade-off theory vs. Pecking order theory and the determinants of corporate leverage: Evidence from a panel data analysis upon french SMEs (2002–2010). Cogent Economics and Finance 2015, 3(1), 1006477. [Google Scholar] [CrossRef]
- Adem, M.; Dsouza, P.K. Impact of Board Characteristics on Firm Performance: Evidence from Ethiopian Microfinance Institutions. In Global Business Review; 2024. [Google Scholar] [CrossRef]
- Agliardi, E.; Charalambides, M.; Koussis, N. Earnings mean reversion and dynamic optimal capital structure. Quantitative Finance 2024, 24(7), 993–1015. [Google Scholar] [CrossRef]
- Agliardi, E.; Charalambides, M.; Chowdhury, M.S.R.; Koussis, N. Do temporary changes in earnings caused by mean reversion affect firms’ refinancing decisions? Journal of Financial Research 2026, 49(1), 228–252. [Google Scholar] [CrossRef]
- Agstner, P. New Legal Forms and Rules for Italian Innovative Enterprises. European Business Law Review 2024, 35(7), 1065–1082. [Google Scholar] [CrossRef]
- Agyei, J.; Sun, S.; Abrokwah, E. Trade-Off Theory Versus Pecking Order Theory: Ghanaian Evidence. SAGE Open 2020, 10(3). [Google Scholar] [CrossRef]
- Ahmed, Z.; Saleem, Q.; Ajmal, M.M.; Jameel, H. Cost of high leverage in socially responsible firms in a linear dynamic panel model. Evidence from product market interactions. Heliyon 2022, 8(4), e09235. [Google Scholar] [CrossRef] [PubMed]
- Aiello, F.; Errico, L.; Rondinella, S. Innovative SMEs in Italy. Explaining profitability patterns in inner areas. Journal of Economic Studies 2024, 51(9), 306–322. [Google Scholar] [CrossRef]
- Akgün, A.İ.; Günay, B. Carbon emission and corporate cash holdings: evidence from the 2008 financial crisis of Türkiye within TOPSIS and ARIMAX approaches. Modern Supply Chain Research and Applications 2026, 8(2), 262–291. [Google Scholar] [CrossRef]
- Albanese, G.; Bronzini, R. The impact of public incentives on the birth of innovative start-ups. Small Business Economics 2026, 66(3), 1309–1332. [Google Scholar] [CrossRef]
- Ali, G.M. Firm valuation using accounting-based capital structure and cash holdings: An explainable machine learning approach. International Journal of Data and Network Science 2026, 10(2), 577–596. [Google Scholar] [CrossRef]
- Ali, H.; Naz, S. Interpretable deep learning for modeling policy uncertainty and firm-specific risk: Evidence from advanced and emerging markets. Data Science in Finance and Economics 2026, 6(1), 147–182. [Google Scholar] [CrossRef]
- Ali, G.M.; Alaskar, M.Z. Nonlinear Association Between Controlling Shareholders and Financial Reporting Integrity: An Explainable Optuna-Optimized Ensemble Learning Approach in Egypt and Saudi Arabia. Journal of Risk and Financial Management 2026, 19(5), 356. [Google Scholar] [CrossRef]
- Alwadeai, A.; Abideen, Z.U. Do Financial Constraints Weaken the Stability Benefits of Sustainability Performance? Corporate Social Responsibility and Environmental Management 2026, 33(4), 4643–4671. [Google Scholar] [CrossRef]
- Amarhyouz, A.; Azegagh, J. Financial Performance of Moroccan Listed Companies: A Multidimensional Analysis of Internal, Macroeconomic, and Institutional Determinants Using Dynamic Panel Data. Qubahan Academic Journal 2025, 5(2), 402–419. [Google Scholar] [CrossRef]
- Amini, S.; Elmore, R.; Öztekin, Ö.; Strauss, J. Can machines learn capital structure dynamics? Journal of Corporate Finance 2021, 70, 102073. [Google Scholar] [CrossRef]
- Amit, S.; Kafy, A.A.; Rahman, M.; Ahmed, I. Youth Capability Ecosystems and Strategic Business Models: Leveraging Market Segmentation for Sustainable Development in Emerging Economies. Business Strategy and Development 2025, 8(2), e70137. [Google Scholar] [CrossRef]
- Anderloni, L.; Harasheh, M. Innovative startups and their traditional peers: Further evidence using performance and survival analysis. Review of Financial Economics 2025, 43(3), 317–335. [Google Scholar] [CrossRef]
- Antar, M.; Hassan, R.; Barka, D. From Black Box to Clarity: Machine Learning and Agnostic Techniques in Credit Risk Management. Journal of Corporate Accounting and Finance 2026, 37(2), 84–98. [Google Scholar] [CrossRef]
- Antenozio, L.; Marques, P.; Bikfalvi, A. Digital orientation and performance in innovative SMEs: exploring the (curvi)linear effects. Technovation 2026, 151, 103478. [Google Scholar] [CrossRef]
- Antonietti, R.; Gambarotto, F. The role of industry variety in the creation of innovative start-ups in Italy. Small Business Economics 2020, 54(2), 561–573. [Google Scholar] [CrossRef]
- Antunes Marante, C.; Rezazadeh, A.; Bohnsack, R. Strategic mapping for business model innovation: a pattern-based approach in the electricity industry. European Journal of Innovation Management 2025, 1–33. [Google Scholar] [CrossRef]
- Arhinful, R.; Amin, H.I.M.; Mensah, L.; Gyamfi, B.A.; Obeng, H.A. Determining an optimal capital structure and its impact on financial performance. Insight from the firms listed on the New York Stock Exchange. Cogent Economics and Finance 2025, 13(1), 2571401. [Google Scholar] [CrossRef]
- Ayadi, R.; Bongini, P.; Casu, B.; Cucinelli, D. Bank Business Model Migrations in Europe: Determinants and Effects. British Journal of Management 2021, 32(4), 1007–1026. [Google Scholar] [CrossRef]
- Aydogan, H. Determinants of chemical wood pulp production in Europe: evidence from panel econometrics and machine learning. European Journal of Forest Research 2026, 145(4), 72. [Google Scholar] [CrossRef]
- Badykova, I.R.; Dinmukhametova, A.A. Defining the Determinants of Corporate Financial Performance: A Machine Learning Approach. Emerging Science Journal 2025, 9(4), 1764–1773. [Google Scholar] [CrossRef]
- Balios, D.; Daskalakis, N.; Eriotis, N.; Vasiliou, D. SMEs capital structure determinants during severe economic crisis: The case of Greece. Cogent Economics and Finance 2016, 4(1), 1145535. [Google Scholar] [CrossRef]
- Banfi, A.; Marchesi, A.; Pampurini, F. PUBLIC CREDIT GUARANTEES AND BANKING SYSTEM: THE ITALIAN CASE DURING COVID-19 EMERGENCY. Journal of Financial Management, Markets and Institutions 2024, 12(2), 2450004. [Google Scholar] [CrossRef]
- Banga, C.; Gupta, A. Effect of firm characteristics on capital structure decisions of Indian SMEs. International Journal of Applied Business and Economic Research 2017, 15(10), 281–301. [Google Scholar]
- Barboza, G.; Capocchi, A. Innovative startups in Italy. Managerial challenges of knowledge spillovers effects on employment generation. Journal of Knowledge Management 2020, 24(10), 2573–2596. [Google Scholar] [CrossRef]
- Barboza, G.; Capocchi, A.; Trejos, S. Knowledge Spillover Effects and Employment Productivity in the Innovative Startups: Evidence from Italy. Review of Regional Studies 2023, 53(2), 156–181. [Google Scholar] [CrossRef]
- Barboza, G.; Pede, V. Weak vs Strong Knowledge Spillover Effects. Evidence from Geographic Distribution of Innovative Startup in Italy. Review of Regional Studies 2024, 54(2), 163–191. [Google Scholar] [CrossRef]
- Barboza, G.; Braga, A. Agglomeration and spillovers: concentration versus dispersion. Evidence from regional innovative startups in Italy. Journal of Technology Transfer 2025. [Google Scholar] [CrossRef]
- Baroncelli, S.; Caputo, A.; Santini, E.; Theodoraki, C. Resilience and entrepreneurial decision-making: the heterogeneity among Italian innovative start-ups. Entrepreneurship and Regional Development 2024, 36(5-6), 798–815. [Google Scholar] [CrossRef]
- Bartoloni, E.; Baussola, M. The persistence of profits, sectoral heterogeneity and firms’ characteristics. International Journal of the Economics of Business 2009, 16(1), 87–111. [Google Scholar] [CrossRef]
- Batebi, S.; Elnahas, A. Are machines better predictors of insider trading? Global Finance Journal 2026, 69, 101237. [Google Scholar] [CrossRef]
- Belouadah, F.; Alqahtani, H.A.; Mohamed, H.M.F.; Gamer, S.D.; Belghaouti, N.T.B.; Ahmad, Z. ESG Disclosure and Firm Value in Saudi Arabia: Evidence from Tadawul Listed Companies Using Dynamic GMM. Sustainability (Switzerland) 2026, 18(13), 6403. [Google Scholar] [CrossRef]
- Bhangu, P.K. Persistence of profitability in top firms: does it vary across sectors? Competitiveness Review 2020, 269–287. [Google Scholar] [CrossRef]
- Bharati, R.; Jia, J. Do bank CEOs really increase risk in vega? Evidence from a dynamic panel GMM specification. Journal of Economics and Business 2018, 99, 39–53. [Google Scholar] [CrossRef]
- Bhatia, A.; Kumari, P. Leverage and corporate performance—the moderating role of corporate governance. Asian Journal of Accounting Research 2026, 11(2), 150–165. [Google Scholar] [CrossRef]
- Biancalani, F.; Czarnitzki, D.; Riccaboni, M. The Italian Start Up Act: a microeconometric program evaluation. Small Business Economics 2022, 58(3), 1699–1720. [Google Scholar] [CrossRef] [PubMed]
- Bonfanti, A.; Mion, G.; Vigolo, V.; Munnia, A. An explorative study of how benefit corporation business incubators can support sustainable entrepreneurial development: evidence from Italy. Journal of Technology Transfer 2026, 51(3), 1315–1340. [Google Scholar] [CrossRef]
- Boshnak, H. The impact of capital structure on firm performance: evidence from Saudi-listed firms. International Journal of Disclosure and Governance 2023, 20(1), 15–26. [Google Scholar] [CrossRef]
- Bottai, C.; Crosato, L.; Domenech, J.; Guerzoni, M.; Liberati, C. Scraping innovativeness from corporate websites: Empirical evidence on Italian manufacturing SMEs. Technological Forecasting and Social Change 2024, 207, 123597. [Google Scholar] [CrossRef]
- Bradfield, T.; Butler, R.; Dillon, E.J.; Hennessy, T.; Loughrey, J. The impact of long-term land leases on farm investment: Evidence from the Irish dairy sector. Land Use Policy 2023, 126, 106553. [Google Scholar] [CrossRef]
- Bueno-Ferrer, Á.; de Pablo Valenciano, J.; de Burgos Jiménez, J. Capital Structure Dynamics and Their Impact on Financial Performance in SMEs of the Road Transportation Sector. SAGE Open 2026, 16(1). [Google Scholar] [CrossRef]
- Bui, D.-T.; Nguyen, H.H.; Ngo, V.M. Financial leverage and performance of smes in vietnam: Evidence from the post-crisis period. Economics and Business Letters 2021, 10(3), 229–239. [Google Scholar] [CrossRef]
- Campello, M. Debt financing: Does it boost or hurt firm performance in product markets? Journal of Financial Economics 2006, 82(1), 135–172. [Google Scholar] [CrossRef]
- Camuffo, A.; Poletto, A. Enterprise-wide lean management systems: a test of the abnormal profitability hypothesis. International Journal of Operations and Production Management 2024, 44(2), 483–514. [Google Scholar] [CrossRef]
- Canarella, G.; Miller, S.M.; Nourayi, M.M. Firm profitability: Mean-reverting or random-walk behavior? Journal of Economics and Business 2013, 66, 76–97. [Google Scholar] [CrossRef]
- Canarella, G.; Miller, S.M. The determinants of growth in the U.S. information and communication technology (ICT) industry: A firm-level analysis. Economic Modelling 2018, 70, 259–271. [Google Scholar] [CrossRef]
- Caselli, S.; Corbetta, G.; Rossolini, M.; Vecchi, V. Public Credit Guarantee Schemes and SMEs’ Profitability: Evidence from Italy. Journal of Small Business Management 2019, 57(S2), 555–578. [Google Scholar] [CrossRef]
- Cavallo, A.; Ghezzi, A.; Colombelli, A.; Casali, G.L. Agglomeration dynamics of innovative start-ups in Italy beyond the industrial district era. International Entrepreneurship and Management Journal 2020, 16(1), 239–262. [Google Scholar] [CrossRef]
- Cavallo, A.; Ghezzi, A.; Rossi-Lamastra, C. Small-medium enterprises and innovative startups in entrepreneurial ecosystems: exploring an under-remarked relation. International Entrepreneurship and Management Journal 2021, 17(4), 1843–1866. [Google Scholar] [CrossRef]
- Centobelli, P.; Cerchione, R.; Esposito, E.; Passaro, R.; Quinto, I. The undigital behavior of innovative startups: empirical evidence and taxonomy of digital innovation strategies. International Journal of Entrepreneurial Behaviour and Research 2022, 28(9), 219–241. [Google Scholar] [CrossRef]
- Chauhan, S.; Verma, A.; Kumar, C.V.R.S.V. Effect of Capital Structure on the Financial and Social Performance of Indian Microfinance Institutions. FIIB Business Review 2024, 13(2), 243–256. [Google Scholar] [CrossRef]
- Choi, S.B.; Sauka, K.; Lee, M. Dynamic Capital Structure Adjustment: An Integrated Analysis of Firm-Specific and Macroeconomic Factors in Korean Firms. International Journal of Financial Studies 2024, 12(1), 26. [Google Scholar] [CrossRef]
- Chowdhury, T.A.; Rahman, M.T.; Chowdhury, M.A.H.; Ahammed, M.Y.; Ahmed, I.; Ahmed, N.; Kafy, A.A. Artificial intelligence driven digital governance and corporate finance: Machine learning applications for knowledge management in export oriented emerging markets. Telematics and Informatics Reports 2026, 22, 100337. [Google Scholar] [CrossRef]
- Chu, M.-T.; Khosla, R.; Chai, K.-H. A cluster analysis of IC design industry. International Journal of Innovation and Technology Management 2014, 11(2), 1450003. [Google Scholar] [CrossRef]
- Colombelli, A.; D’Amico, E.; Paolucci, E. When computer science is not enough: universities knowledge specializations behind artificial intelligence startups in Italy. Journal of Technology Transfer 2023, 48(5), 1599–1627. [Google Scholar] [CrossRef]
- Colombelli, A.; Tubiana, M. Social capital, the knowledge filter and innovative start-ups: the Italian evidence. Economics of Innovation and New Technology 2025. [Google Scholar] [CrossRef]
- Colombelli, A.; D’Ambrosio, A.; Ravetti, C. Women in innovative start-ups and regional inclusiveness: ‘green’ and socially-responsible companies. Regional Studies 2025, 59(1), 2340999. [Google Scholar] [CrossRef]
- Colombelli, A.; D’Ambrosio, A.; Le Masle, B.; Ravetti, C.; Tubiana, M. Knowledge spillovers, green entrepreneurship and the demand for sustainability: evidence from Italian innovative startups. Journal of Technology Transfer 2026, 51(3), 1742–1767. [Google Scholar] [CrossRef]
- D’Amato, A. How did the global financial crisis impact the determinants of SMEs’ capital structure? International Journal of Globalisation and Small Business 2019, 10(3), 210–232. [Google Scholar] [CrossRef]
- D’Amato, V.; D’Ecclesia, R.; Levantesi, S. Firms’ profitability and ESG score: A machine learning approach. Applied Stochastic Models in Business and Industry 2024, 40(2), 243–261. [Google Scholar] [CrossRef]
- Dalci, I. Impact of financial leverage on profitability of listed manufacturing firms in China. Pacific Accounting Review 2018, 30(4), 410–432. [Google Scholar] [CrossRef]
- Del Bosco, B.; Mazzucchelli, A.; Chierici, R.; Di Gregorio, A. Innovative startup creation: the effect of local factors and demographic characteristics of entrepreneurs. International Entrepreneurship and Management Journal 2021, 17(1), 145–164. [Google Scholar] [CrossRef]
- Demirgüneş, K. Determinants of target dividend payout ratio: A panel autoregressive distributed lag analysis. International Journal of Economics and Financial Issues 2015, 5(2), 418–426. [Google Scholar]
- Desai, S.; Eklund, J.E.; Lappi, E. Entry Regulation and Persistence of Profits in Incumbent Firms. Review of Industrial Organization 2020, 57(3), 537–558. [Google Scholar] [CrossRef]
- Dhandio, D.J.; Sulistianingsih, E.; Satyahadewi, N. INTEGRATION OF DAVIES-BOULDIN INDEX VALIDATION AND MEAN-VARIANCE EFFICIENT PORTFOLIO IN K-MEANS++ CLUSTERING FOR OPTIMIZATION OF THE LQ45 STOCK PORTFOLIO. Barekeng 2025, 19(4), 2609–2620. [Google Scholar] [CrossRef]
- Dorsaf, B. RETRACTED: Breaking glass ceilings or boardroom gridlock? Gender, independence and the new rules of MENA banking resilience. Journal of Economic Studies 2025, 1–21. [Google Scholar] [CrossRef]
- Dsouza, S.; Kathavarayan, K.; Mathias, F.; Bhatia, D.; AlKhawaja, A. Leveraging Success: The Hidden Peak in Debt and Firm Performance. Econometrics 2025, 13(2), 23. [Google Scholar] [CrossRef]
- Duppati, G.; Gulati, R.; Matlani, N.; Kijkasiwat, P. Institutional Ownership, Capital Structure and Performance of SMEs in China. South Asian Journal of Macroeconomics and Public Finance 2023, 12(2), 135–159. [Google Scholar] [CrossRef]
- Dvouletý, O.; Blažková, I. Assessing the microeconomic effects of public subsidies on the performance of firms in the czech food processing industry: A counterfactual impact evaluation. Agribusiness 2019, 35(3), 394–422. [Google Scholar] [CrossRef]
- Dvouletý, O.; Čadil, J.; Mirošník, K. Do Firms Supported by Credit Guarantee Schemes Report Better Financial Results 2 Years After the End of Intervention? B.E. Journal of Economic Analysis and Policy 2019, 19(1), 20180057. [Google Scholar] [CrossRef]
- Eklund, J.E.; Lappi, E. Persistence of profits in the EU: how competitive are EU member countries? Empirica 2019, 46(2), 327–351. [Google Scholar] [CrossRef]
- Essel, R.E. Intellectual Capital, Family Management, and the Performance of Listed Manufacturing Firms in Ghana: A Mediation Analysis. Journal of the Knowledge Economy 2025, 16(5), 16901–16941. [Google Scholar] [CrossRef]
- Essel, R.E. Financial Management Practices and Corporate Performance in an Emerging African Capital Market: A Moderation Analysis. Journal of African Business 2026, 27(3), 639–682. [Google Scholar] [CrossRef]
- Fairfield, P.M.; Ramnath, S.; Yohn, T.L. Do industry-level analyses improve forecasts of financial performance. Journal of Accounting Research 2009, 47(1), 147–178. [Google Scholar] [CrossRef]
- Ferrucci, E.; Guida, R.; Meliciani, V. Financial constraints and the growth and survival of innovative start-ups: An analysis of Italian firms. European Financial Management 2021, 27(2), 364–386. [Google Scholar] [CrossRef]
- Galli, F. Accounting for unobserved individual heterogeneity in spatial stochastic frontier models: the case of Italian innovative start-ups. Spatial Economic Analysis 2024, 19(4), 620–645. [Google Scholar] [CrossRef]
- Giraudo, E.; Giudici, G.; Grilli, L. Entrepreneurship policy and the financing of young innovative companies: Evidence from the Italian Startup Act. Research Policy 2019, 48(9), 103801. [Google Scholar] [CrossRef]
- Giuliani, D.; Toffoli, D.; Dickson, M.M.; Mazzitelli, A.; Espa, G. Assessing the role of spatial externalities in the survival of Italian innovative startups. Regional Science Policy and Practice 2024, 16(1), 12653. [Google Scholar] [CrossRef]
- Glen, J.; Lee, K.; Singh, A. Persistence of profitability and competition in emerging markets. Economics Letters 2001, 72(2), 247–253. [Google Scholar] [CrossRef]
- Gnanaprasuna, E.; Senthamizhselvi, A.; Sreenivasulu, A.; Mouneswari, V.; Arun Kumar, B.; Sankar Reddy, K. Impact of Capital Structure on The Performance of Non-Financial Firms in Emerging Markets: Evidence from The Bombay Stock Exchange Using GMM Estimation. International Journal of Accounting and Economics Studies 2025, 12(6), 624–631. [Google Scholar] [CrossRef]
- Goddard, J.; McMillan, D.; Wilson, J.O.S. Do firm sizes and profit rates converge? Evidence on Gibrat’s Law and the persistence of profits in the long run. Applied Economics 2006, 38(3), 267–278. [Google Scholar] [CrossRef]
- Grau, A.; Reig, A. Operating leverage and profitability of SMEs: agri-food industry in Europe. Small Business Economics 2021, 57(1), 221–242. [Google Scholar] [CrossRef]
- Gutiérrez-Ponce, H. Determinants of corporate leverage and sustainability of small and medium-sized enterprises: The case of commercial companies in Ecuador. Business Strategy and the Environment 2024, 33(8), 8319–8331. [Google Scholar] [CrossRef]
- Hahn, D.; Minola, T.; Eddleston, K.A. How do Scientists Contribute to the Performance of Innovative Start-ups? An Imprinting Perspective on Open Innovation. Journal of Management Studies 2019, 56(5), 895–928. [Google Scholar] [CrossRef]
- Hamdouni, A. Value Creation Through Environmental, Social, and Governance (ESG) Disclosures. Journal of Risk and Financial Management 2025, 18(8), 415. [Google Scholar] [CrossRef]
- Han, Y.; Teng, J. CEO characteristics and the prediction of corporate maturity mismatches: a machine learning approach. International Journal of Emerging Markets 2026, 21(7), 2025–2046. [Google Scholar] [CrossRef]
- Hibbeln, M.T.; Kopp, R.M.; Urban, N. Predictive multiplicity, procedural multiplicity, and heterogeneous machine learning ensembles in recovery rate forecasting. Journal of Financial Stability 2026, 83, 101510. [Google Scholar] [CrossRef]
- Hirsch, S.; Gschwandtner, A. Profit persistence in the food industry: Evidence from five European countries. European Review of Agricultural Economics 2013, 40(5), 741–759. [Google Scholar] [CrossRef]
- Hirsch, S.; Hartmann, M. Persistence of firm-level profitability in the European dairy processing industry. Agricultural Economics (United Kingdom) 2014, 45(S1), 53–63. [Google Scholar] [CrossRef]
- Hirsch, S.; Lanter, D.; Finger, R. Profitability and profit persistence in EU food retailing: Differences between top competitors and fringe firms. Agribusiness 2021, 37(2), 235–263. [Google Scholar] [CrossRef]
- Innocenti, N.; Zampi, V. What does a start-up need to grow? An empirical approach for Italian innovative start-ups. International Journal of Entrepreneurial Behaviour and Research 2019, 25(2), 376–393. [Google Scholar] [CrossRef]
- Iqbal, N.; Xu, J.F.; Fareed, Z.; Wan, G.; Ma, L. Financial leverage and corporate innovation in Chinese public-listed firms. European Journal of Innovation Management 2022, 25(1), 299–323. [Google Scholar] [CrossRef]
- Islam, M.S.; Rahman, M.A.; Hossain, A.A. Causal Inference in Econometrics Using Machine Learning: Estimating the Effect of AI and Automation Adoption on Firm Productivity in Europe. Statistics, Optimization and Information Computing 2026, 15(4), 3059–3084. [Google Scholar] [CrossRef]
- Jaisinghani, D.; Sekhon, A.K. CSR disclosures and profit persistence: evidence from India. International Journal of Emerging Markets 2022, 17(3), 705–724. [Google Scholar] [CrossRef]
- Jin, Y.; Li, X.; Tian, G.; Shi, J.; Wang, Y. Employee education level and efficiency of corporate investment. Journal of Accounting Literature 2025, 47(2), 277–297. [Google Scholar] [CrossRef]
- Jones, S. A literature survey of corporate failure prediction models. Journal of Accounting Literature 2023, 45(2), 364–405. [Google Scholar] [CrossRef]
- Kambi, M.; Kasoga, P.S. Capital Structure and Performance of Small and Medium Enterprises: Empirical Evidence from Tanzania. In Vision; 2024. [Google Scholar] [CrossRef]
- Kenourgios, D.; Savvakis, G.A.; Papageorgiou, T. The capital structure dynamics of European listed SMEs. Journal of Small Business and Entrepreneurship 2020, 32(6), 567–584. [Google Scholar] [CrossRef]
- Kotipalli, P.; Aggarwal, G. Business Models in the Indian Craft Sector: A Typological Analysis. In Thunderbird International Business Review; 2026. [Google Scholar] [CrossRef]
- Lazzarini, S.G.; Brito, L.A.L.; Chaddad, F.R. Conduits of innovation or imitation? Assessing the effect of alliances on the persistence of profits in U.S. firms. BAR—Brazilian Administration Review 2013, 10(1), 1–17. [Google Scholar] [CrossRef]
- Li, P.; Guo, X.; Wang, F.; Zhang, Q. Digital transformation and corporate innovation boundaries: Role of supply chain concentration and transparency. International Review of Financial Analysis 2025, 98, 103922. [Google Scholar] [CrossRef]
- Li, P.; Li, X.; Wu, Q. Digitalization drives Sustainability: How digital trade enhances corporate ESG performance through innovation, internationalization and transparency. International Review of Economics and Finance 2025, 101, 104248. [Google Scholar] [CrossRef]
- Lin, S.-W.; Lin, Y.-R. Evaluating CEO hubris effects on sustainable performance in the IC design industry: An integrated dynamic network DEA framework with machine learning. Applied Soft Computing 2025, 185, 113986. [Google Scholar] [CrossRef]
- Liu, L.; Liu, Q.; Tian, G.; Wang, P. Government connections and the persistence of profitability: Evidence from Chinese listed firms. Emerging Markets Review 2018, 36, 110–129. [Google Scholar] [CrossRef]
- Liu, W.; Yaacob, Z. Carbon Disclosure Quality, Internal Control, and Corporate Financial Performance. Journal of Corporate Finance Research 2025, 19(4), 31–49. [Google Scholar] [CrossRef]
- Liu, H.; Hamza, F.; Mammadova, G.; Shanazarova, G.; Yu, T. Driving clean energy adoption in emerging markets:the role of hydrogen energy and economic growth. International Journal of Hydrogen Energy 2025, 139, 280–290. [Google Scholar] [CrossRef]
- Liu, W.; Zou, Y.; Liu, B.; Tao, J.; Lan, X.; Xia, M. Explainable adaptive ensemble learning with imbalance mitigation for manufacturing sector financial risk warning. Chaos, Solitons and Fractals 2026, 202, 117577. [Google Scholar] [CrossRef]
- Lukeš, M.; Longo, M.C.; Zouhar, J. Do business incubators really enhance entrepreneurial growth? Evidence from a large sample of innovative Italian start-ups. Technovation 2019, 82-83, 25–34. [Google Scholar] [CrossRef]
- Mahmood, A.N.; Arslan, H.M.; Younas, Z.I.; Komal, B.; Ali, K.; Mubeen, M. Understanding the dynamics of capital structure, corporate governance, and corporate social responsibility in high- and low-leveraged US and Chinese firms. Environmental Science and Pollution Research 2023, 30(16), 46204–46221. [Google Scholar] [CrossRef] [PubMed]
- Malhotra, P. Predicting venture capital exit strategies through explainable machine learning: governance, decision intelligence and organisational implications. International Journal of Organizational Analysis 2026, 1–22. [Google Scholar] [CrossRef]
- Manaresi, F.; Menon, C.; Santoleri, P. Supporting innovative entrepreneurship: an evaluation of the Italian “Start-up Act”. Industrial and Corporate Change 2021, 30(6), 1591–1614. [Google Scholar] [CrossRef]
- Manelli, A.; Pace, R.; Leone, M. Leverage, Growth Opportunities, and Credit Risk: Evidence from Italian Innovative SMEs. Risks 2022, 10(4), 74. [Google Scholar] [CrossRef]
- Manogna, R.L.; Mishra, A.K. Forecasting spot prices of agricultural commodities in India: Application of deep-learning models. Intelligent Systems in Accounting, Finance and Management 2021, 28(1), 72–83. [Google Scholar] [CrossRef]
- Mansour, M.; Al Zobi, M.K.; Al-Naimi, A.; Daoud, L. “The connection between Capital structure and performance: Does firm size matter?”. Investment Management and Financial Innovations 2023, 20(1), 195–206. [Google Scholar] [CrossRef]
- Mansour, M.; Yamin, I.Y.; Saram, M.; Alduwailah, A.; Al-Enzi, N.; Alwadi, B.M.; Marei, A. Capital structure and performance nexus: Insights from fixed-effects and quantile analysis. Journal of Infrastructure, Policy and Development 2024, 8(7), 5119. [Google Scholar] [CrossRef]
- Marozva, G. Firm Performance, Liquidity and Capital Structure Nexus: Evidence from the PMG Panel-ARDL Approach. Risks 2026, 14(3), 61. [Google Scholar] [CrossRef]
- Marra, M.; Alfano, V.; Celentano, R.M. Assessing university-business collaborations for moderate innovators: Implications for university-led innovation policy evaluation. Evaluation and Program Planning 2022, 95, 102170. [Google Scholar] [CrossRef] [PubMed]
- Matricano, D. The effect of R&D investments, highly skilled employees, and patents on the performance of Italian innovative startups. Technology Analysis and Strategic Management 2020, 32(10), 1195–1208. [Google Scholar] [CrossRef]
- Matricano, D. Economic and social development generated by innovative startups: does heterogeneity persist across Italian macro-regions? Economics of Innovation and New Technology 2022, 31(6), 467–484. [Google Scholar] [CrossRef]
- Matricano, D. Designing effective policies for innovative start-ups: Lessons learned in Italy. Journal of Business Venturing Insights 2024, 22, e00486. [Google Scholar] [CrossRef]
- Matricano, D. The influence of the technological regime on the performance of Italian innovative start-ups. Technology Analysis and Strategic Management 2024, 36(5), 902–915. [Google Scholar] [CrossRef]
- Maury, B. Sustainable competitive advantage and profitability persistence: Sources versus outcomes for assessing advantage. Journal of Business Research 2018, 84, 100–113. [Google Scholar] [CrossRef]
- Mekelburg, E.; Strauss, J. Pooling and winsorizing machine learning forecasts to predict stock returns with high-dimensional data. Journal of Empirical Finance 2024, 79, 101538. [Google Scholar] [CrossRef]
- Miniaci, R.; Panteghini, P.M. On the Capital Structure of Foreign Subsidiaries: Evidence from Panel Data Quantile Regression Models. German Economic Review 2026, 27(2), 133–167. [Google Scholar] [CrossRef]
- Modina, M.; Capalbo, F.; Sorrentino, M.; Ianiro, G.; Khan, M.F. Innovation ecosystems: a comparison between university spin-off firms and innovative start-ups. Evidence from Italy. International Entrepreneurship and Management Journal 2024, 20(2), 575–605. [Google Scholar] [CrossRef]
- Mohamed Adnan, S.; Alahdal, W.M.; Alrazi, B.; Mat Husin, N. The impact of environmental crimes and profitability on environmental disclosure in Malaysian SME sector: The role of leverage. Cogent Business and Management 2023, 10(3), 2274616. [Google Scholar] [CrossRef]
- Musile Tanzi, P.; Aruanno, E.; Suardi, M. A European banking business models analysis: the investment services case. Journal of Financial Regulation and Compliance 2018, 26(1), 35–57. [Google Scholar] [CrossRef]
- Nadhilah, F.; Sudrajad, O.Y. Do business models in Islamic bank matters? The effect of business models on bank performance and stability. International Journal of Monetary Economics and Finance 2022, 15(3), 253–272. [Google Scholar] [CrossRef]
- Nassim, I.; Nassim, S.; Moussa, A. Financial Leverage and Firm Performance in Moroccan Agricultural SMEs: Evidence of Nonlinear Dynamics. International Journal of Financial Studies 2025, 13(3), 164. [Google Scholar] [CrossRef]
- Nguyen, T.T.C.; Nguyen, C.V. Does the education level of the CEO and CFO affect the profitability of real estate and construction companies? Evidence from Vietnam. Heliyon 2024, 10(7), e28376. [Google Scholar] [CrossRef] [PubMed]
- Nguyen, N.Q.; Nguyen, T.D. FINANCIAL LEVERAGE AND FIRM PERFORMANCE: EMPIRICAL EVIDENCE FROM VIETNAM’S LISTED REAL ESTATE COMPANIES; [DŹWIGNIA FINANSOWA A WYNIKI FIRM: DANE EMPIRYCZNE Z WIETNAMSKICH SPÓŁEK NIERUCHOMOŚCIOWYCH NOTOWANYCH NA GIEŁDZIE]. Polish Journal of Management Studies 2026, 33(1), 179–197. [Google Scholar] [CrossRef]
- Norkio, A. Intangible capital and financial leverage in SMEs. Managerial Finance 2024, 50(2), 434–450. [Google Scholar] [CrossRef]
- Novaković, D.; Novaković, T.; Milić, D.; Tomaš Simin, M.; Nikolić, S.; Knežević, M.; Radišić, M.; Radišić, M.; Pevac, D. Circular Economy and Resource Efficiency in the Serbian Agri-Food Sector: Evidence from Dynamic Panel Analysis. Economies 2025, 13(12), 346. [Google Scholar] [CrossRef]
- Okofo-Dartey, E. Profit persistence in the Ghanaian banking industry: a first order autoregressive approach. Journal of Economic and Administrative Sciences 2025. [Google Scholar] [CrossRef]
- Oliveira, I.; Silva, A.; Figueiredo, J.; Cardoso, A.; Pereira, M.S. Capital Structure in Small Firms: A Conditional Approach Based on Accounting Variables. Journal of Risk and Financial Management 2026, 19(4), 296. [Google Scholar] [CrossRef]
- Onesti, G.; Monaco, E.; Palumbo, R. Assessing the Italian Innovative Start-Ups Performance with a Composite Index. Administrative Sciences 2022, 12(4), 189. [Google Scholar] [CrossRef]
- Opstad, L.; Idsø, J.; Valenta, R. The Dynamics of Profitability among Salmon Farmers—A Highly Volatile and Highly Profitable Sector. Fishes 2022, 7(3), 101. [Google Scholar] [CrossRef]
- Opstad, L.; Idsø, J.; Valenta, R. The Dynamics of the Profitability and Growth of Restaurants; The Case of Norway. Economies 2022, 10(2), 53. [Google Scholar] [CrossRef]
- Pacheco, L.; Tavares, F. Capital structure determinants of hospitality sector SMEs. Tourism Economics 2017, 23(1), 113–132. [Google Scholar] [CrossRef]
- Pacheco, L.; Carvalho, A. Capital Structure Adjustment in SMEs: Limits of the Dynamic Trade-Off Model. Journal of Risk and Financial Management 2026, 19(6), 414. [Google Scholar] [CrossRef]
- Panchal, D.B.; Krishnamoorthy, B. Emerging perspectives on business model typologies. International Journal of Business Excellence 2020, 21(3), 410–428. [Google Scholar] [CrossRef]
- Pham, L.H.; Hrdý, M. Determinants of S.M.E.s capital structure in the Visegrad group. Economic Research-Ekonomska Istrazivanja 2023, 36(1), 2166969. [Google Scholar] [CrossRef]
- Pieroni, M.P.P.; McAloone, T.C.; Pigosso, D.C.A. From theory to practice: systematising and testing business model archetypes for circular economy. Resources, Conservation and Recycling 2020, 162, 105029. [Google Scholar] [CrossRef]
- Priyan, P.K.; Nyabakora, W.I.; Rwezimula, G. Firm’s capital structure decisions, asset structure, and firm’s performance: application of the generalized method of moments approach. PSU Research Review 2024, 8(3), 813–827. [Google Scholar] [CrossRef]
- Promsa-Ad, S.; Kittiphattanabawon, N. Unveiling Business Activity Patterns of Digital Transformation through K-Means Clustering with Universal Sentence Encoder in Transport and Logistics Sectors. Journal of Telecommunications and the Digital Economy 2024, 12(1), 222–241. [Google Scholar] [CrossRef]
- Psaraftis, H.N.; Kontovas, C.A. Speed models for energy-efficient maritime transportation: A taxonomy and survey. Transportation Research Part C: Emerging Technologies 2013, 26, 331–351. [Google Scholar] [CrossRef]
- Qerimi, A.; Balaj, D.; Krasniqi, B.A. THE CAPITAL STRUCTURE DYNAMICS OF SMES IN KOSOVO: EVIDENCE USING PANEL DATA. South East European Journal of Economics and Business 2024, 19(2), 82–102. [Google Scholar] [CrossRef]
- Rokhayati, I.; Pramuka, B.A.; Sudarto. Optimal financial leverage determinants for smes capital structure decision making: Empirical evidence from Indonesia. International Journal of Scientific and Technology Research 2019, 8(11), 1155–1161. [Google Scholar]
- Romero Martínez, M.; Carmona Ibáñez, P.; Martínez Vargas, J. Predicting Business Failure with the XGBoost Algorithm: The Role of Environmental Risk. Sustainability (Switzerland) 2025, 17(11), 4948. [Google Scholar] [CrossRef]
- Saiz-Sepulveda, Á.; Moreno-Adalid, A.M.; Rodríguez-Iglesias, I.M.; Estrada-López, H.E. High-quality capital and financial performance: a dynamic panel analysis of Spanish systemic banks after Basel III. Journal of Risk Finance 2026, 27(4), 541–570. [Google Scholar] [CrossRef]
- Samal, D.; Yadav, I.S. Agency conflicts, corporate ownership and capital structure decisions of Indian firms: evidence from new governance laws. Journal of Accounting Literature 2025. [Google Scholar] [CrossRef]
- Santoleri, P.; Russo, E. Spurring subsidy entrepreneurs. Research Policy 2025, 54(1), 105128. [Google Scholar] [CrossRef]
- Sari, M.; Netti Siska, N.; Nizar, N.; Roslan, A.; Quadratov, I. Why Very Low Leverage Varies Across ASEAN: A Dynamic Panel Perspective. Daengku 2026, 6(2), 286–303. [Google Scholar] [CrossRef]
- Scandurra, G.; Thomas, A.; Appolloni, A. Supporting the diffusion of innovative SMEs: the Italian experience. International Journal of Entrepreneurship and Small Business 2025, 55(4), 439–463. [Google Scholar] [CrossRef]
- Schifilliti, V.; La Rocca, E.T. Board gender diversity in innovative SMEs: an investigation across industrial sectors. European Journal of Innovation Management 2024, 27(9), 461–486. [Google Scholar] [CrossRef]
- Sciarelli, M.; Prisco, A.; Gheith, M.H.; Muto, V. Factors affecting the adoption of blockchain technology in innovative Italian companies: an extended TAM approach. Journal of Strategy and Management 2022, 15(3), 495–507. [Google Scholar] [CrossRef]
- Serio, R.G.; Dickson, M.M.; Giuliani, D.; Espa, G. Green production as a factor of survival for innovative startups: Evidence from Italy. Sustainability (Switzerland) 2020, 12(22), 1–12. [Google Scholar] [CrossRef]
- Sewpersadh, N.S. A theoretical and econometric evaluation of corporate governance and capital structure in JSE-listed companies. Corporate Governance (Bingley) 2019, 19(5), 1063–1081. [Google Scholar] [CrossRef]
- Shahana, T.; Aamir Rashid, B.; Lavanya, V.; Jenifer, C. Transparent audit opinion prediction using explainable boosting machines: a balanced dataset analysis from Indian firms. Cogent Business and Management 2026, 13(1), 2677338. [Google Scholar] [CrossRef]
- Shahrour, M.H.; Girerd-Potin, I.; Taramasco, O. Corporate social responsibility and firm default risk in the Eurozone: a market-based approach. Managerial Finance 2021, 47(7), 975–997. [Google Scholar] [CrossRef]
- Shakri, I.H.; Yong, J.; Xiang, E. Does capital structure mediate the relationship between corporate governance compliance and firm performance? Empirical evidence from Pakistan. Journal of Asia Business Studies 2025, 19(2), 408–428. [Google Scholar] [CrossRef]
- Sharma, J.; Formentini, M.; Mezzetti, N.; Apicella, A. Designing and validating an AI-enabled digital platform to foster circular business models. Technology in Society 2026, 88, 103489. [Google Scholar] [CrossRef]
- Shpak, N.; Karpyak, A.; Rybytska, O.; Gvozd, M.; Sroka, W. Assessing the business models of Ukrainian IT companies. Forum Scientiae Oeconomia 2023, 11(1), 13–48. [Google Scholar] [CrossRef]
- Shu, H.; Tan, W.; Wei, P. Carbon policy risk and corporate capital structure decision. International Review of Financial Analysis 2023, 86, 102523. [Google Scholar] [CrossRef]
- Siddiqui, Z.; Rivera, C.A. MAPPING FINTECH LANDSCAPE IN LATVIA: TAXONOMY-BASED CLASSIFICATION AND ECONOMIC IMPACT ANALYSIS; [MAPOWANIE KRAJOBRAZU FINTECH W ŁOTWIE: KLASYFIKACJA OPARTA NA TAKSONOMII I ANALIZA WPŁYWU EKONOMICZNEGO]. Polish Journal of Management Studies 2024, 30(1), 304–319. [Google Scholar] [CrossRef]
- Singh, K.; Pillai, D.; Rastogi, S. Pecking Order Theory of Capital Structure: Empirical Evidence for Listed SMEs in India. Vision 2025, 29(1), 35–47. [Google Scholar] [CrossRef]
- Song, W.; Han, X. Corporate-level climate risk prediction: A comparative machine learning framework. Journal of Cleaner Production 2026, 571, 148835. [Google Scholar] [CrossRef]
- Thompson, E.K. Nonlinear Insights Into the ESG–Crash Risk Dynamics From a Machine Learning Perspective: Evidence From an Emerging-Transition Market. Corporate Social Responsibility and Environmental Management 2026, 33(1), 381–398. [Google Scholar] [CrossRef]
- Thys, M.; Pellens, M.; Hottenrott, H.; Berger, M. Public support and VC financing in academic startups. Strategic Entrepreneurship Journal 2025. [Google Scholar] [CrossRef]
- Tinungki, G.M.; Hartono, P.; Robiyanto, R.; Hartono, A.; Jakaria, J.; Simanjuntak, L. The COVID-19 Pandemic Impact on Corporate Dividend Policy of Sustainable and Responsible Investment in Indonesia: Static and Dynamic Panel Data Model Comparison. Sustainability (Switzerland) 2022, 14(10), 6152. [Google Scholar] [CrossRef]
- Tons, Y.; Serrasqueiro, Z. The influential factors on capital structure: A study on portuguese high technology and medium-high technology small and medium-sized enterprises. International Journal of Financial Research 2020, 11(4), 23–35. [Google Scholar] [CrossRef]
- Uddin, M.A.; Talukder, M.A.; Ahmed, M.R.; Khraisat, A.; Alazab, A.; Islam, M.M.; Aryal, S.; Jibon, F.A. Data-driven strategies for digital native market segmentation using clustering. International Journal of Cognitive Computing in Engineering 2024, 5, 178–191. [Google Scholar] [CrossRef]
- Udo, E.S.; Jack, A.E.; Okoh, J.I.; Agbadua, O.B.; Eke, R.; Onyemere, I. Intricate Capital Structure Influence on Firm Performance: An Empirical Analysis of Oil and Gas Firms in Nigeria. African Journal of Business and Economic Research 2024, 19(3), 395–415. [Google Scholar] [CrossRef]
- Vu Thi, A.-H.; Phung, T.-D. Capital Structure, Working Capital, and Governance Quality Affect the Financial Performance of Small and Medium Enterprises in Taiwan. Journal of Risk and Financial Management 2021, 14(8), 381. [Google Scholar] [CrossRef]
- Wang, M.; Cui, R.; Zhao, X.; Zhang, Y.; Zhang, J. Leveraging AI-based organizational learning for sustainable performance in manufacturing. Journal of Manufacturing Technology Management 2026, 1–22. [Google Scholar] [CrossRef]
- Wang, Y.; Sumritsakun, C.; Yodbutr, A.; Awirothananon, T. The impact of ESG performance on firm performance: the moderating role of audit quality—evidence from China. Asian Journal of Accounting Research 2026, 1–14. [Google Scholar] [CrossRef]
- Wibbens, P.D. Performance persistence in the presence of higher-order resources. Strategic Management Journal 2019, 40(2), 181–202. [Google Scholar] [CrossRef]
- Wu, S.; Jiang, J. Earnings Predictability of DuPont Factors: Impact of Mean Reversion and Competitiveness. Journal of Risk and Financial Management 2026, 19(6), 408. [Google Scholar] [CrossRef]
- Xu, X.; Ye, T.; Gao, J.; Chu, D. The effect of green, supply chain factors in predicting China’s stock price crash risk: evidence from random forest model. Environment, Development and Sustainability 2025, 27(10), 23591–23614. [Google Scholar] [CrossRef]
- Yadav, P.L.; Han, S.H.; Kim, H. Sustaining Competitive Advantage Through Corporate Environmental Performance. Business Strategy and the Environment 2017, 26(3), 345–357. [Google Scholar] [CrossRef]
- Yang, H.P.; Khairudin, N.B.; Salleh, D.B. Predicting Corporate Carbon Disclosure in China: Evidence from Interpretable Machine Learning. Sustainability (Switzerland) 2026, 18(8), 4022. [Google Scholar] [CrossRef]
- Yang, L. Uncovering cross-organizational risk patterns: a machine learning approach to predicting financial fraud via chain leader attributes. In Review of Managerial Science; 2026. [Google Scholar] [CrossRef]
- Yazdanfar, D.; Öhman, P. Debt financing and firm performance: an empirical study based on Swedish data. Journal of Risk Finance 2015, 16(1), 102–118. [Google Scholar] [CrossRef]
- Youssef, I.S.; Salloum, C.; Al Sayah, M. The determinants of profitability in non-financial UK SMEs. European Business Review 2023, 35(5), 652–671. [Google Scholar] [CrossRef]
- Yu, R.; Dou, Y.; Adam, N.A.; Shakaraliyeva, Z.; Hakimova, Y.; Huseynova, A. Economic performance and financial risk analysis of energy systems under uncertainty. Energy Strategy Reviews 2026, 66, 102249. [Google Scholar] [CrossRef]
- Zarutska, O.; Novikova, L.; Pavlov, R.; Pavlova, T.; Levkovich, O. EVALUATION OF UKRAINIAN BANKS’ BUSINESS MODELS BY THE STRUCTURAL AND FUNCTIONAL GROUPS ANALYSIS METHOD. Financial and Credit Activity: Problems of Theory and Practice 2022, 4(45), 8–20. [Google Scholar] [CrossRef]
- Zarutska, O.; Dobrovolska, O.; Masiuk, I.; Sonntag, R.; Ortmanns, W. Risk management through a Kohonen MAP bank business model survey: The case of Ukraine. Banks and Bank Systems 2024, 19(2), 221–233. [Google Scholar] [CrossRef]
- Zhang, F. Machine learning prediction and interpretability analysis of the association between digital transformation and enterprise performance: Based on the XGBoost-SHAP integrated framework. Results in Engineering 2026, 31, 111560. [Google Scholar] [CrossRef]
- Zhao, Y.; Bi, X.; Ma, Q.-P. Predicting mergers & acquisitions: A machine learning-based approach. International Review of Financial Analysis 2025, 99, 103933. [Google Scholar] [CrossRef]
- Zhao, J.; Dai, X.; Gao, P.; Ma, S.; Wang, L. Rebar Price Prediction in Guangzhou, China: A Comparison of Statistical, Machine Learning and Hybrid Models. Buildings 2026, 16(5), 905. [Google Scholar] [CrossRef]
- Zhu, C.; Husnain, M.; Ullah, S.; Khan, M.T.; Ali, W. Gender Diversity and Firms’ Sustainable Performance: Moderating Role of CEO Duality in Emerging Equity Market. Sustainability (Switzerland) 2022, 14(12), 7177. [Google Scholar] [CrossRef]
- Zhu, N.; Nagriwum, T.M.; Saeed, U.F. Advancing ESG Performance in MENA Economies: Do Governance Structures and Eco-Technology Matter? Corporate Social Responsibility and Environmental Management 2025, 32(6), 7793–7815. [Google Scholar] [CrossRef]
Figure 1.
Graphical abstract: data, specification and the three estimation strategies.
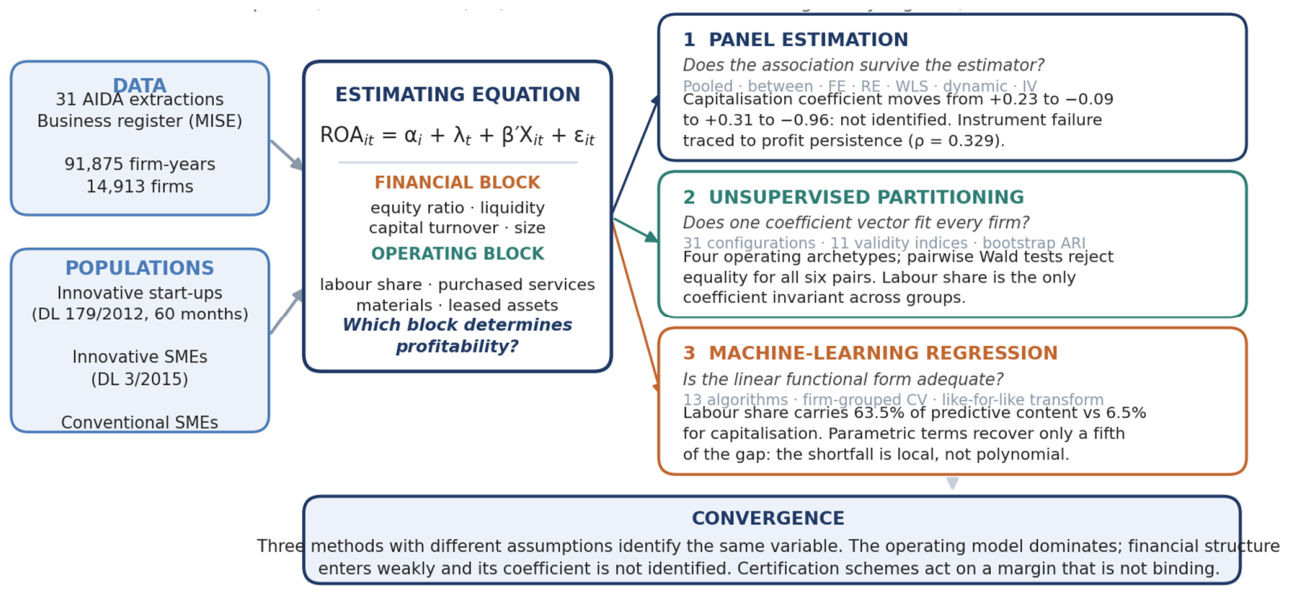
Figure 2.
Effect of a one-standard-deviation increase, four estimators.
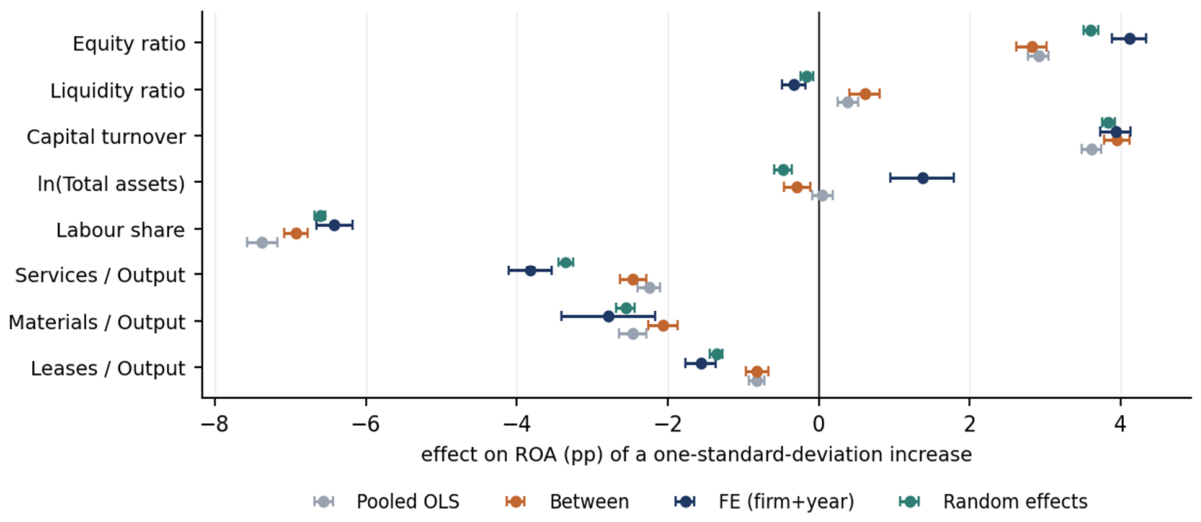
Figure 3.
Between and within estimates compared.
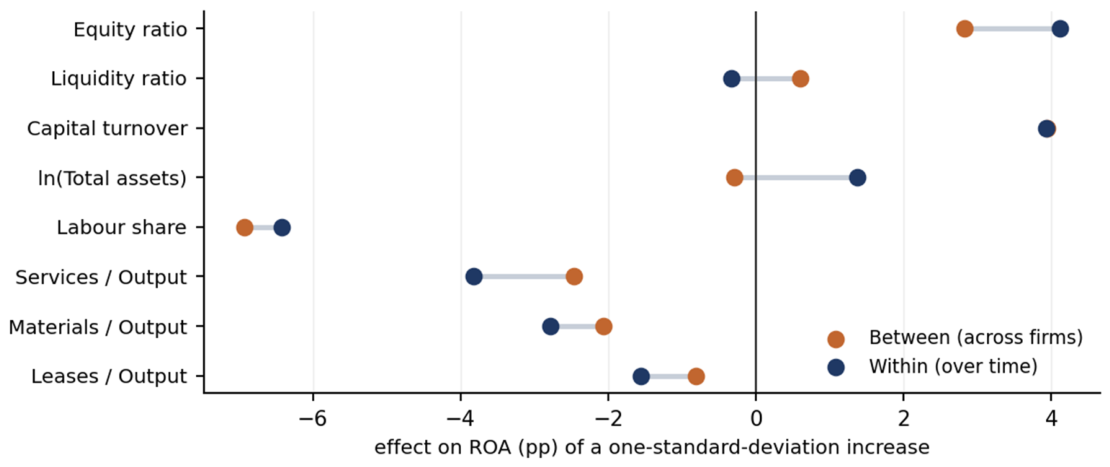
Figure 4.
The equity coefficient across thirteen specifications.
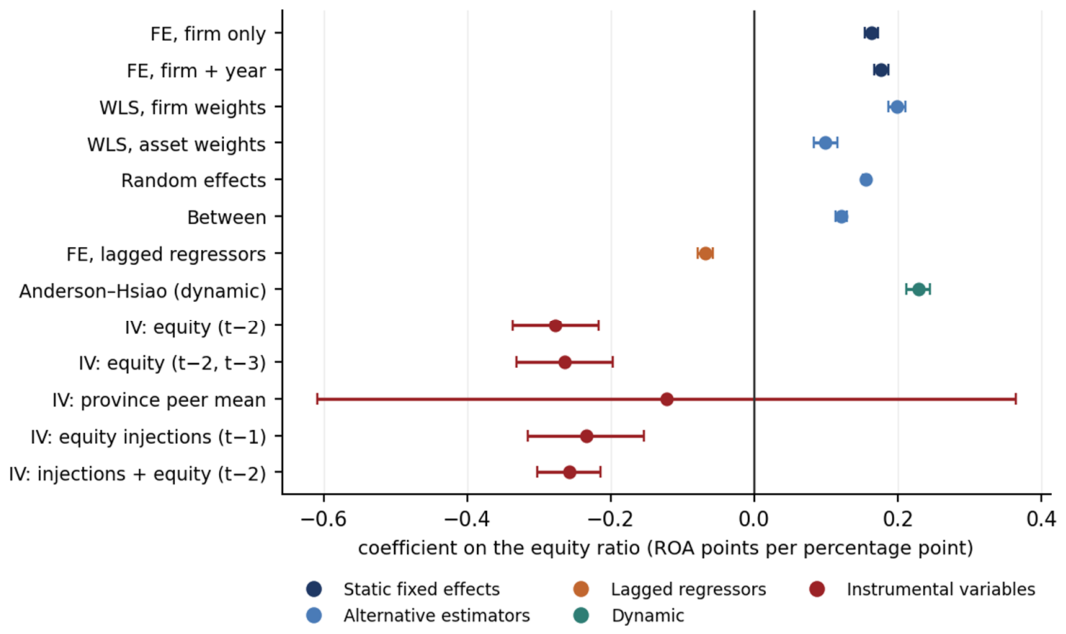
Figure 5.
Coefficients estimated separately by regulatory regime.
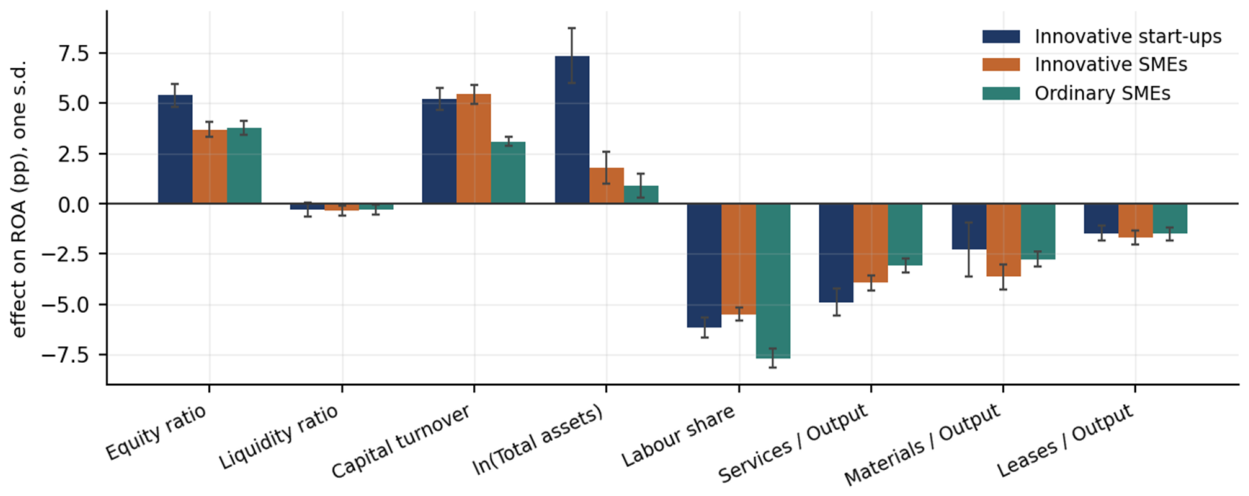
Figure 6.
Cluster profiles, standardised means.
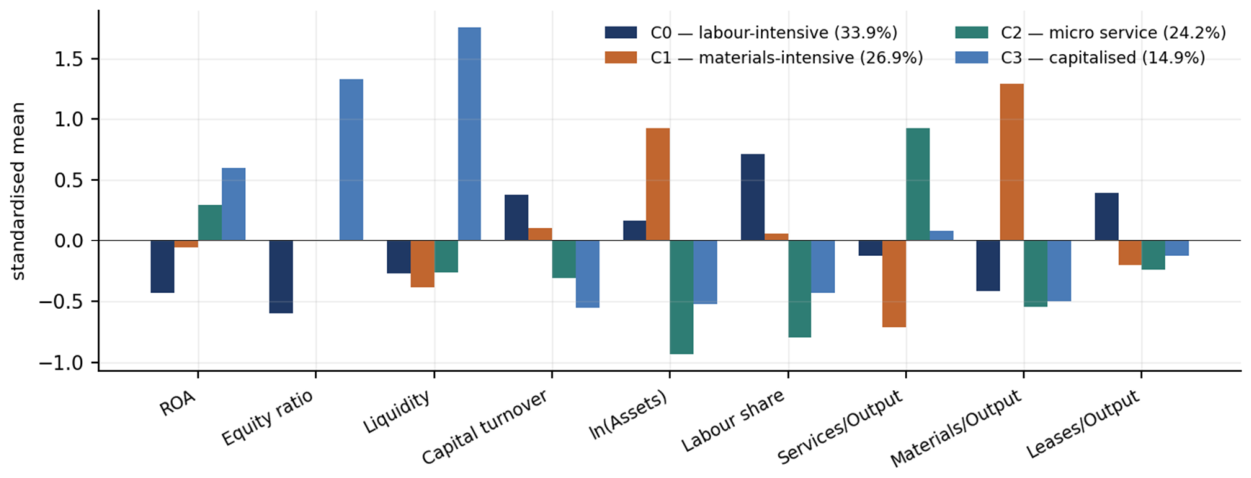
Figure 7.
Cluster composition by regulatory regime.
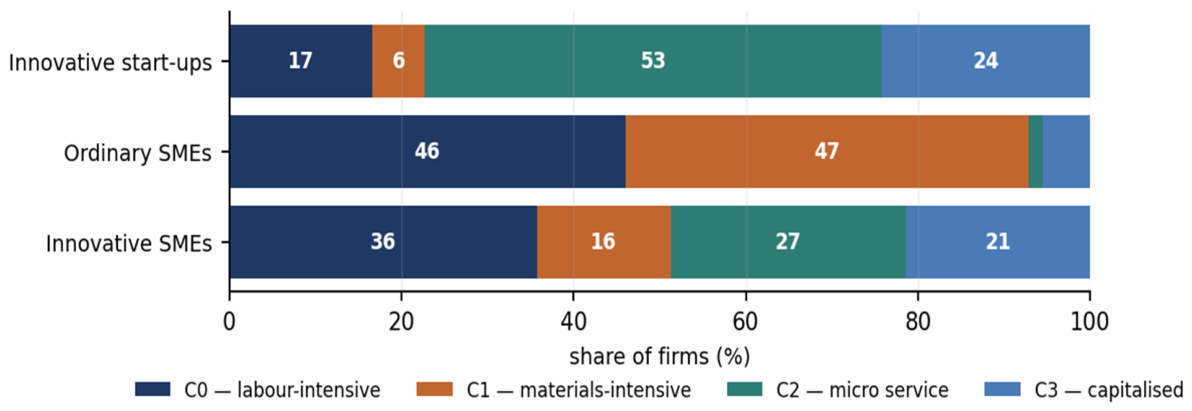
Figure 8.
Out-of-sample accuracy under three transformations.
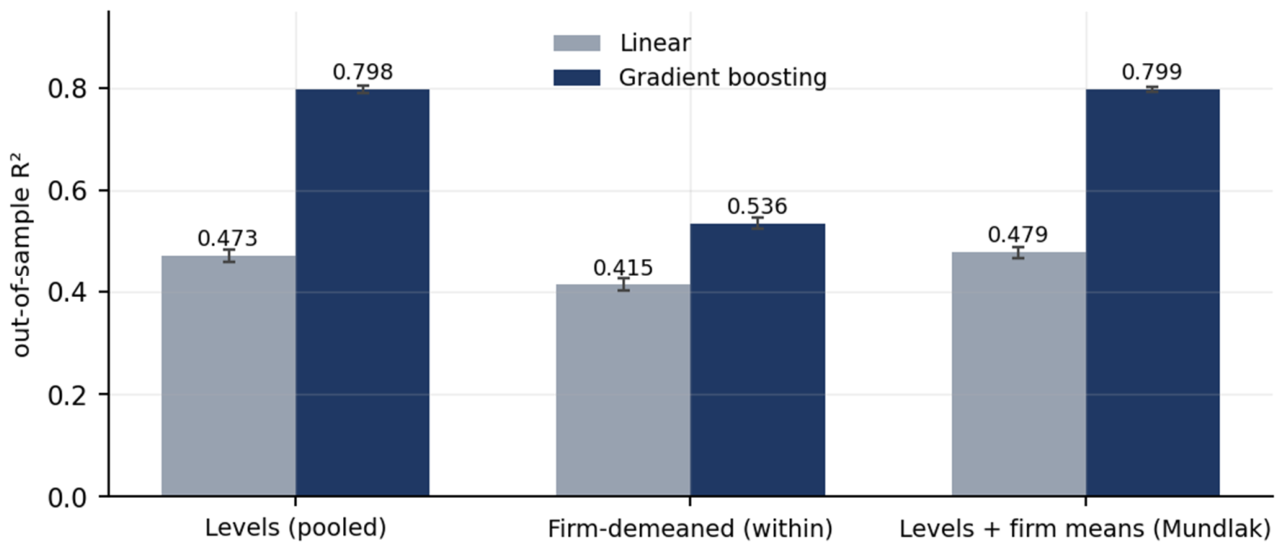
Figure 9.
Parametric enrichment against gradient boosting, firm-demeaned data.
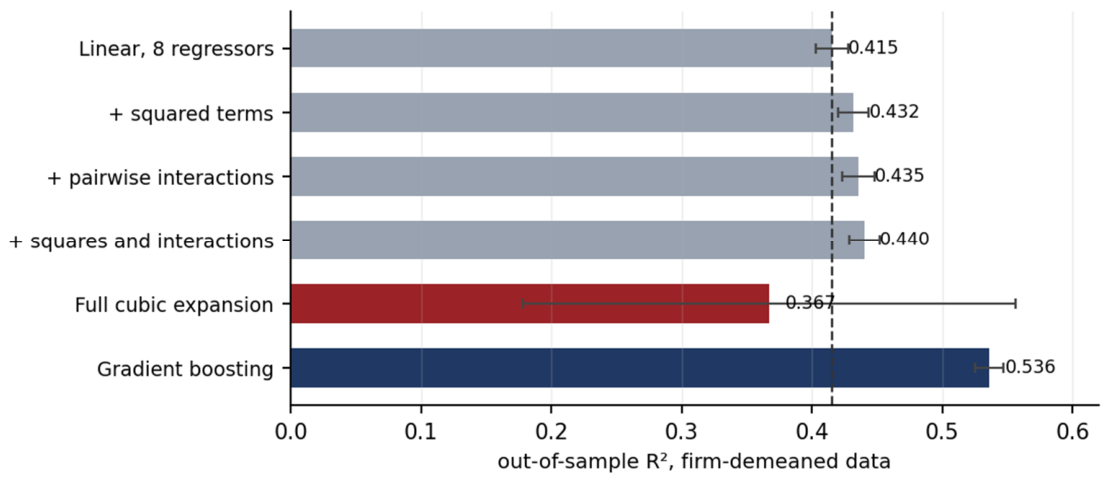
Figure 10.
Partial dependence, firm-demeaned data.
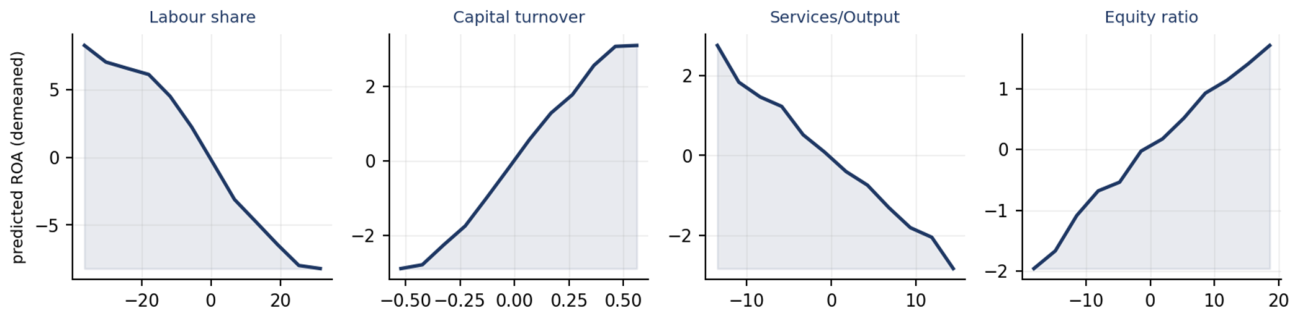
Figure 11.
Calibration by decile of realised profitability.
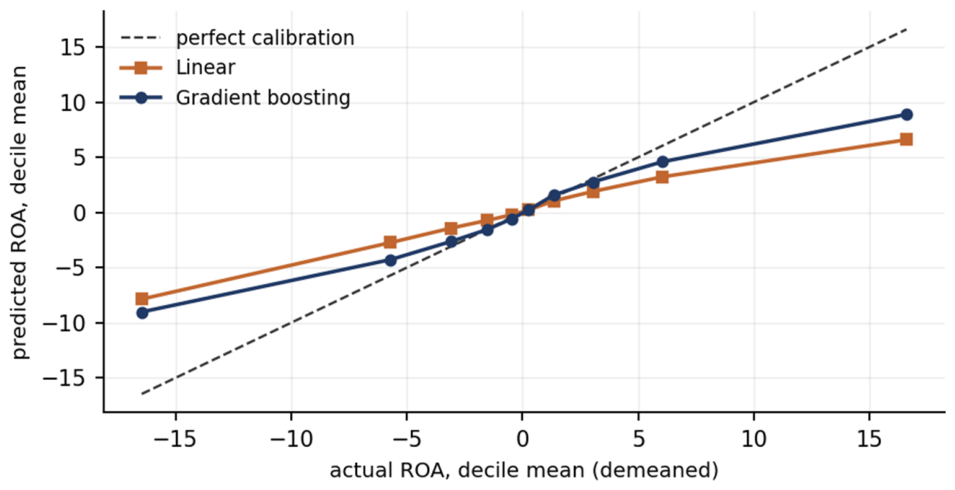
Table 1.
Research themes, representative studies, and contribution of this study.
| Research Theme | Representative Studies | Contribution of This Study |
|---|---|---|
| Capital structure and profitability | Abdalla et al., 2025; Adair & Adaskou, 2015; Agliardi et al., 2024; Agyei et al., 2020; Amini et al., 2021; Arhinful et al., 2025; Balios et al., 2016; Banga & Gupta, 2017; Boshnak, 2023; Bueno-Ferrer et al., 2026; Bui et al., 2021; Campello, 2006; D’Amato, 2019; Dalci, 2018; Duppati et al., 2023; Gnanaprasuna et al., 2025; Gutiérrez-Ponce, 2024; Kambi & Kasoga, 2024; Kenourgios et al., 2020; Mahmood et al., 2023; Mansour et al., 2023; Marozva, 2026; Miniaci & Panteghini, 2026; Mohamed Adnan et al., 2023; Nassim et al., 2025; Nguyen & Nguyen, 2026; Norkio, 2024; Oliveira et al., 2026; Pacheco & Carvalho, 2026; Pacheco & Tavares, 2017; Pham & Hrdý, 2023; Priyan et al., 2024; Qerimi et al., 2024; Rokhayati et al., 2019; Sewpersadh, 2019; Singh et al., 2025; Tons & Serrasqueiro, 2020; Udo et al., 2024; Vu Thi & Phung, 2021; Yazdanfar & Öhman, 2015 | Estimates the coefficient under thirteen specifications on 91,756 firm-year observations covering 14,913 firms. It moves from +0.18 under static fixed effects to −0.07 with lagged regressors, to +0.23 under Anderson–Hsiao, and to between −0.12 and −0.28 across five instrument sets, while the labour share holds between −0.115 and −0.147 throughout. The instability, not any single estimate, is reported as the result. |
| Endogeneity and identification | Abdalla et al., 2026; Adem & Dsouza, 2024; Ahmed et al., 2022; Alwadeai & Abideen, 2026; Amarhyouz & Azegagh, 2025; Belouadah et al., 2026; Bharati & Jia, 2018; Bhatia & Kumari, 2026; Camuffo & Poletto, 2024; Canarella & Miller, 2018; Chauhan et al., 2024; Choi et al., 2024; Dorsaf, 2025; Dsouza et al., 2025; Essel, 2025; Essel, 2026; Hamdouni, 2025; Iqbal et al., 2022; Islam et al., 2026; Jin et al., 2025; Li et al., 2025; Liu & Yaacob, 2025; Liu et al., 2025; Mansour et al., 2024; Nguyen & Nguyen, 2024; Novaković et al., 2025; Saiz-Sepulveda et al., 2026; Samal & Yadav, 2025; Sari et al., 2026; Shahrour et al., 2021; Shakri et al., 2025; Shu et al., 2023; Tinungki et al., 2022; Wang et al., 2026; Youssef et al., 2023; Yu et al., 2026; Zhu et al., 2022; Zhu et al., 2025 | Reports all five instrument sets with first-stage F and Hansen J. The overidentified specification on lagged instruments rejects (J = 77.18, p < 0.001). The one instrument with a defensible exclusion restriction—net external equity injections—has a within-firm correlation of 0.103 with the regressor, amplifying any violation of exclusion roughly tenfold. Concludes that no valid instrument exists in these data. |
| Profit persistence and dynamics | Agliardi et al., 2026; Bartoloni & Baussola, 2009; Bhangu, 2020; Demirgüneş, 2015; Desai et al., 2020; Eklund & Lappi, 2019; Fairfield et al., 2009; Glen et al., 2001; Goddard et al., 2006; Hirsch & Gschwandtner, 2013; Hirsch & Hartmann, 2014; Hirsch et al., 2021; Jaisinghani & Sekhon, 2022; Lazzarini et al., 2013; Liu et al., 2018; Maury, 2018; Okofo-Dartey, 2025; Opstad et al., 2022; Wibbens, 2019; Wu & Jiang, 2026; Yadav et al., 2017 | Estimates an autoregressive coefficient of 0.271 (Anderson–Hsiao, first-stage F = 18,230) and uses it to diagnose why lagged instruments fail: equity at t−2 mechanically embeds profit at t−2, which predicts profit at t through persistence alone. The mechanism of instrument failure is identified rather than assumed. |
| Innovative firms and policy | Accetturo, 2022; Agstner, 2024; Aiello et al., 2024; Albanese & Bronzini, 2026; Anderloni & Harasheh, 2025; Antenozio et al., 2026; Antonietti & Gambarotto, 2020; Banfi et al., 2024; Barboza & Braga, 2025; Barboza & Capocchi, 2020; Barboza & Pede, 2024; Barboza et al., 2023; Baroncelli et al., 2024; Biancalani et al., 2022; Bonfanti et al., 2026; Bottai et al., 2024; Caselli et al., 2019; Cavallo et al., 2020; Cavallo et al., 2021; Centobelli et al., 2022; Colombelli & Tubiana, 2025; Colombelli et al., 2023; Colombelli et al., 2025; Colombelli et al., 2026; Del Bosco et al., 2021; Dvouletý & Blažková, 2019; Dvouletý et al., 2019; Ferrucci et al., 2021; Galli, 2024; Giraudo et al., 2019; Giuliani et al., 2024; Hahn et al., 2019; Innocenti & Zampi, 2019; Lukeš et al., 2019; Manaresi et al., 2021; Manelli et al., 2022; Marra et al., 2022; Matricano, 2020; Matricano, 2022; Matricano, 2024; Modina et al., 2024; Onesti et al., 2022; Santoleri & Russo, 2025; Scandurra et al., 2025; Schifilliti & La Rocca, 2024; Sciarelli et al., 2022; Serio et al., 2020; Thys et al., 2025 | Tests whether the structure of profitability determination differs across the three regulatory populations. Wald statistics of 87.18 (start-ups vs innovative SMEs), 181.94 (start-ups vs ordinary SMEs) and 138.08 (the two SME categories) on eight degrees of freedom reject a common coefficient vector, so the presumed mechanism varies across the populations the schemes themselves define. |
| Firm taxonomies and clustering | Amit et al., 2025; Antunes Marante et al., 2025; Ayadi et al., 2021; Chu et al., 2014; Dhandio et al., 2025; Kotipalli & Aggarwal, 2026; Musile Tanzi et al., 2018; Nadhilah & Sudrajad, 2022; Panchal & Krishnamoorthy, 2020; Pieroni et al., 2020; Promsa-Ad & Kittiphattanabawon, 2024; Psaraftis & Kontovas, 2013; Sharma et al., 2026; Shpak et al., 2023; Siddiqui & Rivera, 2024; Uddin et al., 2024; Zarutska et al., 2022; Zarutska et al., 2024 | Evaluates thirty-one configurations across six algorithm families on eleven validity criteria and selects by composite rank rather than by any single index, verifying stability across fifty bootstrap resamples (mean ARI 0.938). Recovers four interpretable groups—labour-intensive, materials-intensive, micro-service and capitalised—and re-estimates the equation within each; pairwise Wald tests reject equality for all six pairs, with statistics between 84.45 and 374.34. |
| Machine learning in firm research | Ali & Alaskar, 2026; Ali & Naz, 2026; Ali, 2026; Antar et al., 2026; Aydogan, 2026; Badykova & Dinmukhametova, 2025; Batebi & Elnahas, 2026; Chowdhury et al., 2026; D’Amato et al., 2024; Han & Teng, 2026; Hibbeln et al., 2026; Jones, 2023; Lin & Lin, 2025; Liu et al., 2026; Malhotra, 2026; Manogna & Mishra, 2021; Mekelburg & Strauss, 2024; Romero Martínez et al., 2025; Shahana et al., 2026; Song & Han, 2026; Thompson, 2026; Xu et al., 2025; Yang et al., 2026; Yang, 2026; Zhang, 2026; Zhao et al., 2025; Zhao et al., 2026 | Fits thirteen algorithms to the same firm-demeaned data as the panel estimator, with five-fold cross-validation grouped by firm. The like-for-like ratio is 1.29 (0.415 against 0.536), rather than the 1.69 obtained on levels. Squared terms recover 13.7 per cent of the residual gap, pairwise interactions 16.7, both together 20.6, so roughly four fifths is local rather than polynomial structure. |
| Cost structure and profitability | Akgün & Günay, 2026; Bradfield et al., 2023; Canarella et al., 2013; Grau & Reig, 2021 | Places both blocks in one equation. The labour share carries a coefficient of −0.137 that is stable across specifications and across all four clusters (−0.132 to −0.140) and accounts for 63.5 per cent of out-of-sample predictive content, against 6.5 per cent for the equity ratio. Panel, clustering and machine learning converge on the same variable. |
Table 2.
Composition of the estimating sample.
| Population | Observations | Firms | Share of observations |
|---|---|---|---|
| Innovative start-ups | 12,864 | 5,173 | 14.0% |
| Innovative SMEs | 19,565 | 2,756 | 21.3% |
| Conventional SMEs | 59,327 | 6,995 | 64.7% |
| Total | 91,756 | 14,913 | 100.0% |
Note. Firm counts by population sum to slightly more than the total because eleven fiscal codes appear in two registers, having graduated from innovative start-up to innovative SME within the observation window; each is assigned to its earliest population in the estimating sample.
Table 3.
Two-way fixed effects. Dependent variable: ROA (%).
| Regressor | Coefficient | s.e. | Between | FE (firm only) |
|---|---|---|---|---|
| Equity ratio (%) | 0.1766*** | (0.0049) | 0.1210*** | 0.1629*** |
| Liquidity ratio | -0.2474*** | (0.0597) | 0.4492*** | -0.2263*** |
| Capital turnover | 5.2871*** | (0.1347) | 5.3101*** | 5.1750*** |
| ln(Total assets) | 0.6463*** | (0.1005) | -0.1359*** | -0.1997** |
| Labour cost / Value added (%) | -0.1365*** | (0.0026) | -0.1473*** | -0.1373*** |
| Purchased services / Output (%) | -0.1840*** | (0.0069) | -0.1184*** | -0.1806*** |
| Materials / Output (%) | -0.1143*** | (0.0130) | -0.0845*** | -0.1066*** |
| Leased assets / Output (%) | -0.2833*** | (0.0182) | -0.1481*** | -0.2869*** |
Note. Firm-clustered standard errors. Full comparison across five estimators in Appendix A, Table A1.
Table 4.
Cluster profiles, medians of the original variables.
| Variable | C0 labour | C1 materials | C2 micro service | C3 capitalised |
|---|---|---|---|---|
| ROA (%) | 3.03 | 4.72 | 7.36 | 10.23 |
| Equity ratio (%) | 17.29 | 33.22 | 34.71 | 70.10 |
| Liquidity ratio | 1.22 | 1.08 | 1.31 | 3.70 |
| Capital turnover | 1.23 | 1.03 | 0.69 | 0.59 |
| ln(Total assets) | 7.58 | 9.75 | 4.79 | 5.60 |
| Labour cost / Value added (%) | 89.63 | 67.55 | 0.63 | 35.23 |
| Purchased services / Output (%) | 29.94 | 18.88 | 57.35 | 34.94 |
| Materials / Output (%) | 3.04 | 47.43 | 0.81 | 0.82 |
| Leased assets / Output (%) | 3.69 | 1.95 | 0.68 | 1.15 |
| Firms | 5,067 | 4,023 | 3,615 | 2,224 |
| Share of sample (%) | 33.9 | 26.9 | 24.2 | 14.9 |
Table 5.
Equation re-estimated within each cluster (selected coefficients).
| Regressor | C0 labour | C1 materials | C2 micro service | C3 capitalised |
|---|---|---|---|---|
| Capital turnover | 3.0860*** (0.1742) | 5.9623*** (0.2216) | 7.8726*** (0.3498) | 13.1552*** (0.6774) |
| Labour cost / Value added (%) | -0.1403*** (0.0038) | -0.1317*** (0.0047) | -0.1347*** (0.0061) | -0.1383*** (0.0084) |
| Purchased services / Output (%) | -0.0980*** (0.0075) | -0.1510*** (0.0139) | -0.2475*** (0.0155) | -0.2852*** (0.0176) |
| Leased assets / Output (%) | -0.1909*** (0.0234) | -0.2800*** (0.0505) | -0.3051*** (0.0390) | -0.4937*** (0.0545) |
| Equity ratio (%) | 0.2314*** (0.0091) | 0.1015*** (0.0069) | 0.2002*** (0.0104) | 0.1280*** (0.0136) |
| Within R² | 0.4293 | 0.4955 | 0.4420 | 0.4759 |
Note. Two-way fixed effects, firm-clustered standard errors in parentheses.
Table 6.
Like-for-like comparison of linear and non-linear fits.
| Data transformation | Linear R² | SD | Gradient boosting R² | SD | Gap | Ratio |
|---|---|---|---|---|---|---|
| Levels (pooled) | 0.4730 | 0.0112 | 0.7978 | 0.0070 | 0.3248 | 1.69x |
| Firm-demeaned (within) | 0.4153 | 0.0126 | 0.5360 | 0.0107 | 0.1206 | 1.29x |
| Levels + firm means (Mundlak) | 0.4795 | 0.0116 | 0.7986 | 0.0054 | 0.3191 | 1.67x |
Table 7.
How much of the gap parametric terms recover.
| Specification | Terms | R² | SD | Gap closed (%) |
|---|---|---|---|---|
| Linear, 8 regressors | 8 | 0.4153 | 0.0126 | 0.0 |
| + squared terms | 16 | 0.4319 | 0.0116 | 13.7 |
| + pairwise interactions | 36 | 0.4355 | 0.0125 | 16.7 |
| + squares and interactions | 44 | 0.4401 | 0.0114 | 20.6 |
| Full cubic expansion | 164 | 0.3672 | 0.1890 | -39.9 |
| Gradient boosting | — | 0.5360 | 0.0107 | 100.0 |
Table 8.
Permutation importance, firm-demeaned data (five leading predictors).
| Predictor | Drop in R² | SD | Share of total (%) |
|---|---|---|---|
| Labour share | 0.6247 | 0.0132 | 63.5 |
| Capital turnover | 0.1309 | 0.0034 | 13.3 |
| Services / Output | 0.0946 | 0.0017 | 9.6 |
| Equity ratio | 0.0642 | 0.0010 | 6.5 |
| Materials / Output | 0.0257 | 0.0018 | 2.6 |
Table 9.
Theoretical positioning of the findings relative to the existing literature.
| Finding | Method | Anchor studies | Assessment | Relation to the literature | Contribution of this study |
| Negative association between leverage and profitability; positive coefficient on the equity ratio in static specifications | Panel, two-way FE | Adair & Adaskou, 2015; Balios et al., 2016; Dalci, 2018; D’Amato, 2019; Bui et al., 2021; Boshnak, 2023 | Confirmatory | Reproduces the modal result of the SME capital-structure literature in a population, and on a scale, not previously used. Establishes comparability rather than novelty. | Equity ratio +0.177 (s.e. 0.005) under two-way fixed effects on 91,756 firm-year observations covering 14,913 firms. |
| Profitability reverts to the mean at roughly 27 per cent per year | Anderson–Hsiao dynamic panel | Goddard et al., 2006; Bartoloni & Baussola, 2009; Hirsch & Gschwandtner, 2013; Eklund & Lappi, 2019 | In line | Extends a regularity established for mature firms to a population of young and certified enterprises, where faster reversion might have been expected but is not observed. | Autoregressive coefficient 0.271, first-stage F = 18,230. |
| The sign of the capitalisation coefficient changes across specifications and is not identified | Thirteen specifications; five instrument sets | Campello, 2006; Bharati & Jia, 2018; Kenourgios et al., 2020; Iqbal et al., 2022; Duppati et al., 2023 | Contrary | The literature treats the coefficient as estimable and disagreement as heterogeneity. The result reframes disagreement as non-identification, a claim the field has not entertained. | Moves from +0.18 to −0.07 to +0.23 and to between −0.12 and −0.28, while the labour share holds between −0.115 and −0.147 throughout. |
| Instrument failure is caused by profit persistence, not by weak relevance | Hansen J; first-stage diagnostics | Glen et al., 2001; Maury, 2018; Wibbens, 2019; Adem & Dsouza, 2024; Dsouza et al., 2025 | Original | Connects two literatures that develop in parallel: persistence implies serially correlated errors, which invalidates the internal instruments identification studies routinely use. | Hansen J = 77.18 (p < 0.001) on lagged instruments; the defensible instrument has a within-firm correlation of 0.103 with the regressor, amplifying any exclusion violation about tenfold. |
| Coefficient structure differs across the three regulatory populations | Wald tests on separate estimates | Caselli et al., 2019; Biancalani et al., 2022; Aiello et al., 2024; Anderloni & Harasheh, 2025; Albanese & Bronzini, 2026 | Contrary | Policy evaluations presume a shared financial-constraint mechanism and estimate average effects. The mechanism is shown to vary across the populations the scheme itself defines. | χ² = 87.18, 181.94 and 138.08 on eight degrees of freedom, all p < 10⁻⁴. |
| Four operating archetypes recovered from accounting data alone reproduce the regulatory classification | Composite-index clustering, bootstrap ARI | Chu et al., 2014; Musile Tanzi et al., 2018; Ayadi et al., 2021; Uddin et al., 2024; Amit et al., 2025 | In line | Consistent with the taxonomy literature in method, but extends it by re-estimating the substantive equation inside each group rather than describing the groups. | Thirty-one configurations on eleven validity indices, selected by composite rank; mean bootstrap ARI 0.938; Cramér’s V of 0.478 against the register. |
| The operating model dominates financial structure in explaining profitability | Panel, clustering and machine learning jointly | Canarella et al., 2013; Grau & Reig, 2021; Bradfield et al., 2023; Akgün & Günay, 2026 | Innovative | Cost structure and financing have not been placed in competition within one specification. Three independent methods converge on the labour share, which no prior firm-level study identifies as dominant. | Labour share 63.5 per cent of out-of-sample predictive content, capital turnover 13.3 and purchased services 9.6, against 6.5 for the equity ratio. |
| The labour-share coefficient is invariant across clusters while all others vary | Within-cluster re-estimation | Grau & Reig, 2021; Bradfield et al., 2023 | Original | Invariance across otherwise heterogeneous groups suggests a structural rather than compositional relationship, a property the literature has not tested for any cost variable. | Labour share between −0.132 and −0.140 across the four clusters; capital turnover varies from 3.09 to 13.16 over the same partition. |
| Comparing machine-learning and econometric fit requires the same variance decomposition | Firm-demeaned cross-validation | Manogna & Mishra, 2021; Jones, 2023; D’Amato et al., 2024; Mekelburg & Strauss, 2024 | Contrary | Applications routinely set a levels-based R² against a within-transformed R². Correcting the comparison reduces the apparent superiority of flexible learners from 1.69 to 1.29. | Linear 0.415 against boosting 0.536 on firm-demeaned data; 0.473 against 0.798 on levels. |
| The residual non-linearity is local rather than polynomial | Parametric enrichment against gradient boosting | Jones, 2023; Lin & Lin, 2025; Xu et al., 2025 | Innovative | Machine learning is used diagnostically rather than competitively: the shortfall of the linear model is characterised, not merely measured, which prediction-oriented studies do not attempt. | Squares recover 13.7 per cent of the gap, interactions 16.7, both together 20.6; a full cubic expansion performs worse than the original eight regressors. |
Note. Assessment categories: Confirmatory—reproduces an established result; In line—consistent with the literature and extends its domain; Original—establishes a connection or property not previously examined; Contrary—challenges a presumption the literature holds in common; Innovative—addresses a question the literature has not posed. All figures refer to the estimating sample of 91,756 firm-year observations described in Section 3.
Disclaimer/Publisher’s Note: The statements, opinions and data contained in all publications are solely those of the individual author(s) and contributor(s) and not of MDPI and/or the editor(s). MDPI and/or the editor(s) disclaim responsibility for any injury to people or property resulting from any ideas, methods, instructions or products referred to in the content. |
© 2026 by the authors. Licensee MDPI, Basel, Switzerland. This article is an open access article distributed under the terms and conditions of the Creative Commons Attribution (CC BY) license (http://creativecommons.org/licenses/by/4.0/).
Copyright: This open access article is published under a Creative Commons CC BY 4.0 license, which permit the free download, distribution, and reuse, provided that the author and preprint are cited in any reuse.