
Submitted:
29 August 2026
Posted:
31 August 2026
You are already at the latest version
Abstract
Background/Objectives: Sundowning syndrome—recurrent late-afternoon agitation, disorientation and anxiety in people with dementia—is widely attributed to disturbed light exposure. Existing accounts remain qualitative, specifying neither which property of the ambient light field changes nor when, and so yield no prediction varying with latitude, season or sky conditions. Methods: We combine standard solar geometry, an analytic clear-sky radiance model and measured photoreceptor spectral sensitivities to compute the spectral composition of the light reaching an observer as a continuous function of solar time, at three European latitudes. We track the rod- and cone-weighted components of the sky spectrum and locate their crossover. Results: The short-wavelength content of available light declines steadily through the afternoon, well before nightfall, while the long-wavelength component remains nearly constant. The crossover falls in the late afternoon, at a time set by latitude, geometry and turbidity, within the broad and variably reported onset window of sundowning. Conclusions: We propose that afternoon spectral reddening—rather than darkness itself—is a candidate physical cue for sundowning, possibly mediated by the diminished short-wavelength drive to melanopsin-expressing retinal ganglion cells, whose sensitivity peak lies within the depleted spectral region. The proposal yields testable predictions and implies that lighting interventions should be timed to local solar conditions rather than the clock.
Keywords:
sundowning syndrome
; Alzheimer’s disease
; dementia
; circadian rhythm
; daylight spectrum
; spectral reddening
; melanopsin
; ipRGC
; photoreceptors
; solar radiation
1. Introduction
Dementia is among the leading causes of disability in older adults, and the number of affected individuals continues to rise as life expectancy increases [1,2]. Alzheimer’s disease, first characterised by Alois Alzheimer in 1906, accounts for the majority of cases; its aetiology and treatment remain subjects of active debate [3,4,5].
Among the neuropsychiatric symptoms that accompany dementia, one of the most disruptive is sundowning syndrome (SS): a recurrent worsening of agitation, disorientation, anxiety and aggression that emerges in the late afternoon or early evening and typically subsides overnight [6]. Reported prevalence varies enormously between studies, from a few per cent to roughly two thirds, reflecting the absence of an agreed operational definition at least as much as real variation between populations [6,7]. At the low end, a study of 85 institutionalised patients using behavioural ratings collected every 15 minutes over three days classified only two individuals (2.4%) as sundowners, and concluded that sundowning as a discrete entity is uncommon, even though agitation showed a clear circadian component in most patients [8]. The symptom imposes a substantial burden on caregivers and is a frequent precipitant of institutionalisation [7]. Whether sundowning constitutes a discrete, time-locked entity or a nonspecific exacerbation of pre-existing agitation remains contested [9].
Several mechanisms have been proposed, including circadian disruption, degeneration of the suprachiasmatic nucleus, sensory and perceptual impairment, accumulated fatigue, and features of the institutional environment such as evening staff changeover [6,8]. Of these, the light-dependent hypothesis has received the most attention, motivated by the coincidence of symptom onset with the daily transition from day to night. The same hypothesis has motivated therapeutic trials of bright-light exposure, whose results have been mixed: benefits for selected circadian and cognitive outcomes have been reported [10], whereas a systematic review found insufficient evidence of benefit for agitation specifically [11].
That the spectral composition of daylight shifts towards long wavelengths as the Sun descends, and that melanopsin sensitivity may be tuned to this natural progression, has already been noted in the circadian literature [12]. We do not claim the observation as new. What has not been done, to our knowledge, is to compute the resulting time course quantitatively for a specified place and date, so that the idea yields predictions rather than a narrative. A common feature of the existing light-dependent proposals is precisely that they remain qualitative. They do not specify which property of the ambient light field changes, by how much, or at what time. Consequently they yield no prediction that varies with the observer’s latitude, the season, or the state of the sky—even though all three are determined by well-understood physics. If sundowning is cued by a change in natural light, its timing should be computable, and it should shift measurably between, for example, Berlin in December and Sicily in June.
In this paper we take that step. Combining standard solar geometry, an analytic clear-sky radiance model and measured photoreceptor spectral sensitivities, we compute the spectral composition of the light reaching an observer as a continuous function of solar time. Our central observation is that the short-wavelength content of available light begins to decline in the early afternoon—well before nightfall, and while the long-wavelength component remains nearly constant—so that the rod- and cone-weighted components of the sky spectrum cross in the late afternoon, within the window in which sundowning is clinically reported. We propose this progressive spectral reddening, rather than darkness as such, as a candidate physical cue, and we set out the predictions by which the proposal may be tested.
The everyday counterpart of this transition is familiar enough to have left traces in art: the association of dusk and late autumn with melancholy recurs across unrelated literary and musical traditions. We take this only as a motivating observation, not as evidence.
2. Results and Discussion
2.1. Definitions and Computed Quantities
The primary quantity we compute is the spectral radiance reaching an observer from a fixed direction of the sky, obtained from the analytic daylight model of Ref. [13] driven by the solar geometry of Section 3.1. Figure 1a shows the resulting spectrum for a representative time and location, together with its decomposition into the scattered components , and of the model and a Planck fit at K. We take the extraterrestrial reference spectrum from the NASA/ASTM E-490 archive. Throughout, we adopt a cloudless sky of turbidity ; climatological variability is not modelled.
From we form two spectrally weighted integrals,
where and are the scotopic and photopic spectral luminous efficiency functions, peaking at 507 nm and 555 nm respectively (Figure 1b), and we define the summed quantity
Both weighting functions are normalised to unit peak, so that and measure how much of the available light falls in the short- and long-wavelength regions of the visible range.
This choice matters for interpretation. The monotonic decline of through the afternoon is a property of the sky spectrum and is independent of how V and are scaled. The particular time at which R passes through unity is not: it depends on the normalisation convention, and would shift if the luminous efficacy constants lm W−1 and lm W−1 were applied instead. Nothing physiological occurs at . We therefore treat the crossover as a convenient marker of an underlying continuous trend rather than as a threshold, and we return to the consequences in Section 4.
It is important to be explicit about what these quantities are and are not. and are not the adaptation luminances of the rod and cone systems, and their relative magnitude does not indicate which photoreceptor class is mediating vision at a given moment. That question is settled by absolute luminance: cone-mediated (photopic) vision obtains above roughly 5 cd m−2 and rod-mediated (scotopic) vision below roughly cd m−2, with the mesopic range in between [17]. Outdoor illuminance in the late afternoon remains of order – lx, far above the mesopic ceiling, so the mesopic transition proper occurs during civil and nautical twilight and is correspondingly brief. The ratio
is instead a measure of spectral composition—closely related to the scotopic-to-photopic (S/P) ratio used in lighting engineering—and it is this quantity, not a change of visual regime, that our results concern. We return to the distinction in Section 4, since it delimits what the model can legitimately claim.
The relevant photoreceptor properties are summarised in Figure 1b and set out in full in Section 3.3 and Section 3.4. In brief, rods carry achromatic vision in dim light with peak sensitivity in the blue-green, cones carry chromatic vision and high acuity with peak sensitivity in the yellow-green, and a third class of photoreceptor—the melanopsin-expressing intrinsically photosensitive retinal ganglion cells (ipRGCs), with a melanopic action spectrum peaking near 490 nm—provides the principal photic input to the circadian pacemaker without contributing to image formation [14,15,16,18,19,20]. All three peaks lie at wavelengths that the atmosphere treats very differently as the Sun descends, which is the physical basis of what follows.
2.2. Evolution of the Sky Spectrum Through the Afternoon
Two effects govern the spectrum reaching a ground observer. First, Rayleigh scattering by atmospheric nitrogen and oxygen removes short wavelengths from the direct beam far more efficiently than long ones, redistributing them across the sky; this produces the blue of the daytime sky. As the solar zenith angle increases, the optical path through the atmosphere lengthens, short wavelengths are progressively scattered out of the line of sight, and the transmitted light becomes increasingly dominated by long wavelengths. Second, the Sun’s emission is well approximated by a blackbody at an effective temperature of about 5785 K, whose spectral radiance peaks in the blue-green and declines towards the red; this distribution was first accounted for by Planck’s radiation law [21,22].
Figure 2 shows the consequence for a mid-latitude site, Ankara ( N, E, altitude 938 m). The left panels render the simulated appearance of the sky at three times; the horizon reddens progressively while the zenith shifts from white-blue towards turquoise. The right panels show the corresponding together with , and .
The behaviour of the two weighted distributions differs markedly. Between 12:00 and 17:30 the short-wavelength weighted quantity falls by roughly a factor of two, whereas declines only modestly, so that the ordering of the two curves reverses: at 12:00 and 15:00 exceeds , while by 17:30 is the larger. In the language of Equation (3), falls through unity somewhere between the middle and lower panels. This is the spectral reddening referred to in the title, and it is well advanced before the sky becomes appreciably dark.
2.3. Timing of the Spectral Crossover Across Latitude
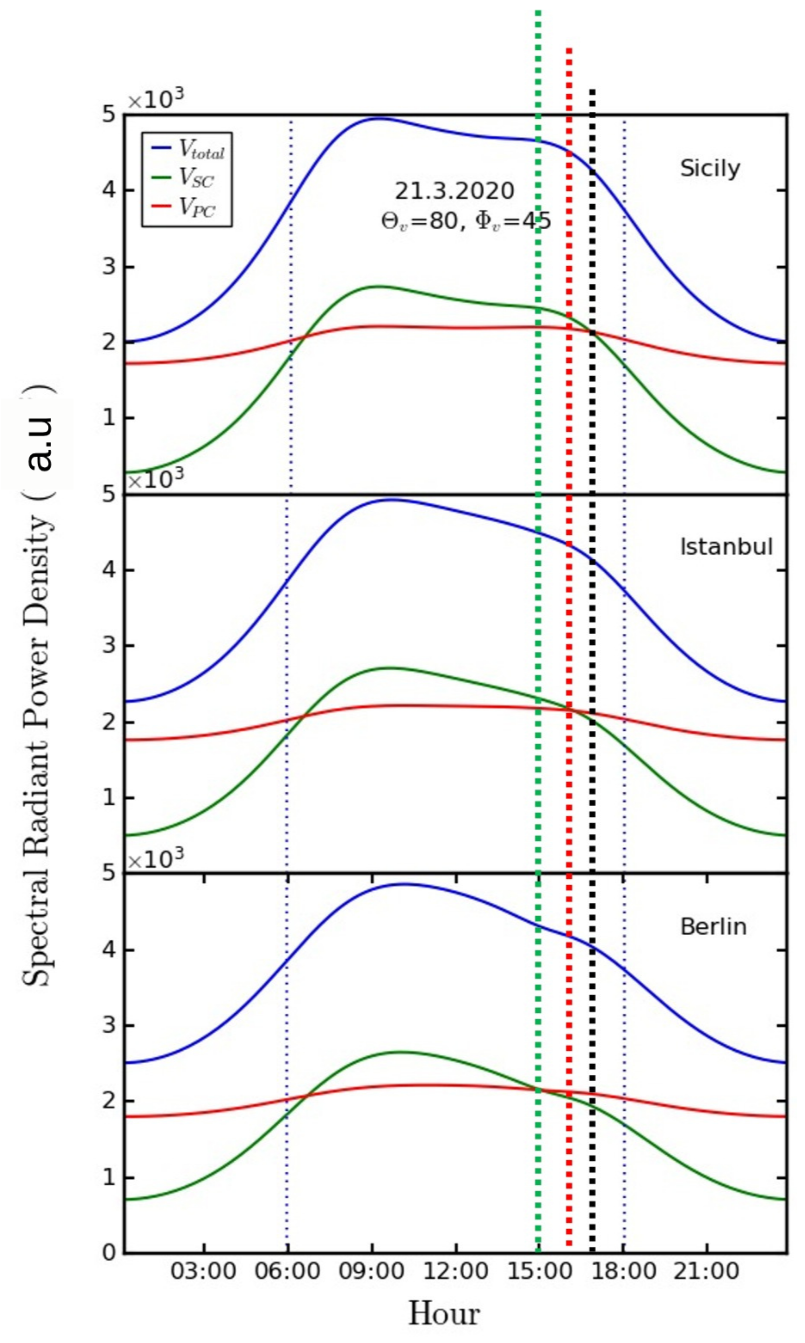
Figure 3 presents the main result: , and as continuous functions of local solar time on 21 March, for three European sites spanning about of latitude—Sicily, İstanbul and Berlin—at fixed viewing direction ( azimuth from south, elevation) and turbidity .
Three features are worth noting. First, is remarkably flat across the middle of the day: from mid-morning until the late afternoon, the long-wavelength content of the sky changes little. Second, is not flat. It peaks in the late morning and then declines steadily and monotonically through the afternoon, so that the short-wavelength content of available light is already substantially depleted hours before sunset. Third, and in consequence, the two curves cross in the late afternoon, several hours before the sky darkens and well before civil twilight.
The crossover time is not a universal constant. It is set by the solar geometry—and therefore by latitude, date and viewing direction—and by atmospheric turbidity, since increasing aerosol loading advances the depletion of short wavelengths. This is the sense in which the model is predictive: it assigns a computable time, specific to place and date, to a transition that the existing literature describes only as “late afternoon”.
We stress that the three panels of Figure 3 are computed for the March equinox, the one date on which the three sites have nearly equal day length; the latitude dependence is correspondingly compressed, and the panels are similar by construction. A systematic mapping of the crossover time over latitude and day of year is the natural next step and is discussed in Section 4.
2.4. Interpretation
The result invites a specific reading, and equally specifically rules out another.
What the calculation does not show is a change of visual regime. As set out above, absolute light levels in the late afternoon remain far too high for rod-mediated vision; the eye is firmly photopic at the crossover time, and no loss of colour discrimination or acuity of the kind associated with mesopic vision occurs at that hour. Any account of sundowning resting on a photopic-to-scotopic transition in the late afternoon is inconsistent with the photometry, and we do not advance one.
The calculation does show that the spectral content of the light available to the retina changes substantially and monotonically through the afternoon, with the short-wavelength component depleted while the long-wavelength component is nearly conserved.
This raises the question of which retinal pathway, if any, is sensitive to such a change. One candidate is the non-image-forming pathway. The melanopic action spectrum peaks near 490 nm [19,20,23], which lies within the spectral region that afternoon Rayleigh scattering preferentially removes from the line of sight, and the ipRGCs expressing it provide the principal photic input to the suprachiasmatic nucleus [24,25]. Based on peak position alone, one would expect melanopic irradiance to decline through the afternoon along with .
We emphasise that we have not computed this. The weighting functions in Equation (1) are the scotopic and photopic luminous efficiency functions, not the melanopic action spectrum of CIE S 026 [23]; the melanopic curve peaks some 17 nm to the short-wavelength side of and is not interchangeable with it. Quantifying the afternoon decline of melanopic equivalent daylight illuminance, and comparing it against the decline in total illuminance over the same hours, is a direct extension of the present calculation and is the first test we would propose (Section 4). Until that is done, the connection between the spectral crossover reported here and circadian photoreception is a conjecture suggested by the location of the melanopsin peak, not a result of this work.
Two further considerations, offered in the same spirit, would bear on whether this pathway could support an age- and disease-dependent effect. Ageing reduces the short-wavelength transmittance of the crystalline lens [26], and Alzheimer’s disease is associated with structural loss of ipRGCs and reduced retinal light sensitivity [27,28]. A patient population would therefore be operating with an already attenuated short-wavelength channel, on which the afternoon depletion of exactly those wavelengths would impose a further reduction. Whether the resulting signal falls below any threshold relevant to pacemaker stability is not known to us, and we are not aware of data that would settle it.
Alternative readings should be kept in view. The coincidence between the computed crossover and the reported onset window may be no more than that: both fall in the late afternoon, but so do a good many other things, including meals, staff changeover and the accumulated fatigue of the day (Section 4). A spectral cue is one hypothesis among several, and the present calculation does not discriminate between them.
We advance this as a hypothesis, not as a demonstrated mechanism. The model shows that a well-defined property of natural light changes by a computable amount at a computable time within the broad window in which sundowning is clinically reported [6]. It does not establish that this change causes the behaviour.
The agreement in timing is moreover coarse, and should not be overstated. Published onset estimates differ substantially between studies, and at least one actigraphic investigation reported a mean agitation acrophase of 14:38—appreciably earlier than the crossover computed here [8]. The clinical data are not currently precise or harmonised enough to constrain the model, and the qualitative form of the underlying argument is already present in the literature [12]; what the present calculation contributes is a specific time course rather than a new mechanism. What it offers, which qualitative light-based accounts have not, is a quantity that can be measured and a time that can be predicted—and therefore a proposal that can be shown to be wrong.
2.5. Clinical Implications
If the proposal is correct, the practical consequence concerns timing rather than intensity. Trials of bright-light therapy in dementia have generally administered light on fixed clock schedules, most often in the morning, and have reported inconsistent effects on agitation [10,11]. The present model suggests a different target: supplementation of the short-wavelength component during the afternoon hours in which it is naturally depleted, timed to the locally computed crossover rather than to the clock, and specified in melanopic rather than photopic units [23,29].
Such a protocol would differ from existing practice in three testable respects. It would be applied in the afternoon rather than the morning; it would be timed to solar rather than clock time, and would therefore shift across the year and differ between facilities at different latitudes; and it would be dosed to maintain melanopic equivalent daylight illuminance above a target threshold rather than to deliver a fixed photopic illuminance [29]. Whether any of this reduces agitation is an empirical question that the present work does not answer, but it is at least a question posed precisely enough to be settled.
3. Materials and Methods
The following subsections set out the formalism underlying the results of Section 2. We first summarise the standard astronomical description of solar position and extraterrestrial irradiance, then the radiometric treatment of atmospheric scattering and blackbody emission, and finally the photoreceptor properties and spectral sensitivity functions used to weight the computed sky spectrum.
3.1. Astronomy
In this subsection, we summarise the standard description of the apparent motion of the Sun, following the conventions of Ref. [30]. We begin with Earth’s rotation and the declination of its axis relative to the ecliptic plane. The declination angle is expressed by
where n is an integer number determining the day, starting from the 1st of January () and ending at the 31st of December (). We assume a year is 365 days long. The declination angle defines the seasons, while Earth’s rotation produces the daily cycle. To relate geographical position to time, solar time is introduced:
where is the standard time in hours, is the longitude of the standard-time meridian and the local longitude, both measured in degrees west of Greenwich, and is the equation of time in minutes, which accounts for the eccentricity of Earth’s orbit and the obliquity of the ecliptic. The factor 4 converts degrees of longitude into minutes of time. The equation of time is given by
where . A simpler expression depending on the eccentricity is given in Ref. [13]. The hour angle gives the corrected time independent of location:
taking values in the range , negative before solar noon. Next we find the position of the Sun from the sun altitude,
measuring the Sun’s altitude above the horizon, where is the local latitude. The solar azimuth is given as
which locates the Sun in the East–West direction. Because the inverse sine is restricted to , Equation (9) alone does not determine the quadrant of ; in our implementation the azimuth is resolved with the standard two-argument formulation, taking whenever . The solar zenith angle is the complement to of the solar altitude angle:
The hour angle at sunset (and sunrise) can be found by setting the zenith angle equal to :
and the length of day by
We now have to find the mean radiation coming from the Sun, which is a function of the distance from Earth to the Sun m, the radius of the Sun m, the temperature K and the Stefan–Boltzmann constant W m−2 K−4:
Since D depends on the day of the year, the mean value outside the atmosphere is
The extraterrestrial radiation at the surface tangent is
We compute the time-wise radiation by integrating between hour angles and , which yields
Here and are expressed in degrees and is an energy per unit area (J m−2) accumulated over the interval, not an instantaneous power density. Equations (4)–(16) follow the standard solar-geometry formulation of Ref. [30].
3.2. Electromagnetism and Quantum Theory
Rayleigh scattering is the elastic scattering of light by atmospheric molecules whose size is far smaller than the wavelength. The volume scattering coefficient obeys
so that short (blue) wavelengths are scattered an order of magnitude more efficiently than long (red) ones [22].
The spectral radiance emitted by a blackbody at wavelength is given by the Planck radiation law,
where h is Planck’s constant, is Boltzmann’s constant, c is the speed of light in vacuum, and K is the effective temperature of the solar photosphere [21,22]. has units of W m−2 sr−1 nm−1; the corresponding spectral exitance at the solar surface is , and the extraterrestrial spectral irradiance follows from the inverse-square dilution factor used in Equation (13).
3.3. Human Vision Physiology
Human vision is mediated by a hierarchically organised system extending from the retina to the primary visual cortex and beyond, in which parallel pathways encode luminance, chromatic contrast, spatial frequency and motion [31,32]. Humans are diurnal trichromats with a foveal specialisation for high spatial acuity; other species outperform humans under specific conditions, such as nocturnal or ultraviolet detection.
The retina contains two functionally distinct regions populated by photoreceptors: the fovea centralis at the optical centre, and the peripheral retina extending across the inner posterior surface of the eye. Two types of photoreceptors exist: scotopic cells (rods), which mediate dim-light, achromatic vision, and photopic cells (cones), which mediate colour vision and high visual acuity in bright light. The fovea is rich in photopic cone cells, and scotopic rod cells are mostly distributed in the extrafoveal retina [33].
Phototransduction at the molecular scale proceeds as follows. An incoming photon hits photopigments (rhodopsin in rods, photopsins in cones). The chromophore retinal absorbs a photon and undergoes an 11-cis to all-trans conformational isomerism, which initiates a biochemical cascade that hyperpolarises the membrane of the photoreceptor and transmits electrical signals to the downstream retinal circuitry and the optic nerve [34,35].
3.4. Photoreceptor Properties and Spectral Response
Scotopic and photopic cells have very different spectral sensitivities and operating light levels:
- Scotopic vision (rods): the scotopic luminous efficiency function peaks at nm (blue-green), which supports detection at low ambient light levels;
- Photopic vision (cones): the photopic luminous efficiency function peaks at the longer wavelength nm (yellow-green), close to the peak of the solar spectrum reaching Earth’s surface [36].
The progressive handover from cone- to rod-mediated detection as ambient luminance falls produces the Purkinje shift: the peak of the spectral luminous efficiency function moves from nm under photopic adaptation to nm under scotopic adaptation. Consequently, as twilight advances, red surfaces darken relative to blue-green surfaces of the same daytime luminance, and chromatic contrast collapses [37,38]. From an evolutionary point of view, human diurnal trichromacy is adapted to daylight, while scotopic sensitivity preserves spatial orientation under mesopic and scotopic conditions.
At the level of retinal processing, photoreceptor signals are split into parallel ON and OFF bipolar and retinal ganglion cell (RGC) pathways. ON-centre cells depolarise in response to light increments in their receptive-field centre, whereas OFF-centre cells depolarise in response to decrements [39,40]. This antagonistic centre–surround arrangement encodes local contrast rather than absolute intensity, which allows contrast to be signalled over many decades of ambient light level.
Human cones are specialised into three spectral subtypes in terms of photopic colour vision:
- 1.
- short-wavelength-sensitive (S/blue, nm);
- 2.
- middle-wavelength-sensitive (M/green, nm);
- 3.
- long-wavelength-sensitive (L/red, nm).
S cones constitute only about 5–10% of the cone population and are absent from the foveal centre, while the ratio of L to M cones varies widely between individuals—from roughly 1:1 to 4:1—with little corresponding variation in colour perception [41]. Evolutionary genetic studies suggest that dichromacy was the ancestral condition in catarrhine primates. The ancestral dichromacy shifted to trichromatic vision via an X-linked duplication of the opsin gene about 30 to 40 million years ago, producing the M and L opsins, which improved detection of ripe fruit and young foliage against green forest backgrounds [42,43,44].
3.5. Retinal Input to Circadian Pathways: Sundowning Syndrome and SAD
Retinal physiology also directly regulates internal biological timing (circadian rhythms) in addition to the classical image-forming vision mediated by rods and cones. This non-image-forming visual system is mediated by a third class of photoreceptors, intrinsically photosensitive retinal ganglion cells (ipRGCs), which express the photopigment melanopsin [19,20]. The melanopsin photopigment itself has nm; the melanopic action spectrum of CIE S 026, which incorporates prereceptoral filtering by the ocular media, peaks slightly longer at nm [23]. We use the latter value throughout, since it is the quantity relevant to light incident at the cornea.
The ipRGCs project directly to the hypothalamic suprachiasmatic nucleus (SCN) via the retinohypothalamic tract (RHT). The SCN is the master circadian pacemaker in mammals; its cell-autonomous timekeeping rests on a transcription–translation feedback loop whose molecular architecture is now understood in detail [45]. Pineal melatonin secretion and systemic circadian synchronisation are regulated by exposure to solar light, especially seasonal photoperiod variations [24,46].
Disruptions in this photic entrainment pathway have been implicated in circadian and mood disorders:
- 1.
- Seasonal affective disorder (SAD): reduced duration of ambient light during fall and winter seasons alters ipRGC-mediated signalling to the SCN, resulting in circadian phase delays, dysregulated melatonin clearance, and reduced serotonergic tone. Certain genetic variants of the human melanopsin gene (OPN4) have been associated with individual susceptibility to SAD [25,47,48].
- 2.
- Sundowning syndrome: a common feature of neurodegenerative diseases such as Alzheimer’s disease, sundowning is characterised by neuropsychiatric agitation and confusion emerging in the late afternoon or early evening. Loss of ipRGCs with age and neurodegeneration, and the consequent reduction in retinal light sensitivity [27,28], would reduce the photic drive reaching the SCN. Whether this is sufficient to destabilise the pacemaker during the afternoon decline in short-wavelength light described in Section 2 is the open question motivating the present work.
4. Limitations and Testable Predictions
The model presented here is deliberately minimal, and its assumptions restrict what we can conclude from it. We set these out explicitly, together with the observations that would confirm or refute the proposal.
4.1. Limitations of the Optical Model
The sky radiance is computed from the analytic daylight model of Ref. [13], which was developed for computer graphics rather than for atmospheric radiometry. It reproduces the angular and spectral structure of clear-sky luminance well, but it is not a radiative transfer calculation, and we have not validated its output against measured spectra.
Four further restrictions apply. First, we assume a cloudless sky with fixed turbidity ; cloud cover, aerosol variability, and local climate are not modelled, although all three substantially modify the spectral composition of daylight. Second, we evaluate radiance for a single fixed viewing direction, whereas a real observer integrates over a large solid angle that includes ground, buildings, and vegetation, each with its own spectral reflectance. Third, the results in Figure 3 are computed for the March equinox alone, the date on which the latitude dependence is smallest; a systematic mapping of the crossover time over latitude and day of year has not been performed and is required before any seasonal claim can be made. Fourth, and are reported in the normalisation of Equations (1) and (2) rather than in calibrated photometric units, so the figures should be read as showing the timing of the crossover rather than absolute levels.
A further limitation concerns the crossover itself. As set out in Section 2, the monotonic decline of is robust, but the time at which depends on the normalisation of the two weighting functions and carries no independent physiological meaning. Quantitative comparison with clinical onset times should therefore be made against the continuous trend, or against a threshold defined on a physiologically calibrated quantity, rather than against the crossover time reported here.
Most importantly, we have not computed any melanopic quantity. The interpretation offered in Section 2 rests on the position of the melanopsin sensitivity peak relative to the spectral region depleted by afternoon scattering, not on a calculation of melanopic irradiance. Repeating the analysis with the melanopic action spectrum of CIE S 026 [23], and expressing the result as melanopic equivalent daylight illuminance, is a direct extension of the present work and the first step we would take.
4.2. From the Sky to the Retina
The largest gap between this calculation and the clinical setting is that we compute the sky spectrum, whereas patients are predominantly indoors. Several factors intervene, and all of them act in the same direction, weakening the coupling between our computed quantity and the light actually reaching the retina.
Window glazing attenuates short wavelengths preferentially, so the indoor daylight spectrum is already reddened relative to the outdoor one, and the degree of attenuation depends on the glazing type. Window orientation and size determine which part of the sky contributes, and how much. Electric lighting adds a spectral component that is entirely decoupled from solar conditions and that, in most care settings, dominates by late afternoon. Finally, corneal irradiance depends on gaze direction, posture and position within the room, none of which is captured by a fixed viewing geometry.
A quantitative version of this argument would require an indoor coupling model—glazing transmittance, window orientation and area, room geometry, and the spectral power distribution and switching schedule of the electric lighting. Until that is done, the present calculation describes the light field available outdoors, and its relevance to an indoor patient population is an assumption rather than a result.
4.3. Confounds in the Clinical Observation
Even granting the optics, the timing coincidence admits other explanations. The late afternoon in a residential care facility is not only the period when daylight reddens; it is also when staff shifts change, when the evening meal is prepared and served, when staffing levels typically fall, and when the day’s accumulated cognitive fatigue is greatest. Any of these could produce a late-afternoon peak in agitation without reference to light at all.
Ascertainment is a further difficulty. Sundowning is largely identified from caregiver report, and caregiver observation is itself unevenly distributed across the day, which may bias the apparent timing of symptom onset. More fundamentally, whether sundowning is a discrete, time-locked phenomenon at all remains contested [9], and reported prevalence spans more than an order of magnitude across studies [6]. A model that predicts a specific time is of limited use if the phenomenon it predicts is not reliably time-locked in the first place.
The existing empirical picture is mixed, and includes findings that count against the present proposal. Martin et al., using behavioural ratings collected every 15 minutes over three days in 85 institutionalised patients, reported a mean agitation acrophase of 14:38, classified only 2.4% of the sample as sundowners, and—having examined seasonality directly—found no consistent seasonal pattern [8]. The last of these bears on Prediction 2 below. An ecological analysis of internet search activity found enquiries about sundowning to be roughly 11% higher on Sundays, when external caregiver support is least available, which is more readily explained by caregiver burden than by any optical effect; the same study, however, found search activity higher in winter, in less sunny states, and at more northerly latitudes, as a light-based account would predict [49]. Taken together, these results are consistent with sundowning having both an environmental-light component and a caregiver-related component, and they do not at present decide between them.
We have not attempted a quantitative comparison between our computed crossover times and published onset distributions. Such a comparison would require onset data recorded against local solar time, with harmonised instrumentation across sites—for example actigraphy or structured behavioural rating rather than caregiver recall—and we are not aware of a dataset that presently permits it.
4.4. Testable Predictions
The value of a quantitative proposal lies in its capacity to fail. The following predictions distinguish the present hypothesis from the alternatives above, and each is accessible with existing methods.
- 1.
- Onset should track solar time, not clock time. The transitions to and from daylight saving time provide a natural experiment: the clock shifts by one hour overnight while solar conditions are essentially unchanged. If sundowning is cued by the light field, symptom onset measured in clock time should shift by approximately one hour across the transition and remain fixed in solar time. If it is driven by institutional routine, which follows the clock, onset should remain fixed in clock time. This is the sharpest available discriminator between the two accounts, and it requires no new instrumentation.
- 2.
- Onset should shift seasonally, with an amplitude that increases with latitude. The crossover time moves through the year, and the annual excursion is larger at higher latitudes. Onset times recorded at a northern and a southern facility across a full year should therefore diverge in a specific, computable way. A null result—identical seasonal behaviour at both sites—would count against the hypothesis. The existing evidence is divided: one actigraphic study examined seasonality and found no consistent pattern [8], whereas geographic search-activity data show the latitude dependence a light-based account predicts [49]. The question is open rather than settled.
- 3.
- Overcast conditions should attenuate the effect. Cloud cover flattens the spectral evolution of daylight relative to the clear-sky case. If the spectral transition is the cue, its behavioural correlate should be weaker on overcast days, after controlling for total illuminance.
- 4.
- Indoor spectral conditions should modulate the effect. Facilities differing in window orientation, glazing transmittance and electric lighting spectrum should show correspondingly different onset timing. This prediction is the one most readily confounded, but also the one most directly relevant to intervention.
- 5.
- Melanopic irradiance should decline earlier and more steeply than photopic illuminance through the afternoon. This is a purely computational prediction, testable against the present model extended with the CIE S 026 action spectrum [23], and verifiable directly with a calibrated spectroradiometer.
- 6.
- Short-wavelength supplementation timed to the local crossover should outperform fixed-schedule bright light. Existing trials have administered light on fixed clock schedules, predominantly in the morning, with inconsistent effects on agitation [10,11]. The present model predicts that afternoon supplementation, timed to local solar conditions and dosed in melanopic equivalent daylight illuminance [29], should be more effective. A trial finding no difference between solar-timed and clock-timed protocols would substantially weaken the proposal.
Prediction 1 is the decisive one. If symptom onset follows the clock rather than the Sun across a daylight saving transition, the hypothesis advanced here is wrong, and the late-afternoon timing of sundowning is better explained by the structure of the institutional day than by the structure of the atmosphere.
5. Conclusions
We have presented a quantitative model linking solar geometry and atmospheric scattering to the spectral composition of the light available to a ground observer, and have used it to characterise how that composition evolves through the afternoon.
The principal result is that the short-wavelength and long-wavelength content of daylight do not decline together. The long-wavelength component is nearly constant across the middle of the day, whereas the short-wavelength component falls steadily from the late morning onward, so that the rod- and cone-weighted measures of the sky spectrum cross in the late afternoon—hours before sunset, and well before absolute light levels approach the mesopic range. The crossover time is not universal: it is set by latitude, date, viewing geometry and atmospheric turbidity, and is therefore computable for a given place and day.
We advance the resulting proposal carefully. The model establishes that a well-defined property of natural light changes substantially, and at a computable time that falls within the window in which sundowning is clinically reported. It does not establish a causal link. In particular, we have not computed any melanopic quantity, so the suggestion that this spectral change acts through the short-wavelength drive to melanopsin-expressing retinal ganglion cells rests on the position of the melanopsin sensitivity peak relative to the depleted spectral region, and not on a calculation we have performed. Nor does the model address the coupling between the outdoor light field and the indoor environment in which patients actually live, or exclude the institutional and behavioural confounds that share the same time of day. Nor is the existing clinical evidence unanimous: seasonality has been examined and not found in at least one actigraphic study, while geographic data on help-seeking do show the latitude dependence a light-based account predicts. These limitations and tensions are set out in Section 4.
We explicitly do not claim that a photopic-to-scotopic transition occurs at the hours in question. Outdoor illuminance in the late afternoon remains far above the mesopic range, and any account of sundowning resting on a change of visual regime at that time is inconsistent with the photometry.
What the present approach offers, and what qualitative light-based accounts of sundowning have lacked, is a specified quantity and a predicted time. That is enough to generate predictions capable of failing—most sharply, that symptom onset should follow solar rather than clock time across a daylight saving transition. Should that test come out the other way, the hypothesis advanced here would be refuted, which we regard as its principal merit.
Author Contributions
Conceptualisation, A.S.; methodology, E.C.A. and A.S.; software and formal analysis, E.C.A.; visualisation, E.C.A.; writing—original draft, E.C.A. and A.S.; writing—review and editing, E.C.A. and A.S.; supervision, A.S. All authors have read and agreed to the published version of the manuscript.
Funding
This research received no external funding.
Institutional Review Board Statement
Not applicable.
Informed Consent Statement
Not applicable.
Data Availability Statement
Acknowledgments
A.S. thanks the management of the Vocational School and also collaborators from the engineering and natural sciences faculty.
Conflicts of Interest
The authors declare no conflicts of interest.
References
- OECD. Elderly Population (Indicator); OECD Publishing: Paris, France, 2020. [CrossRef]
- World Health Organization. Dementia: Fact Sheet; WHO: Geneva, Switzerland, 2017.
- National Institutes of Health. Alzheimer’s Disease Fact Sheet; National Institute on Aging: Bethesda, MD, USA, 2019.
- Burns, A.; Iliffe, S. Alzheimer’s disease. BMJ 2009, 338, b158. [CrossRef]
- Larson, E.B.; Yaffe, K.; Langa, K.M. New insights into the dementia epidemic. N. Engl. J. Med. 2013, 369, 2275–2277.
- Khachiyants, N.; Trinkle, D.; Son, S.J.; Kim, K.Y. Sundown syndrome in persons with dementia: An update. Psychiatry Investig. 2011, 8, 275–287. [CrossRef]
- Gallagher-Thompson, D.; Brooks, J.O.; Bliwise, D.; Leader, J.; Yesavage, J.A. The relations among caregiver stress, “sundowning” symptoms, and cognitive decline in Alzheimer’s disease. J. Am. Geriatr. Soc. 1992, 40, 807–810. [CrossRef]
- Martin, J.; Shochat, T.; Marler, M.; Ancoli-Israel, S. Circadian rhythms of agitation in institutionalized patients with Alzheimer’s disease. Chronobiol. Int. 2000, 17, 405–418.
- Cohen-Mansfield, J.; Watson, V.; Meade, W.; Gordon, M.; Leeks, D.; Lawson, M.; Taylor, L. Does sundowning occur in residents of an Alzheimer’s unit? Int. J. Geriatr. Psychiatry 1989, 4, 293–298.
- Riemersma-van der Lek, R.F.; Swaab, D.F.; Twisk, J.; Hol, E.M.; Hoogendijk, W.J.G.; Van Someren, E.J.W. Effect of bright light and melatonin on cognitive and noncognitive function in elderly residents of group care facilities: A randomized controlled trial. JAMA 2008, 299, 2642–2655. [CrossRef]
- Forbes, D.; Blake, C.M.; Thiessen, E.J.; Peacock, S.; Hawranik, P. Light therapy for improving cognition, activities of daily living, sleep, challenging behaviour, and psychiatric disturbances in dementia. Cochrane Database Syst. Rev. 2014, 2, CD003946. https://doi.org/10.1002/14651858.CD003946.pub4. [CrossRef]
- Bedrosian, T.A.; Nelson, R.J. Timing of light exposure affects mood and brain circuits. Transl. Psychiatry 2017, 7, e1017. [CrossRef]
- Preetham, A.J.; Shirley, P.; Smits, B. A practical analytic model for daylight. In Proceedings of the 26th Annual Conference on Computer Graphics and Interactive Techniques (SIGGRAPH ’99), Los Angeles, CA, USA, 8–13 August 1999; pp. 91–100. [CrossRef]
- Kraft, T.W.; Schneeweis, D.M.; Schnapf, J.L. Visual transduction in human rod photoreceptors. J. Physiol. 1993, 464, 747–765. [CrossRef]
- Schnapf, J.L.; Kraft, T.W.; Baylor, D.A. Spectral sensitivity of human cone photoreceptors. Nature 1987, 325, 439–441. [CrossRef]
- Stockman, A.; MacLeod, D.I.A.; Johnson, N.E. Spectral sensitivities of the human cones. J. Opt. Soc. Am. A 1993, 10, 2491–2521.
- International Commission on Illumination. CIE 191:2010 Recommended System for Mesopic Photometry Based on Visual Performance; CIE: Vienna, Austria, 2010.
- Boynton, R.M. Human Color Vision; Holt, Rinehart and Winston: New York, NY, USA, 1979.
- Berson, D.M.; Dunn, F.A.; Takao, M. Phototransduction by retinal ganglion cells that set the circadian clock. Science 2002, 295, 1070–1073.
- Hattar, S.; Liao, H.W.; Takao, M.; Berson, D.M.; Yau, K.W. Melanopsin-containing retinal ganglion cells: Architecture, projections, and intrinsic photosensitivity. Science 2002, 295, 1065–1070.
- Planck, M. Ueber das Gesetz der Energieverteilung im Normalspectrum. Ann. Phys. 1901, 309, 553–563. [CrossRef]
- Bohren, C.F.; Clothiaux, E.E. Fundamentals of Atmospheric Radiation: An Introduction with 400 Problems; Wiley-VCH: Weinheim, Germany, 2006.
- International Commission on Illumination. CIE S 026/E:2018 System for Metrology of Optical Radiation for ipRGC-Influenced Responses to Light; CIE: Vienna, Austria, 2018. [CrossRef]
- Schmidt, T.M.; Chen, S.K.; Hattar, S. Intrinsically photosensitive retinal ganglion cells: Many subtypes, diverse functions. J. Physiol. 2011, 589, 2451–2458.
- LeGates, T.A.; Fernandez, D.C.; Hattar, S. Light as a central modulator of circadian rhythms, sleep and affect. Nat. Rev. Neurosci. 2014, 15, 443–454.
- Pokorny, J.; Smith, V.C.; Lutze, M. Aging of the human lens. Appl. Opt. 1987, 26, 1437–1440. [CrossRef]
- Lax, P.; Ortuño-Lizarán, I.; Gómez-Vicente, V.; Esquiva, G.; Cuenca, N. Photosensitive melanopsin-containing retinal ganglion cells in health and disease: Implications for circadian rhythms. Int. J. Mol. Sci. 2019, 20, 3164.
- La Morgia, C.; Ross-Cisneros, F.N.; Sadun, A.A.; Carelli, V. Retinal ganglion cells and circadian rhythms in Alzheimer’s disease, Parkinson’s disease, and beyond. Front. Neurol. 2017, 8, 162. [CrossRef]
- Brown, T.M.; Brainard, G.C.; Cajochen, C.; Czeisler, C.A.; Hanifin, J.P.; Lockley, S.W.; Lucas, R.J.; Münch, M.; O’Hagan, J.B.; Peirson, S.N.; et al. Recommendations for daytime, evening, and nighttime indoor light exposure to best support physiology, sleep, and wakefulness in healthy adults. PLoS Biol. 2022, 20, e3001571. [CrossRef]
- Duffie, J.A.; Beckman, W.A. Solar Engineering of Thermal Processes, 4th ed.; Wiley: Hoboken, NJ, USA, 2013.
- Hubel, D.H.; Wiesel, T.N. Ferrier lecture: Functional architecture of macaque monkey visual cortex. Proc. R. Soc. Lond. B 1977, 198, 1–59.
- Van Essen, D.C.; Anderson, C.H.; Felleman, D.J. Information processing in the primate visual system: An integrated systems perspective. Science 1992, 255, 419–423.
- Curcio, C.A.; Sloan, K.R.; Kalina, R.E.; Hendrickson, A.E. Human photoreceptor topography. J. Comp. Neurol. 1990, 292, 497–523.
- Pugh, E.N.; Lamb, T.D. Amplification and kinetics of the activation steps in phototransduction. Biochim. Biophys. Acta 1993, 1141, 111–149.
- Baylor, D.A. How photons start vision. Proc. Natl. Acad. Sci. USA 1996, 93, 560–565.
- Stockman, A.; Sharpe, L.T. The spectral sensitivities of the middle- and long-wavelength-sensitive cones derived from measurements in observers of known genotype. Vision Res. 2000, 40, 1711–1737.
- Purkinje, J.E. Beobachtungen und Versuche zur Physiologie der Sinne; Reimer: Berlin, Germany, 1825.
- Lamb, T.D. Evolution of phototransduction, vertebrate photoreceptors and retina. Prog. Retin. Eye Res. 2013, 36, 52–119.
- Werblin, F.S.; Dowling, J.E. Organization of the retina of the mudpuppy, Necturus maculosus. II. Intracellular recording. J. Neurophysiol. 1969, 32, 339–355.
- Masland, R.H. The neuronal organization of the retina. Neuron 2012, 76, 266–280.
- Roorda, A.; Williams, D.R. The arrangement of the three cone classes in the living human eye. Nature 1999, 397, 520–522.
- Dulai, K.S.; von Dornum, M.; Mollon, J.D.; Hunt, D.M. The evolution of trichromatic color vision by opsin gene duplication in New World and Old World primates. Genome Res. 1999, 9, 629–638.
- Surridge, A.K.; Osorio, D.; Mundy, N.I. Evolution and selection of trichromatic vision in primates. Trends Ecol. Evol. 2003, 18, 198–205.
- Hunt, D.M.; Peichl, L.; Jacobs, G.H. The genetic and evolutionary bases of primate colour vision. Front. Ecol. Evol. 2017, 5, 34.
- Cao, X.; Yang, Y.; Selby, C.P.; Liu, Z.; Sancar, A. Molecular mechanism of the repressive phase of the mammalian circadian clock. Proc. Natl. Acad. Sci. USA 2021, 118, e2021174118. [CrossRef]
- Czeisler, C.A.; Duffy, J.F.; Shanahan, T.L.; Brown, E.N.; Mitchell, J.F.; Rimmer, D.W.; Ronda, J.M.; Silva, E.J.; Allan, J.S.; Emens, J.S.; et al. Stability, precision, and near-24-hour period of the human circadian pacemaker. Science 1999, 284, 2177–2181.
- Roecklein, K.A.; Rohan, K.J.; Duncan, W.C.; Rollag, M.D.; Rosenthal, N.E.; Lipsky, R.H.; Provencio, I. Melanopsin gene variations interact with season to predict sleep onset and chronotype. J. Biol. Rhythms 2009, 24, 411–423.
- Roecklein, K.A.; Rohan, K.J.; Duncan, W.C.; Rollag, M.D.; Rosenthal, N.E.; Lipsky, R.H.; Provencio, I. A missense variant (P10L) of the melanopsin (OPN4) gene in seasonal affective disorder. J. Affect. Disord. 2009, 114, 279–285. [CrossRef]
- Madden, K.M.; Feldman, B. Weekly, seasonal, and geographic patterns in health contemplations about sundown syndrome: An ecological correlational study. JMIR Aging 2019, 2, e13302. [CrossRef]
Figure 1.
(a) Sky spectral radiance at a given time and location (29 October 2023, Ankara, Turkey), including atmospheric scattering. , and are the scattered components of the daylight model of Ref. [13] and is the radiance reaching the observer; the dashed line is a fit to a Planck blackbody spectrum at K. (b) Normalised spectral sensitivity of the rod (magenta) and cone (blue—S, green—M, red—L) photoreceptors, after Refs. [14,15,16].
Figure 1.
(a) Sky spectral radiance at a given time and location (29 October 2023, Ankara, Turkey), including atmospheric scattering. , and are the scattered components of the daylight model of Ref. [13] and is the radiance reaching the observer; the dashed line is a fit to a Planck blackbody spectrum at K. (b) Normalised spectral sensitivity of the rod (magenta) and cone (blue—S, green—M, red—L) photoreceptors, after Refs. [14,15,16].
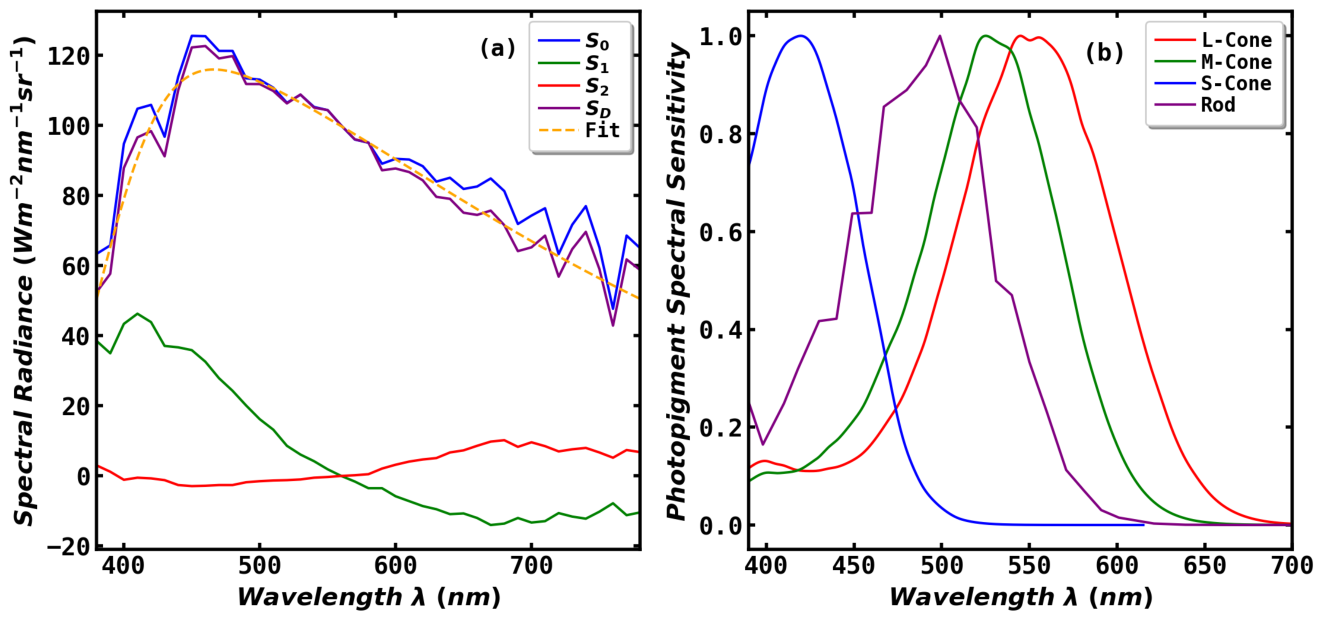
Figure 2.
(Left panels) Simulated appearance of the sky at Ankara at three times of day, rendered from the analytic daylight model of Ref. [13] for turbidity . (Right panels) Corresponding sky spectral radiance (red) together with the scotopically weighted (, yellow), photopically weighted (, green) and summed (, blue) distributions of Equations (1) and (2). Between 15:00 and 17:30 the ordering of and reverses.
Figure 2.
(Left panels) Simulated appearance of the sky at Ankara at three times of day, rendered from the analytic daylight model of Ref. [13] for turbidity . (Right panels) Corresponding sky spectral radiance (red) together with the scotopically weighted (, yellow), photopically weighted (, green) and summed (, blue) distributions of Equations (1) and (2). Between 15:00 and 17:30 the ordering of and reverses.
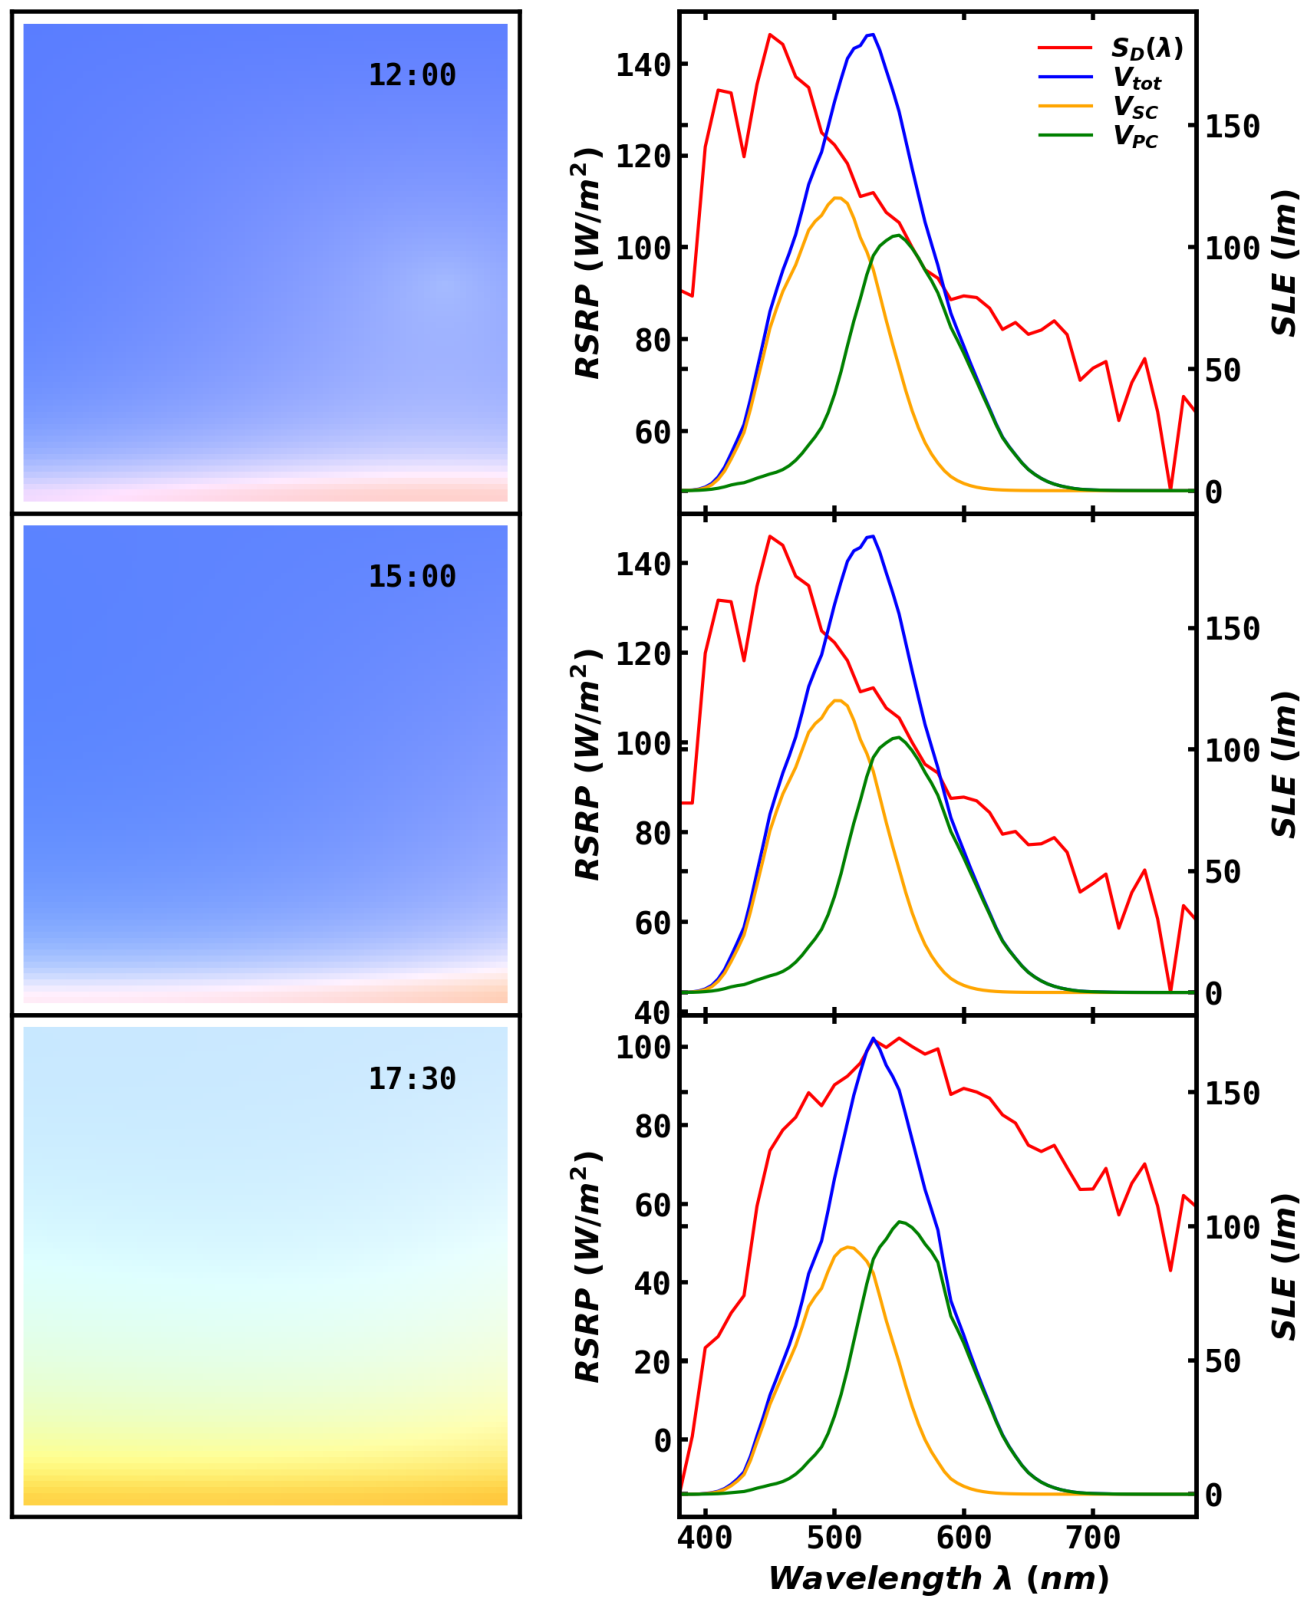
Figure 3.
Summed (, blue), scotopically weighted (, green) and photopically weighted (, red) sky radiance as a function of local solar time on 21 March 2020, for Sicily (upper panel), İstanbul (middle panel) and Berlin (lower panel), at fixed viewing direction (, ) and turbidity . Vertical dotted lines mark the computed crossover of and at each site. Ordinate values follow the normalisation of Equations (1) and (2) and are not calibrated radiometric power densities. Vertical dotted lines present the crossover between photopic and scotopic.
Figure 3.
Summed (, blue), scotopically weighted (, green) and photopically weighted (, red) sky radiance as a function of local solar time on 21 March 2020, for Sicily (upper panel), İstanbul (middle panel) and Berlin (lower panel), at fixed viewing direction (, ) and turbidity . Vertical dotted lines mark the computed crossover of and at each site. Ordinate values follow the normalisation of Equations (1) and (2) and are not calibrated radiometric power densities. Vertical dotted lines present the crossover between photopic and scotopic.
Disclaimer/Publisher’s Note: The statements, opinions and data contained in all publications are solely those of the individual author(s) and contributor(s) and not of MDPI and/or the editor(s). MDPI and/or the editor(s) disclaim responsibility for any injury to people or property resulting from any ideas, methods, instructions or products referred to in the content. |
© 2026 by the authors. Licensee MDPI, Basel, Switzerland. This article is an open access article distributed under the terms and conditions of the Creative Commons Attribution (CC BY) license (http://creativecommons.org/licenses/by/4.0/).
Copyright: This open access article is published under a Creative Commons CC BY 4.0 license, which permit the free download, distribution, and reuse, provided that the author and preprint are cited in any reuse.