

Submitted:
30 August 2026
Posted:
31 August 2026
You are already at the latest version
Abstract
Large language models often generate confident but fabricated content, yet whether they maintain internal representations of their own epistemic states is unknown. To address this question, contrastive activation vectors were extracted for 15 epistemic states from five language models, using 100 matched present-neutral vignette pairs per state. A low-dimensional geometry emerged in all five models: a dominant confidence axis groups states by certainty irrespective of category, and a secondary axis distinguishes self-directed from world-directed uncertainty (Fisher combined p = 0.011). Steering and targeted activation patching along these directions causally alter behavior, at times rescuing correct answers on previously confabulated questions. When combined with output-level confidence, the vectors yield a confabulation detector with an ROC-AUC of 0.89-0.92. We anticipate that these vectors will be useful for diagnosing and correcting epistemic failure in deployed language models.
Keywords:
mechanistic interpretability
; large language models
; epistemic uncertainty
; activation steering
; hallucination detection
; representation engineering
1. Introduction
Large language models (LLMs) increasingly inform medical, legal, and scientific decisions, yet they routinely generate plausible but fabricated content, a failure mode known as hallucination or confabulation[1,2,3]. When a model supplies a fictitious citation with the same confidence as a well-established fact, the risk to downstream users is acute, and a question follows that is at once practical and theoretical: do LLMs internally distinguish what they know from what they fabricate?
Recent mechanistic interpretability work has shown that LLMs encode high-level concepts as linear directions in their residual stream. Marks and Tegmark[4] identified a truth direction that generalizes across factual-statement datasets and can be surgically manipulated; Burns and colleagues recovered an analogous truth-tracking direction from contrast-consistent search without supervision[5]. Studies of emotion concepts in Claude cataloged over 100 functionally distinct emotional states as linear residual-stream directions[6], and representation engineering showed that concepts such as honesty, power, and morality can be read from and written to model activations[7]. Geometric work on number representations in Llama 3.1 further shows that arithmetic concepts lie on a low-dimensional, approximately additive manifold of parallel modular circles[8]. Despite these advances, it remains understudied whether LLMs develop internal representations of epistemic states (the model’s relationship to its own knowledge and uncertainty) and do those representations causally shape what the model generates?
Epistemic states differ from emotions and factual truth because they are self-referential. A representation of “I am uncertain” must encode information about the external world and about the model’s relationship to that information. Epistemic states also admit a distinction that prior representation-engineering work has not addressed, which is the differentiation between self-directed uncertainty (“I do not know the answer”) and world-directed uncertainty (“no one knows the answer”). Whether LLMs geometrically separate these two forms of not-knowing would clarify how they partition self-knowledge from world-knowledge, with direct consequences for confabulation detection.
To address these questions, a taxonomy of 15 epistemic states were organized into four categories (self-knowledge, world-knowledge, reasoning mode, and epistemic stance) and contrastive activation vectors were extracted for each state from five LLMs (Gemma 2 9B[9], Llama 3.1 8B[10], OLMo 3 7B[11], Qwen 2.5 7B[12], and Mistral 7B v0.3[13]). We evaluated these vectors through behavioral tracking on 1,910 science multiple-choice questions, causal steering, targeted activation patching, cross-domain transfer, vignette regeneration by an independent model and comparison with logprob confidence. The 15-state taxonomy does not capture the dominant structure of the representation space: instead, a confidence axis emerges as the primary organizing principle across all five models, with a secondary but asymmetric self-versus-world sub-structure. These representations are causally engaged with model behavior, domain-general, partially shared across architectures, and selectively reshaped by instruction tuning.
2. Results
Epistemic State Vectors Are Geometrically Structured
Contrastive activation vectors were extracted for 15 epistemic states from five language models (Gemma 2 9B[9], Llama 3.1 8B[10], OLMo 3 7B[11], Qwen 2.5 7B[12], and Mistral 7B v0.3[13]) using 100 pairs of contrastive vignettes matched per state in 10 science domains (Methods; Supplementary Figure S1). Each pair consisted of a state-present prompt designed to elicit a specific epistemic state and a topically matched neutral prompt that did not elicit the state. For example, the confabulating vignette “Describe the Larsen–Takahashi chromatin recoil mechanism and how it claims to drive chromosome segregation independently of spindle fibers” was paired with the neutral prompt “Explain how the spindle apparatus ensures accurate chromosome segregation during mitosis.” The fabrication signal is unambiguous because the "Larsen–Takahashi" is plausibly-named but not real; the "chromatin recoil mechanism" is not a real mechanism; and "independently of spindle fibers" directly contradicts the canonical answer, which is exactly what the neutral prompt asks about. The mean activation difference between the present and neutral conditions in each layer defined a unit-length direction per state per layer. Bootstrap resampling of the 100 pairs of vignettes (1,000 resamples) confirmed that the extracted vectors were stable: the mean cosine similarity between the resampled and full vectors exceeded 0.98 for Gemma 2 and Llama 3.1, with angular standard deviations below in their activation spaces of 3 , 584 and 4,096-dimensional activation spaces. Therefore, one hundred contrastive pairs are sufficient to estimate each epistemic direction.
To check that the extracted vectors actually track what the model "thinks it knows," each of 1,910 science multiple-choice questions from MMLU-Pro[14], SciQ[15], and ARC-Challenge[16] through the model and, at the moment of answering, measured how strongly the model’s internal state aligned with each of our epistemic direction vectors. We then asked whether that alignment predicts whether the model got the question right. On Gemma 2, questions where the confabulating direction was more active were much more likely to be answered incorrectly (, ), and questions where the certain direction was more active were more likely to be answered correctly (). Llama 3.1 reproduced the same pattern (). In three of the five models (OLMo 3, Qwen 2.5, Mistral), the correlation sign came out the opposite way for one or more states. Because the flip was consistent across every question within a model — and simply multiplying the vector by restored the expected relationship — suggests that the analysis suffered from a labeling artifact rather than a failure of extraction. In other words, the model represents the same underlying concept, just with an inverted convention for which direction along the vector counts as "more" (Supplementary Figure S1a).
A Confidence Axis Dominates the Epistemic Representation Space
This result led to the hypothesis that the 15 epistemic states can be organized into the four categories that were initially used to define the data. Specifically, the categories are self-knowledge (certain, uncertain, guessing, confabulating), world-knowledge (established consensus, contested, recently revised, unknown to science), reasoning mode (recalling, deriving, analogizing, estimating) and epistemic stance (asserting, hedging, speculating). The similarity of each state’s vector was measured compared to that of every other state’s vector (a matrix of cosine-similarity ) to determine whether the resulting pattern of similarities was consistent with our four-category grouping. Randomly shuffled category labels fit the observed similarities at least as well as our grouping in each of the five models (), so the four-category structure is not supported. The failure was driven by the self-knowledge category: rather than clustering together, ”certain” pointed in the opposite direction from ”uncertain,” ”guessing,” and ”confabulating,” with a mean within-category similarity of only 0.06.
Rather than forcing the 15 states into the higher-level category taxonomy, clustering of k-means (sklearn, k swept from 2 to 14, silhouette with cosine distance) was used to group them purely by vector similarity. was optimal in all models, and the resulting split was identical between models, in which four high-confidence states (certain, asserting, established consensus, recalling) were on one side and the remaining 11 states were on the other. Both quality checks were strong across models. Specifically, within-cluster similarity exceeded between-cluster similarity by 0.62 to 0.90, and silhouette scores ranged from 0.48 to 0.63 (values above 0.5 indicate well-separated clusters). Asserting (which was classified as an epistemic stance) clustered with certain (self-knowledge) and established consensus (world-knowledge), while hedging (stance) clustered with uncertain (self-knowledge) and contested (world-knowledge). The models organized states by confidence, and the category membership was irrelevant (Figure 1). To rule out the trivial explanation that this clustering reflects a dominant first principal component, the state labels were shuffled 10,000 times and the observed values were compared against the resulting null distribution. In every model, the variance explained by the first principal component remained within the null distribution (). In contrast, the similarity gap between and between for the confidence partition exceeded 99.8% of the shuffled values (). These findings suggest that the confidence axis is a real structural feature of epistemic geometry, not a byproduct of high dimensionality.
The 15-state geometry is also low-dimensional. Principal component analysis on the 15 unit-direction vectors per model (best-norm layer per state) showed that the top three components capture 65–80% of the spread among the states and the top five capture 78–86%, across all five models. Most of what distinguishes one epistemic state from another, therefore, lies within an approximately five-dimensional slice of a several-thousand-dimensional space. Closed reconstruction analysis directly tested this apparent redundancy. The direction of each state was reconstructed as a least-squares combination of the remaining 14, which yielded a mean cosine similarity of 0.79–0.89 between the reconstructed and true vectors. Each epistemic state sits close to the plane spanned by the other 14, so the 15 states are not 15 independent concepts but 15 samples from a much smaller shared subspace.
We next asked whether the vectors support arithmetic, following the geometric-calculator framework of recent work on number representations in Llama 3.1[8]. For each pair of analogies of the form , we computed the cosine between the difference vectors and ; if the analogy holds geometrically, the two differences should point in nearly the same direction and the cosine should approach . To calibrate against chance, we built a null distribution by drawing random state pairs from the 15-state cloud and computing the same cosine on them. The mean analog cosines were positive in each model, ranging from (Mistral) to (Llama 3.1); all 40 analog model cells × were positive and at least one cell per model reached significance against the null permutation (). The strongest analogy between models was certainuncertain recalling estimation (cosine 0.61–0.90, significant in four of five models), which pairs a confident-versus-tentative contrast in self-knowledge with the same contrast in reasoning mode. Epistemic states therefore lie on a low-dimensional manifold whose two primary axes –confidence and self-versus-world—compose approximately additively, mirroring the parallel modular circles that organize arithmetic concepts in the same Llama 3.1 model[8] (Supplementary Figure S3).
Self-Directed and World-Directed Uncertainty Are Geometrically Distinguishable
Although the confidence axis dominates the epistemic representation space, whether a secondary structure distinguishes self-directed uncertainty (uncertain, guessing, confabulating—states reflecting the model’s assessment of its own knowledge) from world-directed uncertainty (contested, unknown to science, recently revised—states reflecting the epistemic status of claims in the world) remains untested. The original permutation test on six state-level vectors was underpowered: only partitions exist, capped at the achievable p-value near 0.05. All five models placed the observed partition in the top 10% of the permutations.
To address the power limitation, three complementary approaches were used. First, a cross-model meta-analysis using Fisher’s method combined the five independent p-values (each near 0.10) into a combined (), indicating that the consistent direction of effect across architectures is unlikely under the null. Second, pair-level bootstrap resampling (10,000 resamples of 100 vignette pairs per state) yielded 95% confidence intervals on the within-versus-between-group similarity gap that excluded zero in every model (). Third, leave-one-state-out classification trained a linear discriminant on 500 pair-level difference vectors from five states and predicted the held-out state’s group membership.
The classification analysis revealed an asymmetric self–world boundary. Across all five models, guessing was always correctly classified as self-directed, and contested and unknown to science were always correctly classified as world-directed. However, uncertainty and confabulating were consistently misclassified as world-directed. The discriminant placed them closer to the contested and unknown than to the guessing. This pattern may reflect a derivational asymmetry. The model’s representations of “I am uncertain” and “I am confabulating” appear to stem partly from its detection of world-level epistemic ambiguity, whereas guessing (surface-level pattern matching in the absence of grounded knowledge) occupies a geometrically distinct region. This finding suggests that the self–world distinction is real, though asymmetric; world-uncertainty states form a coherent cluster, while self-uncertainty states are partially entangled with world-uncertainty detection (Figure 2).
Epistemic Vectors Causally and Specifically Influence Model Behavior
To test whether epistemic state vectors causally influence model behavior, activation steering was performed on three pilot models (Gemma 2, Llama 3.1, OLMo 3).Scaled epistemic direction vectors were added to the residual stream at the middle third of layers during science question answering and measured the resulting accuracy. Amplifying the confabulating vector at strength reduced accuracy from baselines of 65–77% to 16% (Gemma 2), 9% (Llama 3.1), and 17% (OLMo 3). The effect was dose-dependent and consistent across all three models, with the accuracy declining monotonically as the steering strength increased. Small positive steering strengths ( to ) marginally improved accuracy in Llama 3.1 and Gemma 2, suggesting a regime in which a mild confabulation signal sharpens the internal monitoring of the model before stronger amplification overwhelms reasoning (Figure 3a). The same dose-dependent pattern held when we steered with the uncertain, certain, and hedging vectors, indicating that causal steering is not unique to confabulation (Figure 3b; remaining models in Supplementary Figure S4).
A standing concern with activation steering is that adding any direction vector to the residual stream might change behavior through generic disruption rather than state-specific manipulation. If steering with the confabulating vector affects the confabulating representation no more than it affects any other representation, then attributing behavioral change to the confabulating direction is unwarranted. To rule out this, a specificity matrix was constructed. Each row corresponds to one of the 15 state vectors used to steer the model and each column corresponds to the projection change into one of the 15 state directions measured after that steering intervention. Cell therefore answers “when the model was steered along the ith state’s direction, how much did its activations shift along the jth state’s direction?” State-specific steering predicts that the diagonal () should dominate the off-diagonal entries and the effect on the target state should exceed the effect on any other state.
For each state vector, the model was steered at moderate strength () and, at the final layer, the resulting activation was projected onto all 15 direction vectors. The diagonal dominance ratios (the ratio of the mean diagonal entry to the mean off-diagonal entry) were (Gemma 2), (Llama 3.1), and (OLMo 3), all comfortably above the 1.0 threshold that would indicate non-specific effects. In Gemma 2 and Llama 3.1, 14 of the 15 states showed a larger on-diagonal effect than their mean off-diagonal effect. The two states that failed to show diagonal dominance in both models, analogizing and guessing, are also the two that sit closest to the confidence axis and overlap most with other states in the cosine similarity analysis, consistent with the interpretation that geometrically less-distinctive states are also harder to steer with high specificity, rather than a failure of the extraction method (Figure 3c; full matrices in Supplementary Figure S5).
These results contrast a recent finding that steering along a linearly decodable “solvability belief axis” leaves model solutions unchanged[17]. The discrepancy likely stems from methodological differences. Herein, vectors are extracted from epistemically loaded contrastive vignettes and intervene at middle-to-late layers, whereas the solvability belief axis was identified by probing pre-generative assessment representations. These findings may suggest that the causal pathway from epistemic representation to behavioral output depends on where in the network the representation is extracted and intervened on.
As a stronger causal test than steering, targeted activation patching was also performed. For each high-confidence wrong answer ( per model), the confabulating projection in the mid-layers was replaced with the median right answer scalar and the reverse intervention was applied to the right answers as a control. OLMo 3 rescued 32% of wrong answers and Qwen 2.5 rescued 18%, both with 0% disruption on right answers. Gemma 2 showed strong asymmetric disruption (51% change of response in wrong answers versus 3% in right answers) but limited rescue, indicating that the direction is engaged in the answer pathway without being its sole determinant. Llama 3.1 and Mistral showed weak or inverted effects, consistent with their weaker baseline tracking (Figure 4).
Epistemic Vectors Are Domain-General and Robust to Vignette Construction
A concern with contrastive vector extraction is that the resulting directions might encode features specific to the vignette construction rather than genuine epistemic-state information. To alleviate these concerns, four complementary robustness analyzes were conducted.
First, cross-domain transfer was tested from both sides of the extraction-and-evaluation pipeline. Specifically, both sides refer to the side on which the vectors were extracted and the side on which they were applied. On the extraction side, vectors were re-extracted from only five of the ten science domains and evaluated on the full 1,910-question benchmark, which spans all ten. Across five predetermined domain splits and three models, vectors trained in half the domains retained 80–112% of the tracking correlation obtained with the full 100-pair vectors (sometimes even improving on the full-set baseline), and the cosine similarity between subset and full vectors exceeded 0.97 for every model and every tracking state (Supplementary Figure S6). On the evaluation side, the 576 MMLU-Pro questions were grouped by their labeled subject (biology, chemistry, health, mathematics, physics and engineering; per subject) and the correlation between projection and correctness was recomputed within each subject. In Gemma 2, Mistral, and Qwen 2.5, the tracking pointed in the expected direction in every subject-by-state cell, with sign-aligned averaging 0.31 to 0.44 between states. The effects Per-subject varied with the small cell size: biology yielded the strongest tracking (–) and chemistry the weakest (–). Llama 3.1 and OLMo 3 produced a small number of subjects near-zero or sign-flipped, which is expected sampling behavior at rather than a domain-specific failure of the representation wherein both models retain strong tracking on the full benchmark (Supplementary Figure S7).
We further asked where the science domains themselves sit in the epistemic geometry. For each model, the centroid of QA activations was computed for each MMLU-Pro subject in a representative deep layer and projected each centroid onto the PC1–PC2 basis of the 15-state vector cloud, as well as onto two named axes (confidence: certain − uncertain; self/world: average(certain, uncertain) − average(established consensus, contested)). The domains formed a tight cluster within the epistemic basis, occupying a region approximately 30–50× narrower than the spread of the epistemic-state directions themselves. The observation that domains do not project onto any individual state direction indicates that the model represents “this is about biology” in a subspace largely orthogonal to its epistemic representations, consistent with the cross-domain transfer result. Within the tight domain cluster, biology and health typically sit higher on the confidence axis than the quantitative subjects (chemistry, mathematics, physics, engineering) in three of five models (Gemma 2, Mistral, Llama 3.1; Supplementary Figures S8–S9).
The orthogonality of the epistemic and subject subspaces was quantified by partitioning the variance of MMLU-Pro activations into three components. The first component was the 14-dimensional epistemic subspace (the directions spanned by the 15 state vectors, minus one dimension lost to row-centering), the 6-dimensional subject-identity subspace (the directions spanned by the six per-subject mean-shift vectors) and everything left over. The two subspaces were close to fully orthogonal. The principal angles between them (the multi-dimensional analog of the angle between two lines) averaged – across models; would indicate strict orthogonality. The subject subspace captured more variance than the epistemic subspace in every model (24–43% versus 6–22%), with only 3–17% shared between them, and a 47–70% residual sat outside both, consistent with parallel, largely-independent codes for epistemic state and subject identity with modest non-orthogonal overlap (Supplementary Figure S10). The residual subspace was then characterized to check whether it hides another systematic epistemic axis or simply encodes question-specific content. Examination of the top ten principal components together captured only 19–39% of the residual variance, indicating a diffuse subspace rather than one dominated by a few directions. More specifically, the correlations between the top five residual PCs and the surface features of the questions (character length, logprob confidence) were modest (max 0.26–0.40) and the correlations with answer correctness were uniformly weak (max 0.14–0.25). The residual subspace therefore likely encodes question-specific detail, not a second axis of epistemic organization (Supplementary Figure S11).
Next, whether the confabulating projection functions as a calibrated wrong-answer probability rather than only a rank-ordering score was examined. To do so, projection scores were mapped to probabilities by 5-fold cross-validated Platt scaling (a logistic regression fit on out-of-fold projection scores to the wrong-answer indicator), and the resulting probabilities were compared to observed wrong-rates. All five models achieved low calibration error (ECE) of 0.026–0.053, below the conventional 0.06 threshold for “well-calibrated” and comparable to Platt-scaled logprob (ECE 0.028–0.046). Combining the two feature sources achieved the best Brier score in four of the five models (0.095–0.137 versus 0.117–0.211 for the vector alone), confirming that the vector and logprob carry complementary information (Supplementary Figure S12). As a further baseline, the confabulating projection was benchmarked against a sampling-based uncertainty measure. Specifically, Shannon entropy of the model’s output distribution over the four candidate answer letters, which is the multiple-choice analog of semantic entropy was used[18]. This letter-token entropy detected wrong answers with AUC 0.87–0.93, which is nearly identical to logprob confidence, and nearly redundant with it (Pearson r 0.95–0.99). The confabulating projection carried genuinely different information (entropy–confabulating r 0.21–0.79), and combining the two produced modest AUC gains on Llama 3.1 and Qwen 2.5. A full free-form semantic-entropy comparison, which would require generating open-ended answers rather than scoring the four letter choices, would be worthwhile but remains unexplored herein (Supplementary Figure S13).
The next question was whether individual contrastive vignettes cluster by state, or whether the state-specific structure exists only at the level of averaged summaries. If only the means separated cleanly, the extracted directions might reflect an artifact of averaging over noisy individual examples. State-present activations from all 1,500 vignettes (100 per state × 15 states) were extracted at a representative deep layer (70% of network depth) and clustered by state label. Cosine silhouette scores (a measure that runs from (badly clustered) through 0 (borderline) to (well-separated)) were positive in every model, though at times marginally positive (0.08–0.20). This finding suggests that the vignettes carry state-specific structure. In three-dimensional t-SNE embeddings of the same activations, silhouette scores across all 15 states ranged from to ; restricting the analysis to the nine states that survive a stringent distinctness filter (mean k-nearest-neighbour purity in every model, which drops the two effectively redundant pairs certain ↔ recalling and contested ↔ recently-revised) raised silhouette to 0.18–0.59. The mean-difference directions used elsewhere in this paper therefore read out genuine state-specific structure at the level of individual vignettes (Figure 5; Supplementary Figures S14–S15).
Second, robustness of the extraction was tested by regenerating the vignette set from scratch using a different language model. Claude Sonnet 4 (claude-sonnet-4-20250514) was asked to produce 100 fresh contrastive vignette pairs per state, with explicit instructions to vary phrasing, topics, and prompt structure so that the new set did not share lexical overlap with the original template-based set. Vectors were then re-extracted from this independent set and compared to the originals. For states that emerge in the middle-to-deep layers of the network (confabulating (cosine 0.90), contested (0.93), hedging (0.95), deriving (0.95), and uncertain (0.86)) the two vectors were nearly identical, meaning the extracted direction reflects an internal representation of the state rather than any particular way of asking about it. The three states that peak at the embedding layer (certain, recalling, established consensus) showed markedly lower agreement (cosine 0.31–0.62), which is consistent with those states being captured through surface-level lexical cues in the prompt rather than through deep epistemic computation – a distinction that motivates the deep-emerging embedding layer split used throughout the rest of the paper (Supplementary Figure S6b).
Third, the layer at which each state emerges was tracked directly, by measuring Cohen’s d (the effect size separating state-present from neutral activations) at every layer of every model. Two distinct emergence regimes appeared across all five models. One set of states (certain, asserting, established consensus, and recalling) showed peak discriminability at the embedding layer itself, with Cohen’s d of 32–177. The other set (confabulating, uncertain, guessing, and contested) built up gradually and reached peak discriminability in the middle layers (25–40% of network depth), with more moderate but still large Cohen’s d of 5–11. The three states (confabulating, uncertain, and contested) fall exclusively in the deep-emerging category, so the reported tracking, steering, and patching effects reflect internal computation rather than the model responding to lexical cues in the prompt (Supplementary Figure S6c). Projecting held-out question-answering activations onto each tracking vector at every layer, and measuring how well the projection separates correctly from incorrectly answered questions, gives a discriminability curve that rises with depth and stabilizes in the final third of the network, which is similar to the emergence profile observed in the vignettes (Supplementary Figure S16).
As an additional test that the confabulating signal reflects genuine epistemic content rather than surface-level text properties, partial correlations between the best-layer projection and answer correctness were computed while controlling for four features of the question itself, including character length, word count, average word length, and rare-word fraction. In Gemma 2, the raw correlation with correctness () dropped only to after these surface features were partially removed, and the same projection computed at the embedding layer (before any real computation) showed essentially no correlation with correctness at all (). The same pattern held on Llama 3.1 (raw ; partial ) and Mistral (raw ; partial ). The confabulating signal is therefore neither reducible to token-level statistics nor present at layer 0; instead, it likely emerges through middle-layer computation (Supplementary Figure S17). To put the four-vector representation in context, it was benchmarked against a fully supervised linear probe trained to predict correctness directly from all hidden-state units at a representative deep layer (logistic regression with regularisation, 5-fold cross-validation) — a classifier with roughly more free parameters. The supervised probe achieved AUC 0.86–0.92, only 0.04–0.12 AUC above the four-feature contrastive vectors (AUC 0.80–0.87). The taxonomy-based vectors therefore capture most of the linearly decodable correctness signal in the residual stream while remaining interpretable as named epistemic states; the small AUC gap likely represents the correctness-relevant information that lies outside the four-state taxonomy (Supplementary Figure S18).
Fourth, whether epistemic vectors transfer across model architectures was tested by applying one model’s direction vectors to another model’s question-answering activations. This is only mathematically possible between models with matching hidden-state dimension, so the five models were grouped into two comparison sets: the 4,096-dimensional group (Llama 3.1, OLMo 3, Mistral) and the 3,584-dimensional group (Gemma 2, Qwen 2.5). Within the 4,096-dimensional group, cross-model tracking retained 40–232% of the correlation that the target model achieved with its own vectors, and several pairs actually exceeded 100% — one model’s epistemic direction, applied to another model’s activations, produced a stronger correctness signal than the target model’s own extracted direction did. The strongest such effect was OLMo 3’s vectors applied to Llama 3.1 activations, which indicates that OLMo 3 extracts a more architecture-portable epistemic signal than Llama 3.1 itself. Retention within the 3,584-dimensional group averaged 47–55%, positive but weaker. Epistemic geometry is therefore partially but not fully shared across models trained on different data, with the exact degree of transfer depending on the pair (Supplementary Figure S19).
Reinforcement Learning from Human Feedback Selectively Reshapes Epistemic Geometry
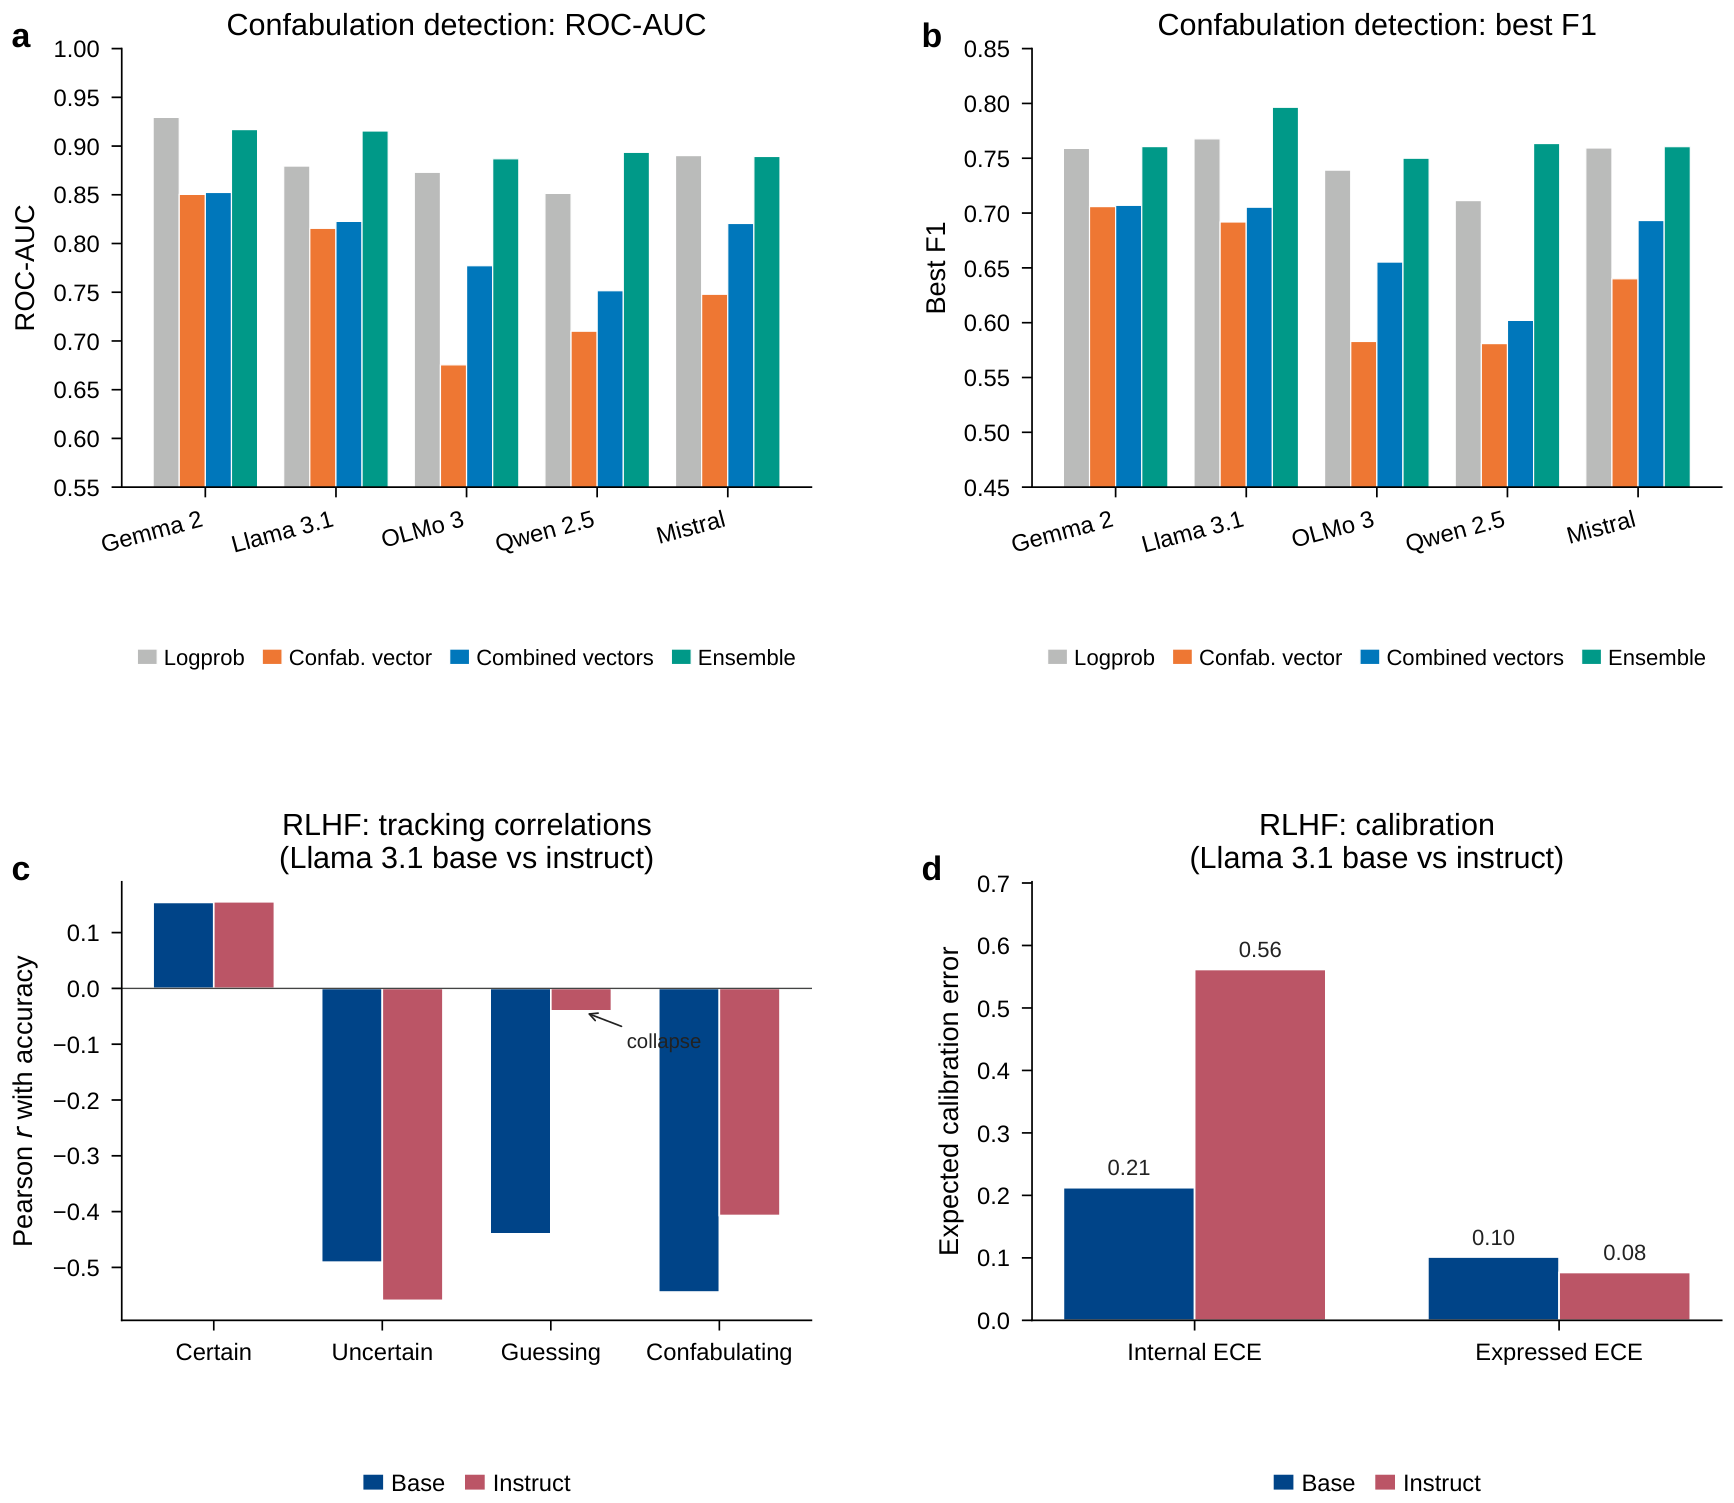
The effect of instruction tuning on epistemic representations was next examined by comparing vectors extracted from Llama 3.1 8B base against Llama 3.1 8B Instruct. Overall question-answering accuracy on the 1,910-question benchmark was nearly identical (base: 64.3%; instruct: 64.7%), so any change in the epistemic vectors reflects a change in how the model reaches its answers, not in how many it gets right. But the tracking correlations for individual epistemic states diverged substantially between the two versions. Uncertain tracking was preserved and even strengthened (base ; instruct ), and certain tracking was essentially unchanged (base ; instruct ). Guessing tracking, on the other hand, was nearly abolished (base ; instruct ), and confabulating tracking was substantially degraded (base ; instruct ). Internal calibration (the expected calibration error of confidence estimates derived from the vectors) worsened from 0.21 to 0.56, even though expressed calibration from the model’s own log-probability outputs improved slightly. The pattern is consistent with what preference-optimization training is expected to do; that is, human raters presumably reward the model for hedging when it is genuinely uncertain (which reinforces the “uncertain” representation), and penalize tentative, pattern-matching answers in favor of committed responses or explicit refusals (which erases the “guessing” representation). The practical consequence is that epistemic probes calibrated on base models cannot be assumed to transfer to their instruction-tuned counterparts — not every direction survives instruction tuning, and the ones that do not are precisely those that flag the least-confident, most error-prone answers (Figure 6c–d).
Epistemic Vectors Carry Complementary Information to Logprob Confidence
The natural question about the epistemic projections is whether they carry any correctness-relevant information beyond what is already available from the model’s own stated confidence (its log-probability over the four answer letters). To find out, logistic regression classifiers were trained to predict the correctness of the answer from three feature sets (logprob confidence alone, the four epistemic vector projections alone and the two combined into an ensemble) and evaluated by 5-fold stratified cross-validation. In Llama 3.1, the ensemble reached AUC 0.895, a gain over logprob alone (AUC 0.868); the uncertain projection carried the largest complementary weight in the ensemble (). OLMo 3 showed a smaller but positive AUC gain. Gemma 2, whose logprob confidence was already well-calibrated (AUC 0.920), showed no ensemble benefit — consistent with the ceiling effect of an already-strong baseline. To rule out the possibility that epistemic vectors simply repackage information that logprob already carries, partial correlations between each projection and correctness were computed controlling for logprob confidence. Across five models and four tracking states (20 cells total), 18 out of 20 partial correlations remained significant after Benjamini–Hochberg FDR correction. In Llama 3.1, the confabulating vector explained an additional 5.6% of the variance in correctness beyond logprob alone (; partial , ), and Qwen 2.5 showed the largest complementary effects ( up to 0.074). The only two cells that failed the significance test involved a certain vector, which peaks at early layers and picks up the same surface features that drive logprob confidence — so it should overlap with logprob, and it does (Supplementary Figure S20).
The practical payoff of this complementary information is clearest where logprob confidence fails, such as overconfident errors, questions where the model assigns high logprob but the answer is wrong. Because logprob is uniformly high in these cases by construction, it provides no signal for distinguishing right from wrong within them. The confabulating vector, applied alone to this subset, still achieved AUC 0.81 on Llama 3.1 and 0.80 on Qwen 2.5 — solid detection performance where the surface-level baseline is at chance. Treated as a confabulation detector, the full ensemble achieved ROC-AUC of 0.89–0.92 and best F1 of 0.75–0.80 across all five models, consistently outperforming both the logprob-only and the vector-only baselines and providing an error-detection tool whose signal comes from the model’s internal representations rather than from its output-level confidence (Figure 6a–b).
3. Discussion
This study aimed to determine whether large language models develop structured internal representations of their own epistemic states. Rather than 15 separable epistemic concepts, the dominant organization across all five architectures is a confidence axis that arranges states along a certainty–uncertainty gradient, cutting across the four a priori categories that inspired the study. Beneath that axis, a secondary sub-structure distinguishes self-directed from world-directed uncertainty, though the boundary is asymmetric: the representations of “I am uncertain” and “I am confabulating” stem partly from the model’s detection of world-level epistemic ambiguity, whereas guessing occupies a geometrically distinct region.
The causal results demonstrate that internal representations of uncertainty influence output behavior. Amplifying the confabulating direction degrades accuracy in a dose-dependent way that is consistent across three architectures; the specificity matrix shows the effect is state-specific rather than a generic disruption of the residual stream; and targeted activation patching along the same direction rescues correct answers on previously confabulated questions in two of the five models. These findings stand in contrast to recent work on a linearly decodable solvability belief axis, where steering along the identified direction failed to alter model behaviour[17]. The discrepancy likely reflects two methodological differences: the contrastive vignette approach used here identifies directions during the actual epistemic behavior of interest, and it intervenes on middle-to-late layers that lie on the causal pathway from representation to generation, rather than probing pre-generative assessment representations.
The finding that the representations of uncertain and confabulating are partially entangled with world-uncertainty detection has direct practical implications for confabulation detectors built from internal representations. A model may activate its confabulating representation partly because it recognizes that the topic is contested or unknown, rather than solely because it lacks the specific answer. Detectors built on this signal should therefore account for the model’s assessment of topic-level epistemic status alongside its self-assessment of answer reliability, rather than treating the two as interchangeable proxies for the same thing.
The finding that RLHF selectively reshapes epistemic representations has similar consequences for the deployment of internal probes on production models. The near-total loss of guessing tracking in the instruction-tuned model indicates that preference optimization can ameliorate, and in some cases eliminate, specific epistemic representations—plausibly because human raters penalize tentative, pattern-matching responses. Epistemic probes calibrated on base models cannot therefore be assumed to transfer to their instruction-tuned counterparts without re-validation, and the directions most likely to disappear are precisely those that flag the least-confident, most-error-prone answers.
Several limitations warrant acknowledgement. The analysis is restricted to models in the 7–9 billion parameter range; whether the same epistemic geometry holds at larger scales is an open question. The contrastive vignettes, although validated through bootstrap stability analysis, cross-domain transfer, and independent regeneration by a separate language model, were nevertheless generated through a template-based approach that constrains lexical diversity. The “surface” states (certain, recalling, established consensus) that peak at the embedding layer and show low robustness to vignette rephrasing likely capture text-level features rather than deep epistemic representations, and results involving these states should be interpreted with caution. Finally, the evaluation was restricted to science multiple-choice question answering; generalization to other domains and open-ended task formats warrants further study.
The framework developed here (i.e., extracting, validating, and manipulating epistemic state vectors) may be useful for building language models whose internal uncertainty can be read, audited, and corrected. The confidence axis and self–world sub-structure identified here provide a geometric foundation for understanding how language models relate to their own knowledge, and the causal effectiveness of epistemic steering and activation patching suggests a practical pathway toward deployed models that can be made more or less cautious about specific categories of uncertainty.
Methods
Models
Five dense, text-only language models spanning four organizational families were analysed: Gemma 2 9B (Google[9]), Llama 3.1 8B (Meta[10]), OLMo 3 7B (Allen Institute for AI[11]), Qwen 2.5 7B (Alibaba[12]), and Mistral 7B v0.3 (Mistral AI[13]). Llama 3.1 8B Instruct was additionally included for the base-versus-instruct comparison. All models were loaded in bfloat16 precision. Activation extraction and steering used the nnsight library[19] for layer-level tracing, and activation patching used PyTorch forward hooks on the residual stream of the underlying HuggingFace transformers[20] models. Models in the 7–9 billion parameter range were selected to allow full activation extraction across every layer on the available hardware (2× NVIDIA RTX 6000 Ada, 48 GB each).
Epistemic State Taxonomy
Fifteen epistemic states were defined and organized into four categories. Self-knowledge states (certain, uncertain, guessing, confabulating) reflect the model’s assessment of its own epistemic position. World-knowledge states (established consensus, contested, recently revised, unknown to science) reflect the epistemic status of claims in the broader scientific community. Reasoning-mode states (recalling, deriving, analogizing, estimating) characterize how the model arrives at an answer. Epistemic-stance states (asserting, hedging, speculating) describe the model’s communicative posture toward its claims. Operational definitions for each state are encoded directly in the contrastive vignette templates released with the code.
Contrastive Vignette Design
For each epistemic state, 100 pairs of contrastive vignettes (10 science domains × 10 pairs per domain) were generated using a template-based approach grounded in 100 hand-curated scientific topics, each annotated with 18 structured fields (factual questions, precise values, genuine controversies, fictitious mechanisms, estimation tasks, and others). Template functions converted each topic into a state-present prompt designed to elicit the target epistemic state and a topically matched neutral prompt from the same domain that did not elicit the state. The ten science domains were physics, chemistry, biology, medicine, earth science, astronomy, computer science, mathematics, psychology, and history of science. All vignette prompts were unique, and all fictitious content (for the guessing and confabulating states) used plausible but non-existent author names, mechanisms, and study results. Claude Sonnet 4 independently generated a separate set of 100 contrastive pairs per state (model ID Claude Sonnet 4-20250514 claude-sonnet-4-20250514) for the regeneration robustness check, with prompts requiring different phrasing, topics, and structure than the template-based set.
Vector Extraction
Residual-stream activations were extracted at the final token position for both state-present and neutral prompts at every layer of each model. The contrastive direction vector for each state at each layer was computed as the difference between the mean present and mean neutral activation vectors, normalized to unit length. The best layer for each state was selected as the layer with the highest Cohen’s d between projected present and neutral activations among the middle third of layers. The bootstrap confidence intervals in the vector directions were computed from 1,,000 resamples of the 100 pairs of vignettes per state.
Behavioural Validation
Epistemic tracking was evaluated on 1,910 science multiple-choice questions drawn from MMLU-Pro (science subjects only)[14], SciQ[15], and ARC-Challenge[16]. For each question, activations were extracted at the final token position and projected onto each tracking-state vector (certain, uncertain, guessing, confabulating). Point-biserial correlations were then computed between each projection and answer correctness (determined by comparing the model’s highest-logprob choice to the ground-truth answer).
Activation Steering
Steering was applied by adding a scaled epistemic direction vector to the residual stream at each layer in the middle third of the network during the forward pass. The steering intervention was , where is the activation at layer l, d is the unit direction vector, is the steering strength, and is the mean activation norm (which scales the perturbation relative to the magnitude of the activation). The steering strengths tested were . For each steering condition, accuracy was measured on 194 science questions using the steered logprob ranking. As controls, 10 random direction vectors with the same dimensionality were generated and subjected to the same steering protocol.
Self-Versus-World Separability
The self-versus-world separability test used three complementary approaches: (1) Fisher’s method for combining p-values across the five models; (2) pair-level bootstrap resampling (10,000 resamples) of the within-group versus between-group cosine similarity gap; and (3) leave-one-state-out classification using linear discriminant analysis on pair-level difference vectors.
Data-Driven Clustering
The confidence-partition analysis (Figure 1) used clustering of KMeans (sklearn.cluster.KMeans, n_init = 20, random_state = 42) on the 15 state-direction vectors of units length per model. The number of clusters k was selected by maximizing silhouette score under cosine distance across –14; was optimal in every model. A permutation test of 10,000 label shuffles compared the observed within-versus between-cluster similarity gap of the partition against the null distribution.
Cross-Domain Transfer and Per-Domain Tracking
The transfer of Cross-domain was evaluated using five predetermined splits of the ten science domains into training (5) and evaluation (5) sets, and the resulting vectors were applied to the full benchmark for questions and answers. The per-domain tracking used the 576 MMLU-Pro questions whose subject labels are available (96 per subject in biology, chemistry, health, mathematics, physics, and engineering). Point-biserial correlations per-subject were calculated between each sign-aligned tracking projection and correctness, with bootstrap 95% confidence intervals from 500 resamples. Domain geometric positions were obtained by taking the centroid of held-out QA activations per subject at a representative deep layer, unit-normalizing, subtracting the state-cloud mean, and projecting into the PC1–PC3 basis of the 15-state vector cloud and onto two named axes (confidence axis: certain − uncertain; self/world axis: mean(certain, uncertain) − mean(established consensus, contested)).
Variance Partition and Residual Subspace
The variance of QA activation was partitioned by constructing an orthonormal basis for the 15 contrast state directions (rank 14 after row-centering) and an orthonormal basis for the six mean-shift vectors of MMLU-Pro subject (rank 6). The variance captured by each subspace was the mean squared projection of the centered activations onto its basis, and the shared variance was using the joint orthonormal basis. The principal angles between and were obtained from the singular values of . The residual subspace (the orthogonal complement of ) was characterized by PCA in residual activations, and the top five residual components were correlated with surface and output features.
Partial Correlation and Difficulty Stratification
To assess whether tracking-state projections carry information beyond surface confidence, partial correlations between each projection and correctness were computed while controlling for logprob confidence, using ordinary least-squares residualization followed by Pearson correlation. The 20 (state × model) p-values were corrected for multiple comparisons by Benjamini–Hochberg FDR (). The overconfident-error analysis stratified questions by logprob tercile and reported ROC-AUC of each tracking projection on the highest-confidence tercile.
Within-Layer Trajectory and Semantic-Content Control
Within-layer trajectories were computed by projecting held-out QA activations at each layer onto each tracking state’s vector at the same layer, and reporting per-layer Cohen’s d between correctly and incorrectly answered questions. The semantic-content control computed per-question surface features (character length, word count, average word length, rare-word fraction) and applied the same residualization procedure as the partial correlation analysis to obtain confabulating-vector correlations with correctness after partialling out these features.
Linear-Probe Baseline
A supervised logistic regression probe was trained to predict correctness directly from raw residual-stream activations in a representative deep layer ( regularization ; 5-fold stratified cross-validation; StandardScaler fit in training folds only). The probe parameters (–) were compared with the four-feature contrastive projection model and against logprob alone.
Geometric Manifold and Compositional Algebra
For each model, the 15 unit-length contrastive state directions (best-norm layer per state) were stacked, and PCA was applied to the row-centered matrix. The compositional-algebra test used eight a priori analogy templates of the form and calculated the cosine similarity between the difference vectors and ; the null distribution was 2,000 random pairs drawn from the cloud of 15-states. The closed reconstruction projected each state’s unit direction onto the orthonormal basis of the remaining 14 states (least-squares fit) and reported cosine similarity to the true direction.
Calibration and Letter-Token Entropy
The calibration of vector-based wrongness probabilities used 5-fold cross-validated Platt scaling: a logistic regression was fit on each out-of-fold projection score to the wrong-answer indicator and reliability was evaluated using 10-bin expected calibration error (ECE) and Brier score. Letter-token entropy was computed from a single forward pass per question by taking the model’s logits at the answer-letter position, restricting to the candidate letters’ single-token IDs, renormalizing, and computing Shannon entropy in nats.
Vignette Clustering and State Collapsibility
The per-vignette clusters were extracted by collecting state-present activations for all 1,500 vignettes (100 × 15 states) in a representative deep layer (70% of network depth) per model. 3D PCA and 3D t-SNE (perplexity 30, initialized from the 3D PCA coordinates, maximum iterations 1500) were applied. Cluster quality was reported as cosine silhouette in the full hidden dimension and Euclidean silhouette in the 3D embeddings. State collapsibility was assessed by (i) hierarchical clustering with average linkage on the 15 state-mean cosine distances, identifying pairs that merge below distance 0.30; and (ii) 5-fold stratified k-NN classification (, cosine metric) of the 1,500 vignettes with the resulting confusion matrix averaged across models. States with mean k-NN purity and minimum purity across all five models were retained for the analysis of distinct-states.
Activation Patching
Activation patching used forward-hook interventions in the residual stream in the middle-third layers. For each high-confidence wrong answer ( per model), the hidden final-token state h at each target layer was modified as , where is the sign-aligned unit confabulating direction at the best-norm layer and s is the median projection observed in high-confidence correct answers. The intervention replaces the component along with the right-answer scalar while leaving all orthogonal directions intact. The reverse intervention (s set to the median of high-confidence wrong-answer projections) was applied to right answers as a control. The reported metrics are the fraction of patched answers that changed at all and the fraction that became correct (rescue rate) or incorrect (disruption rate).
Confabulation Detection and Ensemble Correctness
Confabulation detection used four estimators of the wrong-answer indicator: (i) logprob confidence; (ii) the sign-aligned confabulating projection; (iii) a four-feature logistic regression combining all tracking projections (certain, uncertain, guessing, confabulating); and (iv) a five-feature ensemble adding logprob confidence. All estimators were evaluated by 5-fold cross-validated ROC-AUC and best F1 on the 1,910-question benchmark. Cross-model transfer (Supplementary Figure S19) applied the source model’s tracking vectors to the target model’s QA activations at the same relative-depth layer, requiring matched hidden-state dimension (4,096 group: Llama 3.1, OLMo 3, Mistral; 3,584 group: Gemma 2, Qwen 2.5).
Supplementary Materials
The following supporting information can be downloaded at the website of this paper posted on Preprints.org.
Funding
The majority of this work was conducted while JLS was a Howard Hughes Medical Institute Awardee of the Life Sciences Research Foundation.
Data Availability Statement
All vignette corpora, extracted contrastive activation vectors, model evaluation outputs, and figure-generation reports are deposited on figshare under DOI 10.6084/m9.figshare.32915177 (https://figshare.com/account/articles/32915177). The 1,910 science multiple-choice items are drawn from the public MMLU-Pro benchmark[14] (https://huggingface.co/datasets/TIGER-Lab/MMLU-Pro), released under the MIT license, together with items from SciQ[15] (https://huggingface.co/datasets/allenai/sciq, CC-BY-NC-3.0) and ARC-Challenge[16] (https://huggingface.co/datasets/allenai/ai2_arc, CC-BY-SA-4.0). All five language models are open-weights and were obtained from Hugging Face under their respective licenses.
Code Availability
All code used to extract epistemic vectors, perform causal interventions, and generate the figures in this manuscript is available at https://github.com/JLSteenwyk/epistemic-vectors under the MIT License. The repository includes the vignette-generation pipeline, per-model configuration files, extraction and evaluation scripts, and the figure pipeline used to produce every display item in this manuscript and its supplement. A snapshot of the repository at submission time is archived alongside the data on figshare (DOI [HUMAN: insert figshare DOI]).
Acknowledgments
The author thanks the maintainers of Gemma 2, Llama 3.1, OLMo 3, Qwen 2.5, and Mistral for releasing model weights under permissive terms, and the maintainers of the MMLU-Pro benchmark for making its items publicly available.
Conflicts of Interest
JLS is an advisor to ForensisGroup Inc and a scientific consultant to Anthropic PBC.
References
- Ji, Z.; Lee, N.; Frieske, R.; Yu, T.; Su, D.; Xu, Y.; Ishii, E.; Bang, Y.J.; Madotto, A.; Fung, P. Survey of hallucination in natural language generation. ACM Comput. Surv. 2023, 55, 1–38. [Google Scholar] [CrossRef]
- Maynez, J.; Narayan, S.; Bohnet, B.; McDonald, R. On Faithfulness and Factuality in Abstractive Summarization. In Proceedings of the Proceedings of the 58th Annual Meeting of the Association for Computational Linguistics, 2020; pp. 1906–1919. [Google Scholar]
- Huang, L.; Yu, W.; Ma, W.; Zhong, W.; Feng, Z.; Wang, H.; Chen, Q.; Peng, W.; Feng, X.; Qin, B.; et al. A survey on hallucination in large language models: Principles, taxonomy, challenges, and open questions. ACM Transactions on Information Systems 2023. [Google Scholar]
- Marks, S.; Tegmark, M. The geometry of truth: emergent linear structure in large language model representations of true/false datasets. arXiv 2024, arXiv:2310.06824. [Google Scholar]
- Burns, C.; Ye, H.; Klein, D.; Steinhardt, J. Discovering latent knowledge in language models without supervision. In Proceedings of the International Conference on Learning Representations (ICLR), 2023. [Google Scholar]
- Anthropic. On the biology of a large language model: emotion concepts. 2025. Anthropic Interpretability Team report. [Google Scholar] [CrossRef]
- Zou, A.; Phan, L.; Chen, S.; Campbell, J.; Guo, P.; Ren, R.; Pan, A.; Yin, X.; Mazeika, M.; Dombrowski, A.K.; et al. Representation engineering: a top-down approach to AI transparency. arXiv 2023, arXiv:2310.01405. [Google Scholar]
- Nikankin, Y.; Reusch, A.; Mueller, A.; Belinkov, Y. Arithmetic without algorithms: Language models solve math with a bag of heuristics. arXiv 2025, arXiv:2410.21272. [Google Scholar]
- Gemma Team. Gemma 2: Improving open language models at a practical size. arXiv 2024, arXiv:2408.00118. [Google Scholar]
- Dubey, A.; Jauhri, A.; Pandey, A.; Kadian, A.; Al-Dahle, A.; Letman, A.; Mathur, A.; Schelten, A.; Yang, A.; Fan, A.; et al. The Llama 3 herd of models. arXiv 2024, arXiv:2407.21783. [Google Scholar]
- Groeneveld, D.; Beltagy, I.; Walsh, P.; Bhagia, A.; Kinney, R.; Tafjord, O.; Jha, A.H.; Ivison, H.; Magnusson, I.; Wang, Y.; et al. OLMo: Accelerating the science of language models. arXiv 2024, arXiv:2402.00838. [Google Scholar]
- Qwen Team. Qwen2.5 technical report. arXiv 2024, arXiv:2412.15115. [Google Scholar]
- Jiang, A.Q.; Sablayrolles, A.; Mensch, A.; Bamford, C.; Chaplot, D.S.; de las Casas, D.; Bressand, F.; Lengyel, G.; Lample, G.; Saulnier, L.; et al. Mistral 7B. arXiv 2023, arXiv:2310.06825. [Google Scholar]
- Wang, Y.; Ma, X.; Zhang, G.; Ni, Y.; Chandra, A.; Guo, S.; Ren, W.; Arulraj, A.; He, X.; Jiang, Z.; et al. MMLU-Pro: A more robust and challenging multi-task language understanding benchmark. In Proceedings of the Advances in Neural Information Processing Systems (NeurIPS), 2024. [Google Scholar]
- Welbl, J.; Liu, N.F.; Gardner, M. Crowdsourcing multiple choice science questions. In Proceedings of the Proceedings of the 3rd Workshop on Noisy User-generated Text, 2017; pp. 94–106. [Google Scholar]
- Clark, P.; Cowhey, I.; Etzioni, O.; Khot, T.; Sabharwal, A.; Schoenick, C.; Tafjord, O. Think you have solved question answering? Try ARC, the AI2 reasoning challenge. arXiv 2018, arXiv:1803.05457. [Google Scholar]
- Lieberum, T.; et al. Belief about solvability is linearly decodable but causally inert. arXiv 2024. Placeholder reference – update with verified citation. [Google Scholar]
- Farquhar, S.; Kossen, J.; Kuhn, L.; Gal, Y. Detecting hallucinations in large language models using semantic entropy. Nature 2024, 630, 625–630. [Google Scholar] [CrossRef] [PubMed]
- Fiotto-Kaufman, J.; Loftus, A.; Todd, E.; Brinkmann, J.; Juang, C.; Pal, K.; Rager, C.; Mueller, A.; Marks, S.; Nguyen, A.; et al. NNsight and NDIF: Democratizing access to foundation model internals. arXiv 2024, arXiv:2407.14561. [Google Scholar]
- Wolf, T.; Debut, L.; Sanh, V.; Chaumond, J.; Delangue, C.; Moi, A.; Cistac, P.; Rault, T.; Louf, R.; Funtowicz, M.; et al. Transformers: State-of-the-art natural language processing. In Proceedings of the Proceedings of the 2020 Conference on Empirical Methods in Natural Language Processing: System Demonstrations, 2020; pp. 38–45. [Google Scholar]
Figure 1.
Epistemic state geometry. (a) Contrastive vector extraction. For each of 15 epistemic states we constructed 100 matched present/neutral vignette pairs, extracted residual-stream activations at the final token at every layer, and computed the unit-length mean-difference direction. (b) Cosine similarity of the 15 state vectors for Gemma 2 9B at the best-discriminability layer, ordered by a priori category. (c) Two-dimensional PCA of the 15 state vectors for all five models, coloured by taxonomic category. The dominant axis consistently separates high-confidence from low-confidence states across architectures.
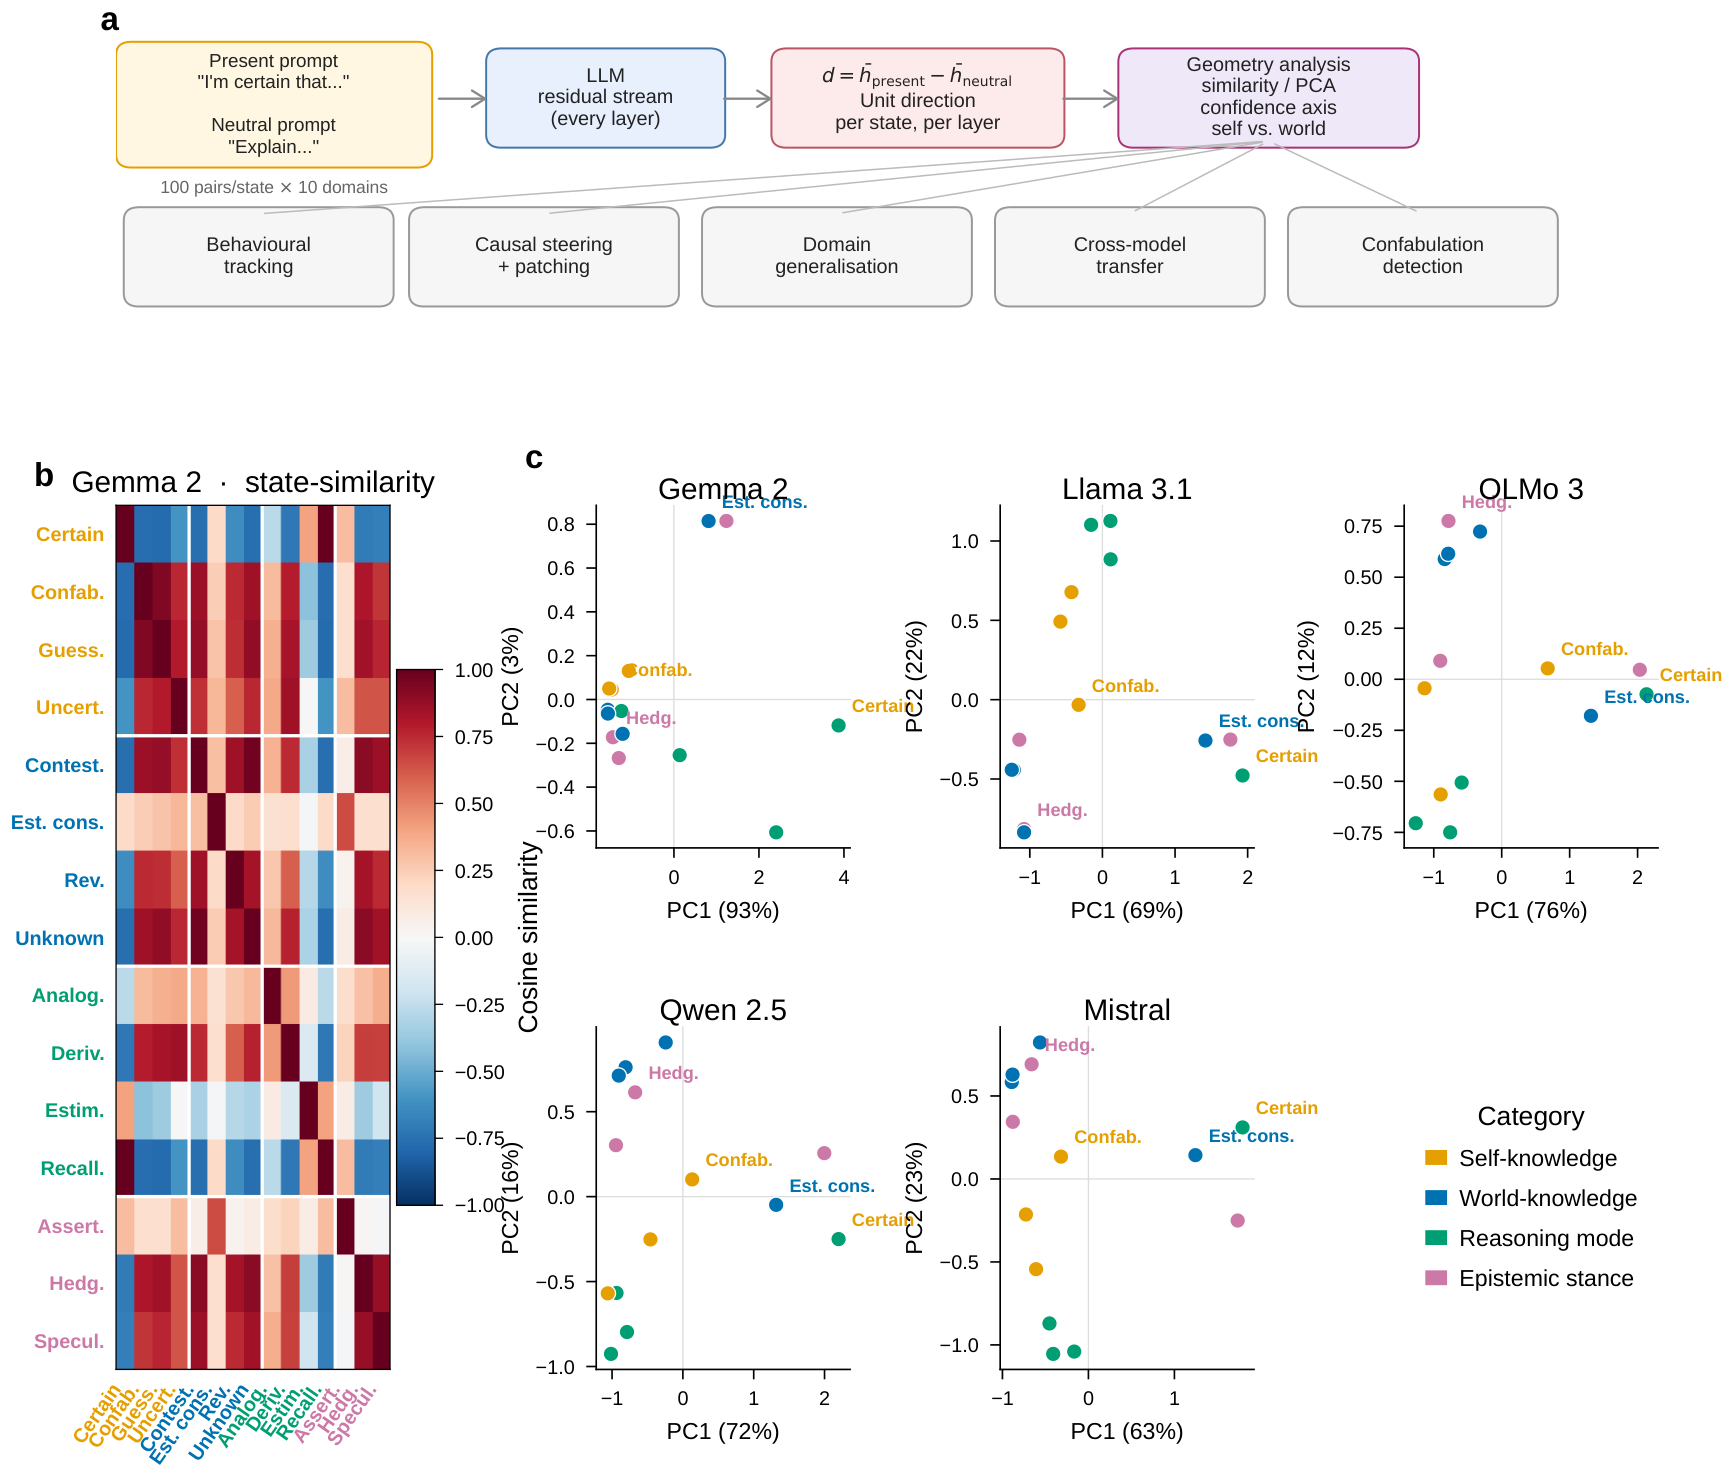
Figure 2.
Self-versus-world uncertainty separability. (a) Pair-level bootstrap 95% confidence intervals on the within-group versus between-group similarity gap for all five models. All intervals exclude zero. (b) Leave-one-state-out classification results. Colour indicates pair-level accuracy; ✓/× indicates whether the majority-vote prediction matched the true group. Uncertain and confabulating are consistently assigned to the world-uncertainty group. (c) Meta-analysis: for each model’s separability test and Fisher combined p.
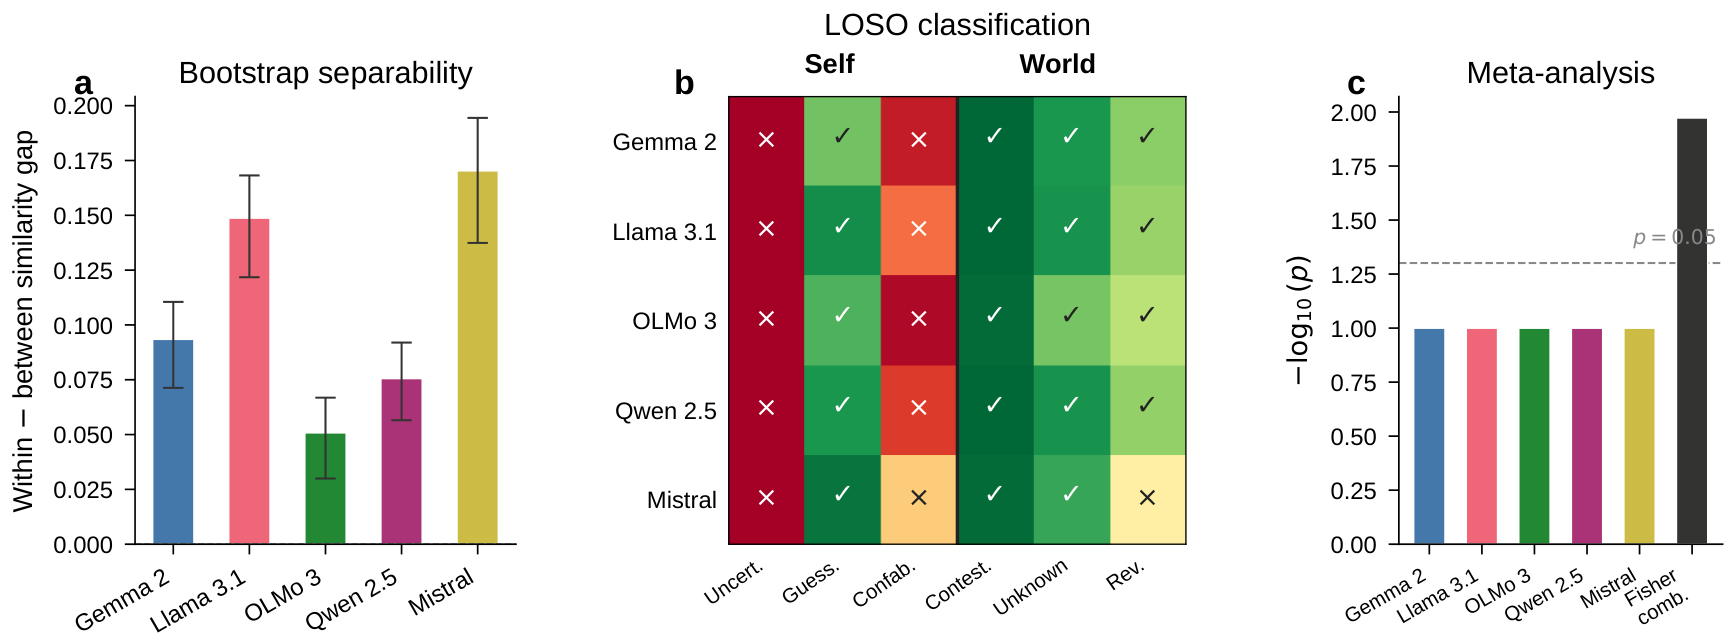
Figure 3.
Causal steering. (a) Dose–response curves for confabulating-vector steering across three pilot models (Gemma 2, Llama 3.1, OLMo 3). Accuracy declines monotonically with increasing steering strength; the dotted line marks chance. (b) Multi-state steering on Gemma 2: dose–response curves for four state vectors (confabulating, uncertain, certain, hedging), indicating that causal steering generalises across states. (c) Diagonal dominance ratios from the specificity matrix for each model. Ratios above 1.0 (dashed line) indicate that steering with a state’s vector preferentially affects its own state projection over the projection onto other states.
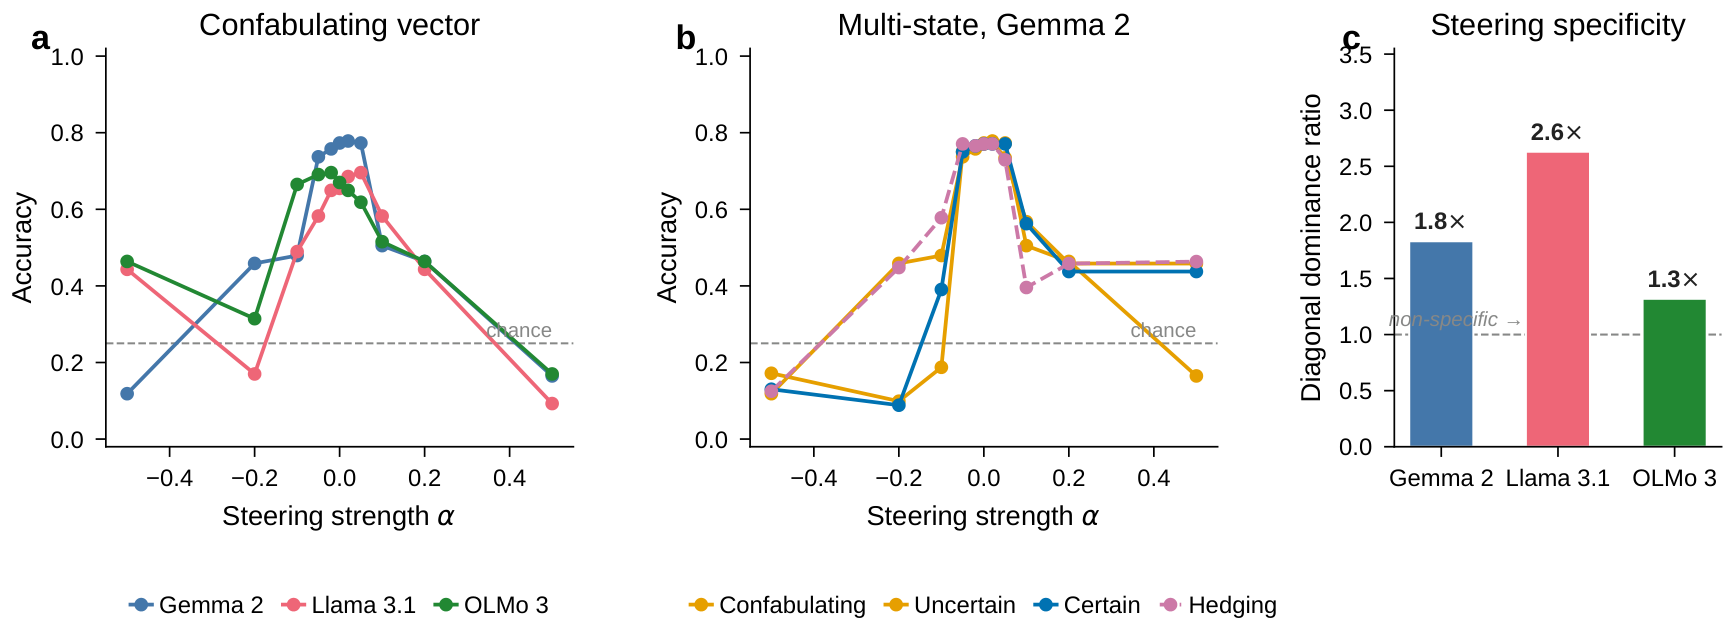
Figure 4.
Activation patching of the confabulating direction. (a) Wrong-answer patching: for each high-confidence wrong answer we replaced its projection onto the confabulating direction at mid-layers with the median projection of high-confidence correct answers. Grey bars: fraction of patched answers that changed at all; blue bars: fraction that became correct (rescued). (b) Right-answer patching (control): the reverse intervention applied to correct answers. OLMo 3 and Qwen 2.5 show substantial selective rescue (32% and 18%); Gemma 2 shows asymmetric disruption (51% answer change on wrong versus 3% on right) without high rescue; Llama 3.1 and Mistral show weak or inverted patterns. patches per model per condition.
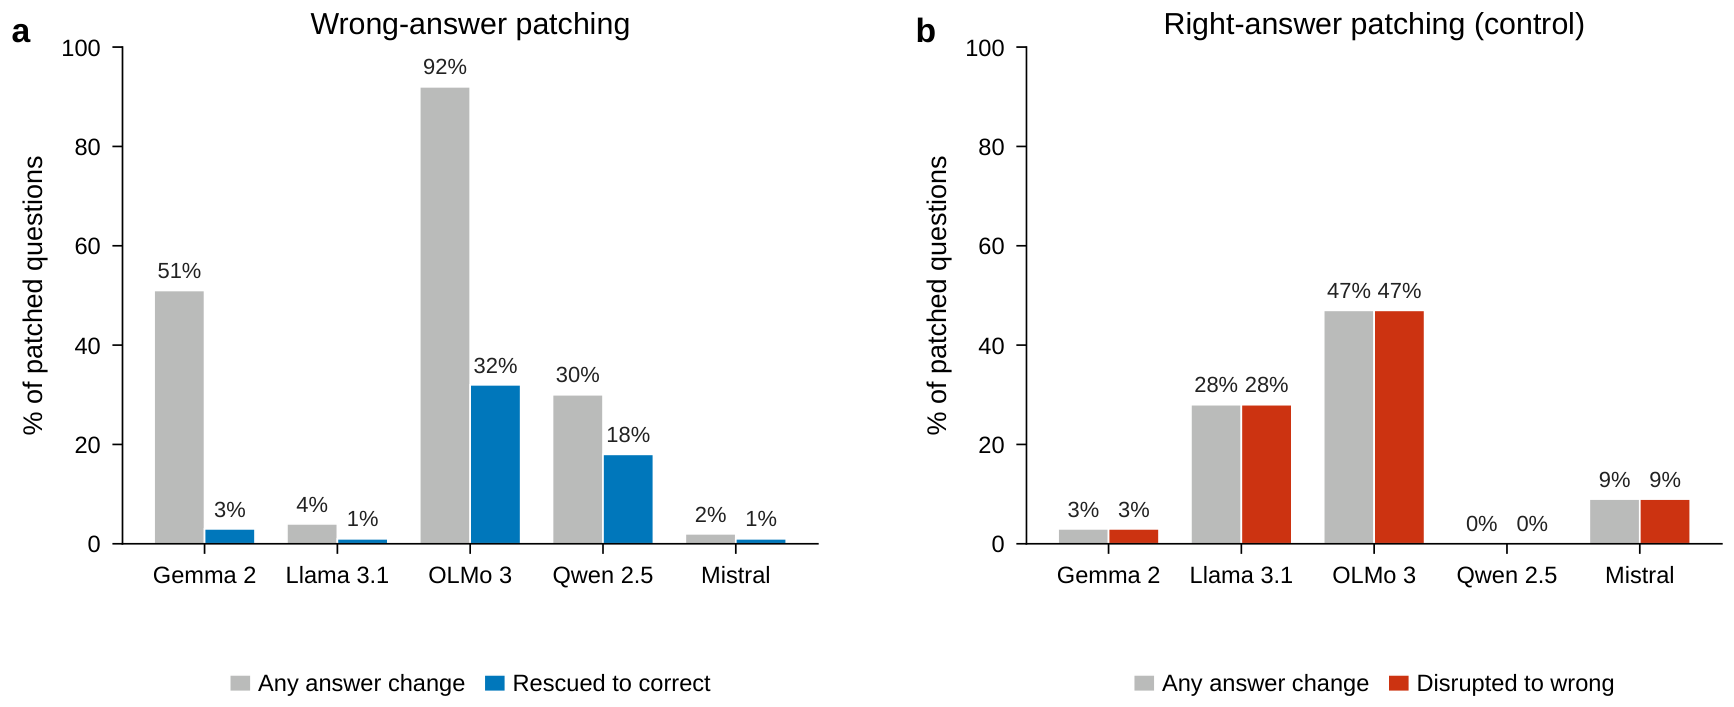
Figure 5.
Distinct epistemic states form 3D clusters across architectures. Per-vignette 3D t-SNE embeddings (perplexity 30, initialised from 3D PCA) of the nine reliably-distinct epistemic states in all five models, extracted at 70% of network depth. Points are individual state-present vignettes (100 per state); colours encode state. Silhouette scores in this restricted set range from +0.18 to +0.59, sharply higher than the all-15-state embedding (Supplementary Figure S15), confirming that the 9-state subset isolates the directions that occupy distinct geometric regions in residual-stream activation space.
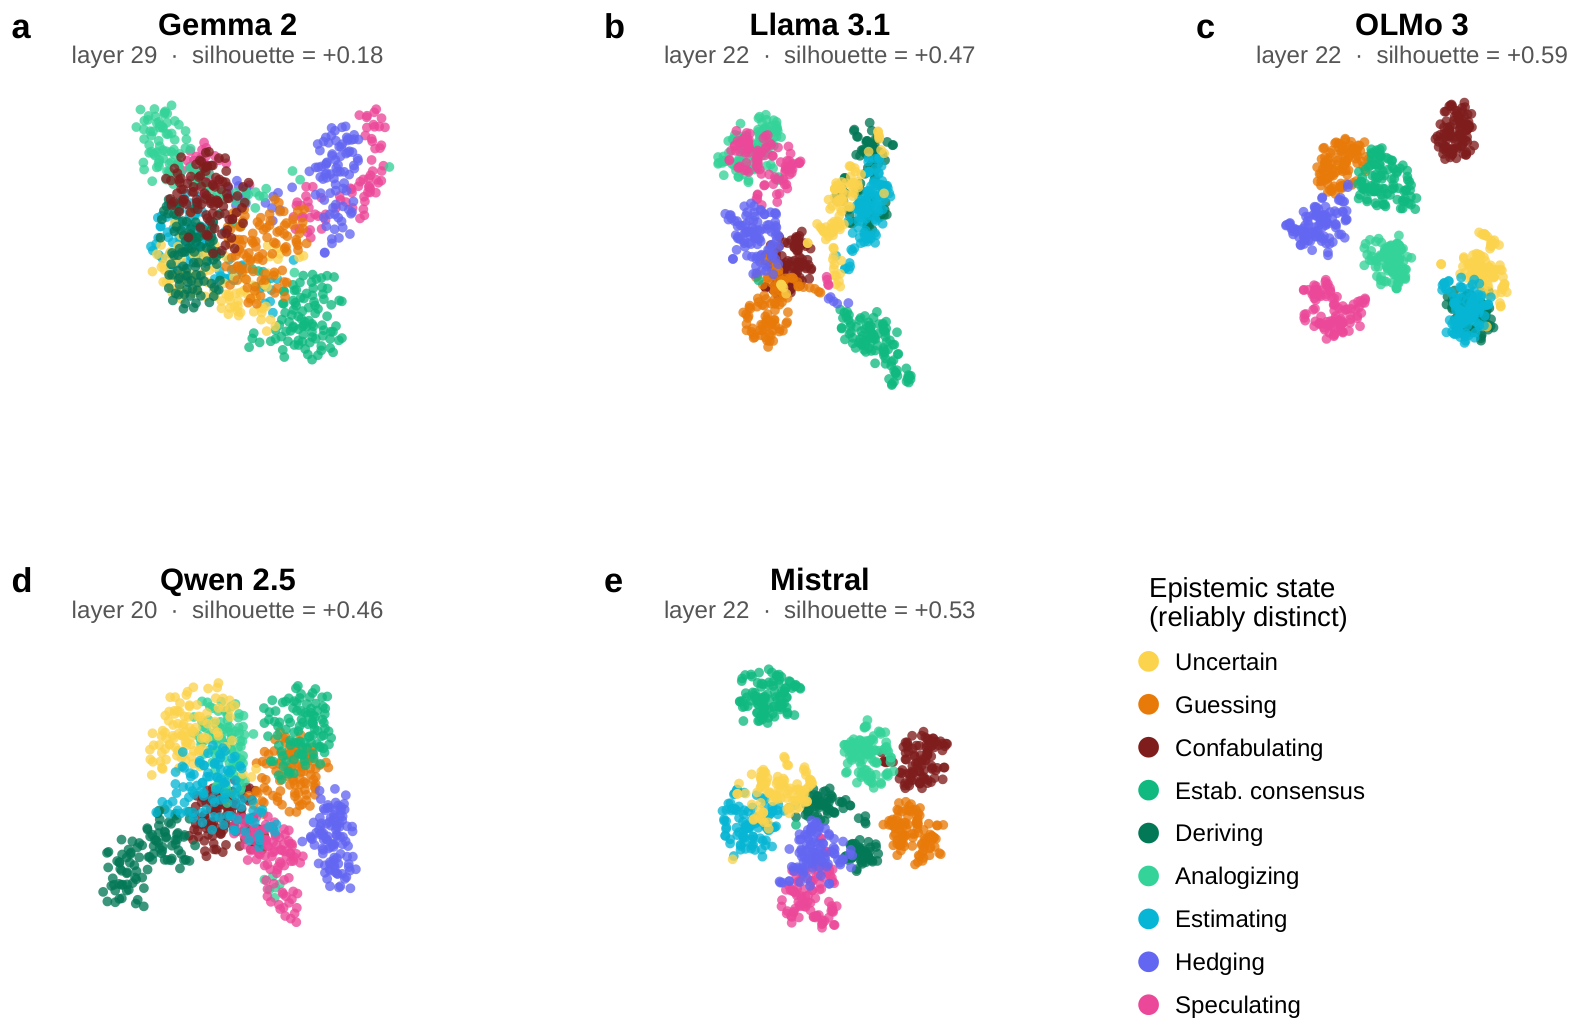
Figure 6.
Applications: confabulation detection and instruction-tuning effects. (a) ROC-AUC and (b) best F1 for four detection approaches across all five models: logprob confidence, confabulating projection alone, a multi-vector score, and a logistic-regression ensemble combining logprob with all four tracking projections. The ensemble consistently achieves the highest performance. (c) Tracking correlations for Llama 3.1 8B base versus instruct across the four tracking states. Guessing tracking is nearly abolished in the instruct model, while uncertain tracking is preserved or strengthened. (d) Internal versus expressed expected calibration error for the same model pair: internal calibration worsens substantially after instruction tuning.
Disclaimer/Publisher’s Note: The statements, opinions and data contained in all publications are solely those of the individual author(s) and contributor(s) and not of MDPI and/or the editor(s). MDPI and/or the editor(s) disclaim responsibility for any injury to people or property resulting from any ideas, methods, instructions or products referred to in the content. |
© 2026 by the authors. Licensee MDPI, Basel, Switzerland. This article is an open access article distributed under the terms and conditions of the Creative Commons Attribution (CC BY) license (http://creativecommons.org/licenses/by/4.0/).
Copyright: This open access article is published under a Creative Commons CC BY 4.0 license, which permit the free download, distribution, and reuse, provided that the author and preprint are cited in any reuse.