

Submitted:
28 August 2026
Posted:
31 August 2026
You are already at the latest version
Abstract
The Regional Innovation Scoreboard is the principal evidence base for European regional innovation policy, and a substantial applied literature estimates econometric models on it. This paper asks a prior question: what can that source identify? Using the commercialisation of novelty as a demonstration case — the sales of new-to-market and new-to-firm innovations across 218 European regions over four Community Innovation Survey waves — we establish three boundaries. First, the published annual file is not an annual dataset: biennial survey values are replicated across the reference years each wave covers, so the nominal eight-year panel contains four independent observations per region. Collapsing to survey waves changes standard errors on the annually varying registry indicators by up to forty per cent and reverses one coefficient sign. Second, the cross-sectional and longitudinal dimensions of the source do not agree. A Mundlak decomposition reveals a complete sign reversal for the leading regressor, negative between regions and strongly positive within them, and leave-one-country-out validation returns negative out-of-sample fit for every learner, locating much of the between variation in national measurement regime rather than economic behaviour. Third, flexible learners outperform the linear specification under conventional cross-validation but cease to do so under leakage-free panel designs. Within these boundaries the substantive picture is narrow: of seven innovation inputs only SME product-innovation incidence and trademark activity are associated with innovative revenue, and a taxonomy of innovation modes derived net of performance level proves nearly orthogonal to the official classification. The Scoreboard supports longitudinal inference about a region's own trajectory, not the cross-sectional benchmarking it was designed to invite.
Keywords:
innovation indicators
; regional innovation scoreboard
; measurement validity
; panel identification
; innovative sales
1. Introduction
Europe’s difficulty is not that it fails to produce knowledge. It is that the knowledge it produces is converted into marketed products and revenue less reliably than in the economies against which it competes. The United States dominates the commercialisation of frontier technology; China has built an innovation system in which state direction, scale and rapid product iteration compress the distance between laboratory and market (Liu et al., 2021; Omonijo and Zhang, 2025; Parrilli and Lu, 2026; Chen et al., 2026; Shu and Wang, 2023); India has developed capabilities in engineering and capital goods that increasingly displace European suppliers in third markets (Mathew and Paily, 2022; Kaur et al., 2022). Against these, the European Union’s competitive position rests on whether its firms can turn innovative activity into sales. Zabala-Iturriagagoitia et al. (2021) frame the issue precisely as one of productivity of national innovation systems — catching up or falling behind — and Hajighasemi et al. (2022) and Jonek-Kowalska (2023) document how unevenly that productivity is distributed across the Union. Technological innovation and its commercialisation are therefore not two policy objectives but one: capability that does not reach a market is, for competitive purposes, capability that does not exist.
If that is the constraint, then the instrument through which Europe observes it matters as much as the constraint itself. The Regional Innovation Scoreboard is that instrument. It structures cohesion and framework funding, anchors the smart-specialisation agenda, and supplies the evidentiary base for regional strategies (Abdelhamid et al., 2024; Martinidis et al., 2022; Pinto, 2024; Arthur et al., 2023), and a large applied literature estimates econometric models on it. This paper therefore asks a prior question: what can that source identify? Not what the coefficients are, but which classes of inference its data structure will support and which it will not. The question is prior because an estimate obtained from a design the data cannot sustain is not a weak estimate but an uninterpretable one.
Answering it requires a concrete application, and we use the one with the highest policy stakes: the commercialisation of novelty. The dependent variable is the share of regional turnover derived from products new to the market or new to the firm — a revenue rather than a capability measure, and the only outcome indicator in the database that is not itself a component of the composite indices built from it. The regressors are the seven innovation inputs of the regional business sector: the incidence of product and business-process innovation among SMEs, non-R&D innovation expenditure, innovation expenditure per employee, design and trademark applications, and collaboration among innovative SMEs. The specification is deliberately conventional, because the object of study is not the model but what the data do to it.
Three gaps in the existing literature motivate this design.
The critique of composite indicators has stopped short of the data structure. A mature literature interrogates the Scoreboard: its calculation (Bielińska-Dusza and Hamerska, 2021; Nawrocki and Jonek-Kowalska, 2025), the correspondence between its indicators and the innovation process (Onea, 2020), the case for efficiency rather than level measures (Teirlinck and Spithoven, 2023), and the sensitivity of rankings to aggregation and weighting (Corrente et al., 2023; Zofio et al., 2023; Barbero et al., 2021). What this work has not examined is the temporal resolution of the published regional file. Because most of its indicators derive from a biennial survey (Rammer, 2023; Rammer and Es-Sadki, 2023; Disoska et al., 2024), the file replicates each survey value across the reference years the wave is taken to cover, mixing replicated survey series with genuinely annual registry counts. Any panel analysis that treats the file as annual is computing inference on duplicated rows.
The applied literature reads cross-regional differences as economically meaningful without testing whether the two dimensions agree. The regional strand models innovation capability (Lopes et al., 2021a, 2021b; Silva et al., 2021; Ganau and Grandinetti, 2021; Beynon et al., 2024; Cipollina and De Pascale, 2026), while the commercialisation strand is firm-level and largely non-European (Vinokurova and Kapoor, 2020; Ardito and Svensson, 2024; Pak and Kim, 2026; Adomako and Tran, 2026a, 2026b; Cerpentier et al., 2024; Wang and Wang, 2024; Aliasghar and Kanani Moghadam, 2022). The few territorial exceptions are instructive but do not decompose the dimensions: Teirlinck and Khoshnevis (2022) study the efficiency with which regional research investment becomes innovative sales, Sein et al. (2026) estimate demand-side policy effects on innovative sales, and Vărzaru and Bocean (2024) model turnover from innovation against digital adoption.
Innovation-mode taxonomies are built on levels, and validation designs are rarely scrutinised. The distinction between science-based and interaction-based modes has been extended to firms and territories with considerable success (Parrilli et al., 2020; Parrilli and Radicic, 2021a, 2021b; Alhusen and Bennat, 2020; Doloreux and Shearmur, 2023, 2026; Hädrich et al., 2025; Pires et al., 2020), but taxonomies derived from indicator levels principally separate leaders from laggards, reproducing the classification the Scoreboard already supplies. Whether regions of comparable standing but opposite composition behave differently is untested — and it matters for the non-R&D literature, which holds that expenditure indicators understate innovative effort where innovation is incremental (Thomä and Zimmermann, 2020; Zhang, 2024; Hou, 2026; Hervás-Oliver J.-L. et al., 2021; Parrilli et al., 2023, 2025).
The contribution is a set of identification boundaries, each demonstrated rather than asserted. We show that the effective panel is half the length the file implies, and quantify what the difference does to inference. We show that the between-region and within-region associations of the leading regressor carry opposite signs, and that no model estimated on twenty countries predicts a twenty-first better than its own mean — evidence that the cross-sectional dimension carries substantially national measurement regime. We show that the apparent superiority of flexible learners over the linear specification is an artefact of cross-validation folds placing the same region in training and test sets, and vanishes under leakage-free designs.
This determines how the analysis should be read. The estimates are associational by construction and we make no causal claim: the argument is precisely that this source does not sustain one, and the leading regressor is in addition partly linked to the outcome by definition, which we quantify rather than conceal. The substantive findings — that only product-innovation incidence and trademark activity are associated with innovative revenue within regions, and that a mode taxonomy net of performance level is nearly orthogonal to the official tiers — are reported as what the data support once the boundaries are respected, not as estimates of effects.
None of these choices is cosmetic. Whether a panel has four periods or eight determines the standard errors; whether identification comes from comparison between regions or from change within them determines the sign of the leading coefficient; whether cross-validation folds respect the panel structure determines whether one concludes that the commercialisation function is linear. Each is made routinely and without comment in applied work on this source, and each is shown here to change the answer. The wider implication is that the Scoreboard supports one kind of question well and another badly: it can tell a region whether it is improving against its own past, but not reliably what to emulate in a peer.
2. Literature Review
Each strand below is read chronologically: an older body of work established the concepts and the objections, a recent one applies them. Reading them together shows which claims are settled, which remain contested, and where this paper enters.
From research effort to market revenue. The modern treatment begins with Griliches (1979), who framed research as an input to a knowledge stock entering an output equation, and with Crépon, Duguet and Mairesse (1998), whose CDM framework formalised the chain from research investment to innovation output to productivity. Its European application (Griffith et al., 2006; Hall, Lotti and Mairesse, 2009) established that the link operates through intermediate output rather than directly, and varies across countries and firm sizes. Cohen and Levinthal (1990) added the condition under which external knowledge becomes usable at all. Recent work treats commercialisation as an analytically separate stage. Vinokurova and Kapoor (2020) trace the internal path from invention to marketed product; Pak and Kim (2026) and Chebo and Wubatie (2021) examine how firms convert failure and strategic flexibility into commercial outcomes. Determinants include knowledge sourcing (Ardito and Svensson, 2024), stakeholder configurations (Engez and Aarikka-Stenroos, 2022), open innovation projects (Cheah and Ho, 2021; Asgari et al., 2022), university ties (Hsu et al., 2025) and marketing capability (Mostafiz et al., 2024), with moderators in low- and medium-technology industries (Woodfield et al., 2023), circular-economy spin-offs (Huynh Evertsen et al., 2022; Filipova et al., 2026), platform ecosystems (Yang et al., 2026) and the goods–services tension (Choo et al., 2021). What unites them is that innovating and appropriating returns are governed by different mechanisms. A second strand isolates the outcome directly. Wang and Wang (2024) and Aliasghar and Kanani Moghadam (2022) work with new-to-market novelty; Sein et al. (2026) estimate demand-side policy effects on the innovative sales of European firms, the closest antecedent to the present specification; Vărzaru and Bocean (2024) model turnover from innovation against digital adoption. Institutional conditions matter — employment protection (Cerpentier et al., 2024), regulation and geography (Adomako and Tran, 2026a, 2026b; Adjimah et al., 2022, 2025), public funding (Mardones and Sepúlveda, 2022; Jjagwe et al., 2024), subsidies conditioned on human capital (Afcha and Lucena, 2022) — as do intellectual property capability (Seip et al., 2022; Koval et al., 2026; Svensson, 2022), organisational and IT investment (Karhade and Dong, 2021; Adiguzel et al., 2025), external R&D in family firms (Aiello et al., 2021), founder characteristics (Zhang et al., 2025) and comparative framing (Kalmakova et al., 2021).
Survey-based measurement. Six of the eight indicators used here originate in the Community Innovation Survey. Mairesse and Mohnen (2010) catalogued the econometric limits of such instruments — simultaneity between input and output collected in one wave, subjective reporting of novelty, heterogeneous national implementation — while the Oslo Manual (OECD/Eurostat, 2018) supplies the definitional architecture, including the new-to-market and new-to-firm distinction on which our dependent variable rests. Disoska et al. (2024) pool national systems through CIS data; Vokoun and Dvouletý (2025) decompose determinants by level; Stojčić (2021) examines collaboration in Central and Eastern Europe; Solheim et al. (2020) link worker experience to novelty content. Firm-level applications span artificial intelligence (Rammer et al., 2022), circular economy and climate (Horbach and Rammer, 2020, 2025), environmental collaboration (Dimakopoulou et al., 2023), offshoring (Schubert, 2024), exporting (Juergensen et al., 2024), workplace practice (Niessen et al., 2026), start-ups (Gimenez-Fernandez et al., 2020; Audretsch et al., 2021), knowledge sharing (Scuotto et al., 2020), cooperation (Lara et al., 2023), delegation (Colombo et al., 2021), reconfiguration (Ovuakporie et al., 2021), pseudo-panels (Biscione et al., 2024), regulation (Blind et al., 2024) and standardisation (Blind et al., 2021, 2022). Measurement is itself now a research object (Rammer, 2023; Rammer and Es-Sadki, 2023; Lucena-Giraldo et al., 2022; Kim and Park, 2026).
Composite indicators and the Scoreboard. Composite measurement has been contested since it began. Nardo et al. (2008) codified the methodology while documenting its sensitivity to normalisation, weighting and aggregation, and Saltelli (2007) argued that analytical and advocacy functions are hard to separate. Applied to innovation, Grupp and Schubert (2010) showed rankings shift materially under equally defensible rules; Edquist et al. (2018) argued the Innovation Union Scoreboard’s synthetic indicator conflates inputs with outputs; Janger et al. (2017) assessed whether a purpose-built output measure improved matters. The recent literature continues that line. Bielińska-Dusza and Hamerska (2021) and Nawrocki and Jonek-Kowalska (2025) propose modifications; Onea (2020) questions whether the indicators track the innovation process; Teirlinck and Spithoven (2023) argue for efficiency measures; Raczynska (2024) scrutinises one constituent. Methodological work covers interacting hierarchies (Corrente et al., 2023), bottlenecks (Zofio et al., 2023), returns to scale (Barbero et al., 2021), system productivity (Zabala-Iturriagagoitia et al., 2021), fuzzy sets (Fabri et al., 2025) and model selection (Marques et al., 2025). Benchmarking studies rank and cluster countries and regions (Jonek-Kowalska, 2023; Dworak, 2024; Szopik-Depczyńska et al., 2020; Coutinho and Au-Yong-Oliveira, 2023; Hajighasemi et al., 2022; Kaur et al., 2022), examines cultural and institutional correlates (Murswieck et al., 2020; Végh et al., 2025), eco-innovation (Hajdukiewicz and Pera, 2023; Jesic et al., 2021), openness and design (Costantiello, 2025), collaboration and citation impact (Vieira, 2023) and science parks (Gomes et al., 2023; Lopes et al., 2025). The recurring finding is that composite scores conflate heterogeneous dimensions and that cross-sectional comparison invites inferences the data do not support.
Appropriation: trademarks and design right. Griliches (1990) established both the value and the limits of patent statistics, and the search for complements followed. Mendonça, Pereira and Godinho (2004) proposed trademarks as a tracker of product renewal where patenting is rare; Flikkema, De Man and Castaldi (2014) tested this by matching Benelux filings to reported innovations, finding substantial but conditional correspondence; Castaldi (2018) extended the case to creative industries and Filitz, Henkel and Tether (2015) to registered designs. Block et al. (2022) validate trademarks as a regional indicator; Morales et al. (2024) identify when they improve measurement; Ribeiro et al. (2022) and Flikkema et al. (2025) offer retrospective assessments; Willeke et al. (2026) survey their research use. Extensions cover green innovation (Block et al., 2025), cultural industries (Pereira dos Santos et al., 2024), venture financing (Rieger et al., 2025), business cycles (deGrazia et al., 2020), regional resilience (Mendes et al., 2026) and disaster response (Gramlich et al., 2026). The link to sales is examined by Lambrecht et al. (2026) and Faurel et al. (2024), moderated by quality certification (Medase and Abdul Basit, 2023). Filing behaviour is strategic and informationally conditioned (Crass, 2020; Athreye and Fassio, 2020; de Rassenfosse, 2020; Heath and Mace, 2020; Li et al., 2024; Tarzia et al., 2025; Khoja, 2026), and trademarks co-move structurally with patents (Daizadeh, 2021; Shu and Wang, 2023; von Graevenitz et al., 2022). Design rights and protection portfolios complete the field (Amoncio et al., 2025; Jemala, 2022; Pak et al., 2025; Wei et al., 2026; Al-Qudah et al., 2025; Dhingra, 2023).
Modes of innovation and territorial systems. Lundvall (1992) established the systemic framing in which innovation results from interactive learning within institutional configurations. Jensen, Johnson, Lorenz and Lundvall (2007) gave it durable empirical form through the science-technology-innovation and doing-using-interacting distinction, and Asheim and Coenen (2005) developed the parallel distinction between knowledge bases. Applied to territory, Tödtling and Trippl (2005) argued that instruments effective in one type of regional system fail in another — the intellectual basis of smart specialisation (Foray, David and Hall, 2009). Recent work extends it. Parrilli et al. (2020) establish regional variation in business innovation modes; Parrilli and Radicic (2021a, 2021b) extend by firm size and to liberal market economies; Parrilli and Lu (2026) apply it in China. Combinatorial configurations are examined by Alhusen and Bennat (2020), Weidner et al. (2023) and Ayerbe et al. (2024); geography by Doloreux and Shearmur (2023, 2026), Piercey et al. (2025), Hädrich et al. (2025) and Pires et al. (2020). Mode-specific outcomes appear for novelty (Orjuela-Ramirez et al., 2024), eco-innovation (Caravella and Crespi, 2020; Alcalde-Heras and Carrillo-Carrillo, 2024; Naruetharadhol et al., 2021), services (Robayo-Acuña et al., 2025), collaboration (Alcalde-Heras et al., 2023; Hervas-Oliver et al., 2025), emerging-economy performance (Hu et al., 2020; Mathew and Paily, 2022; Li, 2022; Chen et al., 2026; Zeng et al., 2024), owner and organisational characteristics (Runst and Thomä, 2022; Montiel-Campos, 2021; Aisjah et al., 2023), helix models (Rodrigues-Ferreira et al., 2023; Jun and Jun, 2022; Mota Veiga et al., 2021), sectoral applications (Liu et al., 2024; Lombardi and Costantino, 2020; Andriyani et al., 2024), theoretical diffusion (Brixner et al., 2021) and policy transfer (Omonijo and Zhang, 2025). Whether mode differences reflect how innovation is organised or merely sectoral composition remains unresolved.
European regional innovation systems. The European literature runs from Moreno, Paci and Usai (2005) on spatial spillovers and Fritsch and Slavtchev (2011) on system efficiency through Camagni and Capello (2013) and Capello and Lenzi (2013) on territorial patterns to Grillitsch, Martin and Srholec (2017) on knowledge-base combinations. Recent models are developed by Lopes et al. (2021a, 2021b), Silva et al. (2021), Ganau and Grandinetti (2021) and Odei et al. (2021). Method-oriented contributions include panel fuzzy-set analysis (Beynon et al., 2024, 2021), partially ordered sets (Damiani et al., 2026), geographically weighted regression (Bruno et al., 2026), spatial panels (Cipollina and De Pascale, 2026), micro-founded aggregation (Aronica et al., 2022) and convergence clubs (Kijek et al., 2022). Policy analyses address structural funds (Abdelhamid et al., 2024), universities in peripheral regions (Pinto, 2024; Lilles et al., 2020), human factors (Martinidis et al., 2022), administrative barriers (Natário et al., 2022), ecosystem mapping (Arthur et al., 2023), quadruple-helix governance (González-Martinez et al., 2023), industrial space (Suwala et al., 2021), sectoral development (Świąder and Marczewska, 2021) and Chinese comparisons (Cui and Li, 2022; Liu et al., 2021; Heindl, 2020; Zhang et al., 2026). The persistence of regional gaps motivates identification from change within regions rather than comparison between them.
Innovation without research. Santamaría, Nieto and Barge-Gil (2009) and Rammer, Czarnitzki and Spielkamp (2009) established that much European innovation occurs in firms conducting no formal research — through design, equipment acquisition, training and market preparation — with management practice substituting for technological capability in smaller firms. Thomä and Zimmermann (2020) show through cluster analysis that interactive learning is the key channel; Zhang (2024) and Kale (2022) examine complementarity between internal and external sources; Hou (2026) documents survival effects during crisis; Liu et al. (2025) evaluate non-R&D subsidies; Lu and Wang (2024) contrast strategies. Directly relevant here, Teirlinck and Khoshnevis (2022) study the efficiency with which regional research investment becomes innovative sales. European SME evidence comes from Hervás-Oliver et al. (2021) and Parrilli et al. (2023, 2025), with further work on network embeddedness (Xuemei and Hongwei, 2020), digital transformation (Zhang et al., 2022; Valdez-Juárez et al., 2024; Abudaqa et al., 2022) and competitive pressure (Keelson et al., 2024). Expenditure indicators therefore understate innovative effort precisely where innovation is incremental.
Econometric and computational instruments. The identification strategy rests on Mundlak (1978), whose auxiliary regression supplies both the specification test between fixed and random effects and the within–between decomposition exploited substantively here; Hausman (1978) provides the classical alternative, not reliably computable under clustered covariance. Inference follows Wooldridge (2010) and Cameron, Gelbach and Miller (2008); cross-sectional dependence follows Pesaran (2015) and functional form Ramsey (1969). The absence of a dynamic specification reflects Nickell (1981) and Arellano and Bond (1991). Panel designs remain the workhorse of applied work at firm level (Skare and Porada-Rochoń, 2022; Kesidou et al., 2022; Camiña et al., 2020) and regional scale. Clustering draws on Ward (1963), Caliński and Harabasz (1974), Dunn (1973), Rousseeuw (1987), Davies and Bouldin (1979), Bezdek (1981), Ester et al. (1996), Hubert and Arabie (1985), Hennig (2007) and Tibshirani, Walther and Hastie (2001). Breiman (2001a) supplies the random forest and Breiman (2001b) the argument for treating algorithmic and parametric modelling as complementary cultures; Friedman (2001) provides gradient boosting and partial dependence, Fisher, Rudin and Dominici (2019) the model-agnostic treatment of variable importance, and Varian (2014), Mullainathan and Spiess (2017) and Athey and Imbens (2019) the case for machine learning as an econometric instrument. What has not travelled into innovation research is the accompanying warning: Roberts et al. (2017) show that with temporally, spatially or hierarchically dependent observations, random cross-validation folds place the same unit in training and test sets, so performance estimates reward memorisation of unit levels rather than explanation.
Research gap. Four gaps follow, and they concern what the evidence base can support before what it shows. The critique of composite indicators has examined construction but not structure. From Nardo et al. (2008) and Saltelli (2007) onwards the objection has concerned normalisation, weighting and aggregation. None of it examines the temporal resolution of the published regional file, in which biennial survey values are replicated across annual reference years and mixed with genuinely annual registry counts, so that a panel study treating it as annual computes inference on duplicated rows.
The cross-sectional and longitudinal dimensions are used interchangeably and untested for agreement. The regional literature models capability across regions, the commercialisation literature models revenue within firms, and the two rarely meet. Whether the association obtained by comparing regions is the one obtained by following them — a question Mundlak (1978) made testable half a century ago — has not been asked of this source.
Innovation-mode taxonomies are constructed on levels. Partitions derived from indicator levels separate leaders from laggards, reproducing the classification the Scoreboard already supplies. Whether regions of comparable standing but opposite composition convert capability into revenue differently remains untested.
Validation design has received almost no attention. Reported advantages of non-parametric over parametric specifications cannot be distinguished from artefacts of fold construction.
This paper treats these as identification boundaries rather than omissions to be filled. It asks what the source sustains — estimating a commercialisation function on wave-collapsed data, decomposing each slope into within and between components, deriving a mode taxonomy net of performance level, and auditing the specification under leakage-free validation — and reports the substantive findings as what the data support once those boundaries are respected.
3. Data and Methodology
The analysis uses the Regional Innovation Scoreboard database published by the European Commission’s Directorate-General for Research and Innovation, covering reference years 2016 to 2023. It reports twenty-one regionalised indicators rescaled so that the European average in the base year equals 100, across units combining three NUTS levels — a heterogeneity the literature accommodates rather than resolves (Lopes et al., 2021a; Silva et al., 2021; Ganau and Grandinetti, 2021; Odei et al., 2021). We use a regional rather than firm-level source because the region is the level at which European innovation policy is designed and funds allocated (Abdelhamid et al., 2024; Martinidis et al., 2022; Pinto, 2024; Arthur et al., 2023). Firm-level studies of commercialisation are informative (Vinokurova and Kapoor, 2020; Ardito and Svensson, 2024; Asgari et al., 2022; Mostafiz et al., 2024) but cannot establish whether a territory converts capability into revenue, since aggregating firm behaviour into territorial outcome is what is at issue (Aronica et al., 2022).
The dependent variable, NEWSALES, is the rescaled index of turnover from products new to the market or new to the firm. Composite indices are weighted averages of their own components, so regressing one on a subset of its constituents recovers aggregation weights rather than economic relationships (Onea, 2020; Corrente et al., 2023; Zofio et al., 2023; Barbero et al., 2021; Bielińska-Dusza and Hamerska, 2021). NEWSALES enters no other indicator used here, measures revenue rather than capability (Pak and Kim, 2026; Chebo and Wubatie, 2021; Engez and Aarikka-Stenroos, 2022), and has by a wide margin the largest within-region variance share in the dataset.
Seven regressors follow from two channels. The launch channel is the incidence of SME product and business-process innovation (Wang and Wang, 2024; Aliasghar and Kanani Moghadam, 2022; Choo et al., 2021; Rammer, 2023). The appropriation channel is trademark and design applications, valid innovation indicators particularly in sectors patents miss (Block et al., 2022, 2025; Morales et al., 2024; Ribeiro et al., 2022; Flikkema et al., 2025; Willeke et al., 2026; Pereira dos Santos et al., 2024; Amoncio et al., 2025), with the qualification that filing is strategic (Crass, 2020; Athreye and Fassio, 2020; de Rassenfosse, 2020; Heath and Mace, 2020; Li et al., 2024). Expenditure per employee and non-R&D expenditure are cost measures whose relationship to revenue is theoretically ambiguous (Thomä and Zimmermann, 2020; Zhang, 2024; Kale, 2022; Hou, 2026; Lu and Wang, 2024; Liu et al., 2025); SME collaboration proxies relational capital (Stojčić, 2021; Lara et al., 2023; Alcalde-Heras et al., 2023; Hervás-Oliver et al., 2021).
The file is annual but the data are not. Six of the eight variables derive from the biennial Community Innovation Survey (Rammer and Es-Sadki, 2023; Disoska et al., 2024; Vokoun and Dvouletý, 2025) and each value is replicated across the reference years its wave covers, so the nominal eight-year panel holds four independent observations per region. We collapse to waves, averaging the two registry indicators within each block. Second, unavailable observations are coded zero rather than missing on a scale where the European average is 100; we recode these and retain regions complete in all four waves. The sample is a balanced panel of 218 regions, 29 countries, 872 observations.
Panel econometrics supplies the parameter. Region effects absorb sectoral composition, firm size, agglomeration and the national implementation differences generating persistent level gaps in survey indicators (Schubert, 2024; Blind et al., 2024; Kim and Park, 2026); wave effects absorb common shocks. We test fixed against random effects through the Mundlak auxiliary regression rather than the Hausman statistic, unreliable under clustered covariance, which also decomposes each slope into within and between components — turning a specification check into a result about cross-sectional benchmarking (Teirlinck and Spithoven, 2023; Jonek-Kowalska, 2023; Nawrocki and Jonek-Kowalska, 2025).
Clustering addresses heterogeneity, since territories differ in how, not only how well, they innovate (Parrilli et al., 2020; Parrilli and Radicic, 2021a, 2021b; Alhusen and Bennat, 2020; Doloreux and Shearmur, 2023, 2026; Hädrich et al., 2025; Pires et al., 2020; Weidner et al., 2023) and a pooled slope averages across configurations. Six algorithms are compared on thirteen indices, since no single criterion identifies a partition reliably (Thomä and Zimmermann, 2020; Hajighasemi et al., 2022; Fabri et al., 2025; Beynon et al., 2024, 2021).
Machine learning audits rather than predicts, testing whether the linear model leaves explanatory power unexploited, whether a method free of functional-form assumptions agrees on which regressors carry signal, and whether it agrees on shape. Applications to innovation data are growing (Li et al., 2023; Yun, 2026), but validation design has had little attention: random folds place the same region in training and test sets, rewarding memorisation of regional levels. We evaluate under leave-one-wave-out, forward-holdout and leave-one-country-out designs, with the within transformation computed from training observations only. See Figure 1.
4. Estimating the Commercialisation Function: From Cross-Section to Within-Region Variation
We estimate a commercialisation function in which the sales of new-to-market and new-to-firm innovations depend on the innovation inputs of the regional business sector:
where i indexes regions, t indexes Community Innovation Survey waves, μᵢ are region fixed effects and λₜ wave fixed effects. Standard errors are clustered at the regional level throughout. None of the seven regressors enters the construction of the dependent variable, so the specification is free of the aggregation tautology that arises when a composite index is regressed on its own components.
The region fixed effects absorb every time-invariant regional characteristic — sectoral composition, firm size distribution, agglomeration, institutional quality, and the national survey design and sampling practice that generates persistent level differences between countries in survey-based indicators. The wave fixed effects absorb Europe-wide shocks common to all regions, including the pandemic shock spanning the third wave and any revision to the Scoreboard’s rescaling base. Identification therefore rests on changes within a region between consecutive survey waves, net of the common European movement.
Two corrections to the source file precede estimation. First, the Regional Innovation Scoreboard is distributed as an annual file but is not an annual dataset: six of the eight variables derive from the biennial Community Innovation Survey, and the file replicates each survey value across the reference years the wave is taken to cover. For the dependent variable the 2016, 2017 and 2018 entries are numerically identical for every region, as are 2019–2020 and 2021–2022 (Appendix Table A1). The nominal eight-year panel contains four independent observations per region, and we collapse the data to the underlying waves accordingly, averaging the two administratively sourced indicators — design and trademark applications — within each wave block. Second, the file codes unavailable observations as 0.000 on a scale where the European average is 100; 172 region-wave cells are affected, concentrated in Switzerland, Romania, Greece, Spain, Norway and Serbia. We recode these as missing and retain regions with complete data in all four waves. The estimation sample is a balanced panel of 218 regions across 29 countries, four waves, 872 observations, of which 91.3 per cent are in EU member states; the remaining units are British, Norwegian and Serbian regions. The territorial units combine three NUTS levels, since the Scoreboard reports at NUTS2 for most member states, at NUTS1 for France, the United Kingdom, Austria, Belgium and part of Germany, and at national level for five small member states. The region fixed effects absorb this heterogeneity of geographic scale in levels, though not necessarily in slopes.
Appendix Table A9 quantifies what the wave correction changes. For the six survey-based indicators, clustering by region already absorbs most of the artificial replication and the standard errors move by less than seven per cent. For the two administratively sourced indicators the effect is substantial: the uncorrected annual panel understates the standard error on design applications by 40.1 per cent and on trademarks by 25.9 per cent, because these variables vary across the replicated reference years while the dependent variable does not, so the additional rows contribute variation in the regressor matched to a constant outcome. The coefficient on innovation expenditure per employee also changes sign. The correction is therefore not optional in any analysis that combines survey-based and registry-based indicators. See Table 1.
The variance decomposition determines what a within estimator can identify. NEWSALES has the largest within-region variance share in the dataset at 0.419, which is what makes it a viable dependent variable. Design applications (0.085) and especially trademark applications (0.053) are close to region-invariant: over ninety-four per cent of the variation in trademark intensity is cross-sectional, so their coefficients are identified from a narrow slice of variation. Correlations and variance inflation factors are reported in Appendix Table A2 and Table A3; the maximum within-VIF is 1.95, so collinearity does not constrain the fixed-effects estimates. See Table 2.
The same estimates are displayed graphically in Figure 2, where the confidence in tervals make the contrast between specifications easier to read than the tabulated standard errors.
Of seven candidate determinants, two survive the move from cross-sectional to within-region identification. The coefficient on SMEPI rises monotonically as identification becomes more demanding — 0.087 pooled, 0.300 with random effects, 0.457 with region effects, 0.466 with two-way effects — and remains at 0.396 in column (5), where a full set of country×wave dummies absorbs each national trajectory so that identification comes exclusively from regional deviations within a country in a given wave. This is the specification that rules out the concern that apparent within-region variation is national variation replicated across regions by the Scoreboard’s regionalisation procedure. Trademark applications carry a coefficient of 0.717 in the baseline but lose significance in column (5), which is consistent with their within-region variance share of 0.053: once national trajectories are absorbed, the residual variation is small and imprecisely related to innovative sales.
The two expenditure variables are indistinguishable from zero in every within specification. Innovation expenditure per person employed is positive and significant in the pooled model (0.234, p = 0.021) — the correlation that underpins much policy discourse — and the significance vanishes entirely once regional heterogeneity is controlled for, with the point estimate falling to −0.005. Business-process innovation and inter-firm collaboration are never significant within regions.
In standardised terms (Appendix Table A5), a one within-region standard deviation increase in SMEPI — 30.6 index points — raises innovative sales by 14.2 index points, or 0.325 within-region standard deviations. The corresponding figure for trademarks is 0.221, and no other variable exceeds 0.08 in absolute value. The pattern has a common structure: the two variables that survive describe firms placing products in a market and claiming commercial rights over them, while the five that do not describe how much was spent, how firms are organised internally, or with whom they interact. Conditional on whether innovations reached a market, upstream expenditure has nothing left to explain, which is what the CDM chain would predict if the effect of innovation spending on revenue runs entirely through whether it produces marketed output.
Appendix Table A4 reports four additional estimators. Weighted least squares with two-way effects and weights equal to the inverse of the region-specific residual variance confirms the baseline with greater efficiency (SMEPI 0.505, TM 0.502, both p < 0.001, within R² 0.481). The lagged specification retains only trademarks (0.697, p = 0.022), and first differencing retains only SMEPI (0.424, p < 0.001). The between estimator, discussed next, reverses the picture entirely.
The F-test of region effects (F = 4.08, p < 0.001) rejects pooling, and the Mundlak auxiliary regression rejects random effects decisively (χ²(7) = 82.59, p < 0.001). We use Mundlak (1978) rather than the classical Hausman statistic because under clustered covariance the difference of the two variance matrices is not necessarily positive semi-definite. The test also delivers an explicit decomposition of each slope into its within and between components.

Table 3.
Within and between slopes.
| Variable | Within slope | Between−within difference | p (difference) | Between slope |
|---|---|---|---|---|
| SMEPI | 0.457 (0.078) | −0.941 (0.159) | 0.000 | −0.484 |
| SMEBPI | 0.049 (0.083) | 0.386 (0.180) | 0.033 | 0.435 |
| NRDIE | −0.071 (0.085) | 0.371 (0.130) | 0.005 | 0.300 |
| IEPE | −0.043 (0.119) | 0.517 (0.179) | 0.004 | 0.473 |
| DES | 0.278 (0.135) | −0.474 (0.159) | 0.003 | −0.196 |
| TM | 0.592 (0.141) | −0.428 (0.154) | 0.006 | 0.165 |
| SMECOLL | 0.039 (0.063) | 0.179 (0.092) | 0.051 | 0.218 |
The two slopes are plotted side by side below, with each variable's within and between estimate connected by a grey line whose length is the difference reported in the preceding table. See Figure 3.
For SMEPI the two dimensions have opposite signs: +0.457 within, −0.484 between. Regions with persistently high product-innovation incidence do not have high innovative sales, while a region that raises its own incidence raises its own innovative sales. The two facts are reconcilable if cross-regional differences in reported incidence are dominated by national survey implementation and sectoral composition, which affect the reported incidence without affecting the revenue intensity of each innovation. The expenditure variables display the mirror pattern — positive between, null within — which is the signature of a variable proxying a persistent regional characteristic rather than exerting a flow effect. The practical implication is that cross-sectional benchmarking of regional innovation performance recovers, for the most important variable in the model, a relationship of the wrong sign.
The SMEPI and TM coefficients survive wild cluster bootstrap inference, winsorisation, a log–log specification and first differencing; SMEPI is significant at five per cent in all twenty-nine country-jackknife iterations, TM in twenty-eight, losing significance only when the United Kingdom is excluded (Appendix Table A6 and Table A7). Lagged innovative sales do not predict subsequent product-innovation incidence (0.032, p = 0.421), while contemporaneous and lagged SMEPI both predict innovative sales, an asymmetry consistent with the assumed direction (Appendix Table A8).
One caveat requires explicit statement. The share of SMEs introducing product innovations and the share of turnover from new products are drawn from the same survey instrument and are partly linked by construction: a firm that introduces no product innovation has zero new-product turnover by definition. Appendix Table A10 quantifies the dependence: excluding SMEPI, the within R² falls from 0.208 to 0.150 and the trademark coefficient rises to 0.848, while scaling the dependent variable by SMEPI removes the model’s explanatory power entirely. The SMEPI coefficient should therefore be read as a conditional association carrying a definitional component, not as an estimate of a causal effect. The trademark and design results, which are drawn from an independent administrative source, are not subject to this concern.
5. Four Ways to Be Innovative: A Taxonomy of European Regional Commercialisation Systems
The panel estimates of the previous section report an average within-region relationship. They do not tell us whether the commercialisation function is common to all European regions or whether structurally different regions convert innovative capability into revenue by different routes. We address this by partitioning regions into empirically derived types and re-estimating the model within each type, holding the dependent variable unchanged.
The clustering units are the 218 regions of the estimation sample, described by their wave-averaged values of the dependent variable and the seven regressors, each standardised across regions. Including NEWSALES in the clustering space is deliberate: the object of interest is the joint configuration of innovation inputs and commercial outcome, so that the resulting types are configurations of the whole commercialisation system rather than of its inputs alone.
Two design choices require justification. Clustering is performed on region-level averages rather than on the 872 region-wave observations, because pooling would place four observations of the same region in the space and mechanically inflate every cohesion index; the wave-level partition is reported as a robustness check in Appendix Table B3, where 85.2 per cent of region-waves are assigned to their region’s modal cluster and the two partitions agree at an adjusted Rand index of 0.804. All variables are standardised before clustering so that the Euclidean metric is not dominated by the indicators with the widest raw dispersion, which in this dataset would otherwise be SMECOLL and NEWSALES.
Six algorithms spanning the main families of the literature are estimated: k-means, hierarchical agglomerative clustering with Ward linkage, fuzzy c-means, model-based clustering through Gaussian mixtures, density-based clustering through DBSCAN, and an unsupervised random forest in which a proximity matrix is derived by discriminating the observed data from a synthetic sample with independent marginals and the resulting dissimilarity is clustered by average linkage. All are estimated at a common number of clusters so that the validation indices are comparable, and each partition is evaluated on thirteen indices covering explained variance, information criteria, internal cohesion, separation, distributional balance and resampling stability. See Table 4.
The internal indices favour k = 2, and the gap statistic rises monotonically without an elbow. Both patterns indicate that the data form a continuous gradient rather than well-separated natural groups, which is what one expects from a set of correlated performance indicators. Index-based selection is therefore weakly informative here, and we state this openly rather than presenting a marginal silhouette difference as decisive. We select k = 4 on two grounds. First, the two-cluster solution is a pure level split with no compositional content: it separates 58 low-performing regions from 160 others on every variable simultaneously. Second, moving from two to four clusters raises the share of between-cluster variance in the outcome from 0.207 to 0.342 and the overall R² from 0.324 to 0.519, while five and six clusters add little further outcome discrimination at the cost of interpretability. Appendix Table B1 and Figure B1 report the full selection evidence. See Table 5.
The thirteen indices are measured on incompatible scales, from information criteria in the thousands to correlation-like statistics bounded at one, so the table does not allow a direct visual comparison. The figure below rescales each index across the six algorithms to the [0, 1] interval, inverting those for which lower values are better, and separates the two families with a vertical rule. See Figure 3.
DBSCAN attains the highest silhouette, Dunn and Pearson gamma, but does so by discarding 27.5 per cent of regions as noise: its cohesion indices are computed on a self-selected subsample of the densest observations and are not comparable with those of the exhaustive methods, as the Herfindahl index of 4881 and the lowest bootstrap stability of the set (0.435) confirm. Among the algorithms that classify every region, k-means dominates: it attains the highest explained variance, the lowest information criteria, the highest Calinski–Harabasz statistic and the highest Pearson gamma, with a bootstrap adjusted Rand index of 0.749 that is statistically indistinguishable from the best value in the set. Fuzzy c-means is marginally more stable and more balanced but explains less variance and separates less sharply, with a minimum separation of 0.312 against 0.588. The Gaussian mixture and the random-forest proximity solution rank last on the composite criterion. We proceed with the k-means partition. See Table 6.
The four types can be characterised in two complementary ways, and the distinction matters because taxonomies of regional innovation are routinely presented through centroid profiles alone. That practice reports what separates the types without reporting how far the separation extends to individual units, which is precisely where empirical partitions of correlated performance indicators tend to be weakest (Hennig, 2007; Hubert and Arabie, 1985). The concern is not incidental here: the internal validation indices favoured a coarser solution and the gap statistic showed no elbow (Tibshirani, Walther and Hastie, 2001), so the four-type partition rests on interpretability and outcome discrimination rather than on statistical separation. We therefore report the centroids alongside a projection of the regions themselves. The projection also allows the loading structure to be read directly, showing whether the variable groupings that organise the mode-of-innovation literature — formal appropriation on one side, interactive and expenditure-based activity on the other (Jensen et al., 2007; Asheim and Coenen, 2005) — emerge from the data. See Figure 4.
Four configurations emerge. C1 (54 regions) is uniformly below average, with product-innovation incidence 1.5 standard deviations below the mean and the lowest innovative sales at 81.7; it comprises Spanish, Polish, Hungarian, Bulgarian and Slovak regions. C2 (63 regions) combines high innovation incidence with by far the strongest formal appropriation activity — design and trademark applications both one standard deviation above the mean — and is concentrated in Germany, Italy, the Netherlands and Scandinavia. C3 (71 regions) has above-average non-R&D expenditure and the weakest intellectual-property activity of all four types, describing innovation through acquisition of equipment and external knowledge rather than through formal protection; it spans Italian, German, French and Czech regions. C4 (30 regions) is defined by collaboration 1.64 standard deviations above the mean and the highest innovation expenditure per employee, and records innovative sales of 169.0, more than double the C1 level.
Two features of the taxonomy deserve emphasis. The first is that formal appropriation splits the middle of the distribution rather than its top: C2 and C3 have almost identical innovative sales but stand 1.6 standard deviations apart on trademark intensity and 1.6 on design applications. Whatever formal intellectual property does for European regions, it does not appear to be the binding constraint on aggregate commercial performance. The second is that the variable separating the top type is collaboration, not expenditure or protection — C4 exceeds every other type on SMECOLL by more than one standard deviation while sitting below the mean on both appropriation indicators.
The outcome differences are large and statistically sharp: one-way ANOVA gives F(3, 214) = 37.1 (p < 10⁻¹⁸), the Kruskal–Wallis test H = 61.2 (p < 10⁻¹²), and η² = 0.342. Pairwise Welch tests separate every pair at the one per cent level except C2 against C3, whose means differ by 2.4 index points (p = 0.658) — two distinct routes to a nearly identical commercial result, one through formal appropriation and one through non-R&D absorption. The partition is not a relabelling of the official classification: its adjusted Rand index against the Scoreboard’s four performance tiers is 0.182 and against country membership 0.167, and each type draws regions from several countries and performance tiers.
Re-estimating the two-way fixed-effects model with all regressors interacted with cluster membership rejects the hypothesis of a common commercialisation function decisively: χ²(21) = 63.25, p < 0.001. See Figure 5.
The product-innovation channel operates in C1 (0.713, p = 0.010), C2 (0.385, p < 0.001) and C3 (0.636, p < 0.001), but not in C4 (−0.043, p = 0.834), and the equality test across types is rejected (χ² = 9.08, p = 0.028). Trademarks matter most in C3 (1.400, p < 0.001) and C2 (0.528, p = 0.022) — that is, precisely where formal appropriation is respectively scarcest and most abundant — and are insignificant elsewhere. In C4 the entire structure differs: neither product innovation nor trademarks are associated with innovative sales, while business-process innovation (0.497, p = 0.006) and innovation expenditure per employee (1.536, p = 0.018) are. Full results are in Appendix Table B5.
The interpretation is that the highest-performing type has already saturated the extensive margin of product innovation — its incidence is 149.8 against a sample mean of 120.5 — so further gains come from the intensity and organisational capacity behind each launch rather than from the number of launching firms. In the other three types the extensive margin is still binding, and raising the share of SMEs that bring a new product to market remains the operative channel.
6. What the Folds Decide: Validation Design and the Appearance of Non-Linearity
This section uses machine learning as a diagnostic instrument rather than as a forecasting device. The object is not to predict innovative sales but to interrogate the parametric specification of the previous sections along three dimensions: whether a learner free of functional-form restrictions extracts explanatory power that the linear fixed-effects model leaves unused, whether it agrees about which regressors carry signal, and whether it agrees about the shape of each relationship. The dependent variable is unchanged throughout, and all learners are given the same seven regressors.
Five algorithms are compared: ordinary linear regression, a linear support vector machine, k-nearest neighbours, random forest regression, and a boosted decision tree. The nearest-neighbour learner is included deliberately as a leakage detector. It has no capacity to generalise beyond memorising the training sample, so respectable out-of-sample performance from it is a symptom of contamination in the validation design rather than of signal in the data.
The validation design is the decisive methodological choice, and it is where most applications of machine learning to panel data go wrong. A random k-fold partition places observations of the same region in different waves into training and test sets simultaneously. Because regional levels are highly persistent — 58 per cent of the total variance of the dependent variable is between regions — a learner that memorises regional levels will appear to predict well while explaining nothing about why innovative sales moved. We therefore evaluate four designs of increasing severity. The first, random five-fold cross-validation on region-demeaned data, is reported only as a leaky benchmark. The second, leave-one-wave-out, holds out each survey wave in turn and — critically — computes the region means used for the within transformation from the training waves only, so that no information from the held-out wave enters the transformation. The third trains on waves one to three and tests on wave four, replicating the genuine forecasting problem. The fourth holds out entire countries, testing whether the estimated relationship transfers across national measurement regimes.
Two further design points deserve statement. Hyperparameters are held fixed across designs rather than tuned within each fold, because tuning on the same folds used for evaluation would reintroduce optimism through a second channel; the values used are conventional defaults reported in Appendix Table C1, and Appendix Table C2 shows that the ranking is insensitive to them. And all comparisons operate on the within-transformed data, so that the learners face the same identifying variation as the fixed-effects estimator. Comparing a random forest fitted to raw levels against a within estimator would confound functional form with the treatment of unobserved heterogeneity, and would flatter the forest, which can approximate region effects by partitioning on the regressors. See Table 7.
The R² rows are plotted side by side below. Grouping the four designs within each learner rather than each learner within a design makes the relevant comparison horizontal: how far a given method's apparent performance falls once the validation folds respect the panel structure. See Figure 6.
The ranking reverses between the leaky and the honest designs. Under random five-fold cross-validation the random forest leads with an R² of 0.261 against 0.176 for linear regression, an apparent advantage of 8.5 percentage points that would conventionally be read as evidence of non-linearity. Under leave-one-wave-out the advantage disappears (0.067 against 0.077), under forward holdout it reverses decisively (0.017 against 0.097), and under leave-one-country-out every learner returns a negative R² with the linear specifications least damaged. The boosted tree, best-in-class in many applied settings, is worst or second-worst in all three honest designs.
The nearest-neighbour benchmark confirms the diagnosis. Its R² falls from 0.202 in the leaky design to 0.012 under leave-one-wave-out and −0.637 across countries, which is the signature of a design in which the apparent performance came from proximity to observations of the same unit rather than from a learned relationship. On the honest designs the linear specification is the best or joint-best model on every criterion, and the paired comparison across held-out waves gives a mean difference in R² between random forest and linear regression of −0.010 with a paired t-statistic of −0.34 (p = 0.755). We therefore retain the linear model and use the random forest, the strongest of the flexible learners, as the instrument for the remaining two diagnostics.
The magnitude of the honest performance figures also merits comment. An out-of-sample R² of 0.077 to 0.097 is low in absolute terms, and it should be. The quantity being predicted is the within-region deviation of innovative sales from its own regional average, after removing the wave effect — a residual from which all persistent structure has been stripped. The mean absolute error of roughly 36 index points against a within-region standard deviation of 43.8 confirms that most of the movement in innovative sales between survey waves is not explained by observable innovation inputs. This is a statement about the limits of the data, not about the specification: no learner in the set does materially better, and the exercise here is comparative rather than absolute. See Table 8.
The left panel ranks the variables by permutation importance with their dispersion across folds; the right plots that importance against the fixed-effects t-statistic, with the dashed line marking conventional significance. Agreement is confined to the two variables that separate from the cluster near the origin. See Figure 7.
The two methods agree where agreement matters. Both place SMEPI first by a wide margin — its permutation importance is six times that of the next variable — and trademarks second. The remaining five are bunched at importances between 0.002 and 0.012, all within one standard deviation of zero, mirroring the bunching of their t-statistics below 1.3. The Spearman correlation across all seven is 0.714, and the disagreements are entirely internal to the group of variables that neither method finds relevant, which carries no interpretive weight. The significance pattern of the panel estimates is therefore not an artefact of the linear parameterisation.
Figure 8 shows the curves behind the summary statistics of Table 9. Each panel plots the random forest's partial dependence against the straight line implied by the corresponding fixed-effects coefficient, over the observed range of within-region deviation. Proximity between the two traces is the graphical form of the correlation reported above.
For the variables that carry signal the partial dependence functions are close to linear: a straight line explains 96.7 per cent of the variation in the SMEPI curve and 84.8 per cent of the trademark curve, and the trademark slope of 0.718 is almost exactly the estimated coefficient of 0.717. Across all seven variables the correlation between partial dependence slope and fixed-effects coefficient is 0.961. For IEPE and NRDIE the linearity statistic is near zero, but this reflects a flat curve with no slope to fit rather than curvature — the random forest, free to find any shape, finds no relationship there either.
Three parametric tests corroborate the graphical evidence. A Ramsey RESET on the within-transformed model returns F = 3.92 (p = 0.141); a joint test of the seven squared terms gives F = 9.57 (p = 0.214); and a joint test of the twenty-one pairwise interactions gives F = 30.66 (p = 0.080). None rejects at the five per cent level, though the marginal interaction result is consistent with the slope heterogeneity across regional types documented in the clustering section, which the pooled specification does not accommodate.
The linear two-way fixed-effects specification passes all three tests. It is not outperformed by flexible learners under any leakage-free design; a method that assumes no functional form reproduces its ordering of the regressors and, in particular, its identification of the two that matter; and the shapes it implies match those the flexible learner recovers, at a correlation of 0.96. Had we relied on the conventional random cross-validation design, we would have reported a substantial advantage for the random forest and concluded that the commercialisation function is non-linear. That conclusion would have been an artefact of the fold structure. In panel settings with persistent unit effects, the validation design is not a technical detail but determines the answer.
7. Reading the Results as a Map of What the Source Sustains
The results are best read as a map of what this source sustains. Three boundaries emerged from the analysis, and one substantive picture survives inside them.
The temporal boundary. The published file carries four independent observations per region, not the eight its annual structure implies. Region-clustered inference absorbs most of the artificial replication for the survey-based indicators, which is reassuring for the existing applied literature; it does not absorb it for the annually varying registry indicators, where the uncorrected panel understates standard errors by up to forty per cent and one coefficient changes sign. The analyses affected are precisely those linking intellectual assets to commercial outcomes — the analyses this evidence base is most often asked to support.
The cross-sectional boundary. For the leading regressor the between-region and within-region associations have opposite signs. Regions with persistently high product-innovation incidence do not have persistently high innovative sales; regions that raise their own incidence do raise their own sales. Both facts can hold if cross-regional differences in reported incidence are dominated by national survey implementation and sectoral composition, which move the reported figure without moving the revenue intensity of each innovation. The leave-one-country-out results support this reading directly: no model estimated on twenty countries predicts a twenty-first better than that country’s own mean. The critical literature on composite indicators has established that rankings are sensitive to weighting and aggregation (Corrente et al., 2023; Zofio et al., 2023; Teirlinck and Spithoven, 2023); the present result is stronger and different in kind. Cross-sectional benchmarking here is not imprecise — for the single most important variable, it points the wrong way. The practical consequence is that the Scoreboard sustains the question of whether a region is improving against its own past, and not the question of how far it stands from a leader. The instrument was designed to invite the second reading.
The validation boundary. Under conventional random cross-validation a random forest outperforms the linear specification by a margin that would ordinarily license a conclusion of non-linearity. Under leave-one-wave-out and forward-holdout designs the margin vanishes and reverses. The one-nearest-neighbour benchmark, which cannot generalise by construction, makes the mechanism visible: its apparent performance came from proximity to observations of the same region in an adjacent wave. Reported non-linearity in this literature warrants inspection of the fold construction before interpretation.
Of seven innovation inputs, only two are associated with the revenue innovation generates once regions are followed over time rather than compared with one another: the share of SMEs bringing new products to market, and trademark activity. The five that fail describe how much was spent, how firms are organised internally, or with whom they interact. The two that survive describe firms doing something in a market — placing a product before customers, and claiming a commercial identity for it. Conditional on whether innovation reached a market, upstream expenditure has nothing left to explain.
The narrowness is a finding rather than a shortfall. A model in which all seven correlated indicators from the same scoreboard came out significant would be the more suspect result, since it would most likely be capturing a single latent factor of regional standing. The nulls are informative in their own right: four of the five exclude effects of moderate size with power above ninety per cent, and they are jointly indistinguishable from zero. This is consistent with the CDM tradition, in which the effect of research effort on revenue is mediated by the intermediate output it produces, and with the non-R&D literature, which has long argued that expenditure indicators misrepresent innovative effort where innovation is incremental (Thomä and Zimmermann, 2020; Hou, 2026; Zhang, 2024). It is uncomfortable for evaluation practice, where innovation expenditure is routinely treated as a proximate target on the assumption that it stands in for outcomes.
Partitioning regions by how they innovate rather than how well produces four types that bear little relation to the official leader–laggard classification. Within them the product-innovation channel operates almost everywhere, while appropriation and process channels operate selectively. The two types with statistically indistinguishable innovative sales but opposite appropriation profiles are the clearest illustration: one protects its output through trademarks and registered designs at more than a standard deviation above average, the other files almost nothing and innovates through acquisition of equipment and external knowledge, and they arrive at nearly the same commercial result. Whatever formal intellectual property does for European regions, it does not appear to be what separates those that commercialise successfully from those that do not.
Table 10.
Synthesis of findings: method, result and position relative to the existing literature.
| Finding | Method | Relation to the literature |
|---|---|---|
| The published annual file replicates biennial survey values; the effective panel is half its nominal length | Data diagnostic | New. Not previously reported; affects any panel study using this source |
| Product innovation carries opposite signs between and within regions | Mundlak decomposition | New. The composite-indicator critique concerns weighting and aggregation; sign reversal of the leading mechanism has not been documented |
| No model estimated on twenty countries predicts a twenty-first better than its own mean | Leave-one-country-out validation | New. Locates a substantial part of the cross-sectional variation in national measurement regime rather than economic behaviour |
| The apparent superiority of random forests is an artefact of random cross-validation folds | Machine learning | New for this field. Panel leakage is documented in ecology and statistics but rarely acknowledged in innovation research |
| Only product innovation and trademarks are associated with innovative sales within regions | Panel, two-way fixed effects | Adds. Extends firm-level commercialisation findings to the territorial level, where the regional literature has modelled capability rather than revenue |
| Innovation expenditure has no within-region association with innovative revenue | Panel | Confirms and sharpens. Consistent with the non-R&D literature; contradicts the evaluation practice that treats spending as a proxy for outcome |
| Four innovation modes emerge that are near-orthogonal to the official performance tiers | Clustering, six algorithms | Adds. Mode taxonomies are usually built on levels, which reproduces the leader–laggard gradient |
| Two types with almost identical innovative sales differ sharply in appropriation intensity | Clustering | Contrasts. Suggests formal IP is not the binding constraint on aggregate commercial performance |
| The product channel is common across modes; appropriation and process channels are mode-specific | Panel with cluster interactions | Qualifies. Partially supports differentiated regional policy, but not for the strongest mechanism |
| Flexible learners do not outperform the linear model under leakage-free validation | Machine learning | Confirms. Consistent with methodological warnings on cross-validation with dependent data |
| Variable ranking and functional form recovered by a non-parametric method match the linear estimates | Machine learning | Confirms. Supports the use of flexible learners as specification audit rather than as competitors |
Notes: findings are ordered by contribution type rather than by section. "New" denotes results not previously reported for this data source; "Adds", "Confirms", "Contrasts" and "Qualifies" denote the relation of each finding to established results, as discussed in the text.
Three qualifications bound these readings. The substantive results are reported as what the data support once the boundaries are respected, not as estimates of effects: no design available in this source identifies a causal parameter, which is the argument of the paper rather than a concession within it. The incidence of product innovation and the share of turnover from new products are drawn from the same survey instrument and are partly linked by construction, so the leading coefficient carries a definitional component; the trademark and design results, drawn from an independent administrative register, are not subject to this concern. And the four-type partition is an analytical device with moderate resampling stability, not a claim that European regions fall into discrete natural kinds.
8. Limitations
Five constraints bound what this paper establishes, and they should be read as conditions on the interpretation rather than as caveats appended to it. The first is identification. All estimates are associational. Region and wave fixed effects absorb time-invariant regional characteristics and common European shocks, and the country×wave specification absorbs each national trajectory, but time-varying regional unobservables remain a threat. The reverse-regression test rules out the most mechanical form of simultaneity — past commercial success does not predict subsequent product-innovation incidence — without establishing direction, and the difficulty is intrinsic to innovation-survey data rather than particular to this application (Mairesse and Mohnen, 2010; Crépon, Duguet and Mairesse, 1998). No instrument available in this source would plausibly satisfy an exclusion restriction, and we have not constructed one for the sake of appearances. The paper therefore answers what moves together within regions, not what causes what.
The second concerns the definitional link between the leading regressor and the outcome. Both are drawn from the same survey instrument and are partly connected by construction, since a firm introducing no product innovation has by definition no turnover from new products — an instance of the general problem that innovation surveys collect inputs and outputs from the same respondents in the same reference period (Mairesse and Mohnen, 2010; Rammer, 2023). Excluding the incidence variable reduces explanatory power substantially, and rescaling the outcome by it removes that power altogether, so the coefficient should be read as a conditional association containing a definitional component. The trademark and design results, drawn from an independent administrative register with no definitional relationship to the survey-based outcome (Mendonça, Pereira and Godinho, 2004; Flikkema, De Man and Castaldi, 2014; Block et al., 2022), are not subject to this concern — which is why the appropriation channel, despite its own fragility, carries more evidential weight per unit of estimated magnitude.
The third is the shortness of the panel. Four survey waves is the maximum the source supports, and it is few. It precludes dynamic estimation, since the Arellano–Bond family requires more periods to generate usable instruments and to permit specification testing (Arellano and Bond, 1991), while the alternative of a fixed-effects specification with a lagged dependent variable is biased at this length (Nickell, 1981); forcing a dynamic model onto four periods would produce estimates whose properties could not be assessed. It also limits the power of the heterogeneity tests, visible in the marginal significance of the joint equality statistic and in the width of the confidence intervals for the smallest cluster. Some null results — particularly for business-process innovation, whose collinearity with product innovation is high — reflect insufficient power rather than demonstrated absence, and we report minimum detectable effects rather than asserting that no effect exists.
The fourth concerns measurement and territorial construction. Trademark intensity has a within-region variance share of roughly five per cent, so its coefficient is identified from a narrow slice of variation and does not survive the exclusion of a single country; the informational content of trademark counts is in any case conditioned by filing behaviour, which is itself strategic (Crass, 2020; Athreye and Fassio, 2020; Heath and Mace, 2020). The territorial units mix NUTS2, NUTS1 and national levels, a heterogeneity of geographic scale that region fixed effects absorb in levels but not necessarily in slopes, and one the European regional literature accommodates rather than resolves (Lopes et al., 2021a; Ganau and Grandinetti, 2021); any extension merging these data with external sources will additionally require reconciliation between the NUTS 2016 and NUTS 2021 classifications. Finally, the regional values of several survey-based indicators are themselves estimated by the Scoreboard from national figures adjusted for regional structure, so part of what appears as within-region variation may be national variation redistributed. The country×wave specification is our defence against this and the leading result survives it, but the concern cannot be eliminated.
The fifth is that the clustering is a device rather than a discovery. The internal validation indices do not identify a natural number of clusters and the gap statistic rises monotonically (Tibshirani, Walther and Hastie, 2001), both signatures of a continuous gradient rather than discrete types. The four-type partition has moderate resampling stability (Hubert and Arabie, 1985; Hennig, 2007) and limited agreement between algorithm families at the chosen granularity. It is an analytical instrument for testing whether slopes differ across configurations, and the finding we place weight on — that the product-innovation channel operates across types — is the one that survives at coarser and finer partitions alike. The mode-specific results for design rights and process innovation rest on subsamples of thirty to seventy regions and should be treated as indicative.
Each of these has a data remedy that does not currently exist at European regional scale. Linked employer–employee or firm–register data would break the definitional link by separating the population of innovators from the revenue they generate; a longer run of survey waves would permit dynamic specification; regional trademark and design data at annual frequency, matched to product introductions rather than counted (Flikkema, De Man and Castaldi, 2014), would give the appropriation channel the variation it lacks. Their absence is a property of the evidence base rather than of this study.
9. Implications for the Evidence Base and for Policy
The competition between the United States and China has become the organising fact of global technology policy, and it is not a competition Europe is currently positioned to join on equal terms. It is being fought over semiconductors, artificial intelligence, quantum computing and the industrial platforms that depend on them, through instruments — export controls, entity listings, subsidy programmes of unprecedented scale, restrictions on outbound investment — that assume the state is a direct participant in technological development rather than a regulator of it. China’s response has been to compress the distance between research and marketed product through state direction, scale and rapid iteration (Liu et al., 2021; Omonijo and Zhang, 2025; Parrilli and Lu, 2026), and to reduce dependence on foreign technology in the sectors where that dependence is a strategic liability (Chen et al., 2026; Shu and Wang, 2023). India has meanwhile built capabilities in engineering, capital goods and software services that increasingly compete with European suppliers in third markets (Mathew and Paily, 2022; Kaur et al., 2022).
Europe’s position in this contest is structurally awkward. It produces scientific knowledge at a level comparable to either bloc but converts it into marketed products less reliably, and the productivity of its innovation systems is unevenly distributed across the Union (Zabala-Iturriagagoitia et al., 2021; Hajighasemi et al., 2022; Jonek-Kowalska, 2023). The risk is not that Europe stops doing research. It is that Europe continues to do research whose commercial returns accrue elsewhere — that it remains a supplier of ideas to systems better organised to sell them. In a technological confrontation conducted through industrial capacity, a region that innovates without commercialising is not a neutral party but a dependent one. If commercialisation is the binding constraint on European technological autonomy, then the capacity to observe commercialisation is itself a strategic asset, and the instrument Europe currently uses to observe it has limits its users do not generally recognise. What follows therefore concerns the evidence base first and policy design second, in that order, because the second depends on the first.
The first implication is that survey-based indicators should be published at their native frequency. Distributing biennial survey values replicated across annual reference years, alongside genuinely annual registry counts, invites specification error and manufactures precision in exactly the analyses linking intellectual assets to commercial outcomes. An explicit wave identifier in the published file would cost nothing and would remove the hazard entirely. Until it exists, users of this source should collapse to survey waves before estimating anything, and reviewers should ask whether they have. The existing critique of the Scoreboard has concentrated on aggregation and weighting (Grupp and Schubert, 2010; Edquist et al., 2018; Corrente et al., 2023; Zofio et al., 2023), leaving the temporal structure of the underlying file unexamined; when these indicators inform the allocation of cohesion and framework funding in a period of strategic competition, the quality of the evidence base is itself an industrial-policy instrument.
The second is that regional indicators should be reported with their provenance. Several regional values are estimated by the Scoreboard from national figures adjusted for regional structure rather than measured regionally, and users cannot currently distinguish the two. The distinction bears directly on what can be identified, since variation originating nationally cannot support inference about regional behaviour — a difficulty already visible in the sensitivity of composite scores to construction choices (Nardo et al., 2008; Saltelli, 2007). Flagging the provenance of each cell would let analysts condition on it, as we do here through country×wave effects, rather than assume it away.
Turning to policy analysis, the third implication is that the Scoreboard should be used longitudinally rather than comparatively. For the most important variable in the model the cross-regional association with innovative sales has the opposite sign to the within-region association, and no model estimated on twenty countries predicts a twenty-first better than that country’s own mean. Benchmarking exercises that compare a region against peers and infer targets from the gap are, for this mechanism, extracting a signal generated substantially by differences in national survey implementation (Mairesse and Mohnen, 2010; Teirlinck and Spithoven, 2023). The defensible use of these data is to track a region’s trajectory against its own history — a weaker exercise than the one the instrument invites, but one it can support.
The fourth is that the incidence of product innovation, not the volume of spending, is the observable that tracks commercial outcome. The share of SMEs bringing new products to market is the only variable in the model with a large, robust and mode-invariant association with innovative revenue; innovation expenditure per employee, central to how regional programmes are designed and evaluated, has none once one conditions on whether products reached a market. This is consistent with a literature holding that expenditure indicators misrepresent innovative effort where innovation is incremental and much of it occurs outside formal research (Santamaría, Nieto and Barge-Gil, 2009; Rammer, Czarnitzki and Spielkamp, 2009; Thomä and Zimmermann, 2020; Hou, 2026). We state it as a claim about what the data track rather than about what policy causes, because nothing in this design identifies a causal effect and the leading regressor is in addition partly linked to the outcome by construction. Subject to that caution the implication for evaluation is direct: programmes assessed on expenditure are assessed on an indicator with no measured relationship to the revenue they are meant to generate, while monitoring frameworks tracking the number of firms that bring products to market would at least be measuring something that moves with commercial outcome.
A fifth possibility we flag rather than recommend. The mode taxonomy suggests that design-rights support and process-innovation programmes are associated with innovative sales only in regions with an R&D-intensive and collaborative profile, and that since the taxonomy is nearly orthogonal to the leader–laggard classification this differentiation cannot be read off a region’s Scoreboard position. If the pattern is real, smart-specialisation diagnostics that begin from performance tiers (Foray, David and Hall, 2009; Tödtling and Trippl, 2005) will misallocate these instruments. But the cluster-specific estimates rest on subsamples of thirty to seventy regions, the partition has moderate resampling stability, and the joint test of slope equality is rejected at conventional but not comfortable levels. It is a hypothesis the evidence base could test if it were built to support cross-regional inference — which, on the argument of this paper, it currently is not.
10. Conclusions
This paper asked what the Regional Innovation Scoreboard can identify, using the commercialisation of novelty across 218 European regions over four Community Innovation Survey waves as a demonstration case. The answer is that the source sustains longitudinal inference about a region’s own trajectory, and does not sustain the cross-sectional benchmarking it was designed to invite. Three boundaries establish this.
The first is temporal. The published annual file replicates biennial survey values across the reference years each wave covers while mixing them with genuinely annual registry counts, so the effective panel is half its nominal length. Analyses that do not collapse to survey waves understate standard errors on the registry-based variables by up to forty per cent and reverse one coefficient sign — and the specifications affected are those linking intellectual assets to commercial outcomes, which is what this evidence base is most often asked to support.
The second concerns the direction of inference. For the most important variable in the model, the association estimated across regions has the opposite sign to the association estimated within them over time: regions with persistently high product-innovation incidence do not have persistently high innovative sales, while regions that raise their own incidence do raise their own sales. Leave-one-country-out validation returns negative out-of-sample fit for every learner tested, which locates a substantial part of the cross-sectional variation in national survey implementation rather than in economic behaviour. That benchmarking can recover a relationship of the wrong sign — not merely an imprecise one — has consequences for an evaluation architecture built on comparison.
The third is methodological and applies beyond this application. When flexible learners are evaluated under leakage-free panel designs, the apparent superiority of random forests over the linear specification disappears entirely; it was an artefact of cross-validation folds placing the same region in training and test sets. Used correctly, the same learners confirm the linear model on every dimension on which they were interrogated: they extract no additional signal, they reproduce its ranking of the regressors, and their partial dependence functions track its coefficients closely.
Inside these boundaries the substantive picture is narrow and coherent. Of seven candidate determinants only two are associated with the revenue innovation generates: the share of SMEs introducing product innovations, and trademark activity. Expenditure, business-process innovation and inter-firm collaboration are not, and the two survivors share a property the five failures do not — they describe firms doing something in a market rather than preparing to.
Partitioning regions by how they innovate rather than how well produces four types nearly orthogonal to the official classification, within which the product channel is close to universal while appropriation and process channels are mode-specific. Two types with statistically indistinguishable innovative sales differ by more than a standard deviation in trademark and design intensity, which suggests that formal intellectual property is not what separates European regions that commercialise successfully from those that do not. The policy reading is a common core with differentiated instruments, rather than either uniform or fully place-based design.
These findings are associational, and deliberately so. No design available in this source identifies a causal effect, which is the argument of the paper rather than a concession within it. The leading regressor is in addition partly linked by construction to the outcome, since both are drawn from the same survey and a firm with no product innovation has no new-product turnover by definition; we quantify that dependence rather than set it aside, and note that the trademark and design results, drawn from an independent administrative register, are not subject to it. Breaking the link entirely requires data separating the population of innovators from the revenue they generate, which does not exist at European regional scale today.
The wider stake is not academic. Europe’s difficulty is not the production of knowledge but its conversion into products sold in markets, at a moment when technological capability has become an instrument of strategic competition between the United States and China. If commercialisation is the binding constraint, then measuring it well is a precondition for improving it — and the instrument on which European innovation policy currently relies measures it in a way that, for the mechanism that matters most, points in the wrong direction.
Author Contributions
Funding
Institutional Review Board Statement
Informed Consent Statement
Data Availability Statement
Conflicts of Interest
Appendix A. Supplementary Econometric Material
Table A1.
Share of regions with numerically identical values in adjacent reference years.
| Indicator | 16–17 | 17–18 | 18–19 | 19–20 | 20–21 | 21–22 | 22–23 |
|---|---|---|---|---|---|---|---|
| NEWSALES | 1.000 | 1.000 | 0.028 | 1.000 | 0.045 | 1.000 | 0.093 |
| SMEPI | 1.000 | 1.000 | 0.028 | 1.000 | 0.045 | 1.000 | 0.053 |
| SMEBPI | 1.000 | 1.000 | 0.012 | 1.000 | 0.049 | 1.000 | 0.077 |
| SMECOLL | 1.000 | 1.000 | 0.028 | 1.000 | 0.110 | 1.000 | 0.093 |
| NRDIE | 1.000 | 1.000 | 0.081 | 1.000 | 0.098 | 1.000 | 0.142 |
| IEPE | 1.000 | 1.000 | 0.122 | 1.000 | 0.171 | 1.000 | 0.150 |
Notes: NEWSALES = sales of new-to-market and new-to-firm innovations; SMEPI = SMEs introducing product innovations; SMEBPI = SMEs introducing business process innovations; SMECOLL = innovative SMEs collaborating with others; NRDIE = non-R&D innovation expenditures; IEPE = innovation expenditures per person employed. 245 regional units before sample restrictions, reference years 2016–2023. A value of 1.000 indicates exact replication of the preceding year’s value for every region in the file. Design and trademark applications derive from EUIPO administrative records, vary annually and are not shown. The pattern identifies four survey waves: {2016, 2017, 2018}, {2019, 2020}, {2021, 2022}, {2023}, corresponding to CIS 2016, 2018, 2020 and 2022.
Figure A1.
NEWSALES for three representative regions. Panel (a) as published across annual reference years; panel (b) after collapsing to CIS waves.
Figure A1.
NEWSALES for three representative regions. Panel (a) as published across annual reference years; panel (b) after collapsing to CIS waves.
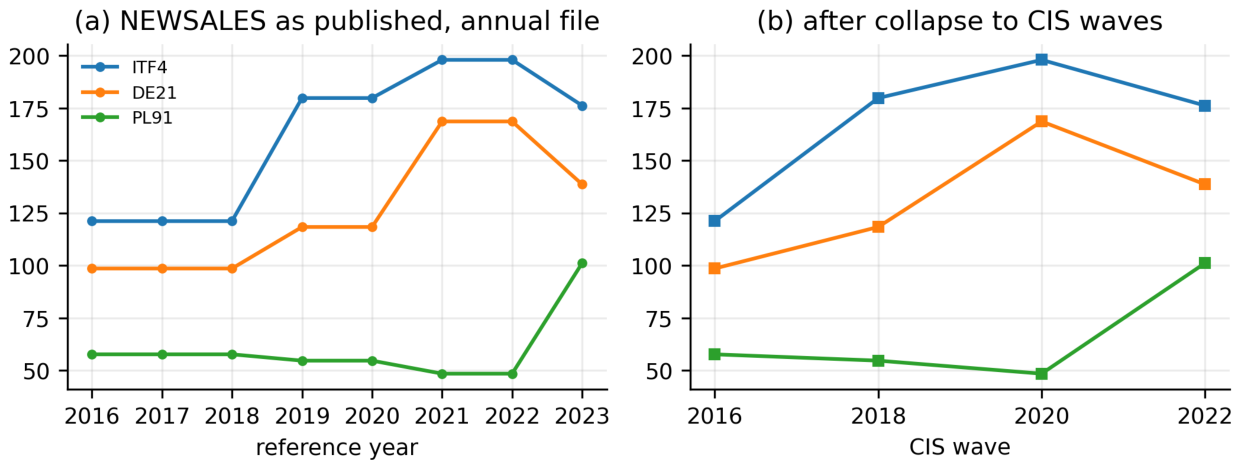
Figure A2.
Share of total variance that is within-region, by indicator. The dashed line at 0.15 marks the level below which within-estimator identification rests on very limited temporal variation.
Figure A2.
Share of total variance that is within-region, by indicator. The dashed line at 0.15 marks the level below which within-estimator identification rests on very limited temporal variation.
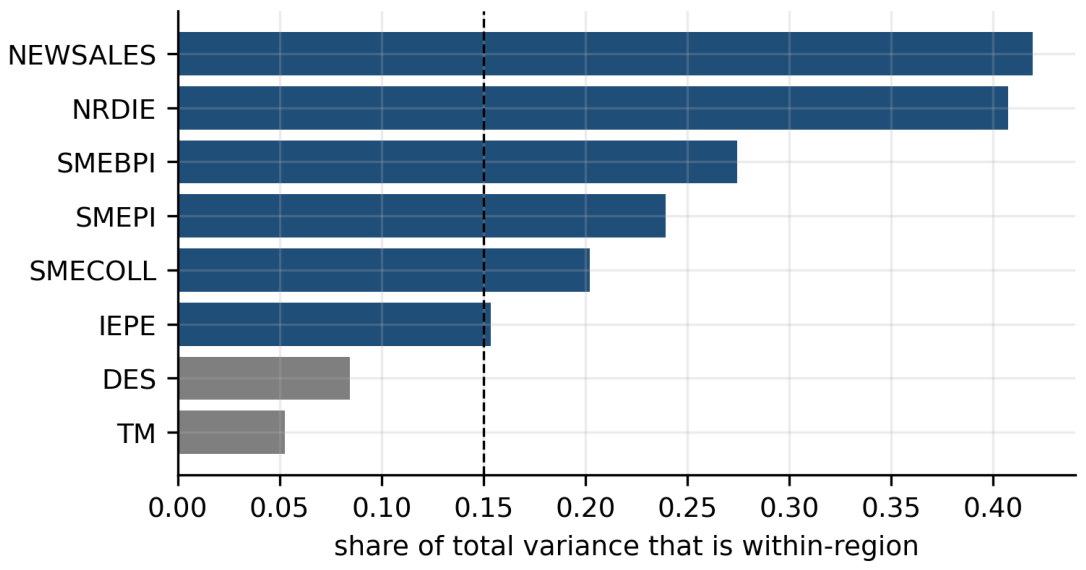
Table A2.
Correlation matrix.
| (1) | (2) | (3) | (4) | (5) | (6) | (7) | (8) | |
|---|---|---|---|---|---|---|---|---|
| (1) NEWSALES | 1.000 | |||||||
| (2) SMEPI | 0.374 | 1.000 | ||||||
| (3) SMEBPI | 0.366 | 0.832 | 1.000 | |||||
| (4) NRDIE | 0.127 | 0.220 | 0.203 | 1.000 | ||||
| (5) IEPE | 0.352 | 0.499 | 0.451 | 0.153 | 1.000 | |||
| (6) DES | −0.069 | 0.080 | 0.053 | −0.102 | 0.012 | 1.000 | ||
| (7) TM | 0.112 | 0.215 | 0.262 | −0.230 | 0.085 | 0.584 | 1.000 | |
| (8) SMECOLL | 0.404 | 0.608 | 0.534 | 0.134 | 0.617 | −0.102 | 0.067 | 1.000 |
Table A3.
Variance inflation factors.
| SMEPI | SMEBPI | NRDIE | IEPE | DES | TM | SMECOLL | |
|---|---|---|---|---|---|---|---|
| In levels | 3.84 | 3.46 | 1.17 | 1.70 | 1.62 | 1.81 | 2.09 |
| Within (region-demeaned) | 1.69 | 1.95 | 1.11 | 1.19 | 1.03 | 1.32 | 1.47 |
Notes: the level VIF of 3.84 for SMEPI reflects its correlation of 0.832 with SMEBPI. The relevant diagnostic for a within estimator is computed on demeaned data, where the maximum is 1.95.
Table A4.
Lagged, first-differenced, weighted and between specifications.
| (7) FE, regressors lagged one wave | (8) First differences | (9) WLS, two-way FE | (10) Between | |
|---|---|---|---|---|
| SMEPI | 0.138 (0.115) | 0.424*** (0.081) | 0.505*** (0.040) | −0.484*** (0.141) |
| SMEBPI | −0.142 (0.103) | 0.115 (0.097) | 0.083** (0.038) | 0.435*** (0.147) |
| NRDIE | −0.168* (0.101) | −0.051 (0.080) | −0.019 (0.034) | 0.300*** (0.106) |
| IEPE | 0.590 (0.368) | −0.053 (0.134) | 0.066 (0.059) | 0.473*** (0.119) |
| DES | −0.094 (0.209) | 0.149 (0.127) | 0.124* (0.070) | −0.196** (0.084) |
| TM | 0.697** (0.304) | 0.184 (0.169) | 0.502*** (0.074) | 0.165** (0.067) |
| SMECOLL | 0.075 (0.081) | −0.044 (0.054) | 0.012 (0.026) | 0.218*** (0.073) |
| Constant | — | — | — | 15.08 (14.59) |
| Observations | 654 | 654 | 872 | 218 |
| R² | 0.057 (within) | — | 0.481 (within) | 0.376 |
Notes: column (7) lags all seven regressors by one CIS wave, with region and wave effects. Column (8) is estimated in first differences with wave dummies and a constant. Column (9) applies weights equal to the inverse of the region-specific residual variance from column (4) of Table 2. Column (10) is the between estimator on region means, with robust standard errors; N equals the number of regions. Standard errors clustered by region in parentheses except column (10).
Table A5.
Standardised within-region coefficients (Table 2, column 4).
Table A5.
Standardised within-region coefficients (Table 2, column 4).
| Variable | Standardised coefficient |
|---|---|
| SMEPI | 0.325 |
| TM | 0.221 |
| NRDIE | −0.075 |
| SMEBPI | 0.063 |
| SMECOLL | 0.060 |
| DES | 0.050 |
| IEPE | −0.002 |
Notes: coefficients multiplied by the within-region standard deviation of the regressor and divided by the within-region standard deviation of the dependent variable.
Table A6.
Diagnostic tests.
| Test | Statistic | p-value | Conclusion |
|---|---|---|---|
| F-test of region fixed effects (poolability) | F = 4.08 | < 0.001 | Rejects pooled OLS |
| Mundlak auxiliary regression, χ²(7) | 82.59 | < 0.001 | Rejects random effects |
| First-order autocorrelation of within residuals | ρ = −0.092 | — | No positive serial dependence |
| Pesaran cross-sectional dependence | CD = −0.273 | 0.785 | No residual cross-sectional dependence |
Notes: the classical Hausman statistic is not reliably computable under clustered covariance, because the difference between the fixed-effects and random-effects variance matrices need not be positive semi-definite. The Mundlak (1978) auxiliary regression augments the random-effects specification with the region means of all regressors and tests their joint significance; it is asymptotically equivalent to Hausman under homoskedasticity and remains valid under clustering.
Table A7.
Robustness of the SMEPI and TM coefficients.
| Check | SMEPI | TM |
|---|---|---|
| Baseline (Table 2, column 4) | 0.466 (0.094), p < 0.001 | 0.717 (0.207), p = 0.001 |
| Wild cluster bootstrap, 999 replications | p = 0.001 | p = 0.001 |
| Winsorised at 1st/99th percentile | 0.463 (0.094), p < 0.001 | 0.734 (0.212), p = 0.001 |
| Log–log specification (elasticity) | 0.432 (0.104), p < 0.001 | 0.442 (0.171), p = 0.010 |
| First differences | 0.424 (0.081), p < 0.001 | 0.184 (0.169), p = 0.278 |
| Country jackknife: range of estimates | [0.378, 0.567] | [0.302, 0.815] |
| Country jackknife: significant at 5% | 29 of 29 | 28 of 29 |
Notes: the wild cluster bootstrap uses Rademacher weights with the null imposed. For SMECOLL the bootstrap returns p = 0.231 against an asymptotic 0.302, confirming the asymptotic inference. The TM coefficient falls to 0.302 with p = 0.066 when the twelve United Kingdom regions are excluded; given a within-region variance share of 0.053, this sensitivity is expected and is stated in the main text.
Table A8.
Reverse causation test.
| Specification | Coefficient | SE | p |
|---|---|---|---|
| SMEPIₜ on NEWSALESₜ₋₁ (controlling SMEPIₜ₋₁, region and wave effects) | 0.032 | 0.040 | 0.421 |
| NEWSALESₜ on SMEPIₜ | 0.560 | 0.131 | < 0.001 |
| NEWSALESₜ on SMEPIₜ₋₁ | 0.197 | 0.091 | 0.031 |
Notes: past commercial success does not predict subsequent product-innovation incidence, while contemporaneous and lagged SMEPI both predict innovative sales. The asymmetry is consistent with the assumed direction of the relationship but does not establish causality.
Table A9.
Wave-collapsed panel versus replicated annual panel.
| Wave panel (T = 4, N = 872) | Annual file (T = 8, N = 1,744) | Change in SE | |||
|---|---|---|---|---|---|
| Coefficient | SE | Coefficient | SE | ||
| SMEPI | 0.466 | 0.094 | 0.434 | 0.088 | −6.9% |
| SMEBPI | 0.084 | 0.113 | 0.140 | 0.110 | −2.4% |
| NRDIE | −0.121 | 0.097 | −0.114 | 0.094 | −2.8% |
| IEPE | −0.005 | 0.135 | +0.116 | 0.152 | +12.8% |
| DES | 0.178 | 0.154 | 0.124 | 0.092 | −40.1% |
| TM | 0.717 | 0.207 | 0.634 | 0.153 | −25.9% |
| SMECOLL | 0.075 | 0.072 | 0.054 | 0.073 | +1.0% |
Notes: both columns estimated on the same 218 regions with region and wave fixed effects and region-clustered standard errors. The annual file replicates each survey value across the reference years covered by the wave.
The share of SMEs introducing product innovations and the share of turnover from new products are collected by the same survey instrument and are partly linked by construction, since a firm introducing no product innovation has zero new-product turnover by definition. Table A10 quantifies how much of the model rests on this relationship.
Table A10.
Estimates excluding SMEPI and rescaling the dependent variable.
| (a) Baseline, Table 2 col. 4 | (b) SMEPI excluded | (c) Dependent = NEWSALES / SMEPI | |
|---|---|---|---|
| SMEPI | 0.466*** (0.094) | — | — |
| SMEBPI | 0.084 (0.113) | 0.273** (0.113) | 0.131 (0.176) |
| NRDIE | −0.121 (0.097) | −0.070 (0.099) | −0.394** (0.179) |
| IEPE | −0.005 (0.135) | −0.135 (0.142) | 0.252 (0.181) |
| DES | 0.178 (0.154) | 0.181 (0.162) | 0.116 (0.246) |
| TM | 0.717*** (0.207) | 0.848*** (0.206) | 0.459 (0.332) |
| SMECOLL | 0.075 (0.072) | 0.146** (0.066) | 0.073 (0.086) |
| Observations | 872 | 872 | 872 |
| Within R² | 0.208 | 0.150 | −0.037 |
Notes: all columns include region and wave fixed effects with region-clustered standard errors. Column (c) scales the dependent variable by the incidence of product innovation, so that the outcome is innovative sales per innovating SME and the definitional link is removed. The within correlation between NEWSALES and SMEPI is 0.410.
Excluding SMEPI reduces the within R² from 0.208 to 0.150 and releases variation previously absorbed by it: business-process innovation (0.273, p = 0.016) and collaboration (0.146, p = 0.026) become significant, and the trademark coefficient rises to 0.848. Scaling the dependent variable by SMEPI eliminates the model’s explanatory power altogether, with a negative within R² and no coefficient significant except non-R&D expenditure with a negative sign.
Two conclusions follow. The SMEPI coefficient should be interpreted as a conditional association containing a definitional component rather than as a causal estimate, and the paper states this explicitly rather than leaving it to be discovered in review. The trademark and design results, drawn from an independent administrative register with no definitional relationship to the survey-based outcome, are not subject to this concern, and the trademark coefficient in fact strengthens when SMEPI is removed.
Appendix B. Supplementary Material on the Clustering Analysis
Table 1.
Internal validation indices across candidate partitions (k-means).
| k | Silhouette | Calinski–Harabasz | Davies–Bouldin | Dunn | R² | η² of NEWSALES | ARI vs EIS group | Gap | s(k) |
|---|---|---|---|---|---|---|---|---|---|
| 2 | 0.324 | 103.30 | 1.185 | 0.113 | 0.324 | 0.207 | 0.164 | 0.797 | 0.020 |
| 3 | 0.255 | 90.04 | 1.448 | 0.123 | 0.456 | 0.248 | 0.171 | 0.906 | 0.025 |
| 4 | 0.246 | 77.04 | 1.475 | 0.089 | 0.519 | 0.342 | 0.182 | 0.937 | 0.028 |
| 5 | 0.244 | 70.99 | 1.354 | 0.119 | 0.571 | 0.344 | 0.156 | 0.998 | 0.024 |
| 6 | 0.234 | 66.15 | 1.433 | 0.119 | 0.609 | 0.446 | 0.166 | 1.039 | 0.027 |
| 7 | 0.230 | 60.78 | 1.347 | 0.129 | 0.633 | 0.422 | 0.119 | 1.049 | 0.024 |
| 8 | 0.222 | 56.61 | 1.407 | 0.129 | 0.654 | 0.430 | 0.131 | 1.071 | 0.030 |
Notes: 218 regions, eight standardised variables. η² is the share of between-cluster variance in the wave-averaged dependent variable. The gap statistic compares the log within-cluster dispersion with the average of 30 uniform reference samples over the data hyper-rectangle; s(k) is the associated reference standard error. The gap never satisfies the Tibshirani stopping rule Gap(k) ≥ Gap(k+1) − s(k+1) within the range examined, which indicates a continuous gradient rather than discrete natural groups.
Figure 1.
Internal indices and outcome discrimination across candidate values of k. The dashed line marks the selected solution.
Figure 1.
Internal indices and outcome discrimination across candidate values of k. The dashed line marks the selected solution.
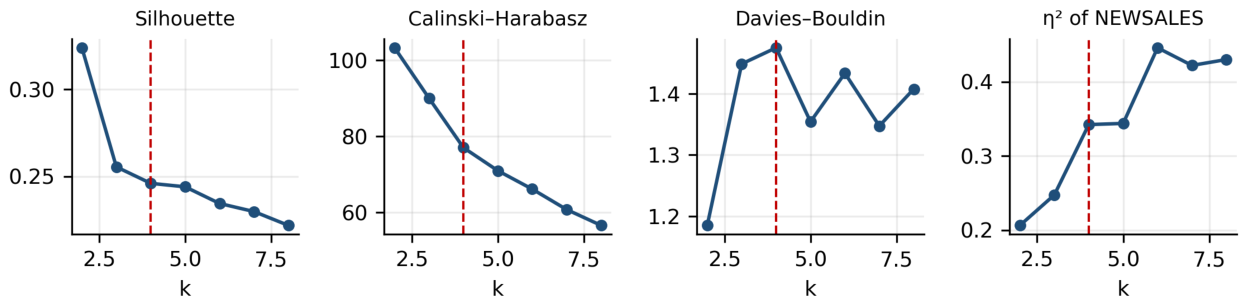
Figure 2.
Silhouette widths for the selected four-cluster k-means partition, by cluster. The dashed line is the overall average of 0.246. Negative widths identify regions closer to a neighbouring cluster than to their own; they are concentrated at the C2–C3 boundary, which is the least sharply separated in the solution.
Figure 2.
Silhouette widths for the selected four-cluster k-means partition, by cluster. The dashed line is the overall average of 0.246. Negative widths identify regions closer to a neighbouring cluster than to their own; they are concentrated at the C2–C3 boundary, which is the least sharply separated in the solution.
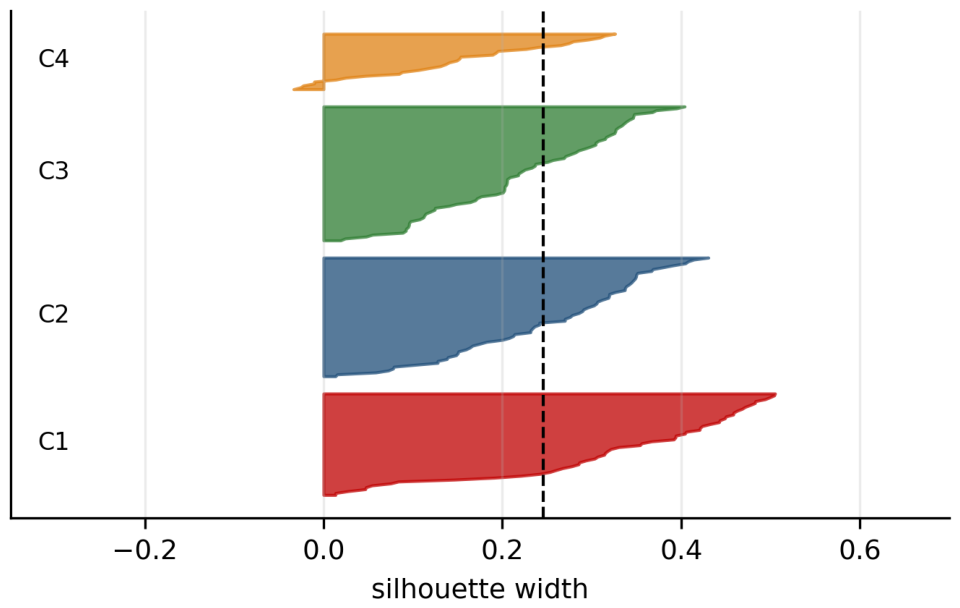
Table 2.
Validation indices.
| Index | Definition | Direction |
|---|---|---|
| R² | Between-cluster sum of squares as a share of total sum of squares | Higher better |
| AIC | −2ℓ + 2m, with ℓ the spherical Gaussian log-likelihood of the partition and m = kp + 1 free parameters | Lower better |
| BIC | −2ℓ + m·log(n) | Lower better |
| Silhouette | Mean over units of (b − a)/max(a, b), with a the mean within-cluster distance and b the mean distance to the nearest other cluster | Higher better |
| Calinski–Harabasz | [BSS/(k−1)] / [WSS/(n−k)] | Higher better |
| Davies–Bouldin | Mean over clusters of the maximum ratio of summed within-cluster scatter to between-centroid distance | Lower better |
| Maximum diameter | Largest within-cluster pairwise distance | Lower better |
| Minimum separation | Smallest between-cluster pairwise distance | Higher better |
| Dunn | Minimum separation divided by maximum diameter | Higher better |
| Pearson gamma | Correlation between the vector of pairwise distances and the binary indicator of belonging to different clusters | Higher better |
| Normalised entropy | −Σ pₖ log pₖ / log k, with pₖ the share of units in cluster k | Higher better |
| Herfindahl–Hirschman | 10,000 × Σ pₖ², measuring concentration of cluster sizes | Lower better |
| Bootstrap ARI | Mean adjusted Rand index between the full-sample partition and partitions refitted on 100 bootstrap resamples and projected back by nearest centroid | Higher better |
Notes: the composite ranking in Table 2 of the main text averages the rank of each algorithm on all thirteen indices, after orienting each so that rank 1 denotes the best value.
Table 3.
Sensitivity of the selected partition.
| Check | Adjusted Rand index vs baseline | Comment |
|---|---|---|
| Clustering on 872 region-wave observations rather than region means | 0.804 | 85.2 per cent of region-waves assigned to their region’s modal cluster; 126 of 218 regions never change cluster, 78 occupy two, 14 occupy three |
| Clustering on the seven regressors, excluding NEWSALES | 0.557 | Moderate agreement: including the outcome shifts roughly one region in four, principally at the C2–C3 boundary |
| k = 3 solution | 0.667 | C2 and C3 merge |
| k = 5 solution | 0.715 | C3 splits; C1 and C4 unchanged |
| k = 2 solution | 0.339 | Pure level split, no compositional content |
| k = 6 solution | 0.607 | Further subdivision of C2 and C3 |
Notes: the low temporal mobility of cluster membership — 58 per cent of regions never change cluster across four waves — supports treating the types as structural characteristics rather than transient states, and justifies clustering on region averages.
Table 4.
Cluster membership by Scoreboard performance group.
| Emerging | Moderate | Strong | Leader | Total | |
|---|---|---|---|---|---|
| C1 Lagging | 36 | 14 | 4 | 0 | 54 |
| C2 IP-intensive | 0 | 12 | 27 | 24 | 63 |
| C3 Non-R&D middle | 12 | 37 | 20 | 2 | 71 |
| C4 Collaborative R&D | 0 | 6 | 19 | 5 | 30 |
Notes: adjusted Rand index between the cluster partition and the performance-group classification is 0.182; against country membership, 0.167. C2 and C4 both draw predominantly on Strong and Leader regions but differ sharply in composition, which is the substantive content of the taxonomy: the official classification cannot distinguish an appropriation-intensive from a collaboration-intensive innovation system.
Principal country composition of each type: C1 — Spain (16 regions), Poland (16), Hungary (8), Bulgaria (6), Slovakia (4); C2 — Germany (26), Italy (8), Netherlands (7), Denmark (4), Sweden (4), Austria (3); C3 — Italy (13), Germany (12), France (10), Czechia (7), Greece (5), Netherlands (5), Portugal (5); C4 — United Kingdom (11), Greece (5), Norway (5), Belgium (3), Finland (2), Ireland (2).
Figure 3.
Distribution of the wave-averaged dependent variable by cluster. Diamonds mark cluster means; the dashed line is the sample mean.
Figure 3.
Distribution of the wave-averaged dependent variable by cluster. Diamonds mark cluster means; the dashed line is the sample mean.
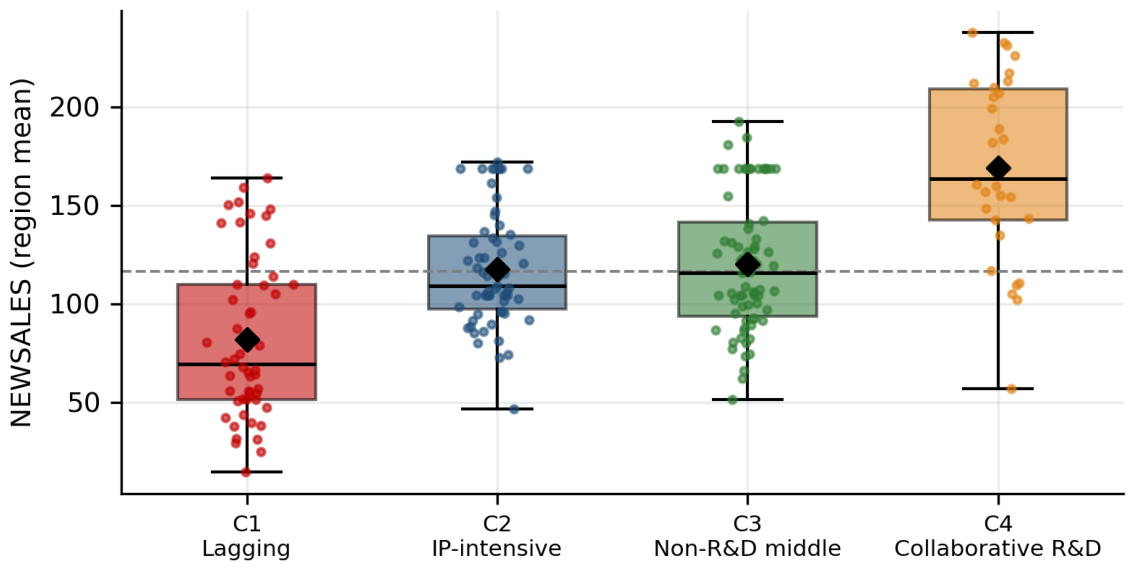
Table 5.
Two-way fixed-effects estimates interacted with cluster membership.
| Variable | C1 Lagging | C2 IP-intensive | C3 Non-R&D middle | C4 Collaborative R&D | χ² equality | p |
|---|---|---|---|---|---|---|
| SMEPI | 0.713** (0.277) | 0.385*** (0.104) | 0.636*** (0.150) | −0.043 (0.205) | 9.08 | 0.028 |
| SMEBPI | −0.087 (0.210) | 0.129 (0.126) | −0.076 (0.176) | 0.497*** (0.179) | 6.83 | 0.078 |
| NRDIE | −0.134 (0.132) | 0.186 (0.182) | −0.167 (0.123) | 0.097 (0.337) | 3.21 | 0.361 |
| IEPE | 0.023 (0.241) | 0.112 (0.316) | −0.276 (0.197) | 1.536** (0.650) | 7.63 | 0.054 |
| DES | 0.071 (0.189) | −0.136 (0.277) | 0.081 (0.240) | 1.370* (0.812) | 3.19 | 0.363 |
| TM | 0.297 (0.339) | 0.528** (0.230) | 1.400*** (0.358) | 0.568 (0.410) | 6.52 | 0.089 |
| SMECOLL | −0.033 (0.296) | −0.040 (0.073) | 0.053 (0.099) | 0.160 (0.215) | 1.22 | 0.748 |
Notes: dependent variable NEWSALES; region and wave fixed effects; standard errors clustered by region in parentheses. Cluster membership is time-invariant and absorbed by the region effects, so only interactions are identified. Joint test of equality of all slopes across the four types: χ²(21) = 63.25, p < 0.001. *** p<0.01, ** p<0.05, * p<0.10.
Table 6.
Tests of outcome separation across clusters.
| Test | Statistic | p-value |
|---|---|---|
| One-way ANOVA on NEWSALES, F(3, 214) | 37.12 | 2.3 × 10⁻¹⁹ |
| Kruskal–Wallis H | 61.17 | 3.3 × 10⁻¹³ |
| η² (between-cluster share of outcome variance) | 0.342 | — |
| Welch test, C1 vs C2 (difference +35.9) | t = −5.40 | < 0.001 |
| Welch test, C1 vs C3 (difference +38.4) | t = −5.58 | < 0.001 |
| Welch test, C1 vs C4 (difference +87.3) | t = −8.61 | < 0.001 |
| Welch test, C2 vs C3 (difference +2.4) | t = −0.44 | 0.658 |
| Welch test, C2 vs C4 (difference +51.3) | t = −5.55 | < 0.001 |
| Welch test, C3 vs C4 (difference +48.9) | t = −5.19 | < 0.001 |
Three limitations bound the reading of this section.
The clustering space includes the dependent variable, which guarantees that clusters differ on the outcome and makes the ANOVA of Table B6 descriptive rather than a test of an independent hypothesis. The informative quantities are the compositional differences among types with similar outcomes — most importantly the 1.6 standard deviation gap in appropriation activity between C2 and C3, whose mean outcomes are statistically indistinguishable — and the cluster-specific slopes of Table B5, which are estimated from within-region variation and are not mechanically induced by the partition.
The internal validation indices do not identify a natural number of clusters, and the gap statistic indicates a continuous gradient. The four-type partition is an analytical device for testing slope heterogeneity, not a claim that European regions fall into four discrete kinds. Its bootstrap adjusted Rand index of 0.749 indicates that the partition is reproducible under resampling, which is a weaker property than natural separation.
The cluster-specific estimates rest on subsamples ranging from 30 to 71 regions, so the C4 estimates in particular are imprecise: the confidence interval on its innovation-expenditure coefficient spans 0.26 to 2.81. The finding that the product-innovation channel is inoperative in C4 should be read as an absence of detectable association in the smallest group rather than as an established null.
Appendix C. Supplementary Material on the Machine-Learning Validation
Table 1.
Algorithm specifications.
| Algorithm | Configuration | Free parameters |
|---|---|---|
| Linear regression | Ordinary least squares on within-transformed data | 7 |
| Linear SVM | ε-insensitive support vector regression, linear kernel, C = 1, ε = 5, standardised inputs | 7 + support vectors |
| KNN | k = 5, distance weighting, standardised inputs | none (memory-based) |
| Random forest | 600 trees, minimum leaf size 3, all features considered at each split | ensemble |
| Boosted decision tree | 400 stages, maximum depth 3, learning rate 0.05, squared-error loss | ensemble |
Notes: hyperparameters are fixed a priori at conventional defaults and are not tuned within the evaluation folds, since selecting a configuration on the same partitions used to assess it reintroduces optimism through a second channel. Table C2 reports sensitivity.
Table 2.
Sensitivity of leave-one-wave-out R² to hyperparameters.
| Configuration | R² | Configuration | R² |
|---|---|---|---|
| RF, leaf 10, 300 trees | 0.091 | GBM, lr 0.02, depth 3 | 0.049 |
| RF, leaf 10, 600 trees | 0.089 | RF, leaf 1, 600 trees | 0.044 |
| RF, leaf 5, 300 trees | 0.084 | KNN, k = 10 | 0.041 |
| Linear regression | 0.077 | KNN, k = 5 | 0.012 |
| SVM, C = 0.1 | 0.072 | GBM, lr 0.05, depth 3 | 0.009 |
| KNN, k = 20 | 0.072 | GBM, lr 0.10, depth 2 | −0.019 |
| RF, leaf 3, 600 trees | 0.067 | KNN, k = 3 | −0.026 |
| SVM, C = 1 | 0.066 | KNN, k = 1 | −0.247 |
Notes: 30 configurations evaluated; a representative selection is shown. Two observations follow. First, the best flexible configuration — a random forest with minimum leaf size 10 — attains 0.091 against 0.077 for linear regression, a difference of 0.014 that is smaller than the standard deviation of the fold-level differences (0.056) and is itself optimistic, since it is the maximum over thirty configurations selected on the same folds used for evaluation. Second, and more informative, performance among the forests is monotonically increasing in the degree of regularisation: leaf size 1 gives 0.044, leaf size 3 gives 0.067, leaf size 5 gives 0.084 and leaf size 10 gives 0.091. The best-performing flexible learner is the one constrained to behave most nearly like a smooth global function, which is a further indication that the data contain no exploitable local structure.
Table 3.
Optimism induced by the random-fold design.
| Algorithm | D1 random 5-fold | D2 leave-one-wave-out | Optimism (D1 − D2) |
|---|---|---|---|
| Linear regression | 0.176 | 0.077 | 0.099 |
| Linear SVM | 0.170 | 0.066 | 0.104 |
| KNN | 0.202 | 0.012 | 0.190 |
| Random forest | 0.261 | 0.067 | 0.194 |
| Boosted decision tree | 0.163 | 0.009 | 0.154 |
Notes: R² values. Optimism is largest for the two learners with the greatest capacity to memorise individual observations, which is the expected signature of within-panel leakage. The parametric learners, which cannot represent a single region’s level without spending a coefficient on it, are least affected.
Table 4.
Paired comparison of linear regression and random forest by held-out wave.
| Held-out wave | Linear regression R² | Random forest R² | Difference |
|---|---|---|---|
| 1 (CIS 2016) | 0.132 | 0.102 | −0.030 |
| 2 (CIS 2018) | −0.036 | 0.018 | +0.055 |
| 3 (CIS 2020) | 0.116 | 0.131 | +0.015 |
| 4 (CIS 2022) | 0.097 | 0.017 | −0.080 |
| Mean | 0.077 | 0.067 | −0.010 |
Notes: paired t-test on the four differences: t = −0.34, p = 0.755. The sign of the difference alternates across waves, which is what one expects when two models of comparable quality are compared on small test sets. The negative R² for the second wave, common to both models, reflects the CIS 2018 wave being poorly predicted by the remaining three for both learners.
Figure 1.
Mean absolute error and root mean squared error under the leave-one-wave-out design.
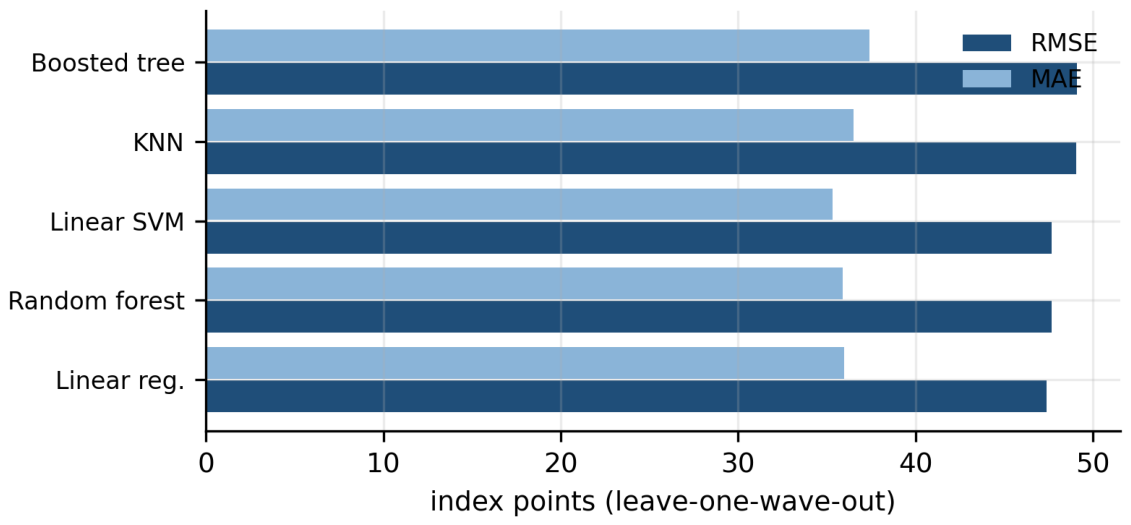
Figure 2.
Out-of-fold predictions against observed within-region deviations under the leave-one-wave-out design, for three representative learners. The dashed line is the 45-degree line. All three learners compress the predicted range substantially relative to the observed range, which is the visual counterpart of an out-of-sample R² below 0.10.
Figure 2.
Out-of-fold predictions against observed within-region deviations under the leave-one-wave-out design, for three representative learners. The dashed line is the 45-degree line. All three learners compress the predicted range substantially relative to the observed range, which is the visual counterpart of an out-of-sample R² below 0.10.
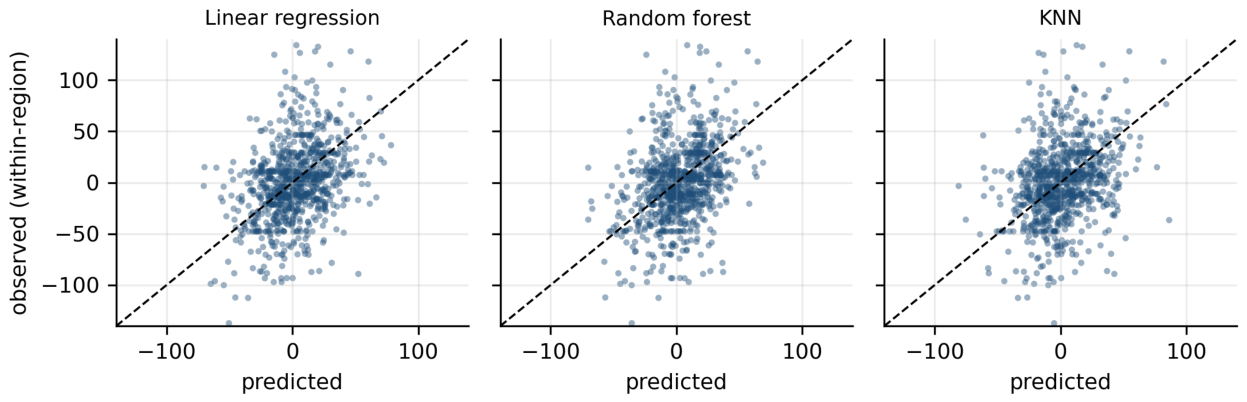
Table 5.
Parametric tests of the linear specification.
| Test | Statistic | p-value | Conclusion |
|---|---|---|---|
| Ramsey RESET, fitted values to powers 2 and 3 | F = 3.92 | 0.141 | No evidence of neglected non-linearity |
| Joint test of seven squared terms | F = 9.57 | 0.214 | No evidence of curvature |
| Joint test of twenty-one pairwise interactions | F = 30.66 | 0.080 | Marginal; consistent with cross-type slope heterogeneity |
Notes: all tests estimated on within-transformed data with wave dummies and standard errors clustered by region. The marginal interaction result should be read alongside the clustering analysis, where the hypothesis of a common commercialisation function across regional types is rejected at χ²(21) = 63.25. The pooled specification cannot accommodate that heterogeneity, and the interaction test is picking up its trace.
References
- Abdelhamid, M.B.; Casadella, V.; Tahi, S. ‘Mapping ERDF’s Strategic Intervention in Regional Innovation Performance’. J. Innov. Manag. 2024, 12(4), 33–49. [Google Scholar] [CrossRef]
- Abudaqa, A.; Alzahmi, R.A.; Almujaini, H.; Ahmed, G. ‘Does innovation moderate the relationship between digital facilitators, digital transformation strategies and overall performance of SMEs of UAE?’. Int. J. Entrep. Ventur. 2022, 14(3), 330–350. [Google Scholar] [CrossRef]
- Adiguzel, Z.; Sonmez Cakir, F.; Altay Morgul, U. ‘Enhancing firm performance and sustainability through creativity-oriented HRM and quality management: the mediating role of commercialization in the IT sector’. Int. J. Qual. Reliab. Manag. 2025. [Google Scholar] [CrossRef]
- Adjimah, H.P.; Atiase, V.; Dzansi, D.Y. ‘Do government incentives increase indigenous innovation commercialisation? Empirical evidence from local Ghanaian firms’. Int. J. Entrep. Behav. Res. 2025, 31(2-3), 287–313. [Google Scholar] [CrossRef]
- Adjimah, H.P.; Atiase, V.Y.; Dzansi, D.Y. ‘Examining the Role of Regulation in the Commercialisation of Indigenous Innovation in Sub-Saharan African Economies: Evidence from the Ghanaian Small-Scale Industry’. Adm. Sci. 2022, 12(3), art. 118. [Google Scholar] [CrossRef]
- Adomako, S.; Tran, M.D. ‘Geographical Location, Green Technology Commercialization, and Sustainable Innovation’. Sustain. Dev. 2026a, 34(S2), 1–14. [Google Scholar] [CrossRef]
- Adomako, S.; Tran, M.D. ‘Innovating against the odds? The impact of regulatory challenges on technology commercialization and product innovation performance’. Technol. Soc. 2026b, 85, art. 103214. [Google Scholar] [CrossRef]
- Afcha, S.; Lucena, A. ‘R&D subsidies and firm innovation: does human capital matter?’. Ind. Innov. 2022, 29(10), 1171–1201. [Google Scholar] [CrossRef]
- Aiello, F.; Cardamone, P.; Mannarino, L.; Pupo, V. ‘Does external R&D matter for family firm innovation? Evidence from the Italian manufacturing industry’. Small Bus. Econ. 2021, 57(4), 1915–1930. [Google Scholar] [CrossRef]
- Aisjah, S.; Arsawan, I.W.E.; Suhartanto, D. ‘Predicting SME’s business performance: Integrating stakeholder theory and performance based innovation model’. J. Open Innov. Technol. Mark. Complex. 2023, 9(3), art. 100122. [Google Scholar] [CrossRef]
- Alcalde-Heras, H.; Carrillo-Carrillo, F. ‘The effects of business innovation modes on eco-innovation: where do environmental benefits materialize?’. Eur. Plan. Stud. 2024, 32(12), 2516–2534. [Google Scholar] [CrossRef]
- Alcalde-Heras, H.; Oleaga, M.; Sisti, E. ‘The dynamics of regional collaborations on firms’ ability to innovate: a business innovation modes approach’. Compet. Rev. 2023, 33(4), 663–689. [Google Scholar] [CrossRef]
- Alhusen, H.; Bennat, T. ‘Combinatorial innovation modes in SMEs: mechanisms integrating STI processes into DUI mode learning and the role of regional innovation policy’. European Planning Studies 2020, 1–27. [Google Scholar] [CrossRef]
- Aliasghar, O.; Kanani; Moghadam, V. ‘Selective search and new-to-market process innovation’. J. Manuf. Technol. Manag. 2022. [Google Scholar] [CrossRef]
- Al-Qudah, M.A.K.A.; Al Wraikat, M.A.; Albalawee, N.; Shakhatreh, H.J.M.; Al-Marashdeh, Z.M.; Alazzam, F.A. ‘TRADEMARKS (FAMOUS AND COMMON) PROVISIONS AND PROTECT IT IN ACCORDANCE WITH INTERNATIONAL AGREEMENTS AND TREATIES; [DISPOSIÇÕES SOBRE MARCAS REGISTRADAS (FAMOSAS E COMUNS) E SUA PROTEÇÃO DE ACORDO COM ACORDOS E TRATADOS INTERNACIONAIS]’. Rev. Jurid. 2025, 2(82), 362–379. [Google Scholar] [CrossRef]
- Amoncio, E.; Chan, T.; Storz, C. ‘Using computer vision to measure design similarity: An application to design rights’. Res. Policy 2025, 54(9), art. 105309. [Google Scholar] [CrossRef]
- Andriyani, Y.; Suripto, Yohanitas W.A.; Kartika, R.S.; Marsono. ‘Adaptive innovation model design: Integrating agile and open innovation in regional areas innovation’. J. Open Innov. Technol. Mark. Complex. 2024, 10(1), art. 100197. [Google Scholar] [CrossRef]
- Ardito, L.; Svensson, R. ‘Sourcing applied and basic knowledge for innovation and commercialization success’. J. Technol. Transf. 2024, 49(3), 959–995. [Google Scholar] [CrossRef]
- Arellano, M.; Bond, S. ‘Some tests of specification for panel data: Monte Carlo evidence and an application to employment equations’. Rev. Econ. Stud. 1991, 58(2), 277–297. [Google Scholar] [CrossRef]
- Aronica, M.; Fazio, G.; Piacentino, D. ‘A micro-founded approach to regional innovation in Italy’. Technol. Forecast. Soc. Change 2022, 176, art. 121494.0. [Google Scholar] [CrossRef]
- Arthur, D.; Moizer, J.; Lean, J. ‘A systems approach to mapping UK regional innovation ecosystems for policy insight’. Ind. High. Educ. 2023, 37(2), 193–207. [Google Scholar] [CrossRef]
- Asgari, M.J.; Zakery, A.; Pishvaee, M.S. ‘Open innovation antecedents and its consequences on commercialization performance in small and medium-sized enterprises’. Kybernetes 2022, 51(2), 804–826. [Google Scholar] [CrossRef]
- Asheim, B.T.; Coenen, L. ‘Knowledge bases and regional innovation systems: comparing Nordic clusters’. Res. Policy 2005, 34(8), 1173–1190. [Google Scholar] [CrossRef]
- Athey, S.; Imbens, G.W. ‘Machine learning methods that economists should know about’. Annual Review of Economics 2019, 11, 685–725. [Google Scholar] [CrossRef]
- Athreye, S.; Fassio, C. ‘Why do innovators not apply for trademarks? The role of information asymmetries and collaborative innovation’. Ind. Innov. 2020, 27(1-2), 134–154. [Google Scholar] [CrossRef]
- Audretsch, D.B.; Belitski, M.; Caiazza, R. ‘Start-ups, Innovation and Knowledge Spillovers’. J. Technol. Transf. 2021, 46(6), 1995–2016. [Google Scholar] [CrossRef]
- Ayerbe, C.; Boulos, C.; Castellaneta, F. ‘Navigating protection mechanisms and innovation models: A literature-based configurational framework of intellectual property strategies’. Technovation 2024, 137, art. 103101. [Google Scholar] [CrossRef]
- Barbero, J.; Zabala-Iturriagagoitia, J.M.; Zofío, J.L. ‘Is more always better? On the relevance of decreasing returns to scale on innovation’. Technovation 2021, 107, art. 102314.0. [Google Scholar] [CrossRef]
- Beynon, M.; Jones, P.; Pickernell, D. ‘Innovation and the knowledge-base for entrepreneurship: investigating SME innovation across European regions using fsQCA’. Entrep. Reg. Dev. 2021, 33(3-4), 227–248. [Google Scholar] [CrossRef]
- Beynon, M.; Pickernell, D.; Battisti, M.; Jones, P. ‘A panel fsQCA investigation on European regional innovation’. Technol. Forecast. Soc. Change 2024, 199, art. 123042. [Google Scholar] [CrossRef]
- Bezdek, J.C. Pattern Recognition with Fuzzy Objective Function Algorithms; Plenum Press: New York, 1981. [Google Scholar]
- Bielińska-Dusza, E.; Hamerska, M. ‘Methodology for calculating the european innovation scoreboard—proposition for modification’. Sustainability 2021, 13(4), 1–21. [Google Scholar] [CrossRef]
- Biscione, A.; Burlina, C.; de Felice, A. ‘Knowledge flows and innovation: a pseudo-panel approach’. Appl. Econ. 2024, 56(30), 3636–3651. [Google Scholar] [CrossRef]
- Blind, K.; Krieger, B.; Pellens, M. ‘The interplay between product innovation, publishing, patenting and developing standards’. Res. Policy 2022, 51(7), art. 104556. [Google Scholar] [CrossRef]
- Blind, K.; Lorenz, A.; Rauber, J. ‘Drivers for Companies’ Entry into Standard-Setting Organizations’. IEEE Trans. Eng. Manag. 2021, 68(1), 33–44. [Google Scholar] [CrossRef]
- Blind, K.; Niebel, C.; Rammer, C. ‘The impact of the EU General data protection regulation on product innovation’. Ind. Innov. 2024, 31(3), 311–351. [Google Scholar] [CrossRef]
- Block, J.; Fisch, C.; Ikeuchi, K.; Kato, M. ‘Trademarks as an indicator of regional innovation: evidence from Japanese prefectures’. Reg. Stud. 2022, 56(2), 190–209. [Google Scholar] [CrossRef]
- Block, J.; Lambrecht, D.; Willeke, T.; Cucculelli, M.; Meloni, D. ‘Green patents and green trademarks as indicators of green innovation’. Res. Policy 2025, 54(1), art. 105138. [Google Scholar] [CrossRef]
- Breiman, L. ‘Random forests’. Mach. Learn. 2001a, 45(1), 5–32. [Google Scholar]
- Breiman, L. ‘Statistical modeling: the two cultures’. Stat. Sci. 2001b, 16(3), 199–231. [Google Scholar] [CrossRef]
- Brixner, C.; Romano, S.A.; Zabala-Iturriagagoitia, J.M. ‘Analysing the differences in the scientific diffusion and policy impact of analogous theoretical approaches: Evidence for territorial innovation models’. J. Scientometr. Res. 2021, 10(1), E46–E58. [Google Scholar] [CrossRef]
- Bruno, E.; Castellano, R.; Punzo, G.; Salvati, L. ‘Innovation and digitalisation in European regions: addressing spatial issues through GWR-SAR approach’. Ann. Oper. Res. 2026, 363(1), 609–636. [Google Scholar] [CrossRef]
- Caliński, T.; Harabasz, J. ‘A dendrite method for cluster analysis’. Commun. Stat. 1974, 3(1), 1–27. [Google Scholar] [CrossRef]
- Camagni, R.; Capello, R. ‘Regional innovation patterns and the EU regional policy reform: toward smart innovation policies’. Growth Change 2013, 44(2), 355–389. [Google Scholar] [CrossRef]
- Cameron, A.C.; Gelbach, J.B.; Miller, D.L. ‘Bootstrap-based improvements for inference with clustered errors’. Rev. Econ. Stat. 2008, 90(3), 414–427. [Google Scholar] [CrossRef]
- Capello, R.; Lenzi, C. ‘Territorial patterns of innovation and economic growth in European regions’. Growth Change 2013, 44(2), 195–227. [Google Scholar] [CrossRef]
- Caravella, S.; Crespi, F. ‘Unfolding heterogeneity: The different policy drivers of different eco-innovation modes’. Environ. Sci. Policy 2020, 114, 182–193. [Google Scholar] [CrossRef]
- Castaldi, C. ‘To trademark or not to trademark: the case of the creative and cultural industries’. Res. Policy 2018, 47(3), 606–616. [Google Scholar] [CrossRef]
- Cerpentier, M.; Schulze, A.; Vanacker, T.; Zahra, S.A. ‘Employment protection laws and the commercialization of new products: A cross-country study’. Res. Policy 2024, 53(7), art. 105039. [Google Scholar] [CrossRef]
- CHEAH, S.L.-Y.; HO, Y.-P. ‘Commercialization performance of outbound open innovation projects in public research organizations: The roles of innovation potential and organizational capabilities’. Ind. Mark. Manag. 2021, 94, 229–241. [Google Scholar] [CrossRef]
- Chebo, A.K.; Wubatie, Y.F. ‘Commercialisation of technology through technology entrepreneurship: the role of strategic flexibility and strategic alliance’. Technol. Anal. Strateg. Manag. 2021, 33(4), 414–425. [Google Scholar] [CrossRef]
- Chen, Y.; Shi, Q.; Tan, Y.; Wang, S. ‘Foreign Technology Dependence, Competition Pressure and Firm-Level Innovation Mode Choice: Theory and Evidence From China’. Rev. Int. Econ. 2026, 34(1), 151–177. [Google Scholar] [CrossRef]
- Choo, A.; Narayanan, S.; Srinivasan, R.; Sarkar, S. ‘Introducing goods innovation, service innovation, or both? Investigating the tension in managing innovation revenue streams for manufacturing and service firms’. J. Oper. Manag. 2021, 67(6), 704–728. [Google Scholar] [CrossRef]
- Cipollina, M.; De Pascale, G. ‘Innovation ingredients, gross domestic product and productivity: A spatial panel analysis of European regions’. Structural Change and Economic Dynamics 2026, 80, 111–121. [Google Scholar] [CrossRef]
- Cohen, W.M.; Levinthal, D.A. ‘Absorptive capacity: a new perspective on learning and innovation’. Adm. Sci. Q. 1990, 35(1), 128–152. [Google Scholar] [CrossRef]
- Colombo, M.G.; Foss, N.J.; Lyngsie, J.; Rossi Lamastra, C. ‘What drives the delegation of innovation decisions? The roles of firm innovation strategy and the nature of external knowledge’. Res. Policy 2021, 50(1), art. 104134. [Google Scholar] [CrossRef]
- Corrente, S.; Garcia-Bernabeu, A.; Greco, S.; Makkonen, T. ‘Robust measurement of innovation performances in Europe with a hierarchy of interacting composite indicators’. Econ. Innov. New Technol. 2023, 32(2), 305–322. [Google Scholar] [CrossRef]
- Costantiello, A. ‘Innovation Without Borders? International Openness, Design, and the Uneven Geography of Italian Innovation’. Industria 2025, XLVI(4), 583–622. [Google Scholar] [CrossRef]
- Coutinho, E.M.O.; Au-Yong-Oliveira, M. ‘Factors Influencing Innovation Performance in Portugal: A Cross-Country Comparative Analysis Based on the Global Innovation Index and on the European Innovation Scoreboard’. Sustainability 2023, 15(13), art. 10446. [Google Scholar] [CrossRef]
- Crass, D. ‘Which firms use trademarks? Firm-level evidence from Germany on the role of distance, product quality and innovation’. Ind. Innov. 2020, 27(7), 730–755. [Google Scholar] [CrossRef]
- Crépon, B.; Duguet, E.; Mairesse, J. ‘Research, innovation and productivity: an econometric analysis at the firm level’. Econ. Innov. New Technol. 1998, 7(2), 115–158. [Google Scholar] [CrossRef]
- Cui, Z.; Li, E. ‘Does Industry-University-Research Cooperation Matter? An Analysis of Its Coupling Effect on Regional Innovation and Economic Development’. Chin. Geogr. Sci. 2022, 32(5), 915–930. [Google Scholar] [CrossRef]
- Daizadeh, I. ‘Trademark and patent applications are structurally near-identical and cointegrated: Implications for studies in innovation’. Iberoam. J. Sci. Meas. Commun. 2021, 1(2). [Google Scholar] [CrossRef]
- Damiani, F.; Muzzioli, S.; De Baets, B. ‘A poset-based analysis of regional innovation at European level’. Econ. Innov. New Technol. 2026. [Google Scholar] [CrossRef]
- Davies, D.L.; Bouldin, D.W. ‘A cluster separation measure’. IEEE Trans. Pattern Anal. Mach. Intell. 1979, 1(2), 224–227. [Google Scholar] [CrossRef]
- de Rassenfosse, G. ‘On the price elasticity of demand for trademarks’. Ind. Innov. 2020, 27(1-2), 11–24. [Google Scholar] [CrossRef]
- deGrazia, C.A.W.; Myers, A.; Toole, A.A. ‘Innovation activities and business cycles: are trademarks a leading indicator?’. Ind. Innov. 2020, 27(1-2), 184–203. [Google Scholar] [CrossRef]
- Dhingra, J. ‘Remedy for Trademark Infringing Domain Names and Counterfeits’. J. World Trade 2023, 57(4), 643–662. [Google Scholar] [CrossRef]
- Dimakopoulou, A.G.; Chatzistamoulou, N.; Kounetas, K.; Tsekouras, K. ‘Environmental innovation and R&D collaborations: Firm decisions in the innovation efficiency context’. J. Technol. Transf. 2023, 48(4), 1176–1205. [Google Scholar] [CrossRef]
- Disoska, E.M.; Toshevska-Trpchevska, K.; Tevdovski, D.; Jolakoski, P.; Stojkoski, V. ‘A Pooled Overview of the European National Innovation Systems Through the Lenses of the Community Innovation Survey’. J. Knowl. Econ. 2024, 15(1), 3660–3684. [Google Scholar] [CrossRef]
- Doloreux, D.; Shearmur, R. ‘Does location matter? STI and DUI innovation modes in different geographic settings’. Technovation 2023, 119, art. 102609. [Google Scholar] [CrossRef]
- Doloreux, D.; Shearmur, R. ‘Innovation modes in the peripheral economy’. J. Evol. Econ. 2026, 36(1), art. 29. [Google Scholar] [CrossRef]
- Dunn, J.C. ‘A fuzzy relative of the ISODATA process and its use in detecting compact well-separated clusters’. J. Cybern. 1973, 3(3), 32–57. [Google Scholar] [CrossRef]
- Dworak, E. ‘The Innovativeness of the Economies of European Union Candidate Countries – an Assessment of Their Innovation Gap in Relation to the EU Average; [Innowacyjność gospodarek krajów kandydujących do Unii Europejskiej – ocena luki innowacyjnej w stosunku do średniej unijnej]’. Comp. Econ. Res. 2024, 27(3), 7–21. [Google Scholar] [CrossRef]
- Edquist, C.; Zabala-Iturriagagoitia, J.M.; Barbero, J.; Zofío, J.L. ‘On the meaning of innovation performance: is the synthetic indicator of the Innovation Union Scoreboard flawed?’. Res. Eval. 2018, 27(3), 196–211. [Google Scholar] [CrossRef]
- Engez, A.; Aarikka-Stenroos, L. ‘Stakeholder contributions to commercialization and market creation of a radical innovation: bridging the micro- and macro levels’. J. Bus. Ind. Mark. 2022, 38(13), 31–44. [Google Scholar] [CrossRef]
- Ester, M.; Kriegel, H.-P.; Sander, J.; Xu, X. ‘A density-based algorithm for discovering clusters in large spatial databases with noise’. In Proceedings of the Second International Conference on Knowledge Discovery and Data Mining (KDD-96), 1996; pp. 226–231. [Google Scholar]
- Fabri, S.; Pace, L.A.; Cassar, V.; Bezzina, F. ‘Understanding the determinants of innovation across European member states: a fuzzy-set approach’. Int. J. Innov. Sci. 2025, 17(2), 356–372. [Google Scholar] [CrossRef]
- Faurel, L.; Li, Q.; Shanthikumar, D.; Teoh, S.H. ‘Bringing Innovation to Fruition: Insights From New Trademarks’. J. Financ. Quant. Anal. 2024, 59(2), 474–520. [Google Scholar] [CrossRef]
- Filipova, M.K.; Prokopenko, O.; Krišková, P.; Halynskyi, D. ‘From knowledge creation to commercialization performance: Non-linear effects on green and digital energy start-ups’. Knowl. Perform. Manag. 2026, 10(2), 122–142. [Google Scholar] [CrossRef]
- Filitz, R.; Henkel, J.; Tether, B.S. ‘Protection by design right: an economic perspective on design rights’. Res. Policy 2015, 44(6), 1192–1206. [Google Scholar]
- Fisher, A.; Rudin, C.; Dominici, F. ‘All models are wrong, but many are useful: learning a variable’s importance by studying an entire class of prediction models simultaneously’. J. Mach. Learn. Res. 2019, 20(177), 1–81. [Google Scholar]
- Flikkema, M.; Castaldi, C.; de Man, A.-P. ‘On trademarks and innovation: a retrospective, 10 years later’. Ind. Innov. 2025, 32(9), 1081–1086. [Google Scholar] [CrossRef]
- Flikkema, M.; De Man, A.-P.; Castaldi, C. ‘Are trademark counts a valid indicator of innovation? Results of an in-depth study of new Benelux trademarks filed by SMEs’. Ind. Innov. 2014, 21(4), 310–331. [Google Scholar] [CrossRef]
- Foray, D.; David, P.A.; Hall, B.H. ‘Smart specialisation – the concept’. In Knowledge Economists Policy Brief; European Commission: Brussels, 2009; Volume 9. [Google Scholar]
- Friedman, J.H. ‘Greedy function approximation: a gradient boosting machine’. Ann. Stat. 2001, 29(5), 1189–1232. [Google Scholar] [CrossRef]
- Fritsch, M.; Slavtchev, V. ‘Determinants of the efficiency of regional innovation systems’. Reg. Stud. 2011, 45(7), 905–918. [Google Scholar] [CrossRef]
- Ganau, R.; Grandinetti, R. ‘Disentangling regional innovation capability: what really matters?’. Ind. Innov. 2021, 28(6), 749–772. [Google Scholar] [CrossRef]
- Gimenez-Fernandez, E.M.; Sandulli, F.D.; Bogers, M. ‘Unpacking liabilities of newness and smallness in innovative start-ups: Investigating the differences in innovation performance between new and older small firms’. Res. Policy 2020, 49(10), art. 104049. [Google Scholar] [CrossRef]
- Gomes, S.; Lopes, J.M.; Ferreira, L.; Oliveira, J. ‘Science and Technology Parks: Opening the Pandora’s Box of Regional Development’. J. Knowl. Econ. 2023, 14(3), 2787–2810. [Google Scholar] [CrossRef] [PubMed]
- González-Martinez, P.; García-Pérez-De-Lema, D.; Castillo-Vergara, M.; Hansen, P.B. ‘Determinants and performance of the quadruple helix model and the mediating role of civil society’. Technol. Soc. 2023, 75, art. 102358. [Google Scholar] [CrossRef]
- Gramlich, D.; Walker, T.; Zhang, A.; Zhao, Y. ‘Do natural disasters affect product development? Evidence from trademarks’. Int. Rev. Econ. Financ. 2026, 106, art. 104863. [Google Scholar] [CrossRef]
- Griffith, R.; Huergo, E.; Mairesse, J.; Peters, B. ‘Innovation and productivity across four European countries’. Oxf. Rev. Econ. Policy 2006, 22(4), 483–498. [Google Scholar] [CrossRef]
- Griliches, Z. ‘Issues in assessing the contribution of research and development to productivity growth’. Bell J. Econ. 1979, 10(1), 92–116. [Google Scholar] [CrossRef] [PubMed]
- Griliches, Z. ‘Patent statistics as economic indicators: a survey’. J. Econ. Lit. 1990, 28(4), 1661–1707. [Google Scholar]
- Grillitsch, M.; Martin, R.; Srholec, M. ‘Knowledge base combinations and innovation performance in Swedish regions’. Econ. Geogr. 2017, 93(5), 458–479. [Google Scholar] [CrossRef]
- Grupp, H.; Schubert, T. ‘Review and new evidence on composite innovation indicators for evaluating national performance’. Res. Policy 2010, 39(1), 67–78. [Google Scholar] [CrossRef]
- Hädrich, T.; Reher, L.; Thomä, J. ‘Solving the Puzzle? An Innovation Mode Perspective on Lagging Regions’. Int. Reg. Sci. Rev. 2025, 48(4), 396–436. [Google Scholar] [CrossRef]
- Hajdukiewicz, A.; Pera, B. ‘Eco-innovation in the European Union: Challenges for catching-up economies’. Entrep. Bus. Econ. Rev. 2023, 11(1), 145–164. [Google Scholar] [CrossRef]
- Hajighasemi, A.; Oghazi, P.; Aliyari, S.; Pashkevich, N. ‘The impact of welfare state systems on innovation performance and competitiveness: European country clusters’. J. Innov. Knowl. 2022, 7(4), art. 100236. [Google Scholar] [CrossRef]
- Hall, B.H.; Lotti, F.; Mairesse, J. ‘Innovation and productivity in SMEs: empirical evidence for Italy’. Small Bus. Econ. 2009, 33(1), 13–33. [Google Scholar] [CrossRef]
- Hausman, J.A. ‘Specification tests in econometrics’. Econometrica 1978, 46(6), 1251–1271. [Google Scholar] [CrossRef]
- Heath, D.; Mace, C. ‘The Strategic Effects of Trademark Protection’. Rev. Financ. Stud. 2020, 33(4), 1848–1877. [Google Scholar] [CrossRef]
- Heindl, A.-B. ‘Separate frameworks of regional innovation systems for analysis in China? Conceptual developments based on a qualitative case study in Chongqing’; Geoforum, 2020; Volume 115, pp. 34–43. [Google Scholar] [CrossRef]
- Hennig, C. ‘Cluster-wise assessment of cluster stability’. Comput. Stat. Data Anal. 2007, 52(1), 258–271. [Google Scholar] [CrossRef]
- Hervas-Oliver, J.-L.; Estelles-Miguel, S.; Sempere, F.; de Vega Unceta, A. ‘Exploring SME collaboration paths: a configurational analysis from the business innovation modes perspective in Spain’. Eur. Plan. Stud. 2025, 33(6), 945–963. [Google Scholar] [CrossRef]
- Hervás-Oliver, J.-L.; Parrilli, M.D.; Rodríguez-Pose, A.; Sempere-Ripoll, F. ‘The drivers of SME innovation in the regions of the EU’. Res. Policy 2021, 50(9), art. 104316.0. [Google Scholar] [CrossRef]
- Horbach, J.; Rammer, C. ‘Circular economy innovations, growth and employment at the firm level: Empirical evidence from Germany’. J. Ind. Ecol. 2020, 24(3), 615–625. [Google Scholar] [CrossRef]
- Horbach, J.; Rammer, C. ‘Climate change affectedness and innovation in firms’. Res. Policy 2025, 54(1), art. 105122. [Google Scholar] [CrossRef]
- Hou, J. ‘The survival effects of non-R&D induced innovation during crisis’. Res. Policy 2026, 55(2), art. 105396. [Google Scholar] [CrossRef]
- Hsu, D.H.; Hsu, P.-H.; Zhou, K.; Zhou, T. ‘Industry-University Collaboration and Commercializing Chinese Corporate Innovation’. Manag. Sci. 2025, 71(6), 5351–5375. [Google Scholar] [CrossRef]
- Hu, S.; Wang, X.; Zhang, B. ‘Are all innovation modes beneficial to firms’ innovation performance? New findings from an emerging market’. Chin. Manag. Stud. 2020, 14(4), 1015–1034. [Google Scholar] [CrossRef]
- Hubert, L.; Arabie, P. ‘Comparing partitions’. J. Classif. 1985, 2(1), 193–218. [Google Scholar] [CrossRef]
- Huynh Evertsen, P.; Rasmussen, E.; Nenadic, O. ‘Commercializing circular economy innovations: A taxonomy of academic spin-offs’. Technol. Forecast. Soc. Change 2022, 185, art. 122102. [Google Scholar] [CrossRef]
- Janger, J.; Schubert, T.; Andries, P.; Rammer, C.; Hoskens, M. ‘The EU 2020 innovation indicator: a step forward in measuring innovation outputs and outcomes?’. Res. Policy 2017, 46(1), 30–42. [Google Scholar] [CrossRef]
- Jemala, M. ‘Systemic technology innovation management and analysis of other forms of IP protection’. Int. J. Innov. Stud. 2022, 6(4), 238–258. [Google Scholar] [CrossRef]
- Jensen, M.B.; Johnson, B.; Lorenz, E.; Lundvall, B.-Å. ‘Forms of knowledge and modes of innovation’. Res. Policy 2007, 36(5), 680–693. [Google Scholar] [CrossRef]
- Jesic, J.; Okanovic, A.; Panic, A.A. ‘Net zero 2050 as an EU priroty: modeling a system for efficient investments in eco innovation for climate change mitigation’. Energy Sustain. Soc. 2021, 11(1), art. 50.0. [Google Scholar] [CrossRef]
- Jjagwe, R.; Kirabira, J.B.; Mukasa, N. ‘Contribution of R&D grants and investment to the commercialization of innovations in Uganda: Lessons from UNCST a science granting council’. Afr. J. Sci. Technol. Innov. Dev. 2024, 16(7), 1003–1022. [Google Scholar] [CrossRef]
- Jonek-Kowalska, I. ‘Innovation in the economies of Central and Eastern Europe – long-term benchmarking’. J. Int. Stud. 2023, 16(4), 27–38. [Google Scholar] [CrossRef]
- Juergensen, J.J.; Love, J.H.; Surdu, I.; Narula, R. ‘Learning-by-exporting: The strategic role of organizational innovation’. Int. Bus. Rev. 2024, 33(6), art. 102339. [Google Scholar] [CrossRef]
- Jun, T.; Jun, W. ‘Research on the Collaborative Innovation Model in Regional Social Governance’. Contemp. Soc. Sci. 2022, 7(1), 44–61. [Google Scholar] [CrossRef]
- Kale, S. ‘The influence of non-R&D channels on innovation in a developing economy: an empirical analysis in the context of India’. Int. Rev. Appl. Econ. 2022, 36(2), 205–221. [Google Scholar] [CrossRef]
- Kalmakova, D.; Bilan, Y.; Zhidebekkyzy, A.; Sagiyeva, R. ‘Commercialization of conventional and sustainability-oriented innovations: A comparative systematic literature review’. Probl. Perspect. Manag. 2021, 19(1), 340–353. [Google Scholar] [CrossRef]
- Karhade, P.P.; Dong, J.Q. ‘Information technology investment and commercialized innovation performance: Dynamic adjustment costs and curvilinear impacts’. MIS Q. Manag. Inf. Syst. 2021, 45(3), 1007–1024. [Google Scholar] [CrossRef]
- Kaur, P.; Kaur, N.; Kanojia, P. ‘Firm innovation and access to finance: firm-level evidence from India’. J. Financ. Econ. Policy 2022, 14(1), 93–112. [Google Scholar] [CrossRef]
- Keelson, S.A.; Cúg, J.; Amoah, J.; Petráková, Z.; Addo, J.O.; Jibril, A.B. ‘The Influence of Market Competition on SMEs’ Performance in Emerging Economies: Does Process Innovation Moderate the Relationship?’. Economies 2024, 12(11), art. 282. [Google Scholar] [CrossRef]
- Khoja, M. ‘Private equity acquisitions and product market decisions: Evidence from trademarks’. Rev. Financ. Econ. 2026, 44(1), art. e70025. [Google Scholar] [CrossRef]
- Kijek, T.; Kijek, A.; Matras-Bolibok, A. ‘Club Convergence in R&D Expenditure across European Regions’. Sustainability 2022, 14(2), art. 832.0. [Google Scholar] [CrossRef]
- Kim, M.-K.; Park, J.-H. ‘Mapping the Intellectual Structure and Evolution of Innovation Survey Research: A Comparative Bibliometric Analysis of European and Non-European Perspectives’. J. Inf. Knowl. Manag. 2026, art. 2650061. [Google Scholar] [CrossRef]
- Koval, V.; Lomachynska, I.; Udovychenko, I.; Maslennikov, Y.; Nesenenko, P.; Sribna, Y. ‘Business Model Analysis in Strategic Innovation Management and Intellectual Property Commercialization’. Adm. Sci. 2026, 16(1), art. 51. [Google Scholar] [CrossRef]
- Lambrecht, D.; Block, J.; Neuenkirch, M.; Steinmetz, H.; Willeke, T. ‘The interdependence of intellectual property rights and sales in the manufacturing industry: evidence from the triangle of patents, trademarks, and sales’. Econ. Innov. New Technol. 2026, 35(2), 259–283. [Google Scholar] [CrossRef]
- Lara, G.; Arbussà, A.; Llach, J. ‘Exploring the probability of firm cooperation in innovation: The role of technological intensity, knowledge intensity, and size’. J. Eng. Technol. Manag.-JET-M. 2023, 69, art. 101763. [Google Scholar] [CrossRef]
- Li, H. ‘Effects of innovation modes and network partners on innovation performance of young firms’. Eur. J. Innov. Manag. 2022, 25(5), 1288–1308. [Google Scholar] [CrossRef]
- Li, X.; Wu, D.; Wu, Y. ‘Win by defence: The impact of defensive trademarks on corporate innovation’. Account. Financ. 2024, 64(4), 3823–3840. [Google Scholar] [CrossRef]
- Lilles, A.; Rõigas, K.; Varblane, U. ‘Comparative View of the EU Regions by Their Potential of University-Industry Cooperation’. J. Knowl. Econ. 2020, 11(1), 174–192. [Google Scholar] [CrossRef]
- Liu, Q.; Gao, J.; Li, S. ‘The innovation model and upgrade path of digitalization driven tourism industry: Longitudinal case study of OCT’. Technol. Forecast. Soc. Change 2024, 200, art. 123127. [Google Scholar] [CrossRef]
- Liu, X.; Yang, B.; Xiao, N. ‘New Characteristics and Trend of Regional Innovation Capacity in China’. Bull. Chin. Acad. Sci. 2021, 36(1), 54–63. [Google Scholar] [CrossRef]
- Liu, Y.; Dong, J.; Ying, Y. ‘Non-R&D Subsidies and Digital Product Innovation in China’. R D. Manag. 2025, 55(4), 1037–1058. [Google Scholar] [CrossRef]
- Lombardi, M.; Costantino, M. ‘A social innovation model for reducing food waste: The case study of an italian non-profit organization’. Adm. Sci. 2020, 10(3), art. 45. [Google Scholar] [CrossRef]
- Lopes, J.M.; Gomes, S.; Ferreira, J.J.M.; Dabic, M. ‘Driving regional advancement: exploring the impact of science and technology parks in the outermost regions of Europe’. Eur. J. Innov. Manag. 2025, 28(8), 4225–4256. [Google Scholar] [CrossRef]
- Lopes, J.M.; Gomes, S.; Oliveira, J.; Oliveira, M. ‘The role of open innovation, and the performance of european union regions’. J. Open Innov. Technol. Mark. Complex. 2021b, 7(2), art. 120.0. [Google Scholar] [CrossRef]
- Lopes, J.M.; Silveira, P.; Farinha, L.; Oliveira, M.; Oliveira, J. ‘Analyzing the root of regional innovation performance in the European territory’. Int. J. Innov. Sci. 2021a, 13(5), 565–582. [Google Scholar] [CrossRef]
- Lu, X.; Wang, J. ‘Is innovation strategy a catalyst to solve social problems? The impact of R&D and non-R&D innovation strategies on the performance of social innovation-oriented firms’. Technol. Forecast. Soc. Change 2024, 199, art. 123020. [Google Scholar] [CrossRef]
- Lucena-Giraldo, J.; Rodríguez-Crespo, E.; Salazar-Elena, J.C. ‘The creative response of energy-intensive industries to the Emissions Trading System in the European Union’. J. Clean. Prod. 2022, 373, art. 133700. [Google Scholar] [CrossRef]
- Lundvall, B.-Å. (Ed.) National Systems of Innovation: Towards a Theory of Innovation and Interactive Learning; Pinter: London, 1992. [Google Scholar]
- Mairesse, J.; Mohnen, P. ‘Using innovation surveys for econometric analysis’. In Handbook of the Economics of Innovation; Hall, B.H., Rosenberg, N., Eds.; North-Holland: Amsterdam, 2010; Volume 2, pp. 1129–1155. [Google Scholar]
- Mardones, C.; Ávila, F. ‘Effect of R&D subsidies and tax credits on the innovative processes of Chilean firms; [Efecto de los subsidios e incentivos tributarios para I&D sobre los procesos innovativos de las firmas chilenas]’. Acad. Rev. Latinoam. De Adm. 2020, 33(3-4), 517–534. [Google Scholar] [CrossRef]
- Mardones, C.; Sepúlveda, L. ‘Public funding effects on inputs and outputs from the innovative process in Chilean firms’. Econ. Innov. New Technol. 2022, 31(5), 416–445. [Google Scholar] [CrossRef]
- Marques, J.; Santos, C.; Oliveira, M.A. ‘A Quest for Innovation Drivers with Autometrics: Do These Differ Before and After the COVID-19 Pandemic for European Economies?’. Economies 2025, 13(4), art. 110. [Google Scholar] [CrossRef]
- Martinidis, G.; Komninos, N.; Carayannis, E. ‘Taking into Account the Human Factor in Regional Innovation Systems and Policies’. J. Knowl. Econ. 2022, 13(2), 849–879. [Google Scholar] [CrossRef]
- Mathew, N.; Paily, G. ‘STI-DUI innovation modes and firm performance in the Indian capital goods industry: Do small firms differ from large ones?’. J. Technol. Transf. 2022, 47(2), 435–458. [Google Scholar] [CrossRef]
- Medase, S.K.; Abdul Basit, S. ‘Trademark and product innovation: the interactive role of quality certification and firm-level attributes’. Innov. Dev. 2023, 13(1), 1–41. [Google Scholar] [CrossRef]
- Mendes, R.A.Á.; Gonçalves, E.; Taveira, J.G. ‘Patents and Trademarks as Drivers of Regional Economic Resistance in Brazil’. Rev. Dev. Econ. 2026. [Google Scholar] [CrossRef]
- Mendonça, S.; Pereira, T.S.; Godinho, M.M. ‘Trademarks as an indicator of innovation and industrial change’. Res. Policy 2004, 33(9), 1385–1404. [Google Scholar] [CrossRef]
- Montiel-Campos, H. ‘Entrepreneurial alertness, innovation modes, and business models in small-and medium-sized enterprises: An exploratory quantitative study’. J. Technol. Manag. Innov. 2021, 16(1), 23–30. [Google Scholar] [CrossRef]
- Morales, P.; Flikkema, M.; Castaldi, C.; de Man, A.-P. ‘When do trademarks improve the measurement of innovation? An analysis of innovations from Dutch SMEs’. Sci. Public Policy 2024, 51(5), 923–938. [Google Scholar] [CrossRef]
- Moreno, R.; Paci, R.; Usai, S. ‘Spatial spillovers and innovation activity in European regions’. Environ. Plan. A 2005, 37(10), 1793–1812. [Google Scholar] [CrossRef]
- Mostafiz, M.I.; Ahmed, F.U.; Ibrahim, F.; Tarba, S.Y. ‘Innovation and commercialisation: the role of the international dynamic marketing capability in Malaysian international entrepreneurial firms’. Int. Mark. Rev. 2024, 41(1), 199–236. [Google Scholar] [CrossRef]
- Mota Veiga, P.; Figueiredo, R.; Ferreira, J.J.M.; Ambrósio, F. ‘The spinner innovation model: understanding the knowledge creation, knowledge transfer and innovation process in SMEs’. Bus. Process Manag. J. 2021, 27(2), 590–614. [Google Scholar] [CrossRef]
- Mullainathan, S.; Spiess, J. ‘Machine learning: an applied econometric approach’. J. Econ. Perspect. 2017, 31(2), 87–106. [Google Scholar] [CrossRef]
- Mundlak, Y. ‘On the pooling of time series and cross section data’. Econometrica 1978, 46(1), 69–85. [Google Scholar] [CrossRef]
- Murswieck, R.; Drăgan, M.; Maftei, M.; Ivana, D.; Fortmüller, A. ‘A study on the relationship between cultural dimensions and innovation performance in the European Union countries’. Appl. Econ. 2020, 52(22), 2377–2391. [Google Scholar] [CrossRef]
- Nardo, M.; Saisana, M.; Saltelli, A.; Tarantola, S.; Hoffman, A.; Giovannini, E. Handbook on Constructing Composite Indicators: Methodology and User Guide; OECD Publishing: Paris, 2008. [Google Scholar]
- Naruetharadhol, P.; Srisathan, W.A.; Gebsombut, N.; Ketkaew, C. ‘Towards the open eco-innovation mode: A model of open innovation and green management practices’. Cogent Bus. Manag. 2021, 8(1), art. 1945425. [Google Scholar] [CrossRef]
- Natário, M.M.S.; Rosa, M.C.S.; Marques, S.R. ‘BARRIERS TO INNOVATION IN LOCAL PUBLIC ADMINISTRATION: THE NUTS III BSE CASE.; [BARRIERES A L’INNOVATION DANS L’ADMINISTRATION PUBLIQUE LOCALE: LE CAS DE NUTS III BSE.]; [BARREIRAS À INOVAÇÃO NA ADMINISTRAÇÃO PÚBLICA LOCAL: O CASO DA NUTS III BSE]; [BARRERAS A LA INNOVACIÓN EN LA ADMINISTRACIÓN PÚBLICA LOCAL: EL CASO DE LA NUTS III BSE.]’. Finisterra 2022, 57(121), 45–63. [Google Scholar] [CrossRef]
- Nawrocki, T.L.; Jonek-Kowalska, I. ‘Innovativeness of the European economies in the context of the modified European Innovation Scoreboard’, Equilibrium. Q. J. Econ. Econ. Policy 2025, 20(3), 999–1034. [Google Scholar] [CrossRef]
- Nickell, S. ‘Biases in dynamic models with fixed effects’. Econometrica 1981, 49(6), 1417–1426. [Google Scholar] [CrossRef]
- Niessen, P.; Schubert, T.; Rammer, C.; Ostertag, K. ‘The role of workplace innovation for open eco-innovation: Evidence from the community innovation survey’. J. Innov. Knowl. 2026, 17, art. 101042. [Google Scholar] [CrossRef]
- Odei, S.A.; Stejskal, J.; Prokop, V. ‘Understanding territorial innovations in European regions: Insights from radical and incremental innovative firms’. Reg. Sci. Policy Pract. 2021, 13(5), 1638–1660. [Google Scholar] [CrossRef]
- OECD/Eurostat. Oslo Manual 2018: Guidelines for Collecting, Reporting and Using Data on Innovation, 4th edition; OECD Publishing: Paris, 2018. [Google Scholar]
- Omonijo, O.N.; Zhang, Y. ‘China’s innovation model- lessons and applicability in Africa’. Cogent Econ. Financ. 2025, 13(1), art. 2442747. [Google Scholar] [CrossRef]
- Onea, I.A. ‘Innovation Indicators and the Innovation Process-Evidence from the European Innovation Scoreboard’. Manag. Mark. 2020, 15(4), 605–620. [Google Scholar] [CrossRef]
- Orjuela-Ramirez, G.; Zuluaga, J.C.; Urbano, D. ‘Firms’ innovation modes and novelty of innovation: the moderating role of dysfunctional competition’. Innov. Dev. 2024, 14(3), 475–496. [Google Scholar] [CrossRef]
- Ovuakporie, O.D.; Pillai, K.G.; Wang, C.; Wei, Y. ‘Differential moderating effects of strategic and operational reconfiguration on the relationship between open innovation practices and innovation performance’. Res. Policy 2021, 50(1), art. 104146. [Google Scholar] [CrossRef]
- Pak, A.; Kim, J.K. ‘Innovation failure, technology commercialization, and ambidexterity: Translating failure into success’. Technovation 2026, 152, art. 103505. [Google Scholar] [CrossRef]
- Pak, A.; Seo, D.J.; Roh, T. ‘The effect of intellectual property rights on firm performance in service firms: the role of process and organizational innovation’. Cross Cult. Strateg. Manag. 2025, 32(1), 49–76. [Google Scholar] [CrossRef]
- Parrilli, M.D.; Lu, Y. ‘Business innovation modes in China’s firms: Technological swing and the value of social capital’. J. Evol. Econ. 2026, 36(2), art. 59. [Google Scholar] [CrossRef]
- Parrilli, M.D.; Radicic, D. ‘Cooperation for innovation in liberal market economies: STI and DUI innovation modes in SMEs in the United Kingdom’. Eur. Plan. Stud. 2021a, 29(11), 2121–2144. [Google Scholar] [CrossRef]
- Parrilli, M.D.; Radicic, D. ‘STI and DUI innovation modes in micro-, small-, medium- and large-sized firms: distinctive patterns across Europe and the U.S’. Eur. Plan. Stud. 2021b, 29(2), 346–368. [Google Scholar] [CrossRef]
- Parrilli, M.D.; Balavac, M.; Radicic, D. ‘Business innovation modes and their impact on innovation outputs: Regional variations and the nature of innovation across EU regions’. Res. Policy 2020, 49(8), art. 104047. [Google Scholar] [CrossRef] [PubMed]
- Parrilli, M.D.; Balavac-Orlić, M.; Radicic, D. ‘Environmental innovation across SMEs in Europe’. Technovation 2023, 119, art. 102541. [Google Scholar] [CrossRef]
- Parrilli, M.D.; Balavac-Orlic, M.; Radicic, D. ‘Eco-innovation across SMEs in European macro-regions’. J. Clean. Prod. 2025, 494, art. 144964. [Google Scholar] [CrossRef]
- Pereira dos Santos, U.; Costa Ribeiro, L.; Cornélio Diniz, S.; Machado, A.F. ‘Notes on the use of trademark registrations as an innovation metric for the creative and cultural industries: an analysis based on USPTO data’. Creat. Ind. J. 2024, 17(3), 381–399. [Google Scholar] [CrossRef]
- Pesaran, M.H. ‘Testing weak cross-sectional dependence in large panels’. Econom. Rev. 2015, 34(6–10), 1089–1117. [Google Scholar] [CrossRef]
- Piercey, P.; Saunders, C.; Doloreux, D. ‘The sensitivity of innovation modes to distance: Can we go the distance?’. Technol. Forecast. Soc. Change 2025, 210, art. 123891. [Google Scholar] [CrossRef]
- Pinto, H. ‘Universities and institutionalization of regional innovation policy in peripheral regions: Insights from the smart specialization in Portugal’. Reg. Sci. Policy Pract. 2024, 16(1), art. 12659. [Google Scholar] [CrossRef]
- Pires, S.M.; Polido, A.; Teles, F.; Silva, P.; Rodrigues, C. ‘Territorial innovation models in less developed regions in Europe: the quest for a new research agenda?’. Eur. Plan. Stud. 2020, 28(8), 1639–1666. [Google Scholar] [CrossRef]
- Raczynska, M. ‘Method and New Doctorate Graduates in Science, Technology, Engineering, and Mathematics of the European Innovation Scoreboard as a Measure of Innovation Management in Subdisciplines of Management and Quality Studies’. Open Educ. Stud. 2024, 6(1), art. 20240005. [Google Scholar] [CrossRef]
- Rammer, C. ‘Measuring process innovation output in firms: Cost reduction versus quality improvement’. Technovation 2023, 124, art. 102753. [Google Scholar] [CrossRef]
- Rammer, C.; Es-Sadki, N. ‘Using big data for generating firm-level innovation indicators - a literature review’. Technol. Forecast. Soc. Change 2023, 197, art. 122874. [Google Scholar] [CrossRef]
- Rammer, C.; Fernández, G.P.; Czarnitzki, D. ‘Artificial intelligence and industrial innovation: Evidence from German firm-level data’. Res. Policy 2022, 51(7), art. 104555. [Google Scholar] [CrossRef]
- Rammer, C.; Czarnitzki, D.; Spielkamp, A. ‘Innovation success of non-R&D-performers: substituting technology by management in SMEs’. Small Bus. Econ. 2009, 33(1), 35–58. [Google Scholar] [CrossRef]
- Ramsey, J.B. ‘Tests for specification errors in classical linear least-squares regression analysis’. J. R. Stat. Soc. Ser. B 1969, 31(2), 350–371. [Google Scholar] [CrossRef]
- Ribeiro, L.C.; dos Santos, U.P.; Muzaka, V. ‘Trademarks as an indicator of innovation: towards a fuller picture’. Scientometrics 2022, 127(1), 481–508. [Google Scholar] [CrossRef]
- Rieger, V.; Dreller, A.; Engelen, A. ‘Zooming In on the Very Early Days: The Role of Trademark Applications in the Acquisition of Venture Capital Seed Funding’. J. Mark. Res. 2025, 62(1), 170–188. [Google Scholar] [CrossRef]
- Robayo-Acuña, P.V.; Chams-Anturi, O.; Ruíz-Castro, I.R. ‘Service innovation in emerging economies: the impact of DUI and STI innovation modes on innovation performance’. J. Innov. Entrep. 2025, 14(1), art. 100. [Google Scholar] [CrossRef]
- Roberts, D.R.; Bahn, V.; Ciuti, S.; Boyce, M.S.; Elith, J.; Guillera-Arroita, G.; Hauenstein, S.; Lahoz-Monfort, J.J.; Schröder, B.; Thuiller, W.; Warton, D.I.; Wintle, B.A.; Hartig, F.; Dormann, C.F. ‘Cross-validation strategies for data with temporal, spatial, hierarchical, or phylogenetic structure’. Ecography 2017, 40(8), 913–929. [Google Scholar] [CrossRef]
- Rodrigues-Ferreira, A.; Afonso, H.; Mello, J.A.; Amaral, R. ‘CREATIVE ECONOMY AND THE QUINTUPLE HELIX INNOVATION MODEL: A CRITICAL FACTORS STUDY IN THE CONTEXT OF REGIONAL DEVELOPMENT’. Creat. Stud. 2023, 16(1), 158–177. [Google Scholar] [CrossRef]
- Rousseeuw, P.J. ‘Silhouettes: a graphical aid to the interpretation and validation of cluster analysis’. J. Comput. Appl. Math. 1987, 20, 53–65. [Google Scholar] [CrossRef]
- Runst, P.; Thomä, J. ‘Does personality matter? Small business owners and modes of innovation’. Small Bus. Econ. 2022, 58(4), 2235–2260. [Google Scholar] [CrossRef]
- Saltelli, A. ‘Composite indicators between analysis and advocacy’. Soc. Indic. Res. 2007, 81(1), 65–77. [Google Scholar] [CrossRef]
- Santamaría, L.; Nieto, M.J.; Barge-Gil, A. ‘Beyond formal R&D: taking advantage of other sources of innovation in low- and medium-technology industries’. Res. Policy 2009, 38(3), 507–517. [Google Scholar] [CrossRef]
- Schubert, T. ‘Captive Offshoring, Innovation and Market Diffusion: Evidence from the Swedish Community Innovation Survey’. J. Knowl. Econ. 2024, 15(2), 5650–5678. [Google Scholar] [CrossRef]
- Scuotto, V.; Beatrice, O.; Valentina, C.; Nicotra, M.; Di Gioia, L.; Farina Briamonte, M. ‘Uncovering the micro-foundations of knowledge sharing in open innovation partnerships: An intention-based perspective of technology transfer’. Technol. Forecast. Soc. Change 2020, 152, art. 119906. [Google Scholar] [CrossRef]
- Sein, Y.Y.; Klímová, V.; Zapletal, D.; Žítek, V.; Prokop, V. ‘Demand-side policies under scrutiny: triggering process innovations and innovative sales of European firms’. Innovation: The European Journal of Social Science Research 2026. [Google Scholar] [CrossRef]
- Seip, M.; Van Der Heijden, A.; Bax, M. ‘SCALE-UPS AND INTELLECTUAL PROPERTY RIGHTS: THE ROLE OF TECHNOLOGICAL AND COMMERCIALISATION CAPABILITIES IN FIRM GROWTH’. Int. J. Innov. Manag. 2022, 26(4), art. 2250033.0. [Google Scholar] [CrossRef]
- Shu, L.; Wang, W. ‘Human capital and trademarks: Evidence from higher education expansion in China’. Res. Policy 2023, 52(10), art. 104869. [Google Scholar] [CrossRef]
- Silva, P.; Pires, S.M.; Teles, F. ‘Explanatory models of regional innovation performance in Europe: policy implications for regions’. Innov. Eur. J. Soc. Sci. Res. 2021, 34(4), 609–631. [Google Scholar] [CrossRef]
- Solheim, M.C.W.; Boschma, R.; Herstad, S.J. ‘Collected worker experiences and the novelty content of innovation’. Res. Policy 2020, 49(1), art. 103856. [Google Scholar] [CrossRef]
- Stojčić, N. ‘Collaborative innovation in emerging innovation systems: Evidence from Central and Eastern Europe’. J. Technol. Transf. 2021, 46(2), 531–562. [Google Scholar] [CrossRef]
- Suwala, L.; Kitzmann, R.; Kulke, E. ‘Berlin’s manifold strategies towards commercial and industrial spaces: The different cases of zukunftsorte’. Urban Plan. 2021, 6(3), 415–430. [Google Scholar] [CrossRef]
- Svensson, R. ‘Patent value indicators and technological innovation’. Empir. Econ. 2022, 62(4), 1715–1742. [Google Scholar] [CrossRef]
- Świąder, K.; Marczewska, M. ‘Trends of using sensory evaluation in new product development in the food industry in countries that belong to the eit regional innovation scheme’. Foods 2021, 10(2), 1–18. [Google Scholar] [CrossRef] [PubMed]
- Szopik-Depczyńska, K.; Cheba, K.; Bąk, I.; Kędzierska-Szczepaniak, A.; Szczepaniak, K.; Ioppolo, G. ‘Innovation level and local development of EU regions. A new assessment approach’. Land Use Policy 2020, 99, art. 104837. [Google Scholar] [CrossRef]
- Tarzia, D.; Kim, D.S.; Selvam, S. ‘Controlling Shareholders and Innovation: Evidence From Trademark Registrations’. Int. Rev. Financ. 2025, 25(4), art. e70046. [Google Scholar] [CrossRef]
- Teirlinck, P.; Khoshnevis, P. ‘SME efficiency in transforming regional business research and innovation investments into innovative sales output’. Reg. Stud. 2022, 56(12), 2147–2163. [Google Scholar] [CrossRef]
- Teirlinck, P.; Spithoven, A. ‘Improving the Regional Innovation Scoreboard for policy: how about innovation efficiency?’. Sci. Public Policy 2023, 50(6), 1001–1017. [Google Scholar] [CrossRef]
- Thomä, J.; Zimmermann, V. ‘Interactive learning — The key to innovation in non-R&D-intensive SMEs? A cluster analysis approach’. J. Small Bus. Manag. 2020, 58(4), 747–776. [Google Scholar] [CrossRef]
- Tibshirani, R.; Walther, G.; Hastie, T. ‘Estimating the number of clusters in a data set via the gap statistic’. J. R. Stat. Soc. Ser. B 2001, 63(2), 411–423. [Google Scholar] [CrossRef]
- Tödtling, F.; Trippl, M. ‘One size fits all? Towards a differentiated regional innovation policy approach’. Res. Policy 2005, 34(8), 1203–1219. [Google Scholar]
- Valdez-Juárez, L.E.; Ramos-Escobar, E.A.; Hernández-Ponce, O.E.; Ruiz-Zamora, J.A. ‘Digital transformation and innovation, dynamic capabilities to strengthen the financial performance of Mexican SMEs: a sustainable approach’. Cogent Bus. Manag. 2024, 11(1), art. 2318635. [Google Scholar] [CrossRef]
- Varian, H.R. ‘Big data: new tricks for econometrics’. J. Econ. Perspect. 2014, 28(2), 3–28. [Google Scholar] [CrossRef]
- Vărzaru, A.A.; Bocean, C.G. ‘Digital Transformation and Innovation: The Influence of Digital Technologies on Turnover from Innovation Activities and Types of Innovation’. Systems 2024, 12(9), art. 359. [Google Scholar] [CrossRef]
- Végh, M.; Szabó, I.; Kovács, A. ‘Innovation in your blood? Exploring the influence of culture on national-level innovation performance in the European Union’. J. Innov. Knowl. 2025, 10(5), art. 100791. [Google Scholar] [CrossRef]
- Vieira, E.S. ‘The influence of research collaboration on citation impact: the countries in the European Innovation Scoreboard’. Scientometrics 2023, 128(6), 3555–3579. [Google Scholar] [CrossRef]
- Vinokurova, N.; Kapoor, R. ‘Converting inventions into innovations in large firms: How inventors at Xerox navigated the innovation process to commercialize their ideas’. Strateg. Manag. J. 2020, 41(13), 2372–2399. [Google Scholar] [CrossRef]
- Vokoun, M.; Dvouletý, O. ‘International, national and sectoral determinants of innovation: evolutionary perspective from the Czech, German, Hungarian and Slovak community innovation survey data’. Innov. Eur. J. Soc. Sci. Res. 2025, 38(1), 495–535. [Google Scholar] [CrossRef]
- von Graevenitz, G.; Graham, S.J.H.; Myers, A.F. ‘Distance (still) hampers diffusion of innovations’. Reg. Stud. 2022, 56(2), 227–241. [Google Scholar] [CrossRef]
- Wang, K.; Wang, T. ‘Competition from informal firms and new-to-market product innovation: A competitive rivalry framework’. J. Product. Innov. Manag. 2024, 41(4), 816–842. [Google Scholar] [CrossRef]
- Ward, J.H. ‘Hierarchical grouping to optimize an objective function’. J. Am. Stat. Assoc. 1963, 58(301), 236–244. [Google Scholar] [CrossRef]
- Wei, T.; Pan, H.; Xie, P. ‘Still collaborating? Strengthening intellectual property protection and collaborative innovation choice for enterprises’. J. Technol. Transf. 2026, 51(2), 1101–1126. [Google Scholar] [CrossRef]
- Weidner, N.; Som, O.; Horvat, D. ‘An integrated conceptual framework for analysing heterogeneous configurations of absorptive capacity in manufacturing firms with the DUI innovation mode’. Technovation 2023, 121, art. 102635. [Google Scholar] [CrossRef]
- Willeke, T.; Block, J.; Lambrecht, D. ‘Using trademark data in research’. World Pat. Inf. 2026, 84, art. 102431. [Google Scholar] [CrossRef]
- Woodfield, P.J.; Ooi, Y.M.; Husted, K. ‘Commercialisation patterns of scientific knowledge in traditional low- and medium-tech industries’. Technol. Forecast. Soc. Change 2023, 189, art. 122349. [Google Scholar] [CrossRef]
- Wooldridge, J.M. Econometric Analysis of Cross Section and Panel Data, 2nd edition; MIT Press: Cambridge, MA, 2010. [Google Scholar]
- Xuemei, X.; Hongwei, W. ‘The impact mechanism of network embeddedness on firm innovation performance: A moderated mediation model based on non-R&D innovation’. J. Ind. Eng. Eng. Manag. 2020, 34(6), 13–28. [Google Scholar] [CrossRef]
- Yang, H.; Qi, T.; Wang, Y.; Hong, T. ‘Spatio-Temporal Dynamics and Driving Factors of Coupling Coordination in China’s Innovation–Platform–Commercialization System’. Systems 2026, 14(5), art. 525. [Google Scholar] [CrossRef]
- Zabala-Iturriagagoitia, J.M.; Aparicio, J.; Ortiz, L.; Carayannis, E.G.; Grigoroudis, E. ‘The productivity of national innovation systems in Europe: Catching up or falling behind?’. Technovation 2021, 102, art. 102215.0. [Google Scholar] [CrossRef]
- Zeng, X.; Zhang, T.; Chen, L.; Zu, Y. ‘Management control matching patterns and firm innovation modes’. Technol. Anal. Strateg. Manag. 2024, 36(10), 2711–2726. [Google Scholar] [CrossRef]
- Zhang, H. ‘Non-R&D innovation in SMEs: is there complementarity or substitutability between internal and external innovation sourcing strategies?’. Technol. Anal. Strateg. Manag. 2024, 36(5), 916–930. [Google Scholar] [CrossRef]
- Zhang, Q.; Fox, M.F.; Breznitz, S.M.; Kessler, T.C. ‘Analyzing the impact of gender on entrepreneurship and innovation: evidence from university graduates’. J. Technol. Transf. 2025, 50(3), 1080–1110. [Google Scholar] [CrossRef]
- Zhang, Q.; Li, H.; Chu, Q.; Sun, H.; Sun, S. ‘A Systematic Evaluation Framework for Service Science and Technology Innovation in China: Regional Disparity Analysis with AHP and Multi-Source Data’. J. Syst. Sci. Inf. 2026, 14(3), 403–420. [Google Scholar] [CrossRef]
- Zhang, X.; Gao, C.; Zhang, S. ‘The niche evolution of cross-boundary innovation for Chinese SMEs in the context of digital transformation——Case study based on dynamic capability’. Technol. Soc. 2022, 68, art. 101870.0. [Google Scholar] [CrossRef]
- Zofio, J.L.; Aparicio, J.; Barbero, J.; Zabala-Iturriagagoitia, J.M. ‘The influence of bottlenecks on innovation systems performance: Put the slowest climber first’. Technol. Forecast. Soc. Change 2023, 193, art. 122607. [Google Scholar] [CrossRef]
Figure 1.
Graphical abstract: data source, corrections, variable structure and analytical strategy.
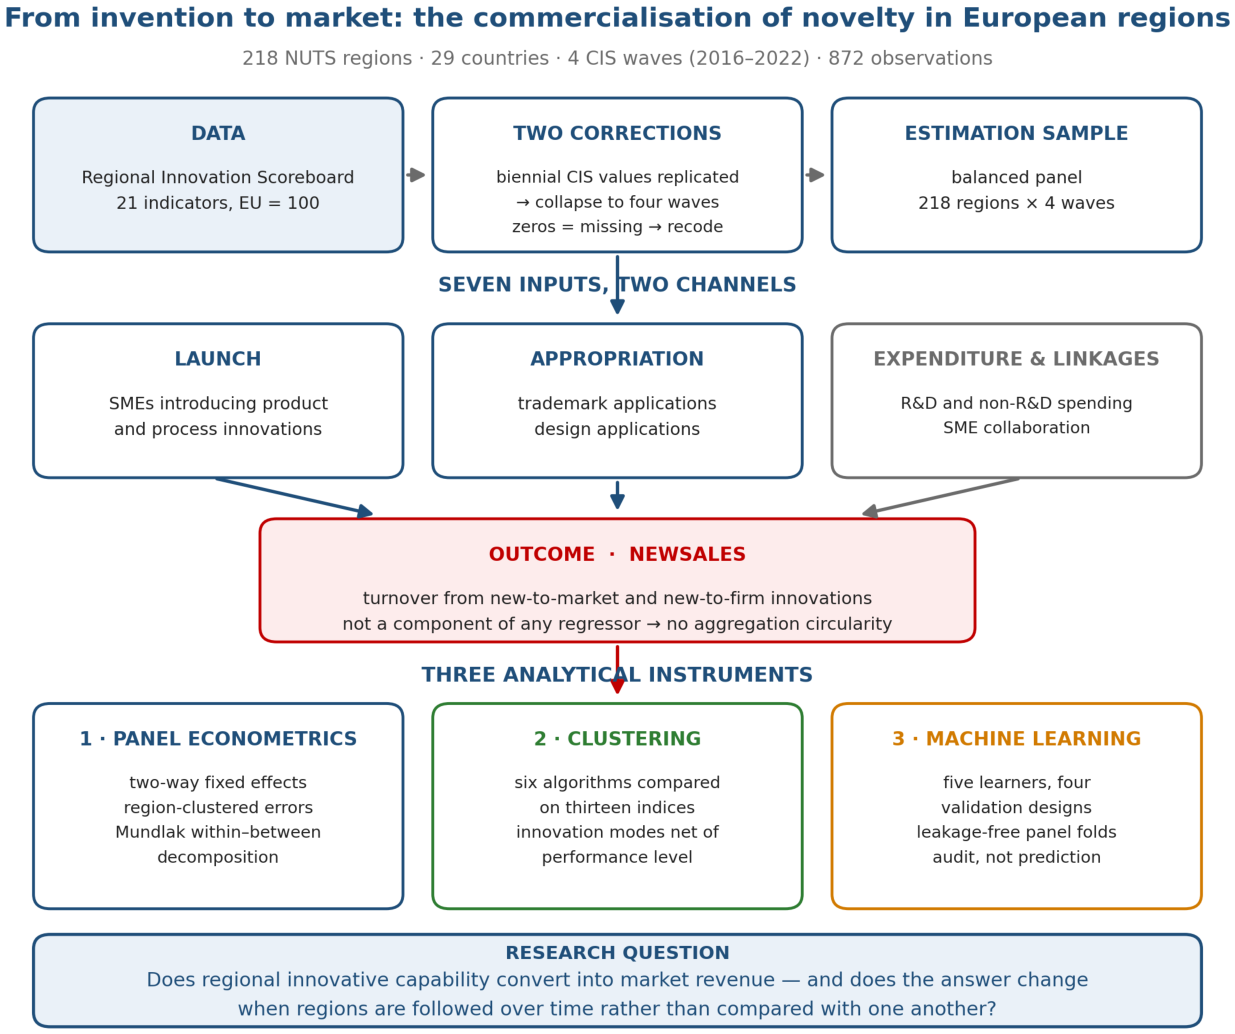
Figure 2.
Coefficient estimates with 95 per cent confidence intervals across the six specifications.
Figure 2.
Coefficient estimates with 95 per cent confidence intervals across the six specifications.
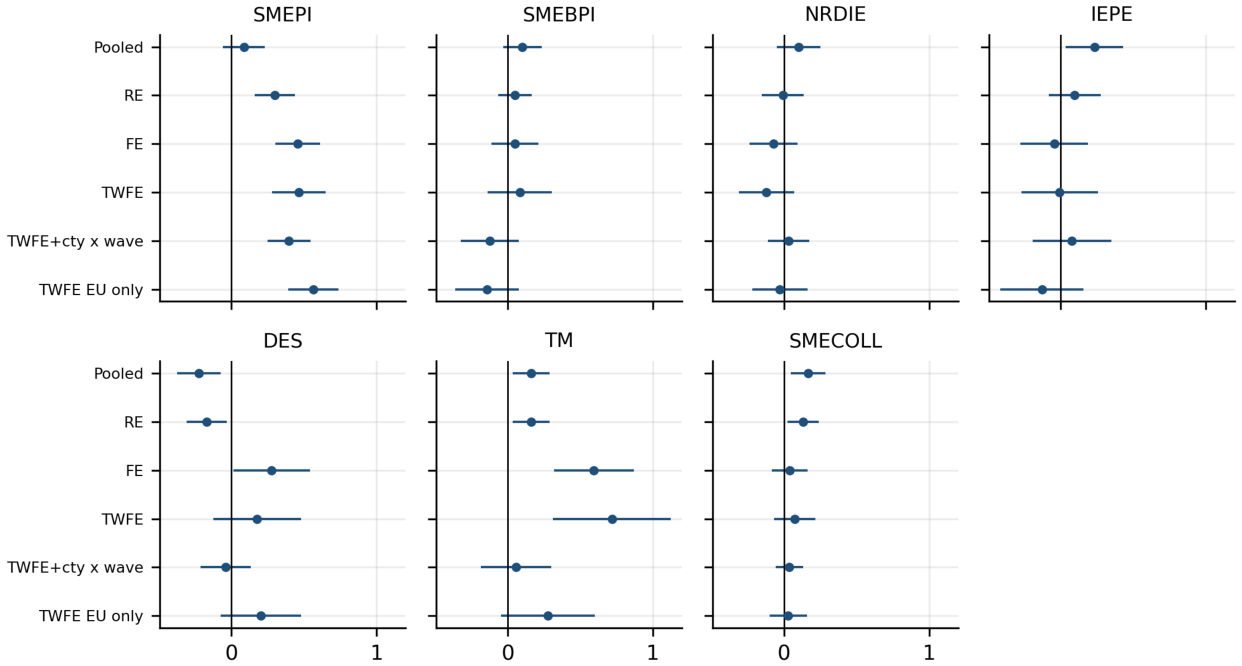
Figure 3.
Within-region and between-region coefficients with 95 per cent confidence intervals. Grey lines connect the two estimates for each variable.
Figure 3.
Within-region and between-region coefficients with 95 per cent confidence intervals. Grey lines connect the two estimates for each variable.
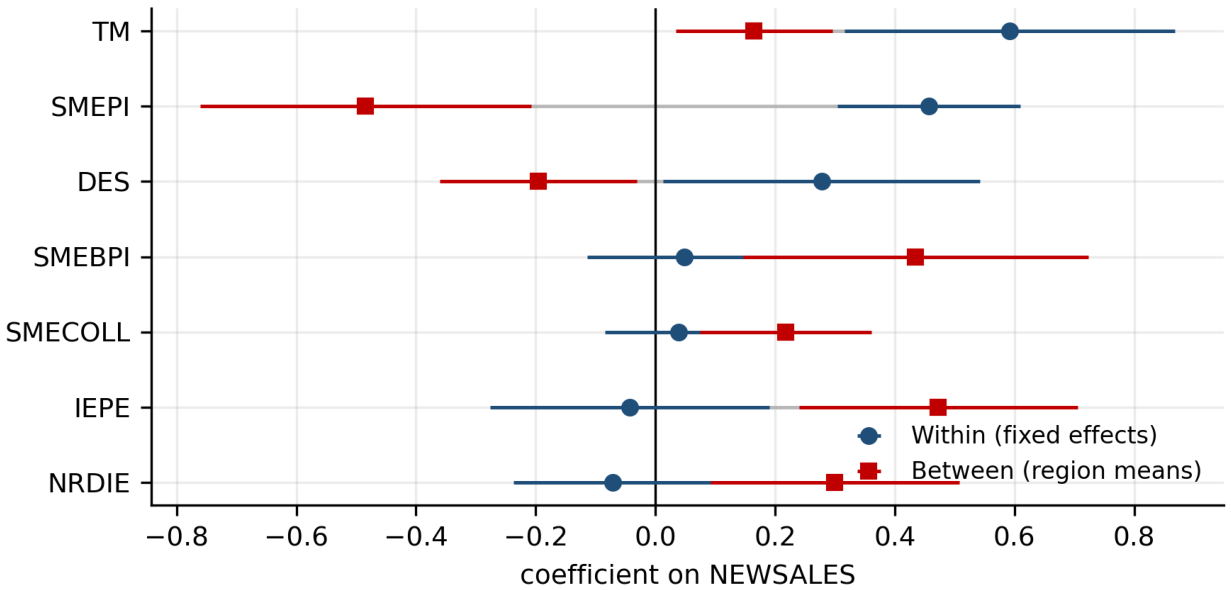
Figure 3.
Validation indices normalised to the [0, 1] interval, with 1 denoting the best value across algorithms. Indices for which lower is better are inverted.
Figure 3.
Validation indices normalised to the [0, 1] interval, with 1 denoting the best value across algorithms. Indices for which lower is better are inverted.
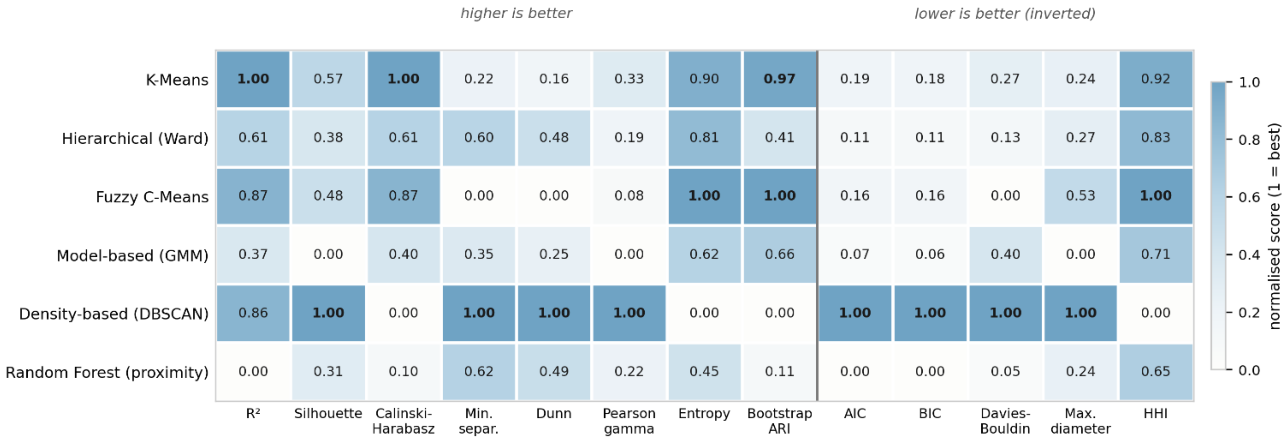
Figure 4.
Regional innovation modes: centroid profiles and the distribution of regions in the clustering space.
Figure 4.
Regional innovation modes: centroid profiles and the distribution of regions in the clustering space.
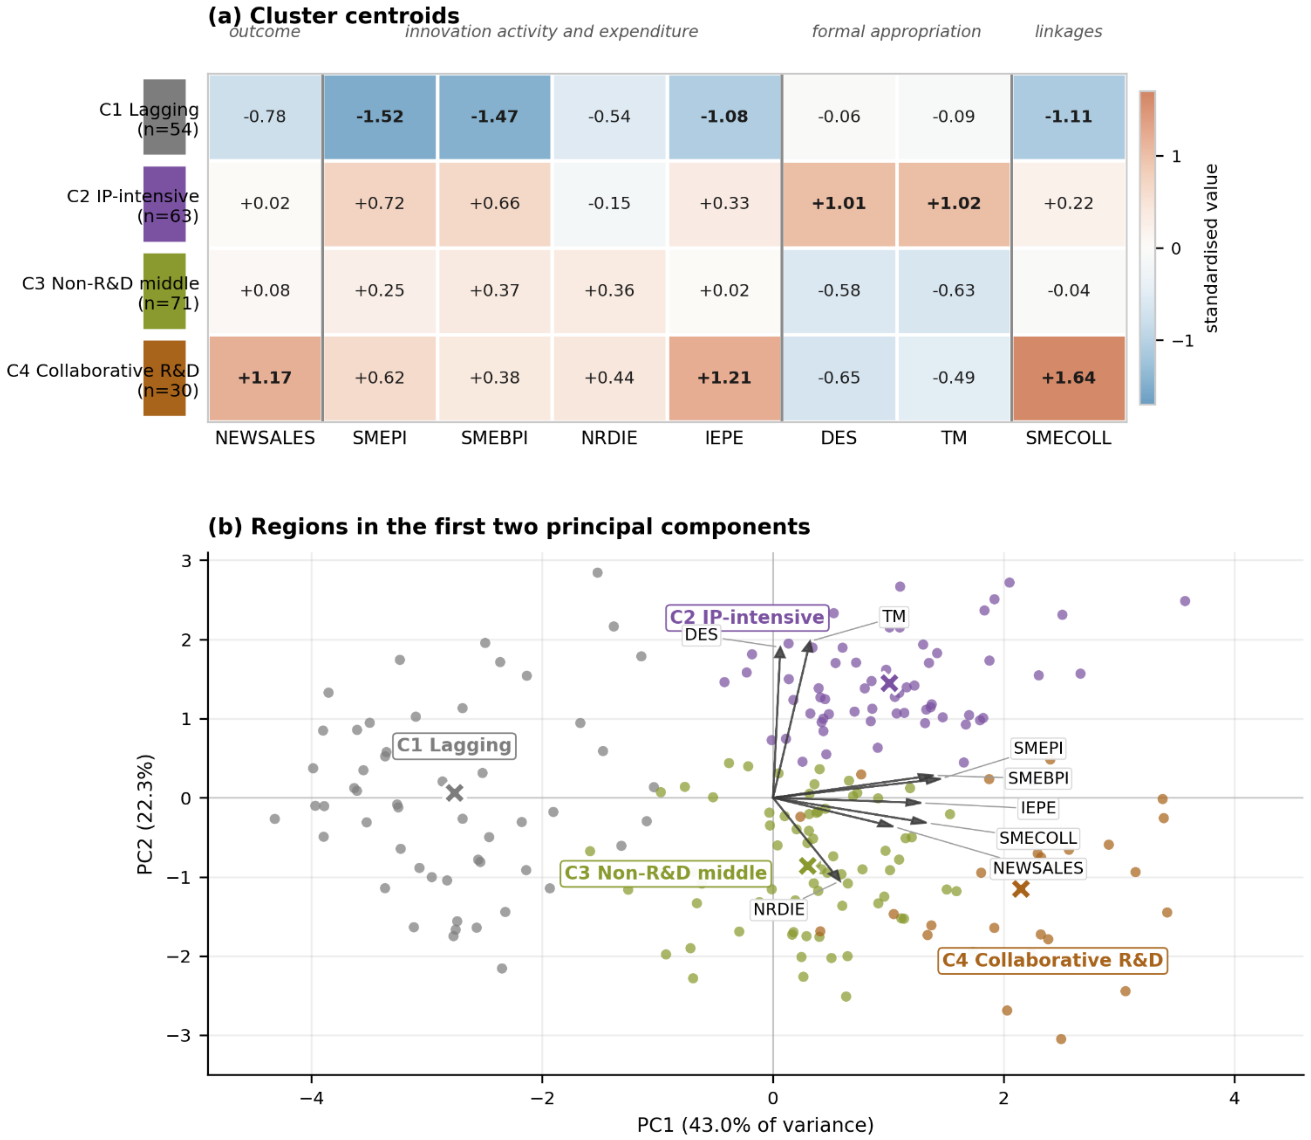
Figure 5.
Cluster-specific two-way fixed-effects coefficients with 95 per cent confidence intervals.
Figure 5.
Cluster-specific two-way fixed-effects coefficients with 95 per cent confidence intervals.
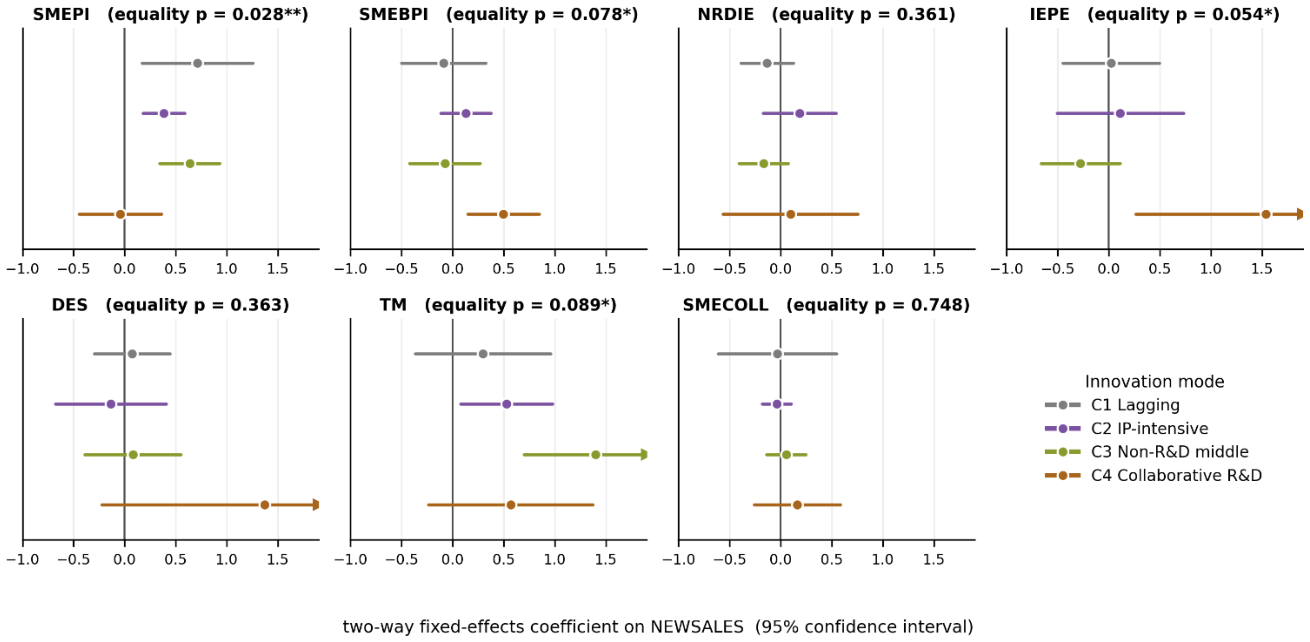
Figure 6.
Out-of-sample R² by algorithm and validation design.
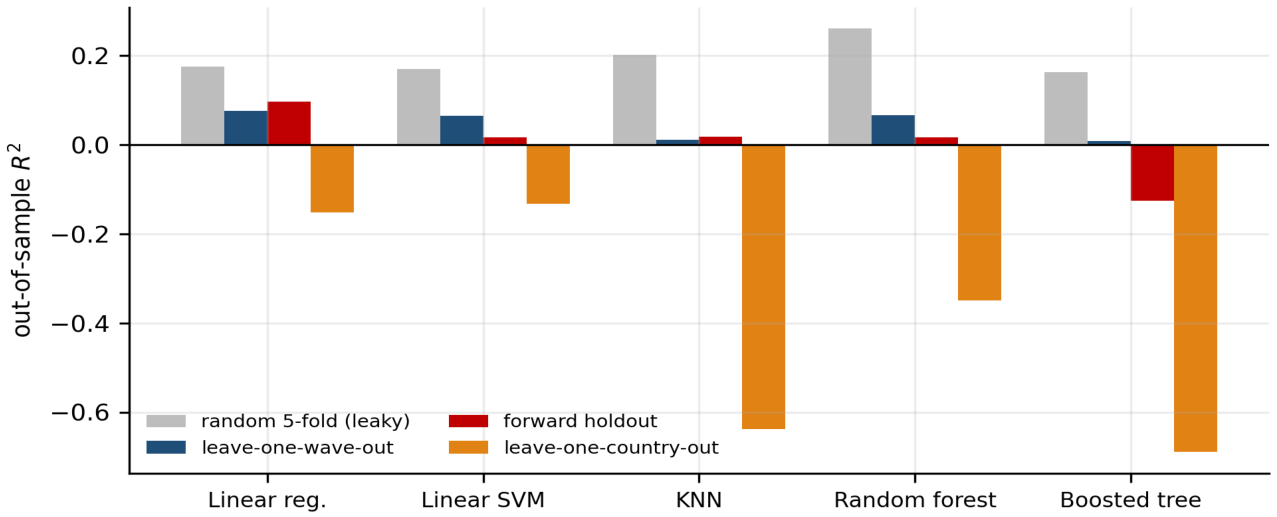
Figure 7.
Permutation importance with standard deviations (left) and its relationship to fixed-effects t-statistics (right).
Figure 7.
Permutation importance with standard deviations (left) and its relationship to fixed-effects t-statistics (right).
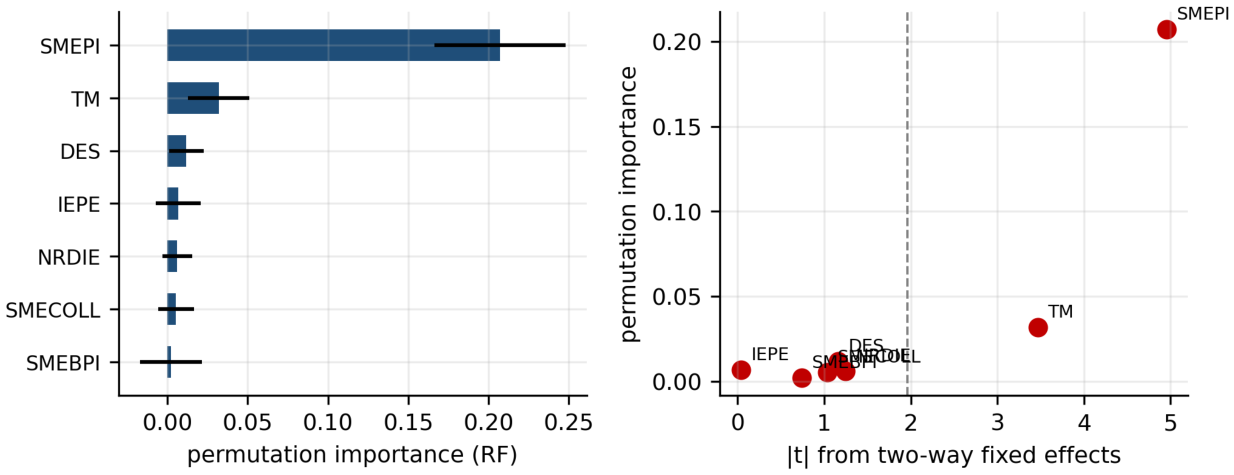
Figure 8.
Random-forest partial dependence functions against the fitted linear relationship from the two-way fixed-effects model.
Figure 8.
Random-forest partial dependence functions against the fitted linear relationship from the two-way fixed-effects model.
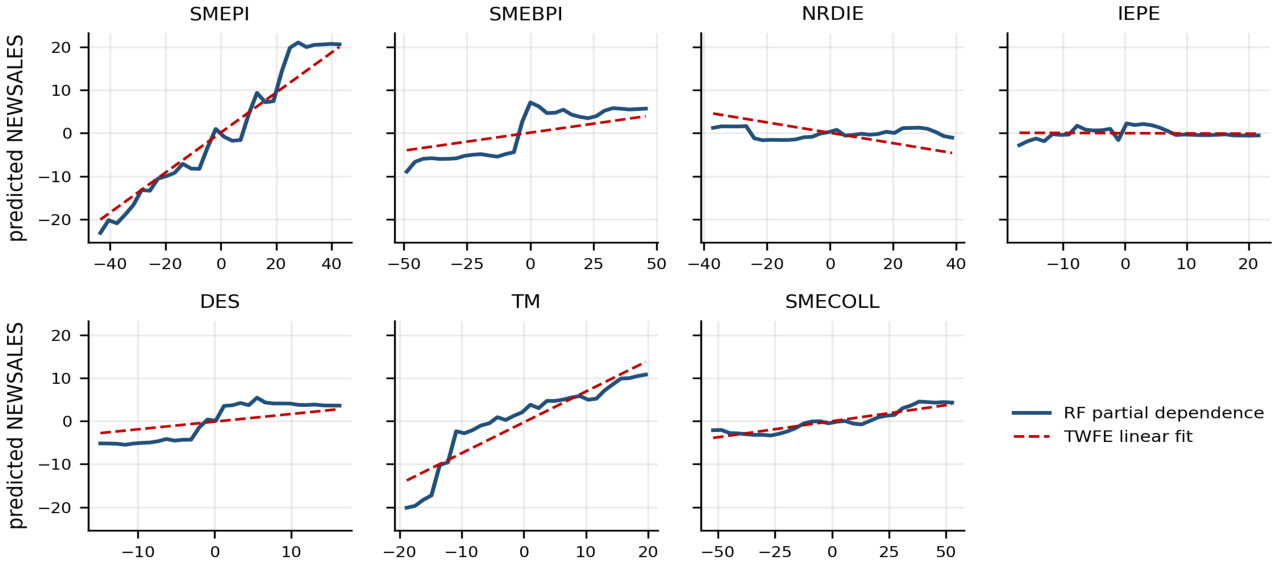
Table 1.
Descriptive statistics and variance decomposition.
| Variable | Mean | SD total | SD between | SD within | Within share | Min | Max |
|---|---|---|---|---|---|---|---|
| NEWSALES | 116.61 | 58.66 | 44.78 | 43.84 | 0.419 | 5.61 | 274.97 |
| SMEPI | 120.48 | 54.17 | 47.33 | 30.58 | 0.239 | 5.25 | 228.51 |
| SMEBPI | 119.47 | 54.83 | 46.78 | 33.15 | 0.274 | 2.48 | 241.40 |
| NRDIE | 105.30 | 36.73 | 28.33 | 27.04 | 0.407 | 22.35 | 239.01 |
| IEPE | 101.38 | 32.59 | 30.04 | 14.74 | 0.154 | 10.47 | 191.66 |
| DES | 76.35 | 36.46 | 34.95 | 12.23 | 0.085 | 6.54 | 173.08 |
| TM | 93.21 | 51.17 | 49.90 | 13.53 | 0.053 | 10.09 | 245.91 |
| SMECOLL | 127.69 | 68.33 | 61.14 | 35.45 | 0.202 | 15.05 | 309.04 |
Table 2.
Determinants of innovative sales.
| (1) Pooled OLS | (2) Random effects | (3) FE region | (4) FE region + wave | (5) FE + country×wave | (6) EU regions only | |
|---|---|---|---|---|---|---|
| SMEPI | 0.087 | 0.300*** | 0.457*** | 0.466*** | 0.396*** | 0.565*** |
| (0.074) | (0.071) | (0.078) | (0.094) | (0.075) | (0.089) | |
| SMEBPI | 0.102 | 0.051 | 0.049 | 0.084 | −0.122 | −0.143 |
| (0.068) | (0.059) | (0.083) | (0.113) | (0.102) | (0.111) | |
| NRDIE | 0.100 | −0.009 | −0.071 | −0.121 | 0.032 | −0.029 |
| (0.077) | (0.074) | (0.084) | (0.097) | (0.073) | (0.097) | |
| IEPE | 0.234** | 0.098 | −0.043 | −0.005 | 0.078 | −0.127 |
| (0.101) | (0.090) | (0.118) | (0.135) | (0.138) | (0.146) | |
| DES | −0.222*** | −0.168** | 0.278** | 0.178 | −0.039 | 0.204 |
| (0.077) | (0.071) | (0.134) | (0.154) | (0.088) | (0.141) | |
| TM | 0.161** | 0.161** | 0.592*** | 0.717*** | 0.056 | 0.276* |
| (0.064) | (0.064) | (0.140) | (0.207) | (0.123) | (0.165) | |
| SMECOLL | 0.165*** | 0.130** | 0.039 | 0.075 | 0.036 | 0.029 |
| (0.062) | (0.055) | (0.062) | (0.072) | (0.048) | (0.066) | |
| Region fixed effects | No | — | Yes | Yes | Yes | Yes |
| Wave fixed effects | No | No | No | Yes | country×wave | Yes |
| Observations | 872 | 872 | 872 | 872 | 852 | 796 |
| Regions | 218 | 218 | 218 | 218 | 213 | 199 |
| Within R² | 0.095 | 0.162 | 0.216 | 0.208 | 0.677 | 0.224 |
Notes: dependent variable is the rescaled index of sales of new-to-market and new-to-firm innovations. Standard errors clustered by region in parentheses. *** p<0.01, ** p<0.05, * p<0.10. Column (5) includes a full set of country×wave dummies and is restricted to countries with at least two regions.
Table 4.
Selection of the number of clusters (k-means).
| k | Silhouette | Calinski–Harabasz | Davies–Bouldin | Dunn | R² | η² of NEWSALES | Gap |
|---|---|---|---|---|---|---|---|
| 2 | 0.324 | 103.3 | 1.185 | 0.113 | 0.324 | 0.207 | 0.797 |
| 3 | 0.255 | 90.0 | 1.448 | 0.123 | 0.456 | 0.248 | 0.906 |
| 4 | 0.246 | 77.0 | 1.475 | 0.089 | 0.519 | 0.342 | 0.937 |
| 5 | 0.244 | 71.0 | 1.354 | 0.119 | 0.571 | 0.344 | 0.998 |
| 6 | 0.234 | 66.1 | 1.433 | 0.119 | 0.609 | 0.446 | 1.039 |
| 7 | 0.230 | 60.8 | 1.347 | 0.129 | 0.633 | 0.422 | 1.049 |
| 8 | 0.222 | 56.6 | 1.407 | 0.129 | 0.654 | 0.430 | 1.071 |
Table 5.
Comparison of six clustering algorithms at k = 4.
| Index | K-Means | Ward | Fuzzy C-Means | GMM | DBSCAN | RF proximity |
|---|---|---|---|---|---|---|
| Regions classified | 218 | 218 | 218 | 218 | 158 | 218 |
| R² | 0.519 | 0.487 | 0.509 | 0.467 | 0.508 | 0.437 |
| AIC | 3738.0 | 3851.4 | 3775.9 | 3917.0 | 2529.3 | 4013.5 |
| BIC | 3849.7 | 3963.1 | 3887.6 | 4028.7 | 2630.4 | 4125.2 |
| Silhouette | 0.246 | 0.221 | 0.233 | 0.168 | 0.305 | 0.210 |
| Calinski–Harabasz | 77.0 | 67.7 | 73.9 | 62.6 | 53.0 | 55.4 |
| Davies–Bouldin | 1.475 | 1.549 | 1.619 | 1.407 | 1.083 | 1.591 |
| Maximum diameter | 6.646 | 6.602 | 6.239 | 6.989 | 5.578 | 6.646 |
| Minimum separation | 0.588 | 1.076 | 0.312 | 0.753 | 1.586 | 1.100 |
| Dunn | 0.089 | 0.163 | 0.050 | 0.108 | 0.284 | 0.166 |
| Pearson gamma | 0.547 | 0.518 | 0.496 | 0.480 | 0.684 | 0.525 |
| Normalised entropy | 0.969 | 0.941 | 0.997 | 0.882 | 0.697 | 0.831 |
| Herfindahl–Hirschman | 2699 | 2921 | 2519 | 3194 | 4881 | 3338 |
| Bootstrap ARI | 0.749 | 0.567 | 0.760 | 0.650 | 0.435 | 0.470 |
| Mean rank (1 = best) | 2.58 | 3.54 | 3.15 | 4.46 | 2.69 | 4.58 |
Notes: AIC and BIC computed from a spherical Gaussian likelihood on the partition. Bold marks the best value among the five algorithms that classify all 218 regions. The Gaussian mixture selects a diagonal covariance structure by BIC. Fuzzy c-means has a partition coefficient of 0.366 and partition entropy of 1.171. DBSCAN with ε = 1.42 and minPts = 5 leaves 27.5 per cent of regions unassigned.
Table 6.
Cluster profiles: standardised centroids and raw means.
| C1 Lagging | C2 IP-intensive | C3 Non-R&D middle | C4 Collaborative R&D | |
|---|---|---|---|---|
| Regions | 54 | 63 | 71 | 30 |
| NEWSALES | −0.78 (81.7) | 0.02 (117.6) | 0.08 (120.1) | 1.17 (169.0) |
| SMEPI | −1.52 (48.7) | 0.72 (154.5) | 0.25 (132.5) | 0.62 (149.8) |
| SMEBPI | −1.47 (51.0) | 0.66 (150.4) | 0.37 (136.6) | 0.38 (137.2) |
| NRDIE | −0.54 (90.2) | −0.15 (101.1) | 0.36 (115.3) | 0.44 (117.7) |
| IEPE | −1.08 (68.9) | 0.33 (111.4) | 0.02 (101.9) | 1.21 (137.6) |
| DES | −0.06 (74.2) | 1.01 (111.7) | −0.58 (56.3) | −0.65 (53.6) |
| TM | −0.09 (88.5) | 1.02 (144.0) | −0.63 (61.9) | −0.49 (68.9) |
| SMECOLL | −1.11 (59.9) | 0.22 (141.1) | −0.04 (125.1) | 1.64 (227.9) |
Notes: standardised centroids with raw index means in parentheses. Clusters ordered by mean NEWSALES.
Table 7.
Out-of-sample performance by algorithm and validation design.
| Linear regression | Linear SVM | KNN | Random forest | Boosted tree | |
|---|---|---|---|---|---|
| D1. Random 5-fold (leaky) | |||||
| R² | 0.176 | 0.170 | 0.202 | 0.261 | 0.163 |
| MAE | 25.28 | 24.64 | 24.84 | 23.20 | 24.85 |
| RMSE | 34.21 | 34.34 | 33.66 | 32.42 | 34.48 |
| D2. Leave-one-wave-out | |||||
| R² | 0.077 | 0.066 | 0.012 | 0.067 | 0.009 |
| MAE | 35.99 | 35.32 | 36.49 | 35.90 | 37.39 |
| RMSE | 47.38 | 47.67 | 49.06 | 47.67 | 49.09 |
| D3. Forward holdout (w1–3 → w4) | |||||
| R² | 0.097 | 0.017 | 0.019 | 0.017 | −0.125 |
| MAE | 35.65 | 36.21 | 35.96 | 36.70 | 39.34 |
| RMSE | 46.88 | 48.91 | 48.87 | 48.91 | 52.32 |
| D4. Leave-one-country-out (median) | |||||
| R² | −0.151 | −0.132 | −0.637 | −0.349 | −0.689 |
| MAE | 41.82 | 41.80 | 51.95 | 50.76 | 47.67 |
| RMSE | 48.83 | 51.53 | 59.58 | 60.39 | 57.47 |
Notes: designs D1–D3 operate on within-transformed data; in D2 and D3 the region means used for the transformation are computed from training observations only. D4 is estimated in levels on the 21 countries with at least three regions and reports medians across held-out countries. Errors are in index points, where the European average equals 100.
Table 8.
Permutation importance against fixed-effects inference.
| Variable | Permutation importance | SD | ML rank | TWFE |t| | FE rank | TWFE standardised β |
|---|---|---|---|---|---|---|
| SMEPI | 0.207 | 0.041 | 1 | 4.95 | 1 | 0.325 |
| TM | 0.032 | 0.019 | 2 | 3.47 | 2 | 0.221 |
| DES | 0.012 | 0.011 | 3 | 1.16 | 4 | 0.050 |
| IEPE | 0.007 | 0.014 | 4 | 0.04 | 7 | −0.002 |
| NRDIE | 0.006 | 0.009 | 5 | 1.25 | 3 | −0.075 |
| SMECOLL | 0.005 | 0.011 | 6 | 1.03 | 5 | 0.060 |
| SMEBPI | 0.002 | 0.019 | 7 | 0.74 | 6 | 0.063 |
Notes: permutation importance averaged over four leave-one-wave-out folds with 50 permutations each. Spearman rank correlation with |t|: 0.714 (p = 0.071).
Table 9.
Partial dependence against linear coefficients.
| Variable | PD slope | Linearity R² of the PD curve | TWFE coefficient |
|---|---|---|---|
| SMEPI | 0.551 | 0.967 | 0.466 |
| TM | 0.718 | 0.848 | 0.717 |
| DES | 0.406 | 0.813 | 0.178 |
| SMEBPI | 0.173 | 0.797 | 0.084 |
| SMECOLL | 0.078 | 0.870 | 0.075 |
| IEPE | 0.015 | 0.019 | −0.005 |
| NRDIE | 0.000 | 0.000 | −0.121 |
Notes: partial dependence computed on region-demeaned data over a 30-point grid. Correlation between PD slope and TWFE coefficient across the seven variables: 0.961.
Disclaimer/Publisher’s Note: The statements, opinions and data contained in all publications are solely those of the individual author(s) and contributor(s) and not of MDPI and/or the editor(s). MDPI and/or the editor(s) disclaim responsibility for any injury to people or property resulting from any ideas, methods, instructions or products referred to in the content. |
© 2026 by the authors. Licensee MDPI, Basel, Switzerland. This article is an open access article distributed under the terms and conditions of the Creative Commons Attribution (CC BY) license (http://creativecommons.org/licenses/by/4.0/).
Copyright: This open access article is published under a Creative Commons CC BY 4.0 license, which permit the free download, distribution, and reuse, provided that the author and preprint are cited in any reuse.