
Submitted:
28 August 2026
Posted:
31 August 2026
You are already at the latest version
Abstract
Background Esthesioneuroblastoma (ENB) is a rare neuroectodermal tumor arising from the ol-factory epithelium. This study aimed to identify survival determinants and construct a prognostic web-based nomogram using the Surveillance, Epidemiology, and End Results (SEER) database records. Methods The SEER database, including 18 registries across the nation, was queried for patients diagnosed with ENB between 2000 and 2020. Patient demographics, tumor characteristics, and treatment data were analyzed using Cox Proportional Hazard models and Kaplan-Meier based survival plots. A web-based nomogram was constructed to predict 5- and 10-year survival proba-bilities individualized to a specific patient. Results 941 patients were included in this analysis. Overall survival rates at 1-, 2-, 5-, and 10-years were 89%, 85%, 75%, and 58%, respectively. Multivariable analysis showed worse OS associated with age > 50 (p< 0.001) and tumor size >6.0 cm (p< 0.01). Compared to patients treated with gross total resection (GTR), worse OS was observed in those treated with chemotherapy (CT) only (p< 0.01), CT and radiation (RT, p< 0.01), GTR + CT (p< 0.05), RT only (p< 0.01), or no treatment (p< 0.001). No statistically significant differences in OS were observed for patients treated with GTR + RT, GTR + RT + CT, subtotal resection (STR), or STR with adjuvant therapies when compared to GTR alone. Our web-based nomogram is publicly available (link). This model demonstrated a strong predictive performance, with a C-index of 0.733±0.041 and AUC of 0.747. Conclusion This is currently the largest retrospective cohort study to analyze survival determinants in patients with ENB. This is the first nomogram-based app developed for this specific patient population. We hope this will help guide clinicians to have more meaningful discussions with their patients and employ evidence-based practices.
Keywords:
esthesioneuroblastoma
; surveillance
; epidemiology and end result (SEER)
; overall survival
; survival analysis
1. Introduction
Esthesioneuroblastoma (ENB) is a sinonasal tumor also known as olfactory neuroblastoma that was first described in 1924 [1,2,3,4]. This tumor is of neuroectodermal origin, begins in basal progenitor cells of the olfactory epithelium near the cribriform plate, and accounts for 0.3% of upper aerodigestive tract cancers and 3-6% of all malignant nasal cavity tumors[2,3,4,5,6,7,8,9]. Although this tumor is rare in children, it is has a peak in individuals 50-60 years old and potentially displays bimodal distribution with an additional peak in individuals 11-20 years old (YO)[2,3,4,5,8].
Symptoms are usually unilateral, as the tumor is unilateral, and are dependent on the location of the tumor within the nasal cavity but are frequently nasal obstruction then epistaxis with headaches and hyposmia also being possible. Due to the symptoms mimicking infection, the diagnosis can be delayed 6-12 months[2,5,6,9]. Patients who present with sinonasal tumor symptoms are often referred to neurology/neurosurgery, ophthalmology and otolaryngology for a diagnostic work-up, as these patients could present with cranial nerve abnormalities (facial paresthesia, olfactory or ophthalmic deficits), middle ear effusion, proptosis or conjunctival injection[5].
Diagnosis is typically endoscopic with confirmatory histology/biopsy while imaging (computerized tomography and magnetic resonance imaging) is also critical for initial evaluation[4]. Histologically, ENB is well-differentiated with well-demarcated sheets of uniform submucosal cells with scant cytoplasm and round nuclei separated by vascular or hyalinized fibrous stroma[5]. Rosettes (Flexner-Wintersteiner) or pseudorosettes (Homer Wright) may also be present as well as an intracellular eosinophilic fibrillary background[6]. Histological factors including fibrillary matrix amount, mitotic activity, nuclear polymorphism, necrosis amount, and rosette formation were included in Hyams 1988 complex 4-grade system[10]. Since then, Malouf has proposed alternative grading systems using low versus high grade histology in 2013[3]. Staging systems are also variable and are location dependent. Kadish was the first to describe staging in 1976 based on tumor location in the nasal cavity (A-C), paranasal sinuses (B-C) and beyond (C)[11]. This was later updated by Biller in 1990 and Dulguerov-Calcaterra in 1992 to more distinctly specify tumor location based on the sphenoid/ethmoid bones and brain extension[12,13].
Treatment of ENB can be done via surgery, radiation and chemotherapy, alone or in combination. Given the location of the tumor near the orbit and anterior skull base, complete resection is not always possible. The most common treatment modality is surgery (anterior craniofacial resection) and post-operative radiation, the full benefit of radiation is not well defined. In unresectable or metastatic tumors adjuvant chemotherapy is indicated, but some sources note that its benefit is unknown with others reserving it for palliative care options[2,3,5,8]. While recurrence of ENB has a late manifestation (5-10 years after treatment) the percent of local recurrence (16-40%) and distance metastasis (0-60%) is variable in the literature[5,6,7,8,14].
ENB is particularly challenging to diagnose and distinguish from other sinonasal tumors due to (1) its low incidence (0.4 cases per million people) and few case reports (~1,200), (2) its variable presentation, ranging from localized to metastatic (17% of adults demonstrate lymph node metastasis at diagnosis) at onset and (3) its lack of universal grading, staging and treatment[2,4,7]. Thus, over the past 2 decades, in patients with ENB there has been no chance in survival rates likely due to these factors[15].
2. Materials and Methods
No Institutional Review Board approval was required because the data utilized in this dataset is publicly available. Our study complies with the National Cancer Institute’s (NCI) Surveillance, Epidemiology and End Result (SEER) database user agreement.
The SEER database, including 18 registries across the nation, was queried for patients diagnosed with ENB between 2000 and 2020. Patient demographics, tumor characteristics, and treatment data were analyzed using Cox Proportional Hazard models and Kaplan-Meier based survival plots. A web-based nomogram was constructed to predict 5- and 10-year survival probabilities individualized to a specific patient.
2.1. Study Design and Cohort Selection
Data from 2000 to 2022 across 18 registries were gathered from the SEER database to retrospectively analyze patients diagnosed with ENB. The International Classification for Oncology, version 3 (ICD-O-3) histology code used was 9522/3 (Olfactory Neuroblastoma). The primary endpoint of this study was overall survival (OS) and is denoted by the time from diagnosis until death. To identify prognostic factors, univariate and multivariable Cox Proportional Hazard models were generated to analyze patient demographic, tumor and treatment variables. Kaplan-Meier Curves (KMC) were used to estimate survival and the web-based nomogram we created can estimate individualized, patient-specific 5- and 10- year survival probabilities.
2.2. Statistical Analysis
Cox proportional hazard models were created with R (version 4.5.1, 2025) with “survival”, “survminer”, “ggplot2”, “readxl” and “rms” packages. All prognostic factors had a univariate survival analysis conducted while statistically significant (p<0.05) prognostic factors from our univariate analysis had a multivariable survival analysis conducted. Prognostic factors with statistically significant OS differences based on log-rank tests had KMCs generated. Then, a web-based nomogram was built using the cox multivariable proportional hazard model to assess patient-specific ENB 5- and 10- year survival probability.
3. Results
3.1. Demographics
941 patients had an ENB (Figure 1). There was a male (57%), white (65%) and ≥50YO (61%) predominance. The mean age of diagnosis was 53.91 ± 16.82 YO. Most patients received surgery (84%). Of the surgery patients, 31% received gross total resection (GTR) while 69% received subtotal resection (STR). Chemotherapy (CT) was given 70% of the time while radiotherapy (RT) was given 31% of the time. The tumor was mostly commonly located in the nasopharynx and nasal cavity (82%).
3.2. Overall Survival
Our analysis of 941 patients demonstrated a median 13.6-year and mean 12.83-year overall survival (OS) with an 89.6% 1-year survival probability (Table 1).
3.3. Survival Analysis
Our patients had 1-, 2-, 3-, 5- and 10-year survival probabilities of 89.6%, 84.7%. 80.3%. 74.7% and 58.2% respectively (Table 1). The univariate analysis included 941 patients investigating sex, age (0-50 and 50-100), race (white, Hispanic, American Indian/Alaska Native [AI/AN], Asian or Pacific Islander [API], black), year of diagnosis (2000-2010 and 2010-2020), tumor location (nasopharynx & nasal cavity, adrenal gland, central nervous system, lung, paranasal sinus, and salivary & lacrimal glands) and tumor size (<3, 3.0-6.0, >6.0cm), and treatment summary (GTR, STR, CT and RT combinations) (Table 2).
OS was statistically significantly impacted by sex, age, tumor size, tumor location, and treatment. Male patients had a worse OS than female patients (p<0.001). Patients who were >50 years old had a worse OS compared to those <50 years old (p<0.001). Patients with a tumor size 3.0-6.0cm (p<0.05) and >6.0cm (p<0.001) had a significantly worse OS than patients with a tumor size <3cm. Patients with a tumor in the adrenal gland (p<0.001) had a significantly worse OS than patients with a tumor in the nasopharynx & nasal cavity while patients with a paranasal sinus tumor (p<0.05) had a significantly greater OS. Patients who received CT, CT + RT, RT, STR + CT or no treatment had significantly worse OS than patient who received GTR alone (all p<0.001). Moreover, patients who received GTR + CT (p<0.01) and STR + CT + RT (p<0.05) had a significantly worse OS than patients who received GTR alone (Table 2).
Our multivariable analysis included sex, age, tumor size and treatment. To prevent duplication of variables, we excluded surgery, RT and CT from multivariable analysis as they were all encompassed in the treatment summary variable. Patients who were >50 years old had a worse OS than patients <50 years old (p<0.001). Patients who had a tumor size >6cm had a worse OS than patients with a tumor size <3cm. Patients who received no treatment (p<0.001), CT, CT + RT, RT (p<0.01) or GTR + CT (p<0.05) had significantly worse OS compared to patients who received GTR alone. Although sex and tumor location were significant during the univariate analysis, they lost their significance during the multivariable analysis. We made a forest plot representing our multivariable analysis (Figure 2). KMC survival plots were made for OS, sex, age and tumor size (Figure 3A-D) as well as surgical treatment, RT and CT (Figure 4A-C).
We then constructed a nomogram using sex, age, tumor location, tumor size and treatment summary to calculate 5- and 10-year survival probability (Figure 5). We also made a web-based nomogram for patients with and clinicians treating ENB to determine individual patient-specific survival.
We next tested our nomograms validity by plotting observed versus predicted 5-year survival which had a Concordance index (c-index) of 0.733±0.041. After, we constructed a Receiver Operator Characteristic (ROC) curve to obtain an Area Under the Curve (AUC) of 0.747 (Figure 6A-B).
4. Discussion
Our study found a median and mean OS of 13.6 years and 12.83 years respectively as well as 1-, 2-, 3-, 5- and 10-year survival probabilities of 89.6%, 84.7%. 80.3%. 74.7% and 58.2% respectively (Table 1). These survival numbers are in the middle compared to what is commonly cited in the literature.
Meta-analyses by Dulguerov et al., and Skolnick et al., with 390 and 49 patients found that 5-year OS was 45% and 52% respectively, while a cohort of 49 patients by Morita et al found a relatively higher 5-year OS of 69% respectively[6,16,17]. Tajudeen et al. found a 5- and 10- year OS of 61% and 50% respectively in a large cohort of 281 patients[18]. A meta-analysis of 97 patients by Elkon et al. noted a crude survival of 65.4% from 6mo-32 years depending on follow up with OS at 3 and 5 years being Kadish stage dependent[19].
Small retrospective cohorts by Zeng et al. and Rosenthal et al. found a 77% and 93% 5-year OS in 64 and 31 respectively[14,20]. Additional small retrospective cohorts by Eden et al., Bacher et al. and Dias et al. confirmed this finding with 40, 39 and 35 patients who averaged 5-year OS rates of 78%, 88% and 55% as well as 10-year OS rates of 71%, 69% and 46% respectively[7,8,21]. A small retrospective cohort of 17 patients by Kadish and colleagues had a 62% OS at 1 year[11]. Marinelli and colleagues found that in a large retrospective study of 118 patients with ENB who have distant metastases, OS was 54% at 6 months[9]. This highlights the large variability in OS with 5-year OS ranging from 45% to 93%[6,7,8,14,16,17,18,20,21].
4.1. Sex
Our study found that ENB was more common in males (57%), and that males had a significantly worse OS than females.
Large meta-analyses by Vuong et al (733 patients) and Tajudeen et all (281 patients) found that males were more likely to be diagnosed with ENB (57% and 55%) and also had a significantly worse OS[15,18].
However, Dias et al. and Morita et al. found that although males were more likely to be diagnosed with ENB (55% and 57%) sex did not impact OS[8,17]. Malouf and colleagues retrospectively investigated 44 ENB patients with a 1:1 sex ratio found that there was no difference between 5 year OS in males (62%) versus females (63%)[3]. Marinelli and colleagues found that sex did not impact OS[9].
Dulguerov & Calcaterra conducted a small retrospective cohort study of 24 patients distributed equally based on sex and found that females had a non-significantly worse progression free survival compared to males, but did not investigate OS[13]. This suggests that the true effect of sex on OS may not be fully understood.
4.2. Age
Our study had a mean age of diagnosis of 53.91 ± 16.82 years with a median of 55 years. This is concurrent with most of the literature that notes a peak age of onset 50 and 60 years (not necessarily the mean age of diagnosis, however). We also not that being >50 years old significantly worsens OS.
Tajudeen and colleagues had a mean age of diagnosis of 52 years and found that advanced age significantly worsened OS[18]. Dulguerov & Calcaterra found a mean and median age of diagnosis to be 40 and 41 years respectively, with a significantly worse prognosis (undefined) in patients > compared to < 50 years old[13]. Marinelli and colleagues confirmed that older age significantly impacts OS[9].
Morita and colleagues found a mean age of diagnosis of 48 years with bimodal peaks at ages 20-30 and 50-60 but found that age (3-37, 39-54, 55-62 years old) did not impact OS[17]. Bachar and colleagues supported this finding with a mean age of diagnosis of 50 years and age being non-impactful to survival[7]. Dias and colleagues found no significant difference between OS of patients under versus over 50 years old[8]. Malouf and colleagues lower median age of diagnosis at 43 years old and found a non-significant difference in 5 year OS in patients over (59%) versus under (66%) 46 years old[3]. Based on the literature and our findings, age impacts OS but the extent to which it does so is not fully known.
4.3. Race + Tumor Size + Tumor Location
Our study noted that race did not impact OS. While race was not widely explored in many ENB studies, a study of Vuong et al. (733 patients), Tajudeen et al. (281 patients) and Sharma et al. (561 patients) also noted that race did not impact OS[15,18,22].
Our analysis revealed that tumor size, both 3.0-6.0cm and >6.0cm impacted OS compared to <3.0 size. Other studies focused largely on tumor staging and grading rather than size. Our study found that tumors in the paranasal location versus the nasopharynx/nasal cavity significantly worsened OS. While we did not look specifically at tumors based on the Kadish grading system, stage A of the system is tumors confined to the nasal cavity while stage B includes tumors extending into the paranasal sinus[11]. Ours is slightly different as we looked at primary tumor site not extension/invasion of the tumor. Most studies in the literature note some inadequacies of the Kadish grading system with some combining stages A and B[12,13,21] and others adding stage D for distant metastases dubbed the modified Kadish[9,17,18]. Of those who use Kadish staging, a higher stage is correlated with worse outcomes including OS, disease free survival and local recurrence[3,7,8,9,13,17,19,20]. Although not explored here, this highlights the importance of considering grading and staging when determining survival.
4.4. Treatment
Our study found that GTR was a significantly better treatment option than CT, CT + RT, RT, STR + CT, GTR + CT, STR + CT + RT and no treatment at all. We found that OS was similar between patients who received GTR and STR.
Malouf et al., Vuong et al., Tajudeen et al., and Zeng et al. noted that treatment with either surgery or RT alone significantly improved OS compared to no treatment[3,15,18,20]. Malouf et al. and Vuong et al. noted that CT alone compared to no treatment significantly improved OS[3,15]. Zeng et al. further specified that surgery and RT combined lead to significantly better OS (84%) compared to surgery (51%) and RT (38%) alone[20]. However, Dulguerov & Calcaterra noted that 2 of 5 patients who were treatment with RT along died within 3.5 years, while 10 of 11 patients who received RT and surgery combined were alive and disease free for longer (years unspecified)[13].
Skolnik and colleagues found that 5 year OS was 64% for surgery, 38% for RT and 50% for combined therapy although significance calculations were not noted[16]. Morita et al. found that treatment with GTR and post-operative RT has a significantly better OS than STR alone or STR and RT combined[17].
Bachar et al., Elkon et al. and Eden et al. note the importance of Kadish staging with regards to treatment[7,19,21]. Elkon et al. suggests that RT and RT + surgery are equally effective for early stages (A-B) with later stages (C) being mostly palliative[19].
Marinelli et al. found that patients who received CT with either surgery and/or RT had the highest OS (95%) compared to patients who received monotherapy (56%) or no treatment (33%) at 6 months[9].
We also noted that STR and GTR had comparable OS. The literature either supports this finding or denotes the treatment modality as surgery and does not explore the difference between GTR and STR[13,16,19,20]. One potential reason for this, is that different surgical approaches can be applied to tumor removal. Open craniofacial resection and transfacial surgery can both be used for tumors spreading to the orbit or palate[23]. However, the literature notes that endoscopic endonasal approaches are often superior if negative margins can be obtained, as they avoid facial incision which can lead to facial scars or bone defects[4,23,24]. Overall, tumor size, location, proximity to other anatomic structures and patient comorbidities must be considered when electing the correct surgical approach. Considering there is no agreed upon standard-of-care, treatment needs to be tailored to the individual patient but one must note the importance of surgery (STR or GTR) as a treatment modality[23].
4.5. Nomogram
Nomograms offer a predicted survival based on demographic, pathological and clinical factors, serving as vital clinical tools to assist with cancer research and treatment. Using nomograms, physicians can provide individualized treatment plans based on patient-specific factors. Based on an individual variable’s significance in predicting the outcome of interest (OS), nomograms use a point-based system to assign weight to each factor.
Normally, only significant variables are included in nomograms to ensure high clinical utility. However, non-significant demographic variables are frequently included as they can help to improve patient stratification. Nomograms can handle these variables by assigning lower points to the non-significant versus significant variables.
Our nomogram was built with a large patient cohort (n = 941), but additional data can improve the model’s current predictability. To validate our nomogram, we used a predicted versus observed 5-year survival and ROC curve. Predictive accuracy was measured by a c-index to gain an understanding of our model’s ability to correctly discriminate between outcomes (alive versus dead). Our value of 0.733±0.041 highlights a strong predictive value which is supported by an AUC of 0.747 indicating a strong distinguishing ability of survivors versus non-survivors of ENB.
Based on patients’ sex, age, tumor size and tumor location, clinicians can determine the best treatment for patients and simultaneously counsel patients on their predicted OS based on a given treatment. Our web-based nomogram is the first to be done for ENB and provides a quick and easy method for providers to help guide clinic-decision making.
4.6. Limitations
The SEER database has limitations, including lack of (1) treatment timing, which makes it challenging to determine which treatment to perform first (GTR vs RT for this study); (2) tumor recurrence rate; (3) repeated surgery number; and (4) disease progression. Moreover, in addition to incomplete/inaccurate data, without an experimental control, retrospective analyses lack strong internal validity. These factors do limit our study’s generalizability and should be considered during the clinical decision-making process.
5. Conclusions
In this study we examined the most significant prognostic factors for determining OS in 941 patients with ENB. We found that sex, age, tumor size, tumor location and treatment modality all play important roles in OS. We also provided KMC curves for our significant univariate variables as well as a forest plot and nomogram for our significant multivariable. Moreover, our web-based nomogram offers a personalized calculation of patient-specific survival based on age, sex, race, tumor size and location and treatment modality. This is the first web-based nomogram developed for ENB.
Author Contributions
Conceptualization, J.L.B., A.S.B, S. A., K.R. and E.A.M.; methodology, J.L.B., A.S.B, S. A., K.R. and E.A.M.; validation, J.L.B., A.S.B, S. A., K.R. and E.A.M.; formal analysis, J.L.B., A.S.B, S. A., K.R. and E.A.M.; investigation, J.L.B., A.S.B, S. A., K.R. and E.A.M.; data curation, J.L.B., A.S.B, S. A., K.R. and E.A.M.; writing—original draft preparation, J.L.B., A.S.B, S. A., K.R. and E.A.M.; writing—review and editing, J.L.B., A.S.B, S. A., K.R. and E.A.M.; visualization, J.L.B., A.S.B, S. A., K.R. and E.A.M.; supervision, S. A., K.R. and E.A.M.. All authors have read and agreed to the published version of the manuscript.
Funding
This research received no external funding.
Institutional Review Board Statement
No Institutional Review Board approval was required because the data utilized in this dataset is publicly available. Our study complies with the National Cancer Insti-tute’s (NCI) Surveillance, Epidemiology and End Result (SEER) database user agree-ment.
Informed Consent Statement
Patient consent was waived due to this study we used public database.
Data Availability Statement
We used de-identified information that is publicly available via the SEER database which is published by NCI.
Acknowledgments
Not applicable.
Conflicts of Interest
The authors declare no conflicts of interest.
Abbreviations
The following abbreviations are used in this manuscript:
| ENB | Esthesioneuroblastoma |
| YO | Years Old |
| SEER | Surveillance, Epidemiology and End Result |
| NCI | National Cancer Institute’s |
| ICD-O-3 | International Classification for Oncology, version 3 |
| OS | Overall Survival |
| KMC | Kaplan-Meier Curves |
| GTR | Gross Total Resection |
| STR | Subtotal Resection |
| CT | Chemotherapy |
| RT | Radiotherapy |
| AI/AN | American Indian/Alaska Native |
| API | Asian or Pacific Islander |
| C-index | Concordance index |
| ROC | Receiver Operator Characteristic |
| AUC | Area Under the Curve |
References
- Berger, L.; Luc, R.; Richard, D. L’esthesioneuroepitheliome Olfactif. Bull. Assoc. Fr. Etude Cancer 1924, vol. 13, 410–421. [Google Scholar]
- Dumont, B.; et al. , Esthesioneuroblastoma in children, adolescents and young adults. Bull. Du. Cancer 2020, vol. 107(no. 9), 934–945. [Google Scholar] [CrossRef]
- Malouf, G. G.; Casiraghi, O.; Deutsch, E.; Guigay, J.; Temam, S.; Bourhis, J. Low- and high-grade esthesioneuroblastomas display a distinct natural history and outcome. Eur. J. Cancer 2013, vol. 49(no. 6), 1324–1334. [Google Scholar] [CrossRef]
- Fiani, B.; et al. Esthesioneuroblastoma: A Comprehensive Review of Diagnosis, Management, and Current Treatment Options. World Neurosurg. 2019, vol. 126, 194–211. [Google Scholar] [CrossRef]
- Ow, T. J.; Bell, D.; Kupferman, M. E.; DeMonte, F.; Hanna, E. Y. Esthesioneuroblastoma. Neurosurg. Clin. N. Am. 2013, vol. 24(no. 1), 51–65. [Google Scholar] [CrossRef]
- Dulguerov, P.; Allal, A. S.; Calcaterra, T. C. Esthesioneuroblastoma: a meta-analysis and review. Lancet Oncol. 2001, vol. 2(no. 11), 683–690. [Google Scholar] [CrossRef]
- Bachar, G.; et al. , Esthesioneuroblastoma: The Princess Margaret Hospital experience. Head Neck 2008, vol. 30(no. 12), 1607–1614. [Google Scholar] [CrossRef]
- Dias, F. L.; et al. Patterns of Failure and Outcome in Esthesioneuroblastoma. Arch. Otolaryngol. Head Neck Surg. 2003, vol. 129(no. 11), 1186–1192. [Google Scholar] [CrossRef]
- Marinelli, J. P.; et al. Esthesioneuroblastoma with distant metastases: Systematic review & meta-analysis. Head Neck 2018, vol. 40(no. 10), 2295–2303. [Google Scholar] [CrossRef]
- Hyams, V. J.; Batsakis, J. G.; Michaels, L. Tumors of the Upper Respiratory Tract and Ear. In Armed Forces Institute of Pathology; 1988. [Google Scholar]
- Kadish, S.; Goodman, M.; Wang, C. C. Olfactory neuroblastoma—A clinical analysis of 17 cases. Cancer 1976, vol. 37(no. 3), 1571–1576. [Google Scholar] [CrossRef]
- Biller, H. F.; Lawson, W.; Sachdev, V. P.; Som, P. Esthesioneuroblastoma: Surgical treatment without radiation. The Laryngoscope 1990, vol. 100(no. 11), 1199–1201. [Google Scholar] [CrossRef]
- Dulguerov, P.; Calcaterra, T. Esthesioneuroblastoma: The UCLA experience 1970–1990. The Laryngoscope 1992, vol. 102(no. 8), 843–849. [Google Scholar] [CrossRef]
- Rosenthal, D. I.; et al. Sinonasal malignancies with neuroendocrine differentiation. Cancer 2004, vol. 101(no. 11), 2567–2573. [Google Scholar] [CrossRef]
- Vuong, H. G.; Nguyen, D. D.; El-Rassi, E.; Ngo, T. N. M.; Dunn, I. F. Absence of Survival Improvement for Patients with Esthesioneuroblastoma Over the Past 2 Decades: A Population-Based Study. World Neurosurg. 2022, vol. 157, e245–e253. [Google Scholar] [CrossRef]
- Skolnik, E. M.; Massari, F. S.; Tenta, L. T. Olfactory Neuroepithelioma: Review of the World Literature and Presentation of Two Cases. Arch. Otolaryngol.-Head Neck Surg. 1966, vol. 84(no. 6), 644–653. [Google Scholar] [CrossRef]
- Morita; Ebersold, M. J.; Olsen, K. D.; Foote, R. L.; Lewis, J. E.; Quast, L. M. Esthesioneuroblastoma: Prognosis and Management. Neurosurgery 1993, vol. 32(no. 5), 706. [Google Scholar]
- Tajudeen, A.; Arshi, A.; Suh, J. D.; St John, M.; Wang, M. B. Importance of Tumor Grade in Esthesioneuroblastoma Survival: A Population-Based Analysis. JAMA Otolaryngol. Head Neck Surg. 2014, vol. 140(no. 12), 1124–1129. [Google Scholar] [CrossRef]
- Elkon; Hightower, S. I.; Lim, M. L.; Cantrell, R. W.; Constable, W. C. Esthesioneuroblastoma. Cancer 1979, vol. 44(no. 3), 1087–1094. [Google Scholar] [CrossRef]
- Zeng, Q.; et al. , Long-Term Survival Outcomes and Treatment Experience of 64 Patients With Esthesioneuroblastoma. Front. Oncol. 2021, vol. 11. [Google Scholar] [CrossRef]
- Eden, B. V.; et al. Esthesioneuroblastoma. Long term outcome and patterns of failure—the University of Virginia experience. Cancer 1994, vol. 73(no. 10), 2556–2562. [Google Scholar] [CrossRef]
- Sharma, R. K.; Irace, A. L.; Overdevest, J. B.; Turner, J. H.; Patel, Z. M.; Gudis, D. A. Association of Race, Ethnicity, and Socioeconomic Status With Esthesioneuroblastoma Presentation, Treatment, and Survival. OTO Open 2022, vol. 6(no. 1), 2473974X221075210. [Google Scholar] [CrossRef]
- Tosoni, et al. Olfactory neuroblastoma: diagnosis, management, and current treatment options. Front Oncol. 2023, vol. 13, 1242453. [Google Scholar] [CrossRef]
- Wang, C.-C.; Chen, Y.-L.; Hsu, Y.-S.; Jung, S.-M.; Hao, S.-P. Transcranial Resection of Olfactory Neuroblastoma. Skull Base 2005, vol. 15(no. 3), 163–171. [Google Scholar] [CrossRef]
Figure 1.
941 ENB patients. Of these patients most were male, white, over the age of 50, and received CT > STR > RT = GTR.
Figure 1.
941 ENB patients. Of these patients most were male, white, over the age of 50, and received CT > STR > RT = GTR.
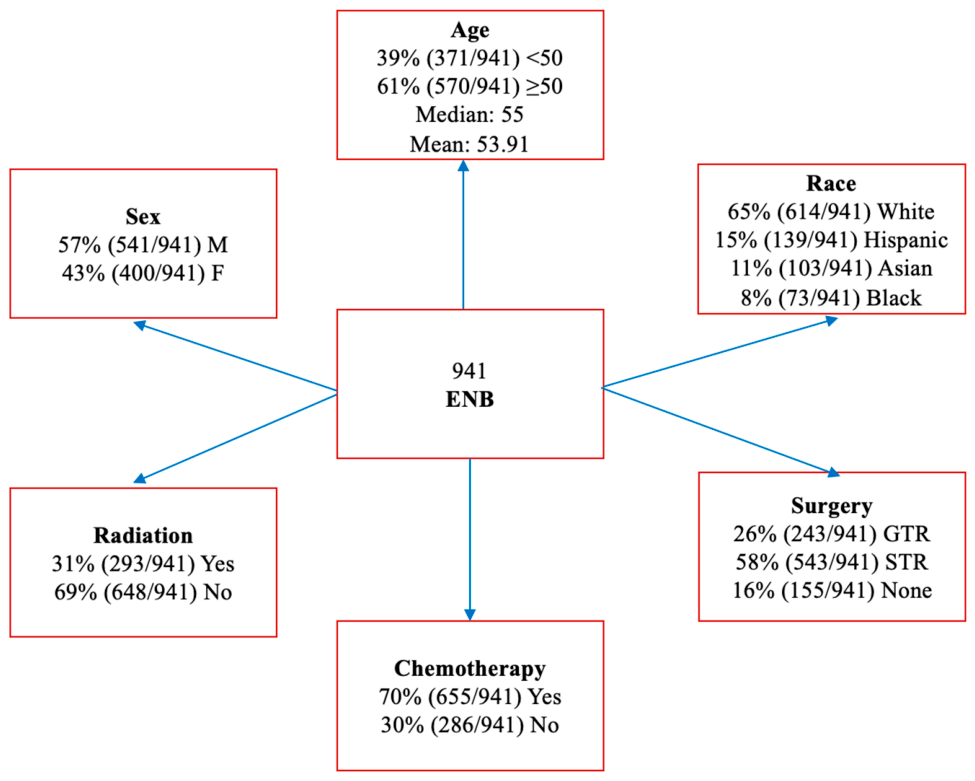
Figure 2.
Forest plot of multivariable Cox proportional hazard ratio for patient sex, patient age, tumor size, and treatment. CT – chemotherapy, RT – radiation therapy, GTR – gross total resection, STR – subtotal resection.
Figure 2.
Forest plot of multivariable Cox proportional hazard ratio for patient sex, patient age, tumor size, and treatment. CT – chemotherapy, RT – radiation therapy, GTR – gross total resection, STR – subtotal resection.
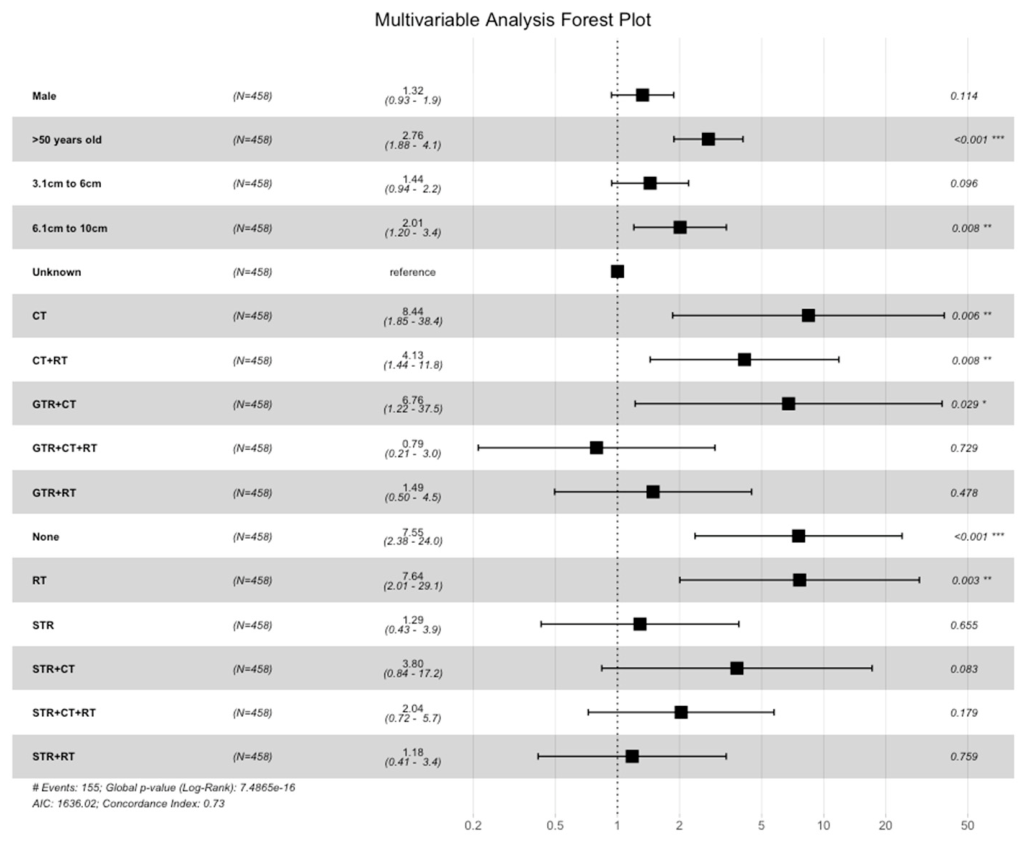
Figure 3.
(A) Kaplan-Meier survival curve for total population of patients with ENB. (B) Kaplan-Meier survival curves categorized by patient sex. (C) Kaplan-Meier survival curves categorized by patient age. (D) Kaplan-Meier survival curves categorized by tumor size.
Figure 3.
(A) Kaplan-Meier survival curve for total population of patients with ENB. (B) Kaplan-Meier survival curves categorized by patient sex. (C) Kaplan-Meier survival curves categorized by patient age. (D) Kaplan-Meier survival curves categorized by tumor size.
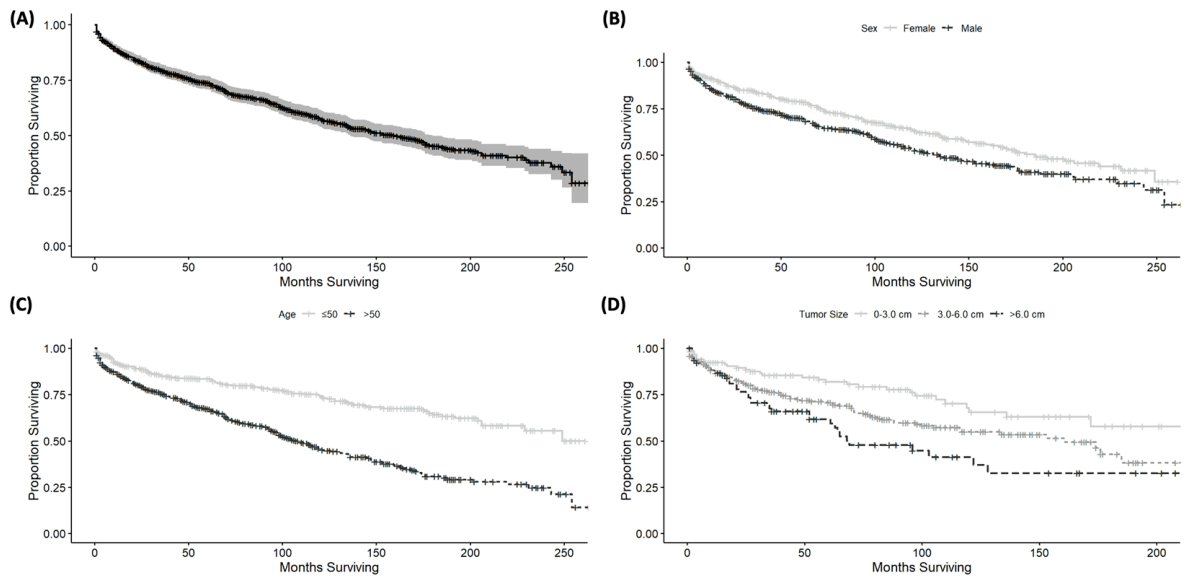
Figure 4.
(A) Kaplan-Meier survival curves categorized by surgical treatment. (B) Kaplan-Meier survival curves categorized by radiation treatment. (C) Kaplan-Meier survival curves categorized by chemotherapy treatment.
Figure 4.
(A) Kaplan-Meier survival curves categorized by surgical treatment. (B) Kaplan-Meier survival curves categorized by radiation treatment. (C) Kaplan-Meier survival curves categorized by chemotherapy treatment.
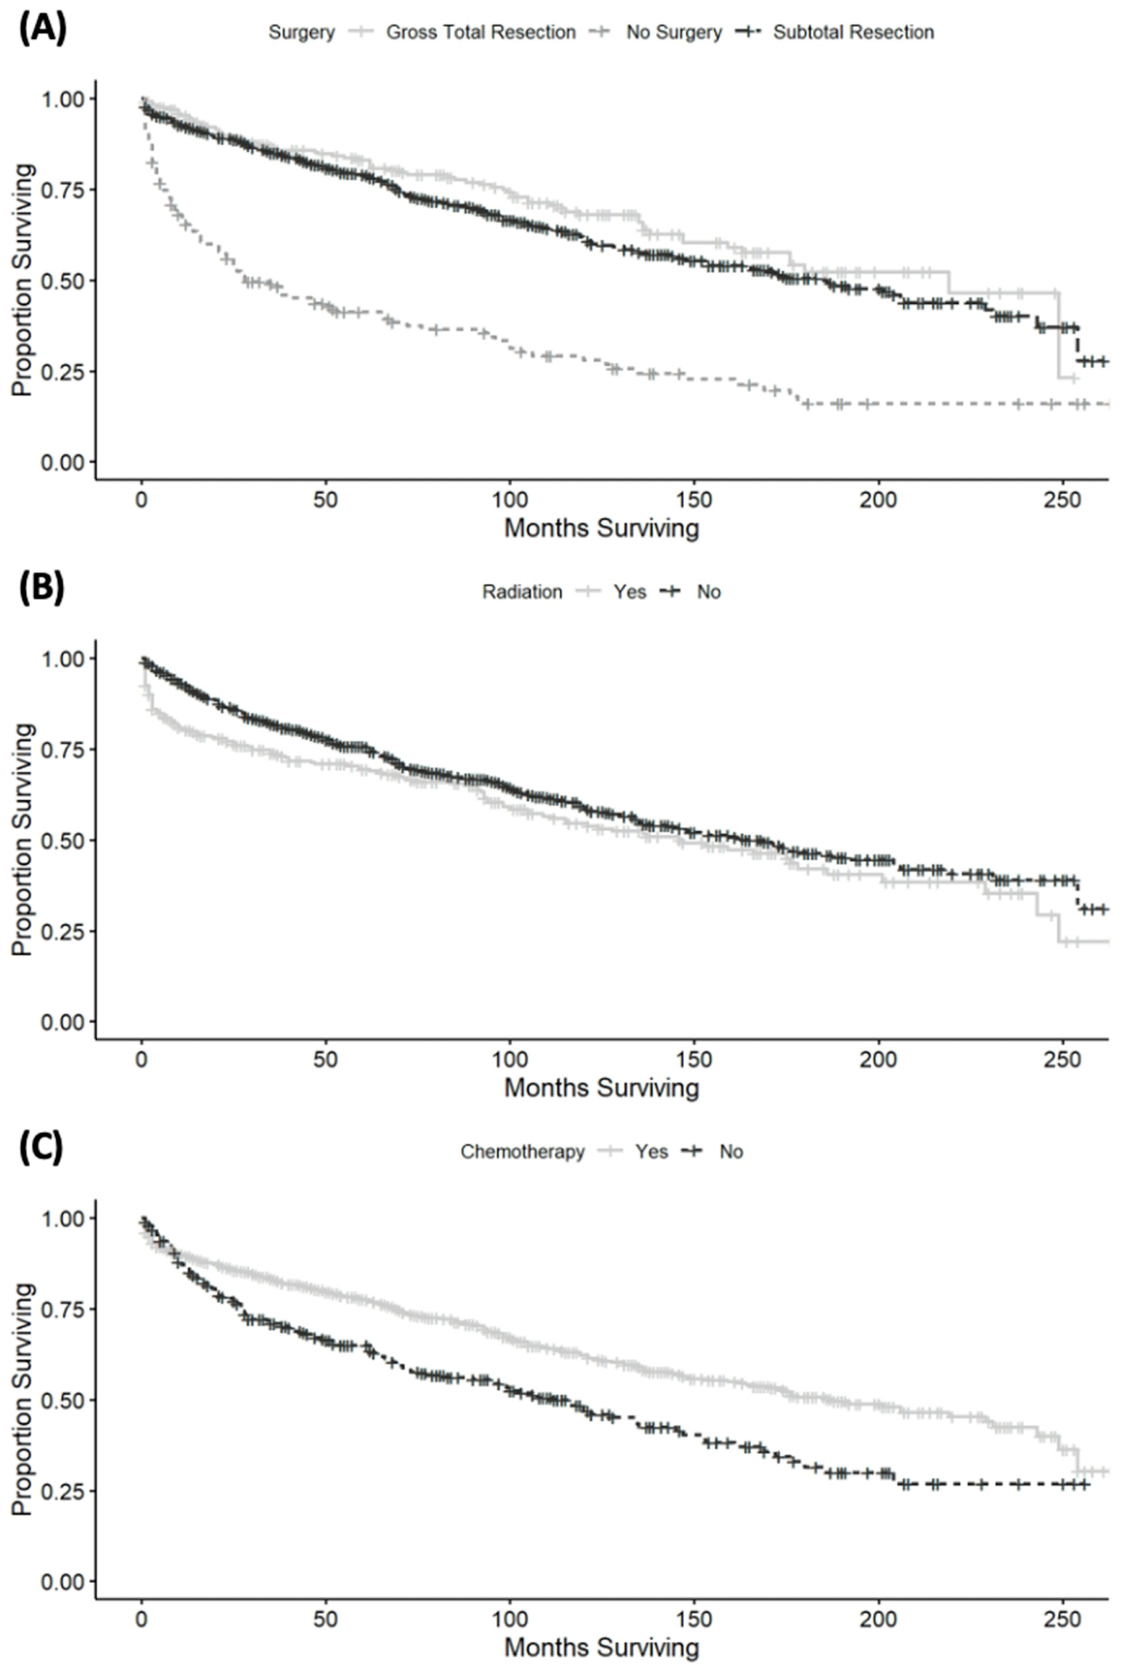
Figure 5.
Nomogram demonstrating median survival time as well as 5- and 10-year survival probability based on sex, age, tumor location, tumor size and treatment summary.
Figure 5.
Nomogram demonstrating median survival time as well as 5- and 10-year survival probability based on sex, age, tumor location, tumor size and treatment summary.
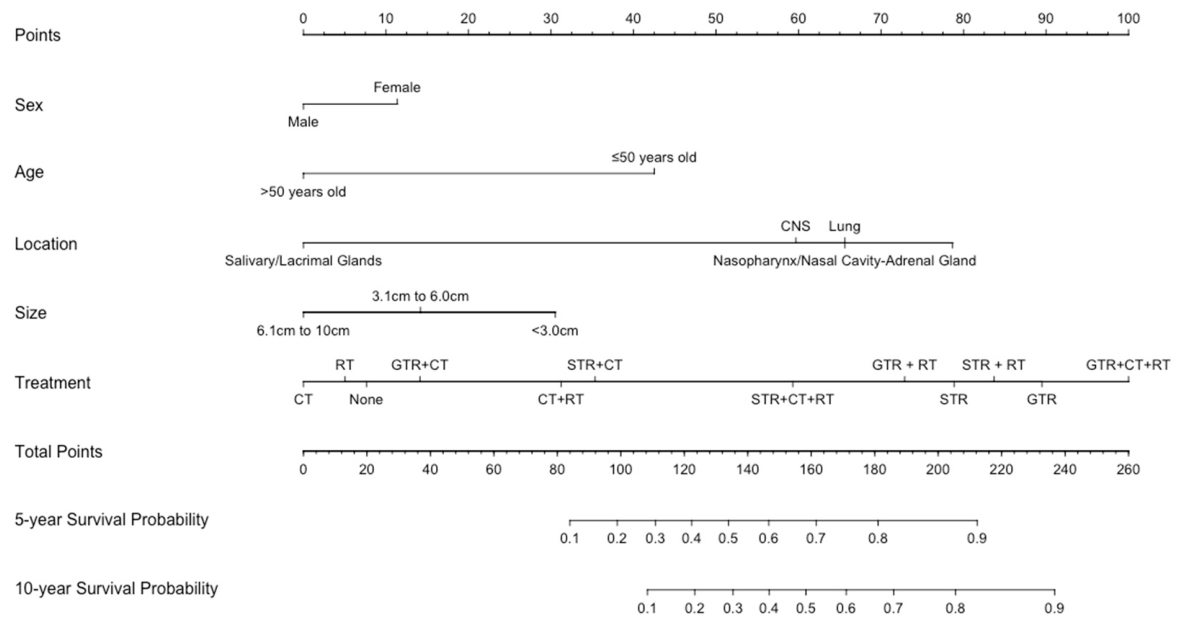
Figure 6.
ENB predictive nomogram (A) calibration plot and (B) a receiver operator curve (ROC) plot with area under the curve of 0.747 and C-index of 0.733±0.041.
Figure 6.
ENB predictive nomogram (A) calibration plot and (B) a receiver operator curve (ROC) plot with area under the curve of 0.747 and C-index of 0.733±0.041.
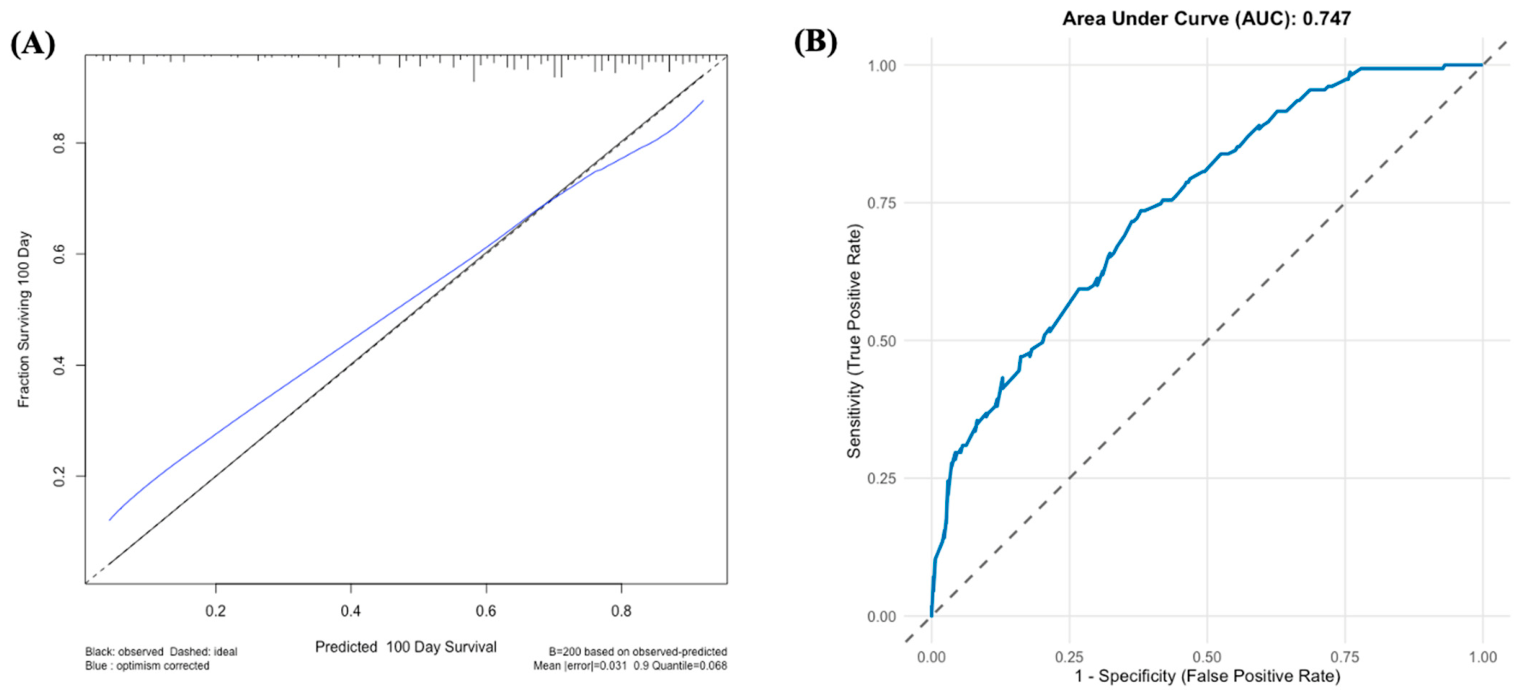

Table 1.
Overall Survival.
| Time | Survival |
| 1-year | 89.6% |
| 2-year | 84.7% |
| 3-year | 80.3% |
| 5-year | 74.7% |
| 10-year | 58.2% |
| Median | 13.6 years (95% CI 11.5-15.5 years) |
| Mean | 12.83 years |
Table 2.
Univariate analysis of overall survival.
| Category | Subcategory | Patients (n=941) | Events (n=365) | HR | [95% CI] | P |
| Sex | Female | 400 | 141 | reference | 0.004 | |
| Male | 541 | 224 | 1.36 | [1.10-1.68] | *** | |
| Age | 0-50 | 371 | 97 | reference | 5.00E-16 | |
| 50-100 | 570 | 268 | 2.5 | [1.98-3.16] | *** | |
| Race | White | 614 | 242 | reference | 0.5 | |
| Hispanic | 139 | 47 | 0.88 | [0.65-1.21] | ||
| AI/AN | 5 | 2 | 0.89 | [0.22-3.60] | ||
| API | 103 | 40 | 0.99 | [0.71-1.40] | ||
| Black | 73 | 34 | 1.35 | [0.94-1.94] | ||
| Year of Diagnosis | 2000-2010 | 437 | 237 | reference | 0.9 | |
| 2010-2020 | 504 | 128 | 0.98 | [0.78-1.24] | ||
| Tumor Size (cm) | <3 | 120 | 29 | reference | 0.001 | |
| 3.0-6.0 | 260 | 90 | 1.65 | [1.08-2.51] | * | |
| >6.0 | 78 | 36 | 2.47 | [1.51-4.03] | *** | |
| Unknown | 483 | NA | NA | NA | ||
| Tumor Location | Nasopharynx & Nasal Cavity | 767 | 301 | reference | 0.004 | |
| Adrenal Gland | 1 | 1 | 70.6 | [9.28-536] | *** | |
| Central Nervous System | 14 | 5 | 0.95 | [0.39-2.31] | ||
| Lung | 1 | 1 | 5.65 | [0.79-40.4] | ||
| Paranasal Sinus | 156 | 55 | 0.69 | [0.51-0.92] | * | |
| Salivary & Lacrimal Glands | 2 | 2 | 2.97 | [0.73-11.9] | ||
| Treatment Summary | GTR | 59 | 14 | reference | 2.00E-16 | |
| CT | 10 | 8 | 10.7 | [4.49-25.7] | *** | |
| CT + RT | 63 | 45 | 4.33 | [2.38-7.90] | *** | |
| GTR + CT | 4 | 3 | 6.76 | [1.94-23.6] | ** | |
| GTR + CT + RT | 57 | 19 | 1.61 | [0.81-3.22] | ||
| GTR + RT | 123 | 35 | 1.23 | [0.67-2.30] | ||
| None/Unknown/ Other/Refused | 65 | 39 | 4.49 | [2.43-8.28] | *** | |
| RT | 17 | 13 | 7.51 | [3.52-16.0] | *** | |
| STR | 142 | 49 | 1.59 | [0.87-2.87] | ||
| STR + CT | 13 | 8 | 4.47 | [1.87-10.7] | *** | |
| STR + CT + RT | 139 | 56 | 2.05 | [1.14-3.68] | * | |
| STR + RT | 249 | 76 | 1.23 | [0.70-2.18] | ||
| *** = p<0.001; ** = p<0.01; * = p<0.05 | ||||||
Disclaimer/Publisher’s Note: The statements, opinions and data contained in all publications are solely those of the individual author(s) and contributor(s) and not of MDPI and/or the editor(s). MDPI and/or the editor(s) disclaim responsibility for any injury to people or property resulting from any ideas, methods, instructions or products referred to in the content. |
© 2026 by the authors. Licensee MDPI, Basel, Switzerland. This article is an open access article distributed under the terms and conditions of the Creative Commons Attribution (CC BY) license.
Copyright: This open access article is published under a Creative Commons CC BY 4.0 license, which permit the free download, distribution, and reuse, provided that the author and preprint are cited in any reuse.