
Submitted:
27 August 2026
Posted:
28 August 2026
You are already at the latest version
Abstract
Assessing scale mismatch, visual obstruction, and circulation conflict from two-dimensional drawings remains difficult in public art design. Finally, a VR simulation framework is developed, which integrates real scale calibration, space drawing, synchronous behavior trajectory, and dynamic scene analysis. Continuous interaction records were converted into behavioral, semantic, and pedestrian envelope. In a 10-week controlled trial, 180 students were enrolled in the study, with class level stratification, standardized familiarisation, matching tasks, and blind scores. About 4.3 million interaction records supported comparisons with single-view, multi-view, and distance-aware baselines. The proposed approach achieves 4.4% visual area error, 0.903 occlusion-recognition F1, and 0.872 passage-collision F1, and 28.6 ms for each key point. Ablative analysis has demonstrated the contribution of trajectory correction, adaptive weighting, semantic occlusion, and passage-envelope modeling. Compared with the conventional design, the VR group had lower elevation, better visual field visibility, fewer circulation conflicts, and higher site suitability scores, while the viewpoint coverage mediated 26.1% of the overall effect.
Keywords:
virtual reality
; VR graffiti
; multi-viewpoint field of view
; site adaptability
; spatial trajectory analysis
CCS CONCEPTS: Human-centered computing → Human computer interaction (HCI) → Interaction paradigms → Virtual reality
1. Introduction
Recent VR research has advanced immersive visualization, spatial perception, and design evaluation, but computational assumptions remain fragmented across application domains. Crolla et al. [1] developed an immersive Grasshopper interface for parametric workspaces, while Yildirim et al. [2] and Tural et al. [3] The multi-sensory response and the space observed in the eye were studied. Hameed et al. [4] organized interaction, visual, and perceptual quality factors; Westermeier et al. [5] compared distance judgment in VR and video transparent AR. Conrad et al. [6] emphasized cognitive load, Cho et al. [7] Architectural spatial capacity was assessed and observational models were described in the field of view use [8]. However, these studies do not jointly solve the problem of surface visibility, semantic occlusion, pedestrian interference, and proposal level suitability from continuous trajectories. In order to overcome this problem, the proposed framework uses event-aware trajectory correction, a behavior-conditioned visibility kernel that incorporates the distance, surface normal, and dwell time, semantic profile rays, and a dynamic human passage envelope. A generalized additive mixture model, which converts the records of 180 students, 540 proposals, and 4.3 million events into interpretable spatial evidence for public art evaluation.
2. Development of a VR Graffiti Simulation System
2.1. 3D Modeling and Scale Calibration of the Site
Using laser point clouds, panoramic images, and field measurements, the campus entrance, business square, and community public spaces are reconstructed, retaining elements that affect spatial judgement — for example, the boundaries, the roads, the greenery, the facilities, and the elevation differences. After mesh simplification, the number of triangles per scene was limited to within 1.5 million, and the model was annotated with accessible areas, obstructions, and artwork placement zones.The transformation from VR coordinates to real-world site coordinates is expressed as:
2.2. VR Sketching Interaction and Data Collection
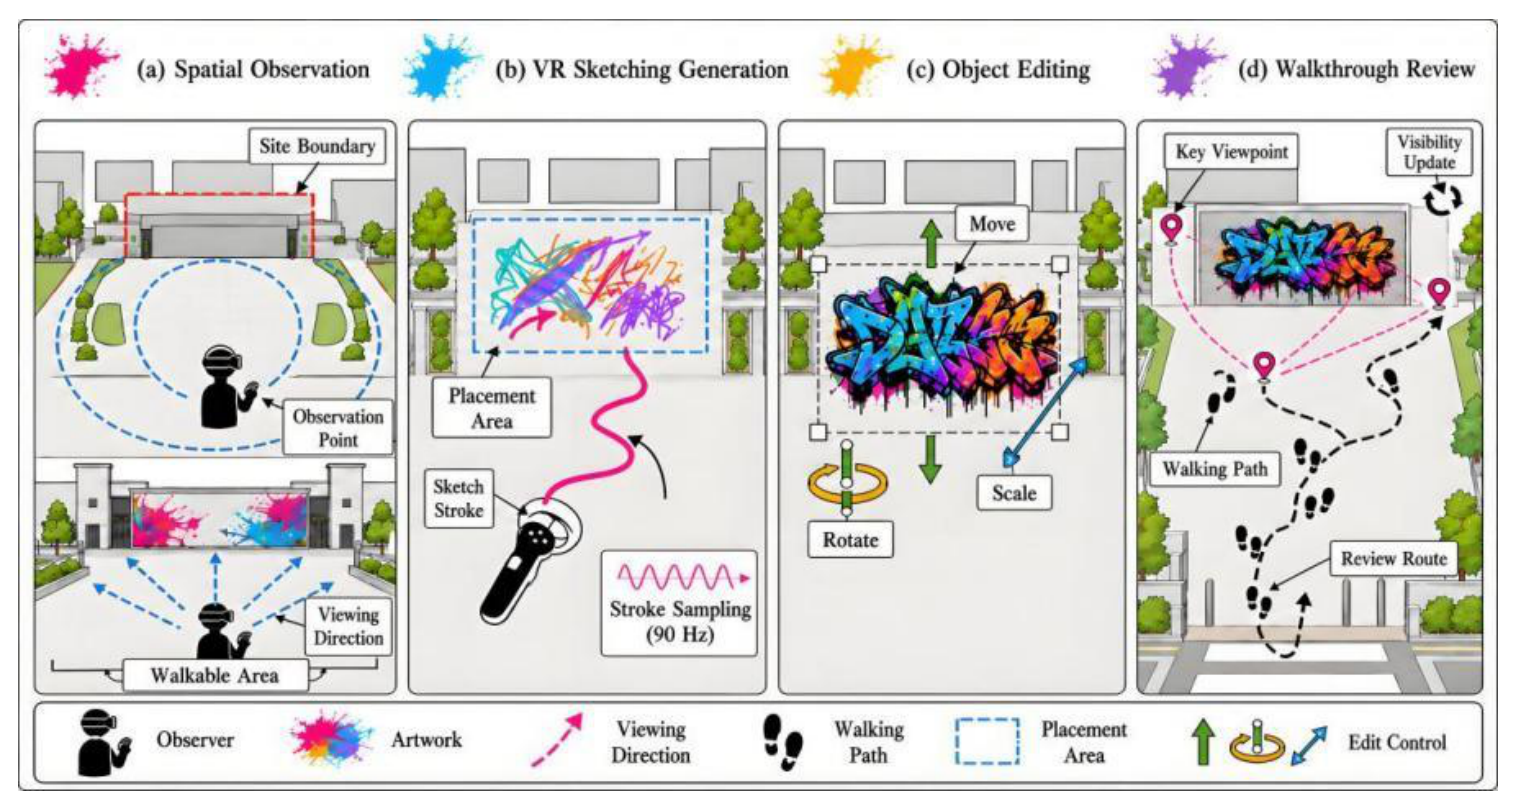
"Site Observation — Spatial Sketching — Object Editing — Walking Verification — Data Writing." Using a VR controller, the students create spatial strokes and volumes; the tip of the pen is sampled at 90 Hz, the curve interpolation is carried out at a distance of more than 5 mm, and the stroke radius is adjusted dynamically according to the moving speed. The work supports three-axis movement, rotation, and continuous scaling; interaction events are uniformly represented as:
Figure 1.
The process of scheme generation and spatial verification during VRVR doodling rehearsals.
Figure 1.
The process of scheme generation and spatial verification during VRVR doodling rehearsals.
2.3. Trajectory Cleaning and Spatial Synchronization
Headset and controller tracks are prone to occlusion, re-localization, and hand vibration, which leads to short time frames, space jumps, and high frequency oscillations [10]. The system uses an 11-frame sliding window to calculate the local median and absolute median difference to robustly identify anomalous trajectories:
In order to prevent the filter from masking the actual editing behavior, when zooming, rotating, or fast motion events are detected, the smoothing strength is decreased, and the jitter suppression is increased during the static observation phase [9]. Data from different devices is uniformly resampled to 50 Hz, and the headset orientation is synchronized with quaternion interpolation. Finally, the view path, the action of the controller, and the working condition are mapped to a uniform location coordinate system.
3. Optimization of the Venue Adaptation Evaluation Algorithm
3.1. Multi-Viewpoint Field-of-View Calculation
On the basis of the synchronized view sequences, the system extracts key views on the basis of a turning angle larger than 25 °, a dwell time greater than 0.8 s, or an abrupt variation in the viewing distance of more than 0.6 m, and divides the work of art mesh into triangular surfaces. A 90 ° viewing cone is constructed for each key point of view, with a GPU depth buffer to determine if the center of the face is obscured by buildings, greenery, facilities, or artwork.
As shown in Figure 2, the far, middle, and near views form an observation circle with a different radius. Instead of just adding the visible areas with equal weights, the algorithm introduces distance, line of sight angle, and dwell time to perform dynamic weighting:
3.2. Contour Occlusion and Path Conflict Detection
Contour Occlusion Detection uses key points of view as input, projects the external outline of the artwork into the field of vision, and emits rays from a sampling point along the profile to determine if the first cross is a building, a tree, a facility, or a part of an art work.The conflict detection creates a 0.75 m wide human pass envelope in the site's accessible area, adds a 0.25m security margin, and performs 3D cross check between the boundary box of the artwork and the passage envelope.The comprehensive conflict index is expressed as:
3.3. Modeling Viewpoint Coverage Features
Viewpoint coverage modeling builds upon the results of multiple viewpoint fields of view and collision detection. Key points are constructed as nodes in space, and neighboring observations are represented as directed edges. Then, they are coded into three distance zones: Far, Middle, and Near [10] .System divides the Web into 0.5 × 0.5 m grids, keeping only the available grid cells that can be used to form effective observations. If the view inside the grid satisfies the criteria for visibility ratio above 0.35, the dwell time is greater than 0.8 s, and the occlusion rate is less than 0.45, it is marked as an effective cover unit. The viewpoint coverage feature is represented as:
4. Experimental Results and Analysis
4.1. Experimental Design and Evaluation Metrics
In a 10-week cluster-assigned study, 180 undergraduates were nested in 10 design classes, and the treatment was based on class rather than individual observations. Five classes entered each condition, containing 16 – 20 students. Baseline age, gender distribution, design experience, spatial capacity, and previous VR exposure were comparable, with a standard difference of less than 0.10; the ICC for adaptation score was 0.067. Both groups received identical briefs, teaching time, deadlines, instructor access, and balanced task orders. Participants generated 540 proposals, 3 240 images, 1 620 walkthroughs, and approximately 4.3 million events. 108/36/36 and 432/144/144/144 sets were assigned to training, validation and testing. Visibility, occlusion, and conflict were marked by three annotators, and a uniform score (ICC = 0.84) was used by five blinded teachers. Attendance exceeded 94%, with no attrition. Six incomplete and nine damaged trajectory segments were excluded from the algorithm only; all participants and suggestions remained in the treatment analysis. Device settings, scene geometry, hardware, timing, and feedback were standardized.
4.2. Performance of the Site-Adaptive Algorithm
Four algorithmic families were evaluated using identical meshes, viewpoints, and hardware: fixed-viewpoint ray tracing, equal-weight multiview fusion, distance-weighted fusion based on VR depth research [5], and the proposed behavior-conditioned method. Manual annotations provided common ground truth, while visible-area MAE, occlusion and conflict F1, and per-viewpoint latency supported Table 1 comparison.
Table 1 shows that the visual area MAE was reduced from 8.7% to 4.4% and that the occlusion and passage conflict F1 increased to 0.903 and 0.872, respectively. The processing delay was 28.6 ms, but it was still within the 50 Hz budget thanks to asynchronous GPU rendering. The complexity was O (N) for the cleaning of the trajectory, O (MF) for the visual rasterization, the index ray occlusion of O (MQ log F), and the GMM fitting O (NKI). Viewpoint count and mesh resolution dominated scalability. Larger scenes used tiling, viewpoint batching, level-of-detail meshes, and cached depth maps. Robustness testing ranged from 80% to 120% for α, β, and γ, followed by module ablation; these comparisons are summarized in Table 2.
Table 2 shows that the model remained stable when each weighting parameter varied from 80% to 120% of its cross-validated value. Visible-area MAE ranged from 4.6% to 5.0%, while occlusion and passage-conflict F1 remained above 0.890 and 0.863. The distance-decay coefficient β produced the largest visibility variation by altering remote-viewpoint contributions. The angular coefficient γ mainly influenced oblique-surface occlusion recognition, whereas dwell-time coefficient α caused limited degradation. The cross-validated setting achieved the best scores, and no perturbation changed the relative performance ranking, confirming overall local robustness within the tested interval.
4.3. Spatial Scale and Site Adaptation Performance
Scale deviation, visibility, silhouette occlusion, passage conflicts, and adaptation scores were summarized as mean±SD by site and condition. Treatment effects were estimated using three-level mixed-effects models, with repeated site observations nested within students and students nested within classes. Models included condition, site, their interaction, baseline spatial ability, and prior VR exposure as fixed effects, with class and student random intercepts and Kenward–Roger small-sample inference (Table 3).

Table 3.
(a): Descriptive and Cluster-Adjusted Adaptation Performance Across Site Types.
| Site Type | Group | Height Deviation/% Mean±SD | Primary-View Visibility/% Mean±SD | Outline Occlusion/% Mean±SD | Traffic Conflicts Mean±SD | Adaptation Score Mean±SD |
|---|---|---|---|---|---|---|
| Campus Entrance | Traditional Group | 12.4±5.2 | 78.6±8.7 | 18.7±7.0 | 1.42±0.96 | 76.8±7.3 |
| Campus Entrance | VR Group | 8.3±4.1 | 86.9±7.2 | 12.9±5.8 | 0.83±0.72 | 84.1±6.5 |
| Commercial Plaza | Traditional Group | 14.8±5.8 | 72.5±9.6 | 23.6±8.2 | 2.17±1.14 | 72.9±7.8 |
| Commercial Plaza | VR Group | 9.6±4.6 | 82.8±8.1 | 16.1±6.7 | 1.28±0.88 | 81.0±6.9 |
| Community Public Spaces | Traditional Group | 13.1±5.4 | 75.9±9.1 | 21.4±7.5 | 1.86±1.06 | 74.6±7.5 |
| Community Public Spaces | VR Group | 8.9±4.3 | 84.0±7.6 | 14.8±6.2 | 1.07±0.81 | 82.2±6.7 |
Table 3.
(b): Cluster-adjusted VR treatment estimates.
| Outcome | Adjusted Difference, VR−Traditional | 95% CI | Standardized Effect | p-value |
|---|---|---|---|---|
| Height Deviation Rate | −4.50 | −5.62 to −3.38 | −0.89 | 0.002 |
| Primary-Viewpoint Visibility | 8.9 | 6.75 to 11.05 | 0.93 | 0.001 |
| Outline Occlusion Rate | −6.63 | −8.40 to −4.86 | −0.86 | 0.002 |
| Traffic Conflict Count | −0.76 | −1.01 to −0.51 | −0.78 | 0.003 |
| Adaptation Score | 7.58 | 3.12 to 12.04 | 0.81 | 0.006 |
Table 3 shows that, after adjustment for clustering of multiple measures, the VR condition retained a significant benefit. The difference in height was 4.50% (95% CI -5.62 to -3.38; p = 0.002), the primary field of vision was increased by 8.90 (95% CI: 6.75-11.05; p = 0.001), ocular occlusion decreased by 6.63 points (95% CI -8.40 to -4.86; p = 0.002), and the incidence of vision decreased by 0.76 (95% confidence interval -1.01 to -0.51; p = 0.003). The adjustment score was 7.58 (95% confidence interval 3.12 - 12.04; p = 0.006). Figure 3 shows a tendency to reduce bias, occlusions, conflicts, and visibility, although the distribution is overlapping for the large shopping plaza facilities. Local interaction was generally insignificant except for a reduction in incidence (p = 0.041). The ICCs for class and student were 0.067 and 0.214, which supported the maintenance of the random-effect and did not treat 540 suggestions as individual observations. These findings demonstrate an overall VR advantage across sites while recognizing variation among classes, participants, installation scales, and spatial settings.
A generalized additive mixed model further showed that viewpoint coverage positively predicted adaptation scores, while observation distance exhibited a significant nonlinear effect (edf=3.18, F=16.7). Class-stratified bootstrap analysis with 5,000 repetitions identified an indirect effect of 2.05 points (95% CI 1.31–2.92), accounting for 26.1% of the total VR effect. The remaining direct effect was 5.79 points, indicating that scale adjustment and passage-conflict resolution also contributed independently to improved site suitability.
5. Conclusions
The framework converts calibrated VR behavior into evidence through event-aware synchronization, behavior-conditioned visibility, semantic occlusion, passage-envelope modeling, and nonlinear suitability analysis. It achieved 4.4% visible-area MAE, 0.903 occlusion F1, and 0.872 passage-conflict F1 at 28.6 ms per viewpoint. Cross-validation, perturbation, and ablation confirmed robustness and module contributions. The VR group showed lower scale deviation, higher visibility, fewer conflicts, and higher suitability scores, with viewpoint coverage mediating 26.1% of the effect. Future work should examine crowds, eye tracking, and topology encoding.
References
- Crolla, K.; Sheikh, T. A. Grasshopper VR: development of an immersive visualization interface for parametric design workspaces [J]. Virtual Real. 2025, 29(3), 133–133. [Google Scholar] [CrossRef]
- Yildirim, M.; Globa, A.; Gocer, O.; et al. Digital smell technologies for the built environment: Evaluating human responses to multisensory stimuli in immersive virtual reality [J]. Build. Environ. 2025, 271112608–112608. [Google Scholar] [CrossRef]
- Tural, A.; Tural, E. Exploring the sense of spaciousness in interior settings: Screen-based assessments with eye tracking and virtual reality evaluations [J]. Front. Psychol. 2024, 15, 1473520–1473520. [Google Scholar] [CrossRef]
- Hameed, A.; Möller, S.; Perkis, A. A holistic quality taxonomy for virtual reality experiences [J]. Front. Virtual Real. 2024, 5, 1434016–1434016. [Google Scholar] [CrossRef]
- Westermeier, F.; Brubach, L.; Wienrich, C.; et al. Assessing Depth Perception in VR and Video See-Through AR: A Comparison on Distance Judgment, Performance, and Preference [J]. IEEE Trans. Vis. Comput. Graph. 2024, PPDOI. [Google Scholar] [CrossRef]
- Conrad, M.; Kablitz, D.; Schumann, S. Learning effectiveness of immersive virtual reality in education and training: A systematic review of findings [J]. Comput. Amp Educ. X Real. 2024, 4100053. [Google Scholar] [CrossRef]
- Cho, Y. J.; Suh, J. Spatial Ability Performance in Interior Design and Architecture: Comparison of Static and Virtual Reality Modes [J]. Buildings 2023, 13(12), 3128. [Google Scholar] [CrossRef]
- W, J. K. Distance Perception in Virtual Reality: A Meta-Analysis of the Effect of Head-Mounted Display Characteristics [J]. IEEE Trans. Vis. Comput. Graph. 2023, 29(12), 4978–4989. [Google Scholar] [CrossRef]
- MOHAMED, D.; SHAIMAA, K.; AYMAN, A. Extended Reality for Enhancing Spatial Ability in Architecture Design Education [J]. Ain Shams Eng. J. 2023, 14(6). [Google Scholar] [CrossRef]
- Sahand, A.; Arthur, R. Spatial Perception Imperatives in Virtual Environments: Understanding the Impacts of View Usage Patterns on Spatial Design Decisions in Virtual Reality Systems [J]. Buildings 2023, 13(1), 160–160. [Google Scholar] [CrossRef]
Figure 2.
Schematic diagram of distance-aware multi-viewpoint field-of-view calculation.
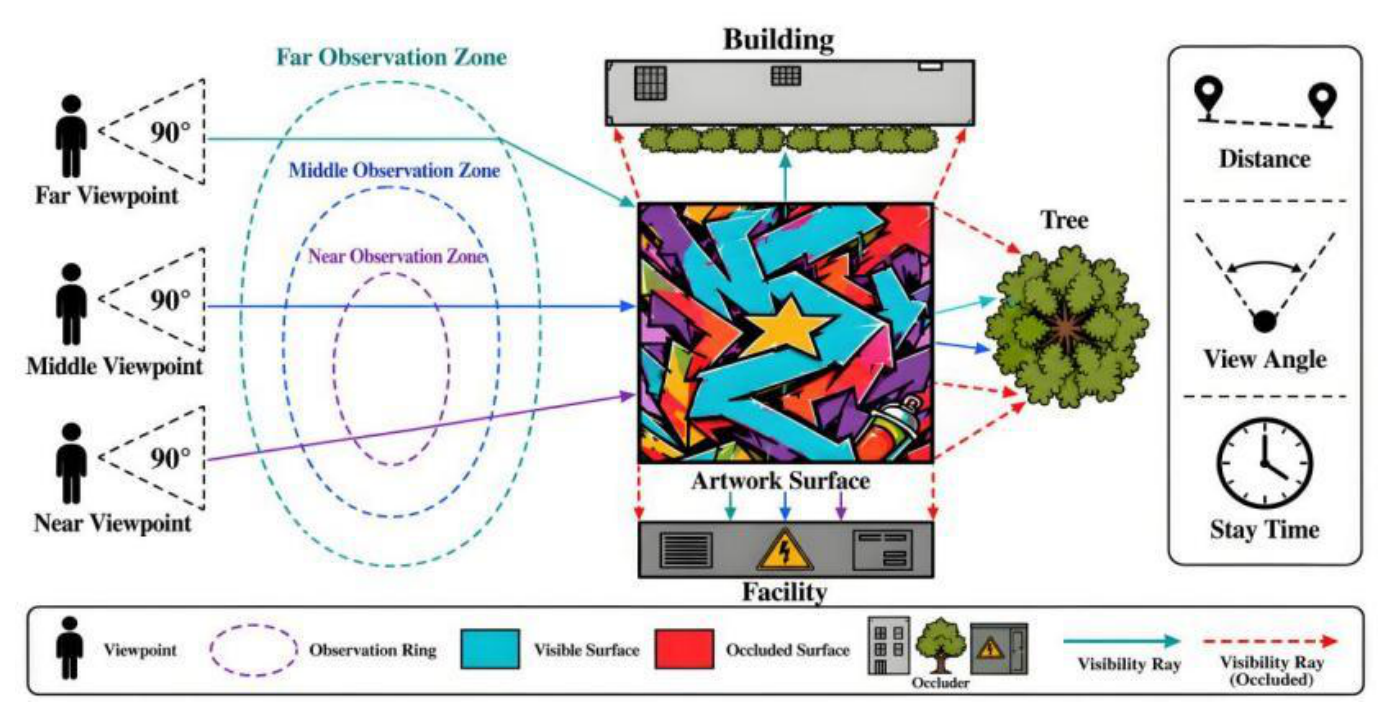
Figure 3.
Joint distribution of spatial adaptation metrics for the VR group and the traditional group.
Figure 3.
Joint distribution of spatial adaptation metrics for the VR group and the traditional group.
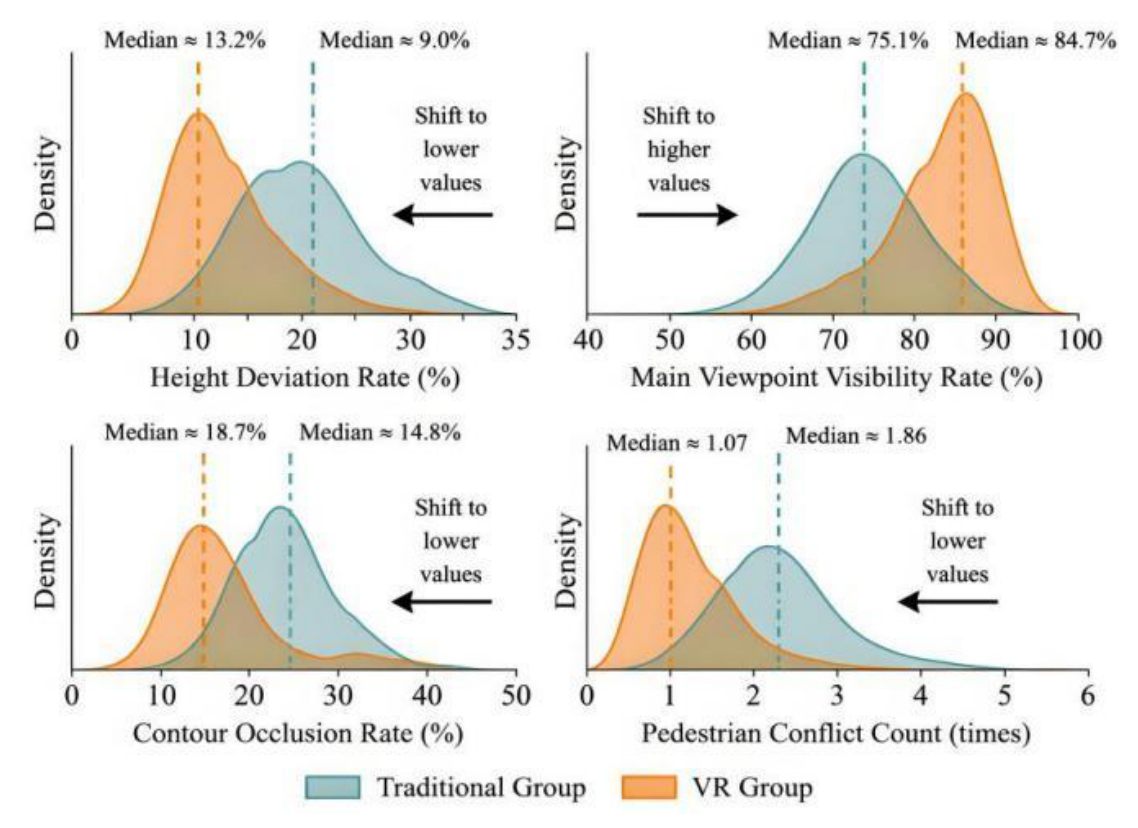
Table 1.
Comparison of Performance Among Different Site-Adaptive Algorithms.
| Method | Visible Area MAE/% | Obstruction Detection F1 | Passage Conflict F1 | Average Processing Latency / ms |
|---|---|---|---|---|
| Single-View Ray Visibility Baseline | 8.7 | 0.824 | 0.788 | 14.6 |
| Scene-Aware Multi-View Baseline | 6.5 | 0.856 | 0.812 | 21.9 |
| Distance-Aware Multi-View Baseline | 5.3 | 0.879 | 0.835 | 24.7 |
| Proposed Fusion | 4.4 | 0.903 | 0.872 | 28.6 |
Table 2.
Parameter Robustness and Ablation Results for the Site-Adaptive Algorithm.
| Model Configuration | Visible Area MAE/% | Occlusion Detection F1 | Passage Conflict F1 | Average Processing Latency / ms |
|---|---|---|---|---|
| Complete Model | 4.4 | 0.903 | 0.872 | 28.6 |
| Remove trajectory correction | 5.2 | 0.887 | 0.852 | 26.1 |
| Remove Distance Weighting | 5 | 0.894 | 0.86 | 27.8 |
| Remove viewpoint–dwell weight | 4.8 | 0.897 | 0.861 | 27.1 |
| Remove Semantic Occlusion | 4.6 | 0.868 | 0.864 | 24.9 |
| Remove Dynamic Passage Envelope | 4.5 | 0.899 | 0.821 | 23.7 |
Disclaimer/Publisher’s Note: The statements, opinions and data contained in all publications are solely those of the individual author(s) and contributor(s) and not of MDPI and/or the editor(s). MDPI and/or the editor(s) disclaim responsibility for any injury to people or property resulting from any ideas, methods, instructions or products referred to in the content. |
© 2026 by the authors. Licensee MDPI, Basel, Switzerland. This article is an open access article distributed under the terms and conditions of the Creative Commons Attribution (CC BY) license (http://creativecommons.org/licenses/by/4.0/).
Copyright: This open access article is published under a Creative Commons CC BY 4.0 license, which permit the free download, distribution, and reuse, provided that the author and preprint are cited in any reuse.